IGMIN: We're glad you're here. Please click "create a new query" if you are a new visitor to our website and need further information from us.
If you are already a member of our network and need to keep track of any developments regarding a question you have already submitted, click "take me to my Query."
Uremic toxins (UTs) are compounds derived from the metabolism of dietary molecules such as tryptophan (Indossyl Sulphate, IS) and phenil-alanine (P-Cresyl Sulphate, PCS), that are normally eliminated by the kidneys of healthy patients. The accumulation of such toxins is an indicator of kidney disease at different degrees of severity, and the toxins can be found as free or protein bound in human biological samples. The toxicity of such compounds causes the loss of several biological functions, and the subjects suffering from such complications will need, more often than not, hemodialysis to properly excrete these toxins. Despite this not being a resolutive, but rather a symptom managing clinical approach, this is the most common course of treatment. Two analytical methods are proposed to quantify both the protein-bound and free forms of IS and PCS (HPLC-UV for the former; LC-MS/MS with ESI negative ionization for the latter), with lower variability and higher robustness than what is currently proposed, allowing for a precise simultaneous determination of the aforementioned UTs.
Uremic toxins (UTs) are compounds that generate from the metabolism of proteins [11The gut microbiome and the kidney. Renu Regunathan-Shenk, ... Dominic S. Raj, in Nutritional Management of Renal Disease (Fourth Edition), 2022.] and are usually, subsequently to kidney filtration, eliminated by the renal apparatus [22Hematologic Complications of Chronic Kidney Disease. Feras F. Karadsheh, Matthew R. Weir, in Chronic Renal Disease, 2015.]. A healthy renal apparatus works as a filtration system, removing excess waste and toxins, as well as fluids. Moreover, kidneys play a key role in the functioning of the human body by regulating blood pressure and calcium levels, which are fundamental factors to both the overall well-being of the patient, as well as that of the specific health of the cardiovascular and of the musculoskeletal systems (Figures 1,2).
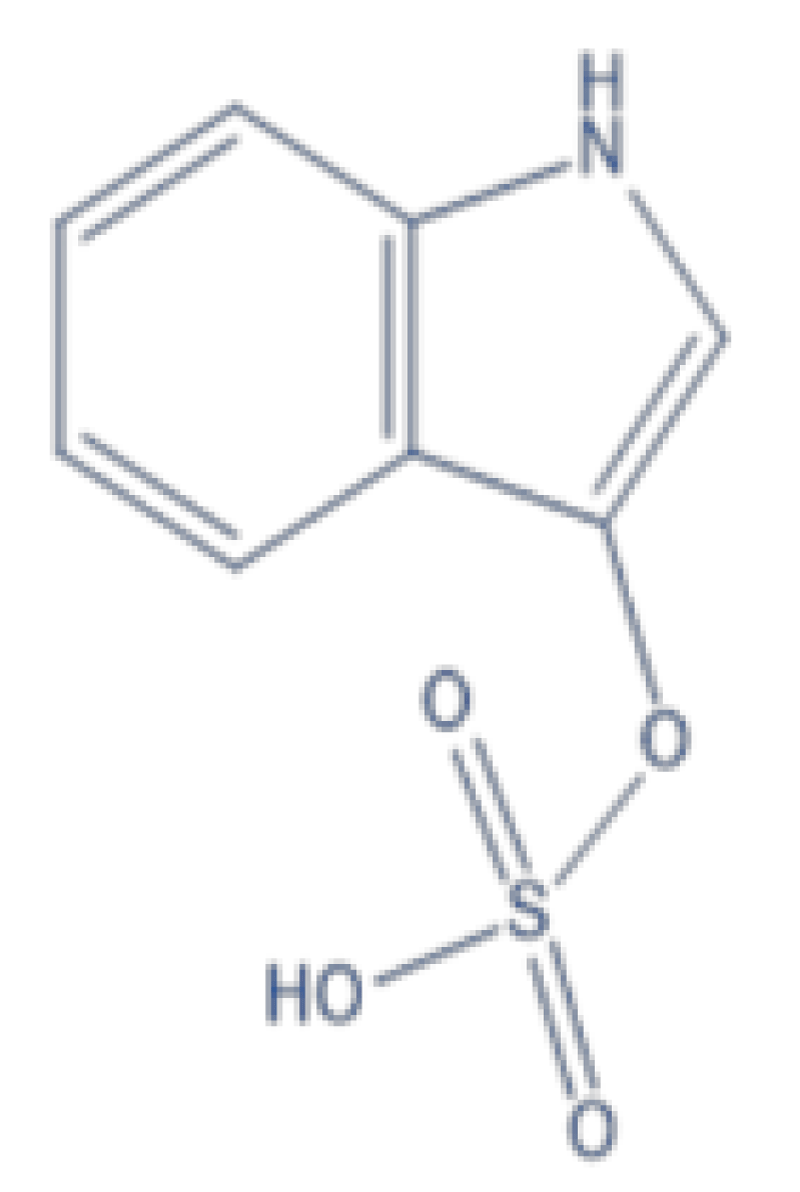
Figure 1: Chemical Structure of Indossyl Sulphate.
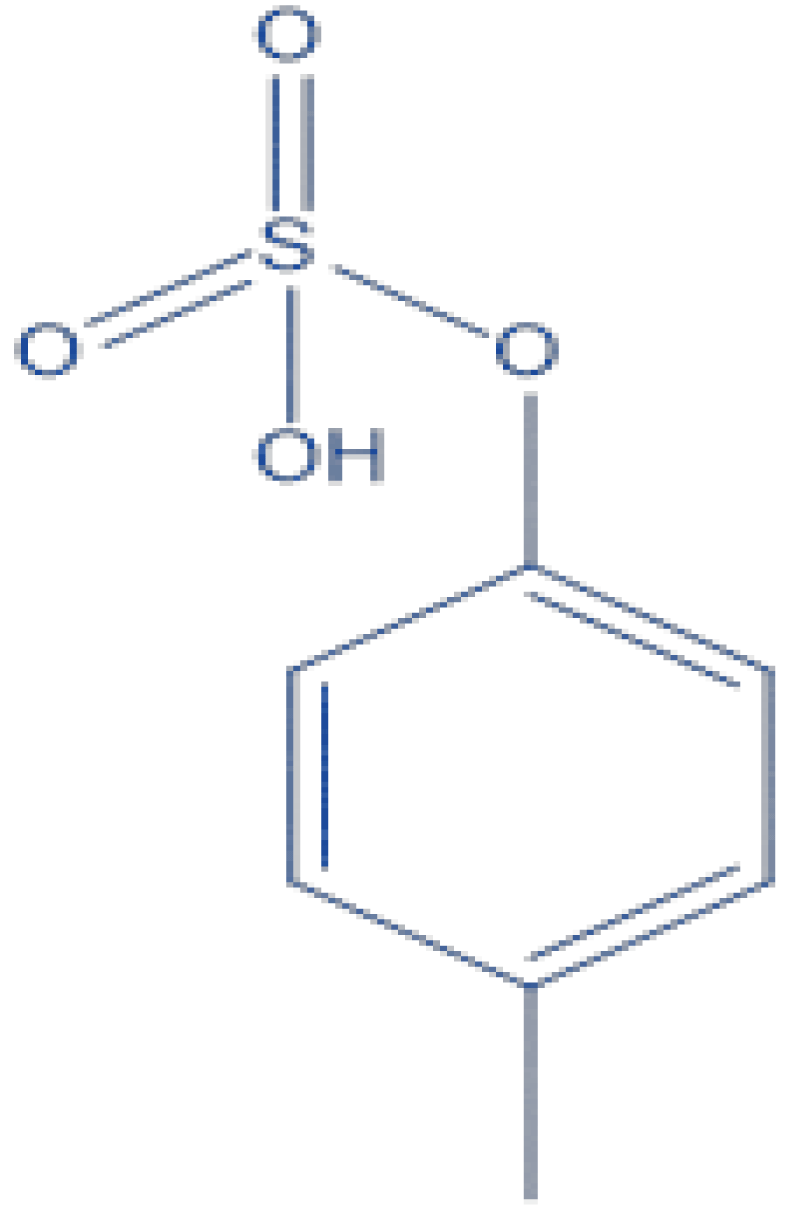
Figure 2: Chemical Structure of P Cresyl Sulphate.
Chronic Kidney Disease (CKD) is defined as a persistent abnormality in kidney structure or function [33Chen TK, Knicely DH, Grams ME. Chronic Kidney Disease Diagnosis and Management: A Review. JAMA. 2019 Oct 1;322(13):1294-1304. doi: 10.1001/jama.2019.14745. PMID: 31573641; PMCID: PMC7015670.], and affects 8% to 16% of the population worldwide. CKD is closely linked to other disorders, such as diabetes and hypertension [44Jha V, Garcia-Garcia G, Iseki K, Li Z, Naicker S, Plattner B, Saran R, Wang AY, Yang CW. Chronic kidney disease: global dimension and perspectives. Lancet. 2013 Jul 20;382(9888):260-72. doi: 10.1016/S0140-6736(13)60687-X. Epub 2013 May 31. Erratum in: Lancet. 2013 Jul 20;382(9888):208. PMID: 23727169.], but environmental factors and active infections could also contribute to enhancing the risk of the disease.
The toxicity of these uremic compounds stems from their accumulation in the organism, causing the loss of several biological functions [55Falconi CA, Junho CVDC, Fogaça-Ruiz F, Vernier ICS, da Cunha RS, Stinghen AEM, Carneiro-Ramos MS. Uremic Toxins: An Alarming Danger Concerning the Cardiovascular System. Front Physiol. 2021 May 14;12:686249. doi: 10.3389/fphys.2021.686249. PMID: 34054588; PMCID: PMC8160254.]. Uremic toxins can be classified following their organic or inorganic nature, as well as their size and degree of hydrophilicity [66Vanholder R., De Smet R., Glorieux G., Argilés A., Baurmeister U., Brunet P., et al. (2003). Review on uremic toxins: classification, concentration, and interindividual variability. Kidney Int. 63 1934–1943. 10.1046/j.1523-1755.2003.00924.].
p-Cresyl Sulphate (PCS) (Figure 2) is a toxin deriving from the metabolism of tyrosine and phenylalanine with kidney elimination [77Evenepoel P, Meijers BK, Bammens BR, Verbeke K. Uremic toxins originating from colonic microbial metabolism. Kidney Int Suppl. 2009 Dec;(114):S12-9. doi: 10.1038/ki.2009.402. PMID: 19946322.], and its accumulation has been linked to the advancing of CKD through inflammation and damaging of tubular cells [88Caldiroli L, Armelloni S, Eskander A, Messa P, Rizzo V, Margiotta E, Cesari M, Vettoretti S. Association between the uremic toxins indoxyl-sulfate and p-cresyl-sulfate with sarcopenia and malnutrition in elderly patients with advanced chronic kidney disease. Exp Gerontol. 2021 May;147:111266. doi: 10.1016/j.exger.2021.111266. Epub 2021 Jan 30. PMID: 33529747.].
Indossyl Sulphate (IS) (Figure 1) is a product of the metabolism of dietary tryptophan. This amminoacid reacts in the intestinal tract and produces indole; the latter is absorbed by the intestine and is converted into IS in the liver [99Barreto FC, Barreto DV, Liabeuf S, Meert N, Glorieux G, Temmar M, Choukroun G, Vanholder R, Massy ZA; European Uremic Toxin Work Group (EUTox). Serum indoxyl sulfate is associated with vascular disease and mortality in chronic kidney disease patients. Clin J Am Soc Nephrol. 2009 Oct;4(10):1551-8. doi: 10.2215/CJN.03980609. Epub 2009 Aug 20. PMID: 19696217; PMCID: PMC2758258.] which cannot be excreted properly by patients affected by CKD and furthers the disease’s progression [1010Niwa T, Ise M. Indoxyl sulfate, a circulating uremic toxin, stimulates the progression of glomerular sclerosis. J Lab Clin Med. 1994 Jul;124(1):96-104. PMID: 8035108.].
Due to the rampant progression of CKD and the surge in risk of developing ESRD [1111Korytowska N, Wyczałkowska-Tomasik A, Pączek L, Giebułtowicz J. Evaluation of Salivary Indoxyl Sulfate with Proteinuria for Predicting Graft Deterioration in Kidney Transplant Recipients. Toxins (Basel). 2021 Aug 16;13(8):571. doi: 10.3390/toxins13080571. PMID: 34437442; PMCID: PMC8402605.] (end stage renal disease), it is of crucial importance to monitor the level of uremic toxins in different biological matrixes, such as blood and urine, using an analytical method that is robust and cost-effective. This is a pivotal aspect of the research, as a patient suffering of CKD or ESRD will need, more often than not, hemodialysis to remove the excess fluid and toxins, whereas the line of treatment for more severe cases would result in a kidney transplant and other comorbidities [1111Korytowska N, Wyczałkowska-Tomasik A, Pączek L, Giebułtowicz J. Evaluation of Salivary Indoxyl Sulfate with Proteinuria for Predicting Graft Deterioration in Kidney Transplant Recipients. Toxins (Basel). 2021 Aug 16;13(8):571. doi: 10.3390/toxins13080571. PMID: 34437442; PMCID: PMC8402605.,1212Fabresse N, Larabi IA, Abe E, Lamy E, Rigothier C, Massy ZA, Alvarez JC. Correlation between Saliva Levels and Serum Levels of Free Uremic Toxins in Healthy Volunteers. Toxins (Basel). 2023 Feb 13;15(2):150. doi: 10.3390/toxins15020150. PMID: 36828466; PMCID: PMC9967652.].
Fabresse, et al. [1212Fabresse N, Larabi IA, Abe E, Lamy E, Rigothier C, Massy ZA, Alvarez JC. Correlation between Saliva Levels and Serum Levels of Free Uremic Toxins in Healthy Volunteers. Toxins (Basel). 2023 Feb 13;15(2):150. doi: 10.3390/toxins15020150. PMID: 36828466; PMCID: PMC9967652.] observed that the saliva concentrations of UTs are comparable to the ones deriving from the serum free fraction, and that for six UTs a significant correlation was observed, though the samples were not obtained by patients with CKD.
Previous studies carried out on serum and plasma samples revealed a varying pCS concentration between 2.8 ± 1.7 mg/L (14.9 ± 9.0 µM) and 6.6 ± 3.7 mg/L (35.1 ± 19.7 µM) [1313Gryp T, Vanholder R, Vaneechoutte M, Glorieux G. p-Cresyl Sulfate. Toxins (Basel). 2017 Jan 29;9(2):52. doi: 10.3390/toxins9020052. PMID: 28146081; PMCID: PMC5331431., 14 14Pretorius CJ, McWhinney BC, Sipinkoski B, Johnson LA, Rossi M, Campbell KL, Ungerer JP. Reference ranges and biological variation of free and total serum indoxyl- and p-cresyl sulphate measured with a rapid UPLC fluorescence detection method. Clin Chim Acta. 2013 Apr 18;419:122-6. doi: 10.1016/j.cca.2013.02.008. Epub 2013 Feb 18. PMID: 23428591., 16 16Boelaert J, Lynen F, Glorieux G, Eloot S, Van Landschoot M, Waterloos MA, Sandra P, Vanholder R. A novel UPLCMS-MS method for simultaneous determination of seven uremic retention toxins with cardiovascular relevance in chronic kidney disease patients. Anal. Bioanal. Chem. 2013, 405, 1937–1947.], which was detected using ultraperformance liquid chromatography and UPLC-mass spectrometry. These values show a high standard deviation and have been obtained by analysing the plasma and serum of healthy patients. On the other hand, the data found in literature referring to pCS detected in plasma/serum of patients in the end stage of kidney disease shows that the toxin is significantly more concentrated in the analysed matrixes, reaching values that span from 21.8 ± 12.4 mg/L (115.8 ± 65.9 µM) [1616Boelaert J, Lynen F, Glorieux G, Eloot S, Van Landschoot M, Waterloos MA, Sandra P, Vanholder R. A novel UPLCMS-MS method for simultaneous determination of seven uremic retention toxins with cardiovascular relevance in chronic kidney disease patients. Anal. Bioanal. Chem. 2013, 405, 1937–1947.] to 106.9 ± 44.6 mg/L (568.0 ± 237.0 µM) [1717Lin CJ, Chen HH, Pan CF, Chuang CK, Wang TJ, Sun FJ, Wu CJ. p-Cresylsulfate and indoxyl sulfate level at different stages of chronic kidney disease. J Clin Lab Anal. 2011;25(3):191-7. doi: 10.1002/jcla.20456. PMID: 21567467; PMCID: PMC6647585.].
In addition, as described by Pretorius C. J. et al. [1414Pretorius CJ, McWhinney BC, Sipinkoski B, Johnson LA, Rossi M, Campbell KL, Ungerer JP. Reference ranges and biological variation of free and total serum indoxyl- and p-cresyl sulphate measured with a rapid UPLC fluorescence detection method. Clin Chim Acta. 2013 Apr 18;419:122-6. doi: 10.1016/j.cca.2013.02.008. Epub 2013 Feb 18. PMID: 23428591.,1515Yousef Selim N, Farag Mannaa H, Atef. Sharaki O, Zaytoun T, Elkholy N, Arafat W. Highlighting Levels of Indoxyl Sulphate among Critically Ill Patients with Acute Nephrotoxicity; Correlations Between Indoxyl Sulphate Levels and Patients' Characteristics. Rep Biochem Mol Biol. 2021 Jul;10(2):266-279. doi: 10.52547/rbmb.10.2.266. PMID: 34604416; PMCID: PMC8480295.], the reference values for total and free Indossyl Sulphate (t IS and f IS, respectively) were obtained by studying serum samples from healthy volunteers using liquid chromatography with fluorescence detection. The reported values are (μmol/L): total IS of 0.7–6.3; free IS of 0.0–0.2.
The analytical method proposed in this paper suggests a strong linearity between the concentration of IS and PCS in non-biological samples diluted with NaCl, detecting both molecules simultaneously using Liquid Chromatography-Tandem and HPLC-UV as the chosen detecting comparative techniques. The aim is to find a cost-effective detection method, with lower variability and high sensitivity and robustness, that allows to monitor simultaneously both toxins in biological matrixes.
The decision to carry out two determinations with varying detection techniques in this paper (UV and MS, respectively) stems from the nature of the molecules and their tendency to be present in both the protein-bound form and free form. We believe that the differentiation between the two detection methods provides a more precise estimate of the concentration of the UTs, with lower variability compared to what is found in current literature. In addition, UV detection at the selected absorption wavelength (200 nm) is useful to determine the protein-bound form of the examined toxins, since the chosen analytical column to carry out the HPLC-UV testing is a C18, which is polar enough to attach to proteins and separate them from the toxins. This process is also aided by the use of a mobile phase that is 70% acidified water and 30% of organic modifier. Figures 5-7 depict 3D graphs of the peaks detected via HPLC-UV, and they show the absence of other analytical peaks at wavelengths that are different from 200 nm.
On the other hand, the MS detection is useful to determine both UTs simultaneously in their free form. Firstly, ionisation is achieved by negative ESI (Table 1) [1616Boelaert J, Lynen F, Glorieux G, Eloot S, Van Landschoot M, Waterloos MA, Sandra P, Vanholder R. A novel UPLCMS-MS method for simultaneous determination of seven uremic retention toxins with cardiovascular relevance in chronic kidney disease patients. Anal. Bioanal. Chem. 2013, 405, 1937–1947.]; then, by setting the detector to MRM (multiple reaction monitoring), it is possible to observe the reaction path of the ions, which ends in the detection of both product ions [1818Cuoghi A, Caiazzo M, Bellei E, Monari E, Bergamini S, Palladino G, Ozben T, Tomasi A. Quantification of p-cresol sulphate in human plasma by selected reaction monitoring. Anal Bioanal Chem. 2012 Oct;404(6-7):2097-104. doi: 10.1007/s00216-012-6277-z. Epub 2012 Aug 7. PMID: 22868475.]. The detection is unequivocal, as the peaks refer to the selected mass transitions (Table 1).
Table 1: Operating conditions for the determination of pCS and IS via LC-MS. The Table shows all the analytical condition for the analysis, as well as the detection of the UTs. The mass analyser is a triple quadrupole.
To validate both methods similar experimental conditions were applied, such as mobile phase composition, type of analytical column and sample preparation.
LC-MS Conditions
The LC-MS data were obtained on a Shimadzu LC-MS 8040 T ri p Q u a d M S equipped with System Controller CBM-20A, Trip Quad Mass Spectrometer detector and controlled by LabSolutions WS Software (Neonatal Solution version 2.0 part-number 225-24442-91). The employed column was a Luna® Omega 5µm PS C18 100 Å column dimensions 150x4.6 mm, column from Phenomenex QC MIX 870. LC-MS/MS operating conditions were (Table 1) [1616Boelaert J, Lynen F, Glorieux G, Eloot S, Van Landschoot M, Waterloos MA, Sandra P, Vanholder R. A novel UPLCMS-MS method for simultaneous determination of seven uremic retention toxins with cardiovascular relevance in chronic kidney disease patients. Anal. Bioanal. Chem. 2013, 405, 1937–1947.,1818Cuoghi A, Caiazzo M, Bellei E, Monari E, Bergamini S, Palladino G, Ozben T, Tomasi A. Quantification of p-cresol sulphate in human plasma by selected reaction monitoring. Anal Bioanal Chem. 2012 Oct;404(6-7):2097-104. doi: 10.1007/s00216-012-6277-z. Epub 2012 Aug 7. PMID: 22868475.].
HPLC-UV Conditions
The HPLC-UV data were obtained on a Shimadzu Prominence Modular HPLC equipped with System Controller CBM20A, Photo-diode Array detector SPDM20A and controlled by LabSolutions WS-Single PDA (Vers. 5) WS Software. The employed column was a C18 reversed phase column Shim-pack VP-ODS 5 mm 250 mm x 4.6 mm. HPLC operating conditions were as follows in Table 2.
Table 2: Operating conditions for the determination of pCS and IS via HPLC-UV. The analysis is carried out in isocratic mode (% of B remains the same for the duration of the run) in reversed phase. The detection is carried out at 200 nm.
Sample preparation
The UTs were available in salt form, and the mother solutions were prepared by reconstituting the salts in 50/50 H2O/acetonitrile. Further dilutions to reach the desired concentrations were performed by adding NaCl 0.9%.
UT standard solutions were prepared fresh when needed, and stored at 0-4 °C between injections during the same day.
Calibration
Four calibrations were carried out, two for each compound, in both LC-MS/MS and HPLC-UV and the four curves are reported below.
The investigated concentrations for both uremic toxins are 0.003125 mol/L, 0.00625 mol/L, 0.0125 mol/L, 0.025 mol/L and 0.05 mol/L. The tables showing LOD, LOQ and % Accuracy values can be found in the Supplementary Material Section.
The present method is fast and cost-effective, as well as easy to reproduce and doesn’t require lengthy sample preparation procedures.
Two calibrations were performed to detect the analytes simultaneously, and they show strong linearity in the required range of concentrations.
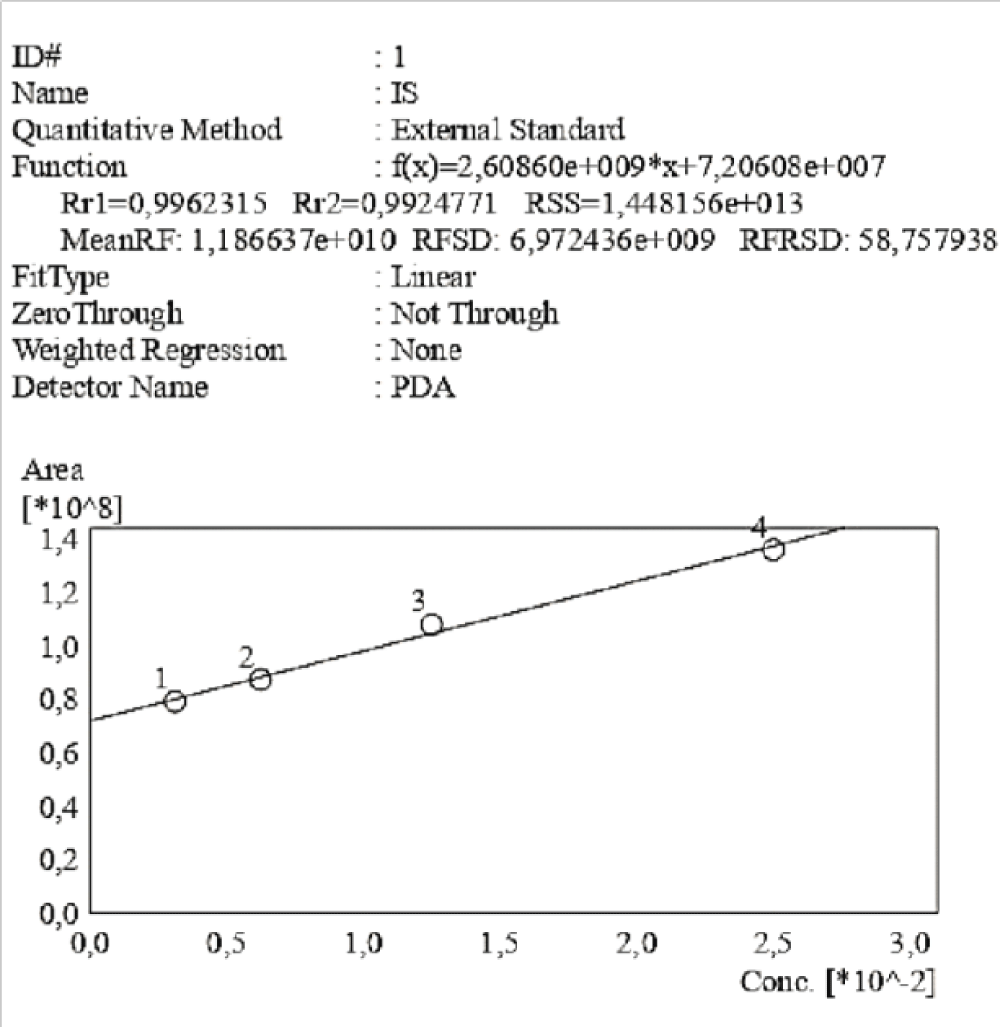
The four different calibration curves start at level 1 corresponding to an equal concentration of UTs of 0.003125 mol/L, which equals to 5.8*10-4 g/ml for pCS, and to 6.66*10-4 g/ml for IS. The curves in Figure 4-5 and Figures 9,10 all show strong linearity with R2>0.99.
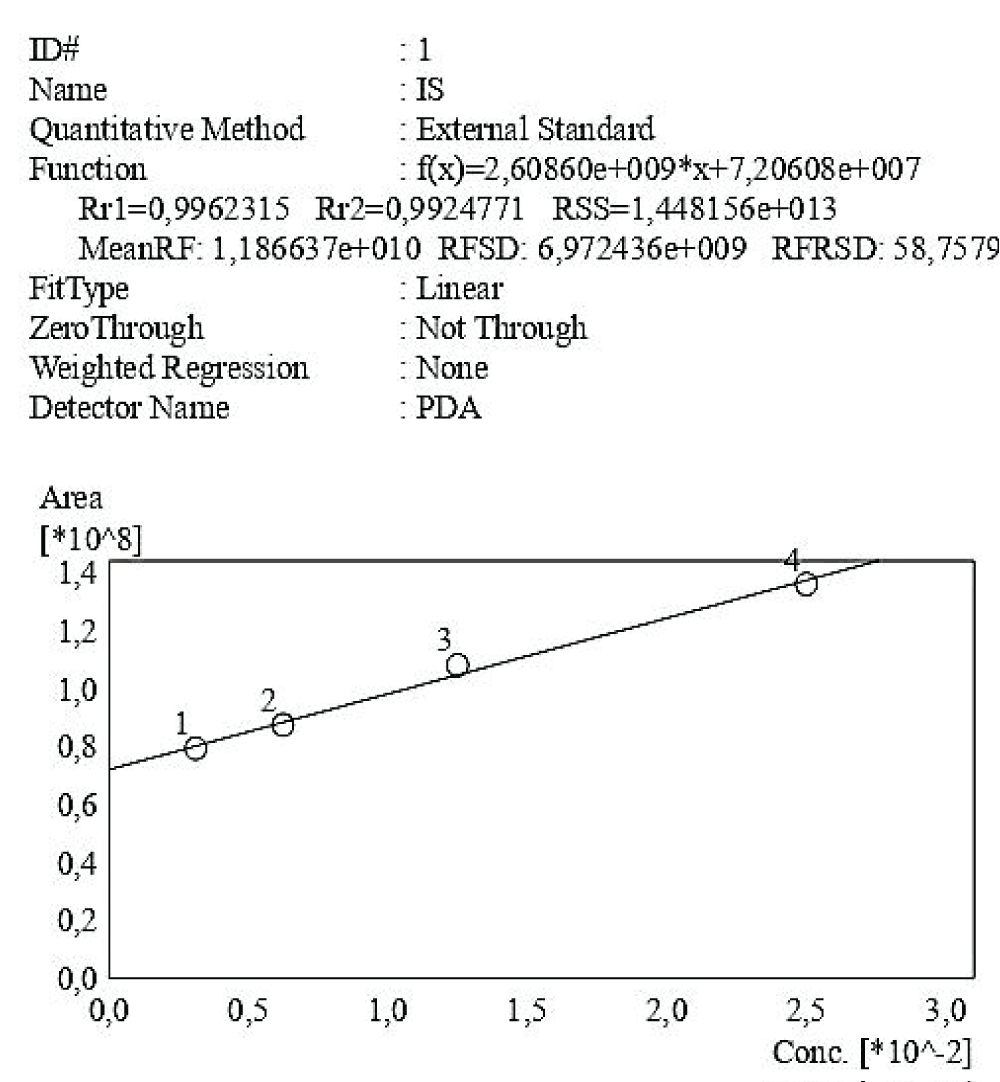
In particular, Figures 4,5 show the calibration curves obtained for each molecule using UV detection.
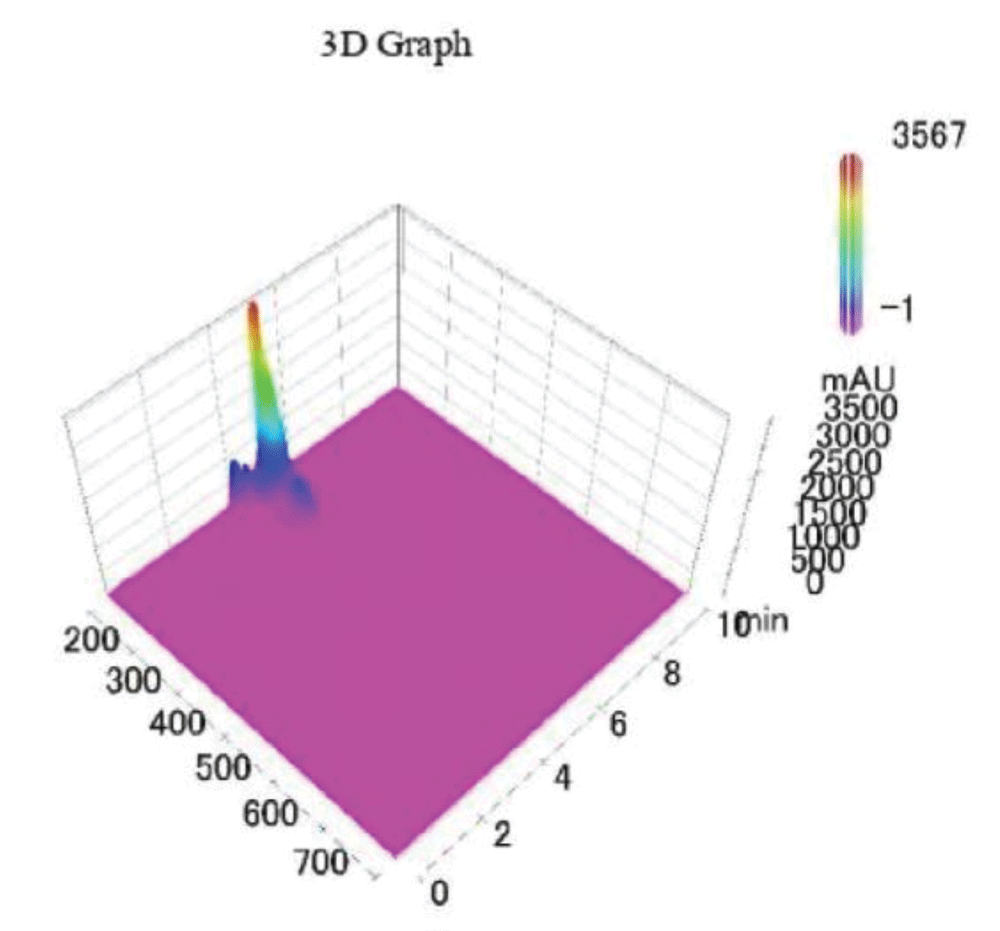
Figure 3 shows a 3D graph of a standard sample analysed via HPLC-UV of pCS and IS; specifically, it’s a colour coded graph that shows the intensity of the chromatographic signal as a function of the run time and wavelength. It is possible to notice that at the chosen value of λ=200 nm, there is no background signal and the only peaks that are detected are those pertaining to the studied analytes.
Figure 3: 3D graph of a standard sample of PCS-IS analysed via HPLC-UV.
Figure 4: Calibration curve of Indossyl Sulphate obtained via HPLC-UV at 200 nm. The picture also reports the equation of the calibration curve as well as the correlation coefficient R2. The curve was created using the Quant Browser on the LabSolutions WS-Single PDA Software.
Figure 5: Calibration curve of P-Cresol Sulphate obtained via HPLC-UV at 200 nm. The picture also reports the equation of the calibration curve as well as the correlation coefficient R2. This curve was created using the Quant Browser on the LabSolutions WS-Single PDA Software. PCS was detected simultaneously to IS.
To test the robustness and sensitivity of the method, varying ratios of PCS and IS were submitted to the HPLC-UV, ranging from 1:2 (Figure 6) to 1:6 (Figure 8), as well as the diluted forms. In each range the molecules were detected simultaneously above the LOD. The Summary Compound Table showing retention times, LOD, LOQ and accuracy for IS and PCS can be found in the Supplementary Materials, in Table 3 and Table 4 respectively.
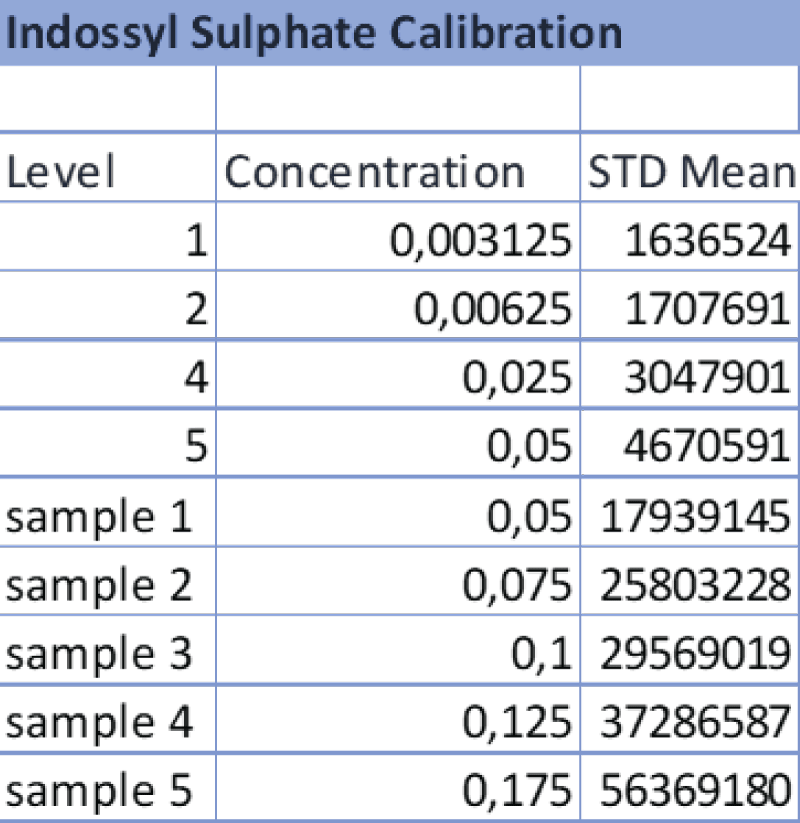
Table 3: Data referring to the 4-point calibration of IS and the diluted samples 1-5. The operator diluted the samples following the aforementioned ratios and the analysis was carried out at the same operating conditions as the calibration.
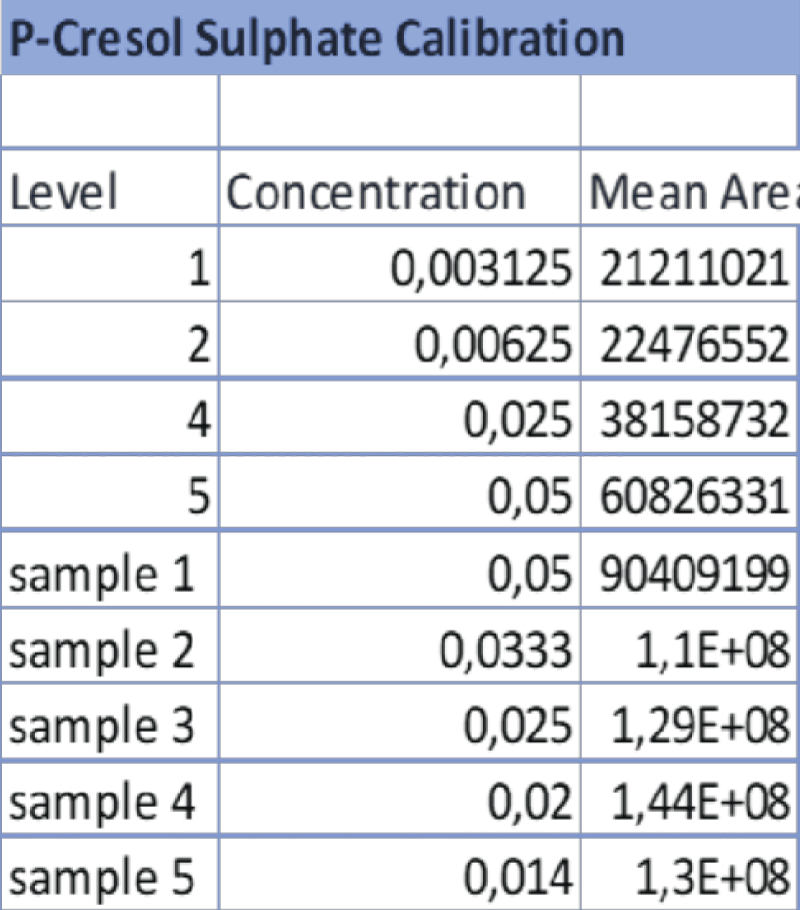
Table 4: Data referring to the 4-point calibration of pCS and the diluted samples 1-5. 1-5. The operator diluted the samples following the aforementioned ratios and the analysis was carried out at the same operating conditions as the calibration.
Figure 6: HPLC-UV Chromatogram and 3D Graph of the peaks referring to IS and PCS at a concentration ratio of 2:1 respectively.
Figure 7: HPLC-UV Chromatogram and 3D Graph of the peaks referring to IS and PCS at a concentration ratio of 3:1 respectively.
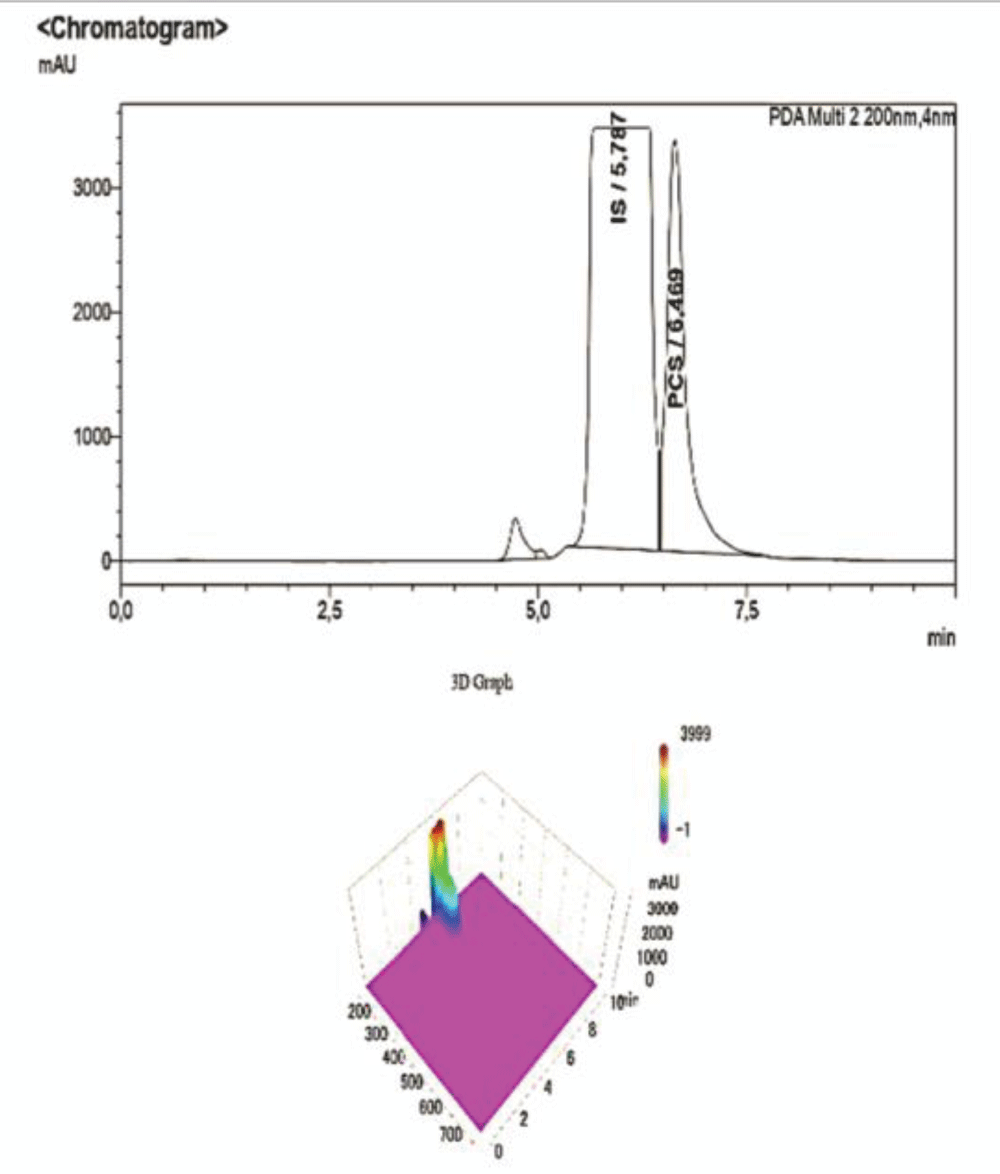
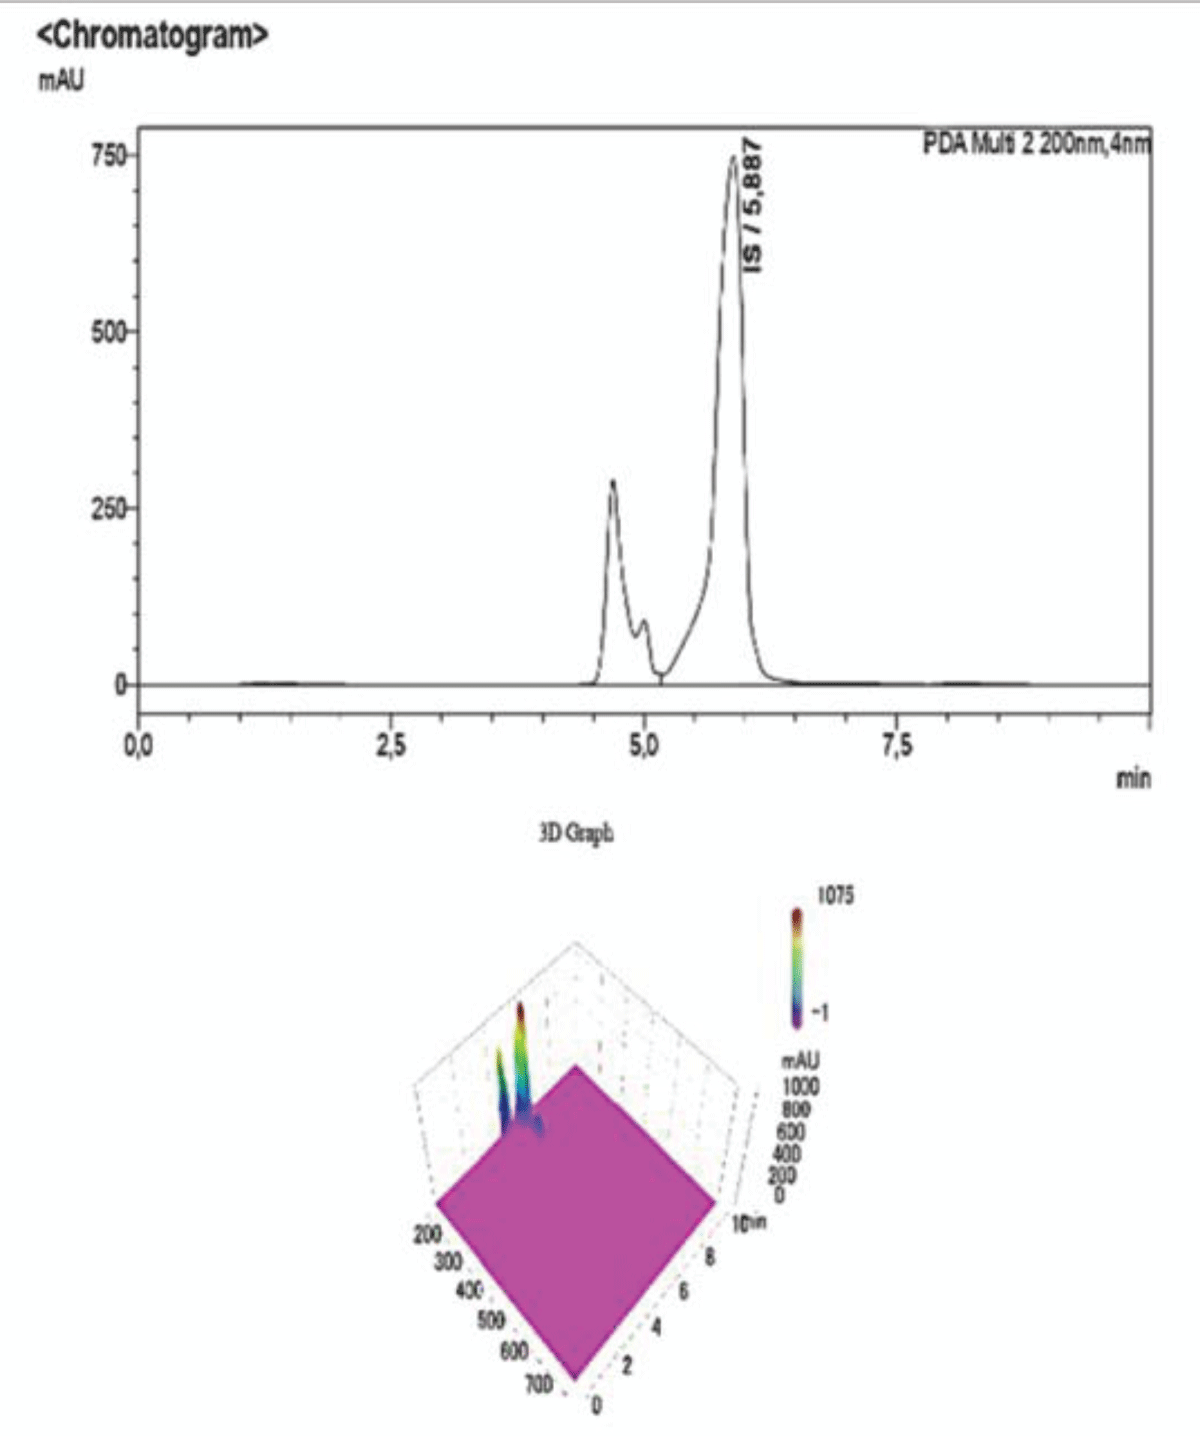
To corroborate our findings, further dilutions were performed to test the sensitivity and specificity of the method, and then they were submitted to the HPLC-UV at the same operating conditions. As shown in the chromatogram below, at ratios of IS:PCS of 6:1 (Figure 8), and after a 1:100 dilution with NaCl 0.9%, the peak pertaining to PCS disappears, proving that this concentration is below both the LOQ and LOD determined for the procedure.
Figure 8: HPLC-UV Chromatogram and 3D Graph of the peaks referring to IS and PCS at a concentration ratio of 6:1 respectively. The peak for PCS is not detected at this concentration, whereas IS is clearly visible albeit with much lower intensity due to the dilution, as it is also shown by the scale of the y-axis.
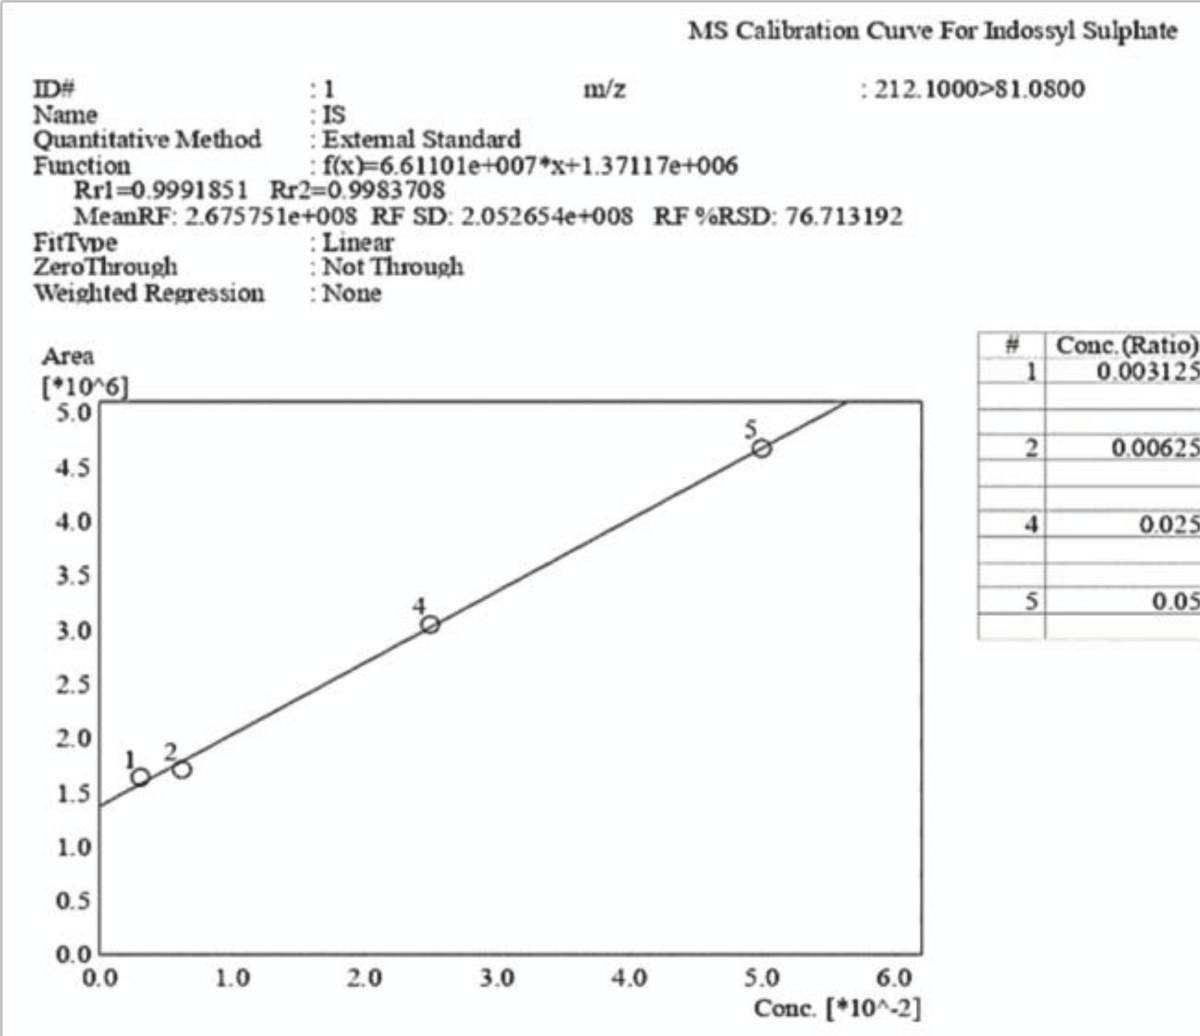
Figure 9: Calibration curve of Indossyl Sulphate obtained via LC-MS pertaining the transition m/z: 212.1000 81.0800. The picture also reports the equation of the calibration curve as well as the correlation coefficient R2. The curve was created using the Quant Browser on the LabSolutions WS Software.
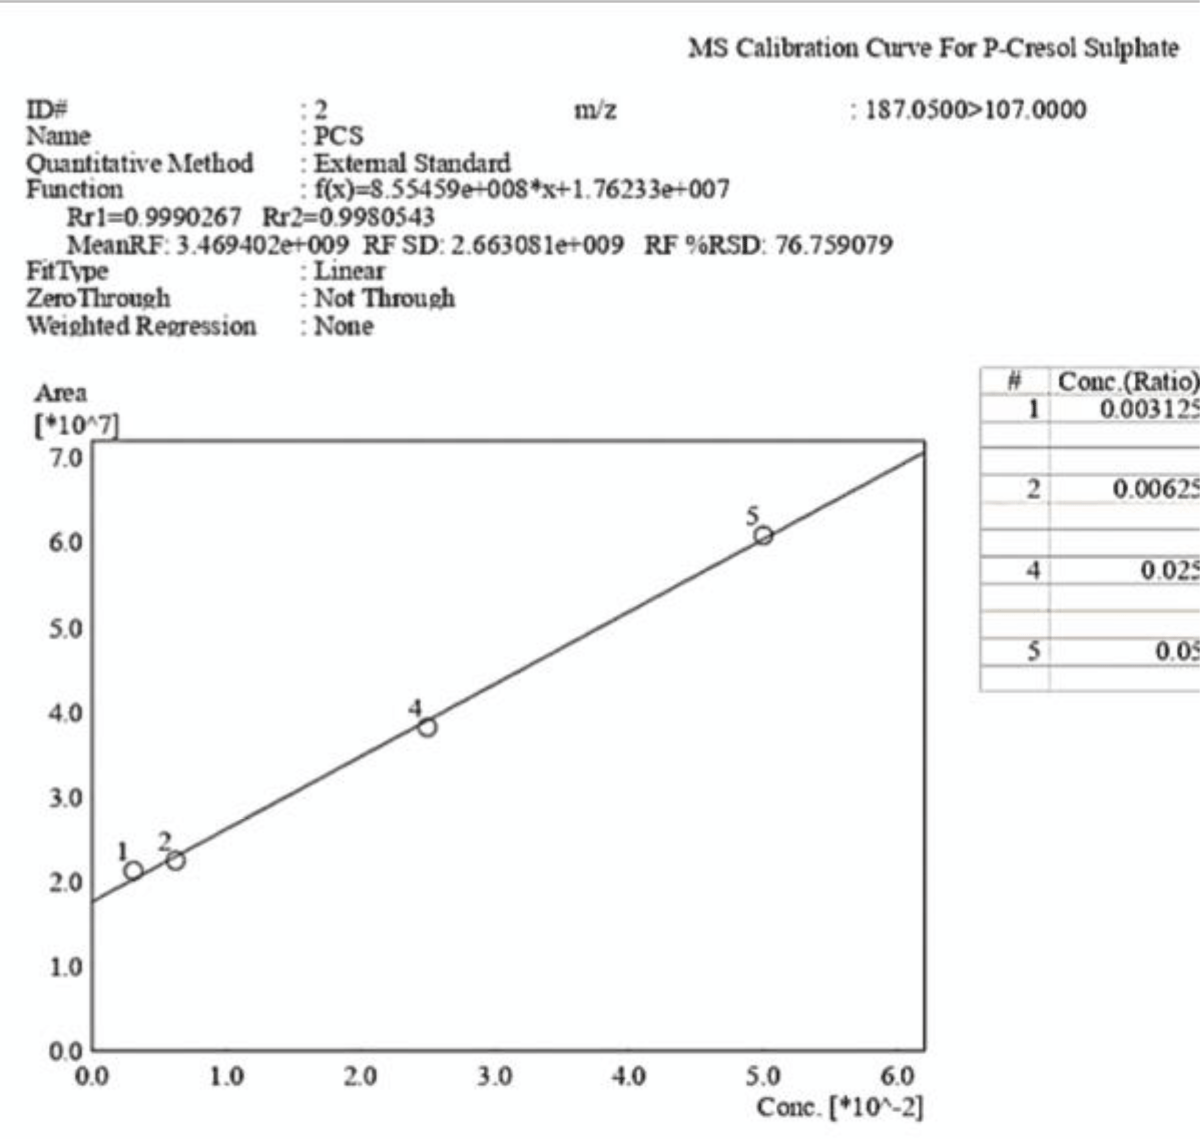
Figure 10: Calibration curve of P-Cresol Sulphate obtained via LC-MS pertaining the transition m/z: 187.0200 107.0000. The picture also reports the equation of the calibration curve as well as the correlation coefficient R2. The curve was created using the Quant Browser on the LabSolutions WS Software.
The analyses carried out via LC-MS/MS were performed under the same experimental conditions, which are explained in the experimental section. Two calibration curves were created for PCS and IS, which were detected simultaneously using ESI in the negative ionization mode with the following mass/charge transitions:
m/z transition for IS: 212.1000à81.0800
m/z transition for PCS: 187.0500à107.000
Both curves show a strong linearity in the analysed range.
This method can be used to detect PCS and IS in biological samples in their free form, because it’s monitoring the specific mass transition for each compound.
To corroborate our findings, varying ratios of PCS (Table 4) and IS (Table 3) were analysed under the same operating conditions to prove that both compounds can be detected at the same time with good sensitivity at changing concentrations.
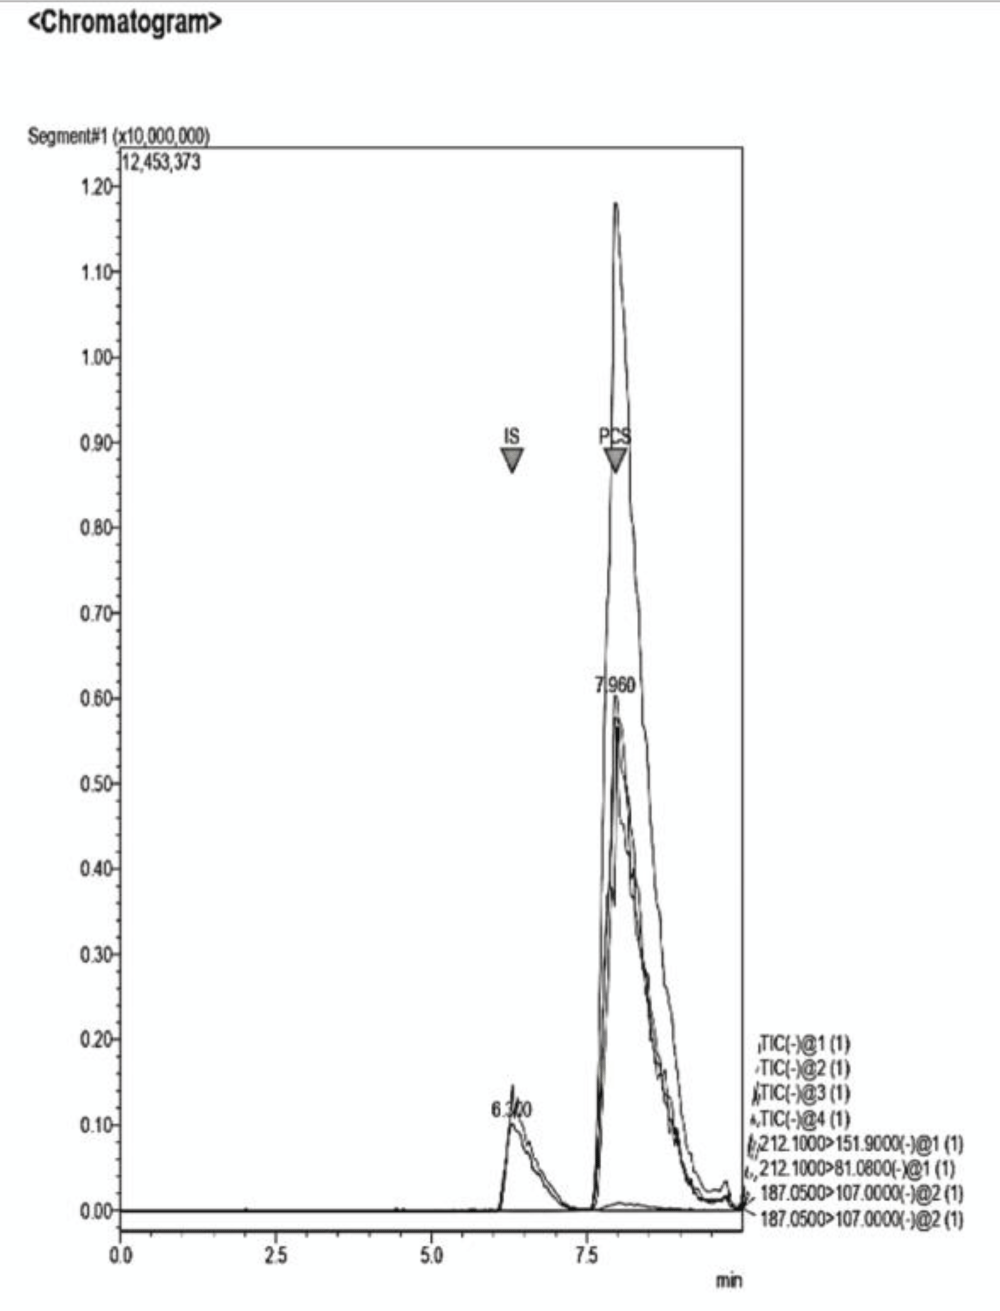
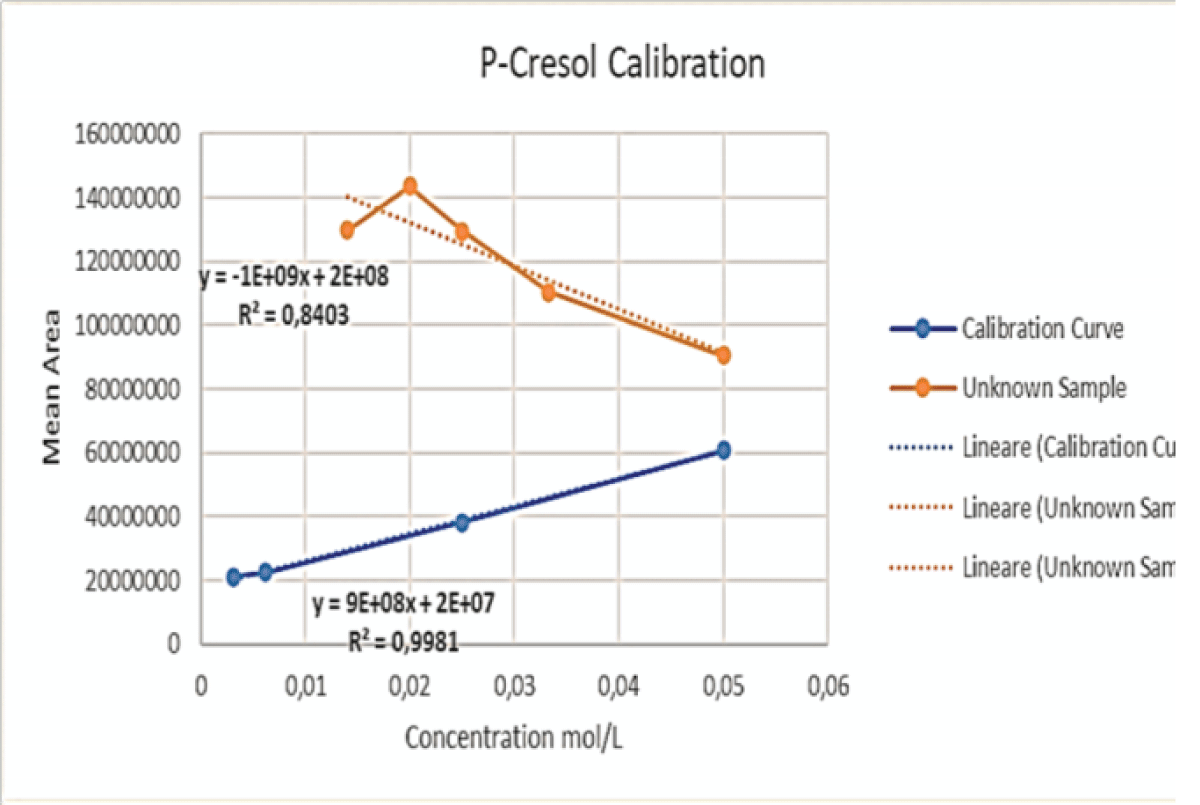
The peaks are well separated (Figure 11-13) and the robustness of the method can be further proved by comparing the present chromatograms to those obtained through further dilution of the samples, testing the linearity of the method beyond the data offered by the calibration curves. Quantitative data can be found in Tables 3,4. The unknown samples named “samples 1-5” refer to mixtures of pCS and IS at varying ratios (Figures 14,15). Five of these solutions (n=5) were prepared and analysed following the same analytical methods reported in Table 1. Each sample was analysed in quadruplicate.
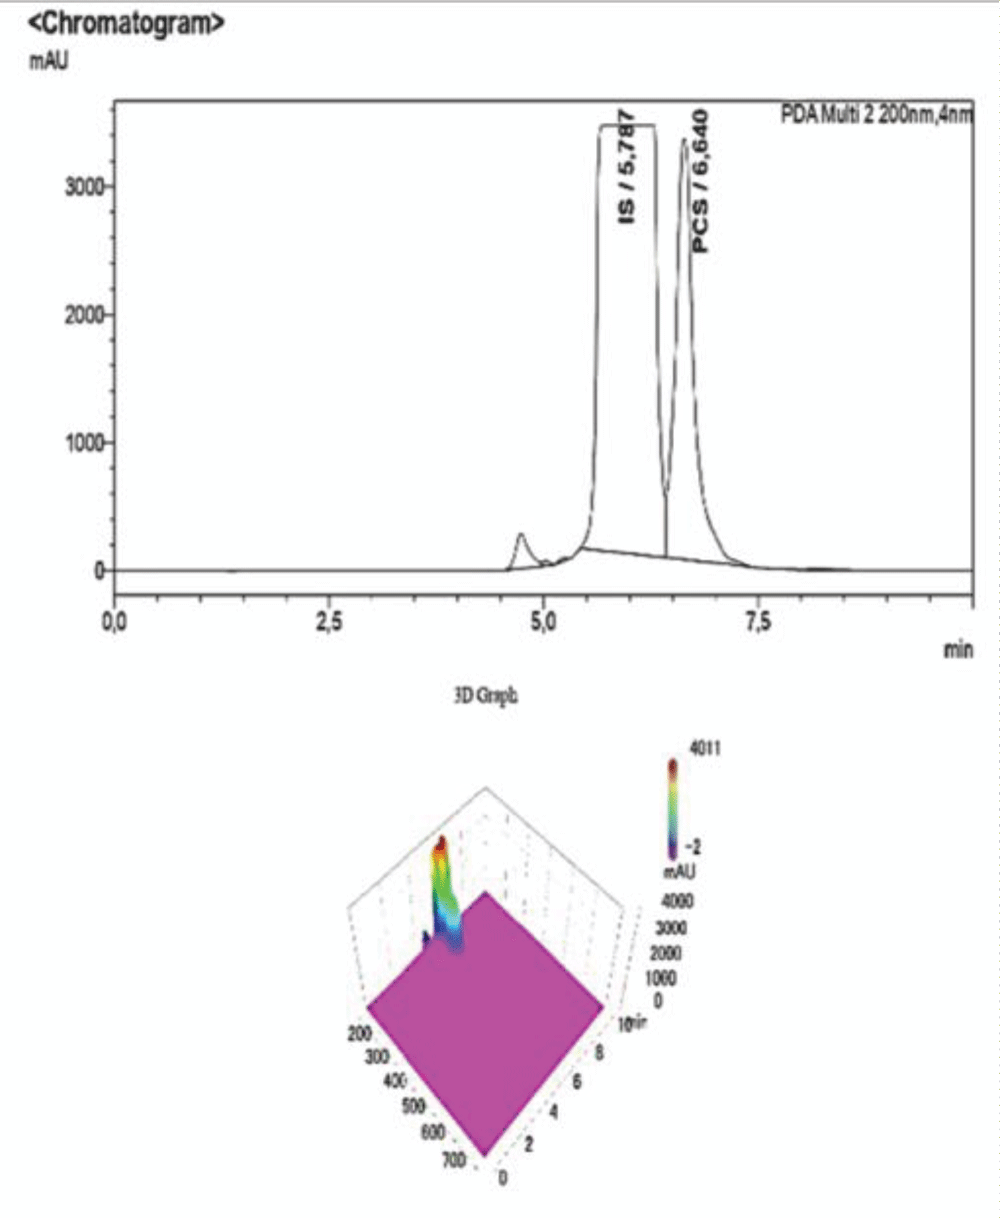
Figure 11: Example of a Chromatogram showing IS and PCS at their retention times. The ratio of concentration in this analysis is IS 2:1 PCS. The dilution of the sample was performed adding NaCl 0.9% to the desired volume.
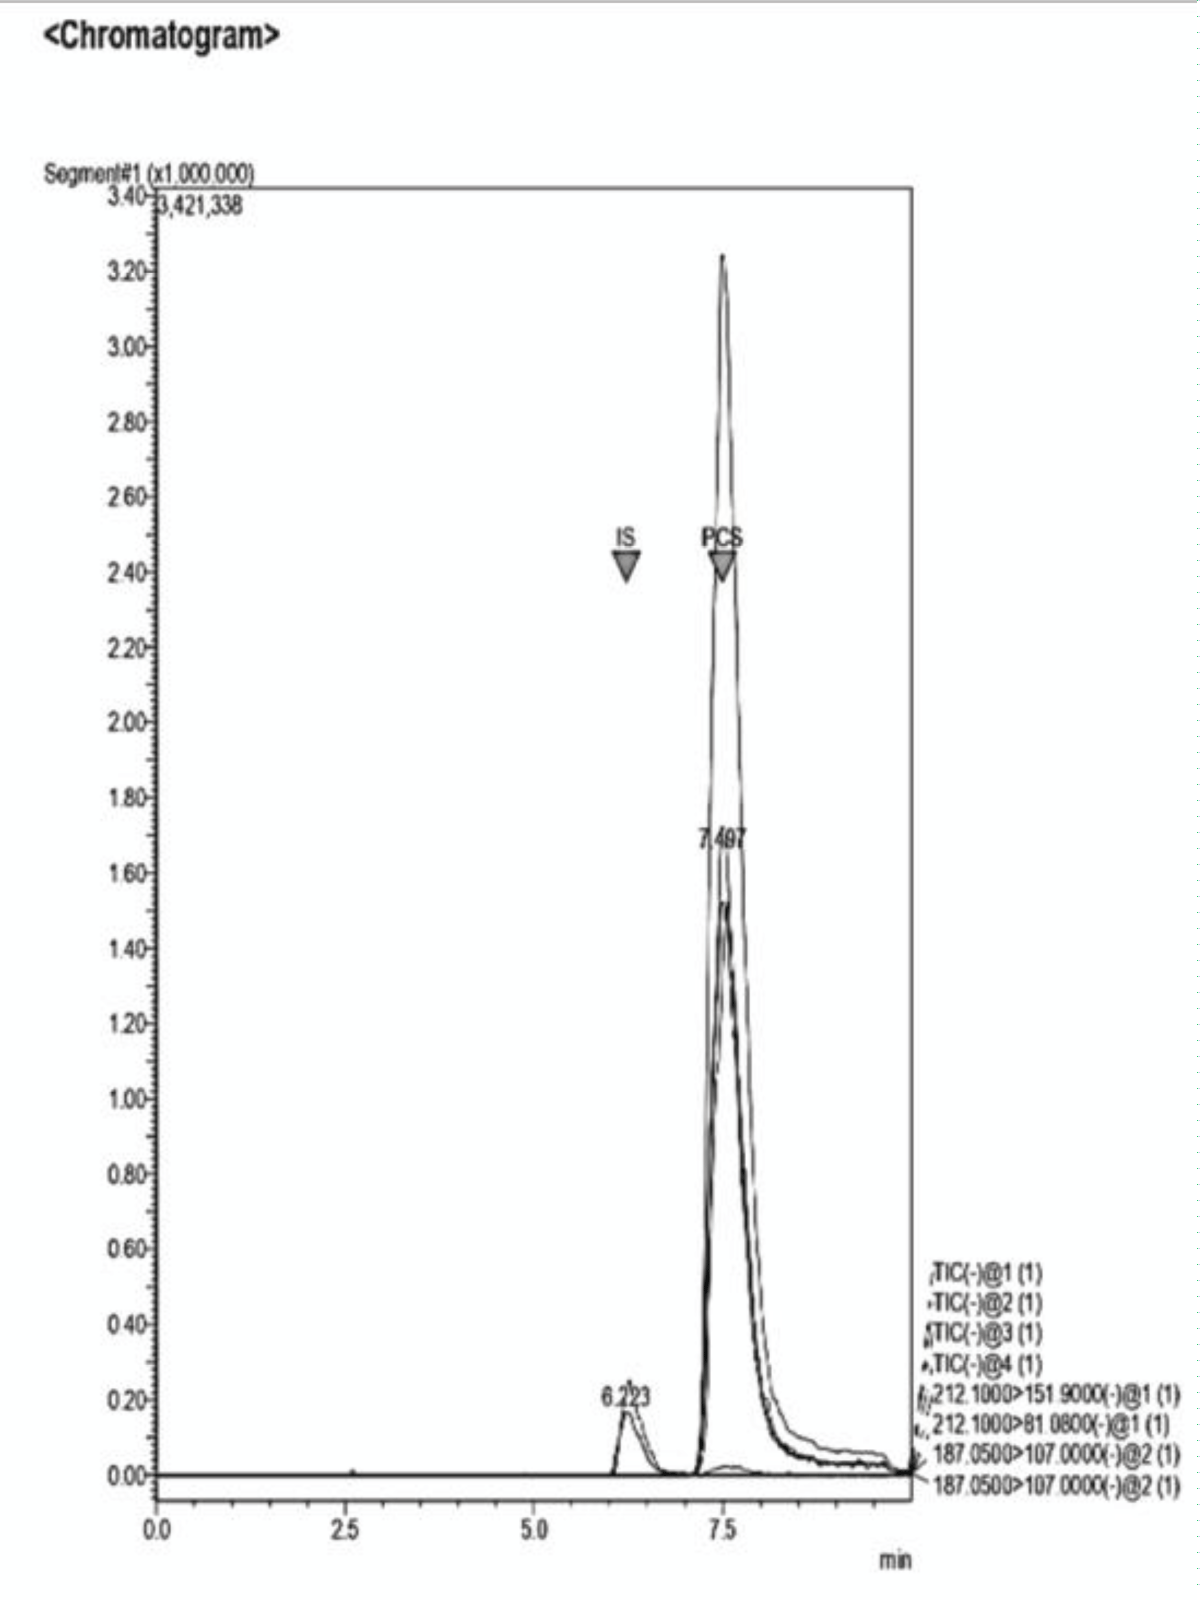
Figure 12: Example of a Chromatogram showing IS and PCS at their retention times. This sample presents a concentration ratio of the two UTs of 1:1.
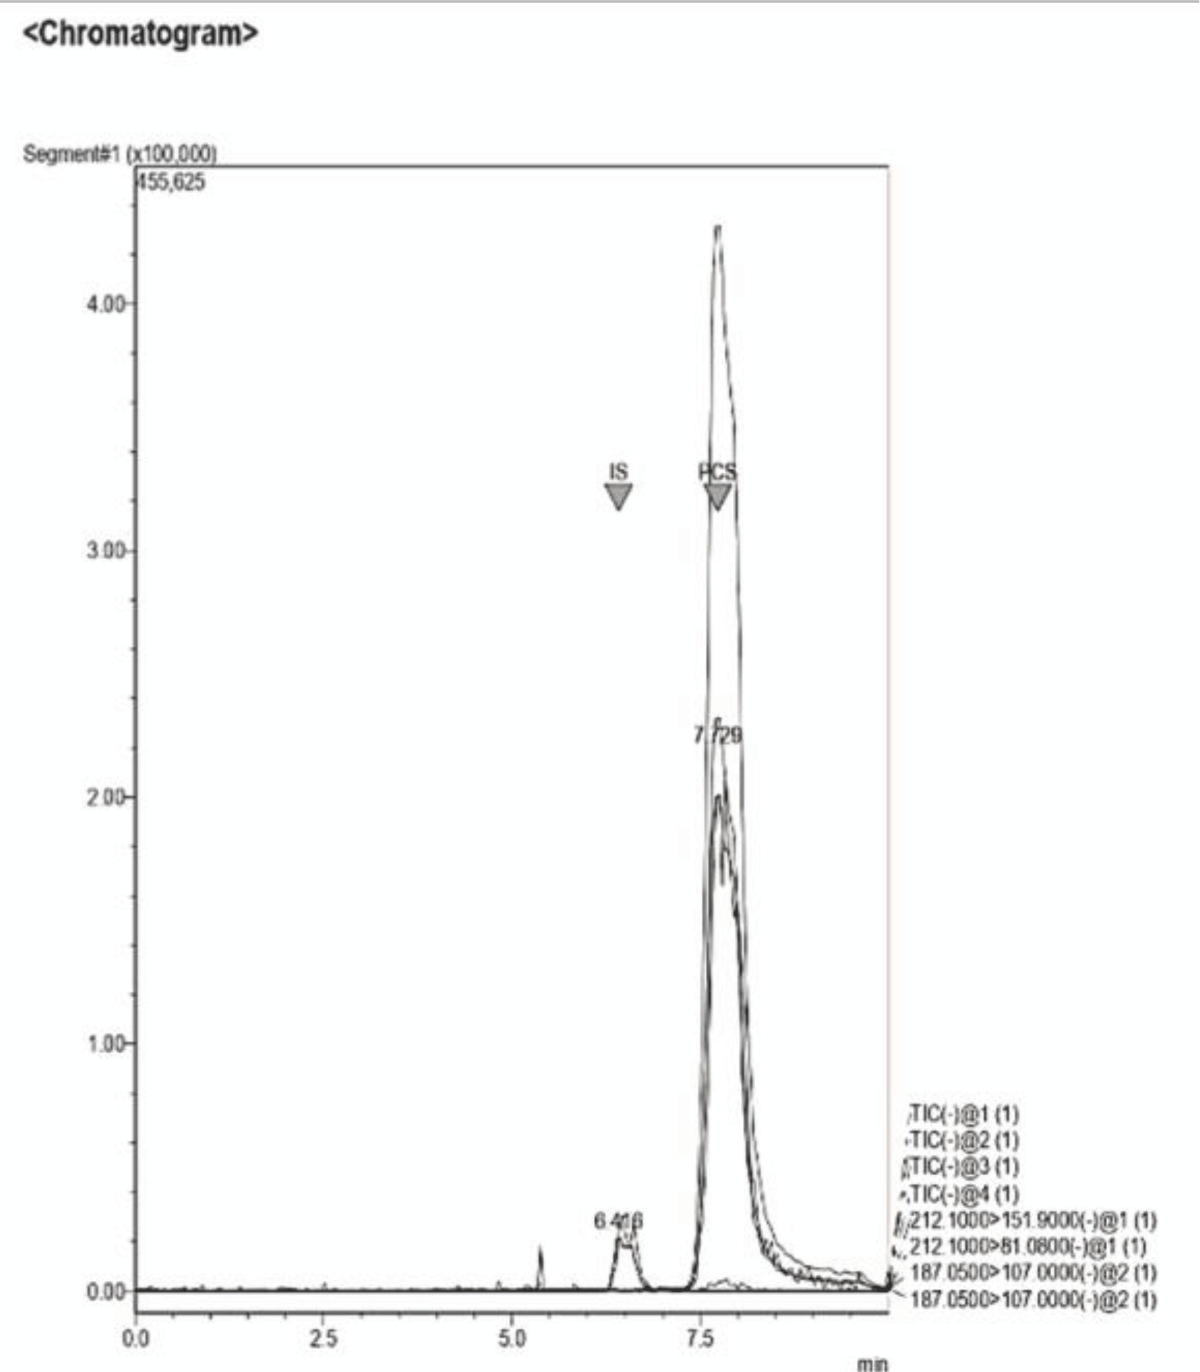
Figure 13: Example of a Chromatogram showing IS and PCS at their retention times. This sample presents a concentration ratio of the two UTs of 4:1 after dilution.
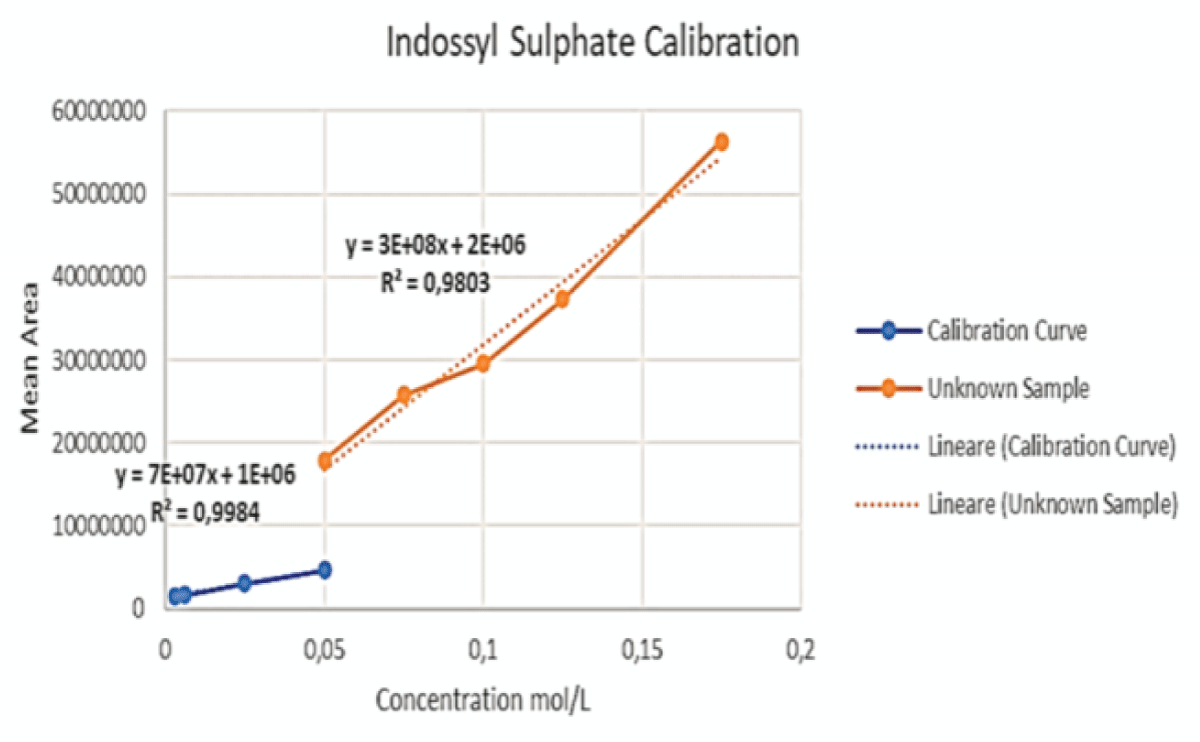
Figure 14: This graph shows the initial calibration curve performed via LC-MS for IS (blue) together with the curve (orange) obtained by enhancing the concentration of said toxin, keeping the volume of PCS constant, for the samples at ratios of 2:1, 3:1, 4:1 and 6:1.
Figure 15: This graph shows the initial calibration curve performed via LC-MS for PCS (blue) together with the curve (orange) obtained by keeping the volume of PCS constant, whilst adding varying volumes of IS, for the samples at ratios of 2:1, 3:1, 4:1 and 6:1.
The aims of the study have been met, because of the results given by the chosen analytical techniques.
These analytical procedures highlight the possibility of detecting said toxins in both their free and protein-bound form, giving the opportunity to assess the presence of both in small volumes of human biological fluids. The employed methods are easily reproducible as well as robust and cost-effective. They require minimal sample preparation and no harsh operating conditions, with a run time of only 10 minutes for both techniques.
In addition, the proposed methods should be handled based on the clinical necessities of each patient, considering their clinical history and comorbidities.
We acknowledge the financial support of this work by the PON Ricerca e Innovazione “4FRAILTY – Sensoristica intelligente, infrastrutture e modelli gestionali per la sicurezza di soggetti fragili”.
The gut microbiome and the kidney. Renu Regunathan-Shenk, ... Dominic S. Raj, in Nutritional Management of Renal Disease (Fourth Edition), 2022.
Hematologic Complications of Chronic Kidney Disease. Feras F. Karadsheh, Matthew R. Weir, in Chronic Renal Disease, 2015.
Chen TK, Knicely DH, Grams ME. Chronic Kidney Disease Diagnosis and Management: A Review. JAMA. 2019 Oct 1;322(13):1294-1304. doi: 10.1001/jama.2019.14745. PMID: 31573641; PMCID: PMC7015670.
Jha V, Garcia-Garcia G, Iseki K, Li Z, Naicker S, Plattner B, Saran R, Wang AY, Yang CW. Chronic kidney disease: global dimension and perspectives. Lancet. 2013 Jul 20;382(9888):260-72. doi: 10.1016/S0140-6736(13)60687-X. Epub 2013 May 31. Erratum in: Lancet. 2013 Jul 20;382(9888):208. PMID: 23727169.
Falconi CA, Junho CVDC, Fogaça-Ruiz F, Vernier ICS, da Cunha RS, Stinghen AEM, Carneiro-Ramos MS. Uremic Toxins: An Alarming Danger Concerning the Cardiovascular System. Front Physiol. 2021 May 14;12:686249. doi: 10.3389/fphys.2021.686249. PMID: 34054588; PMCID: PMC8160254.
Vanholder R., De Smet R., Glorieux G., Argilés A., Baurmeister U., Brunet P., et al. (2003). Review on uremic toxins: classification, concentration, and interindividual variability. Kidney Int. 63 1934–1943. 10.1046/j.1523-1755.2003.00924.
Evenepoel P, Meijers BK, Bammens BR, Verbeke K. Uremic toxins originating from colonic microbial metabolism. Kidney Int Suppl. 2009 Dec;(114):S12-9. doi: 10.1038/ki.2009.402. PMID: 19946322.
Caldiroli L, Armelloni S, Eskander A, Messa P, Rizzo V, Margiotta E, Cesari M, Vettoretti S. Association between the uremic toxins indoxyl-sulfate and p-cresyl-sulfate with sarcopenia and malnutrition in elderly patients with advanced chronic kidney disease. Exp Gerontol. 2021 May;147:111266. doi: 10.1016/j.exger.2021.111266. Epub 2021 Jan 30. PMID: 33529747.
Barreto FC, Barreto DV, Liabeuf S, Meert N, Glorieux G, Temmar M, Choukroun G, Vanholder R, Massy ZA; European Uremic Toxin Work Group (EUTox). Serum indoxyl sulfate is associated with vascular disease and mortality in chronic kidney disease patients. Clin J Am Soc Nephrol. 2009 Oct;4(10):1551-8. doi: 10.2215/CJN.03980609. Epub 2009 Aug 20. PMID: 19696217; PMCID: PMC2758258.
Niwa T, Ise M. Indoxyl sulfate, a circulating uremic toxin, stimulates the progression of glomerular sclerosis. J Lab Clin Med. 1994 Jul;124(1):96-104. PMID: 8035108.
Korytowska N, Wyczałkowska-Tomasik A, Pączek L, Giebułtowicz J. Evaluation of Salivary Indoxyl Sulfate with Proteinuria for Predicting Graft Deterioration in Kidney Transplant Recipients. Toxins (Basel). 2021 Aug 16;13(8):571. doi: 10.3390/toxins13080571. PMID: 34437442; PMCID: PMC8402605.
Fabresse N, Larabi IA, Abe E, Lamy E, Rigothier C, Massy ZA, Alvarez JC. Correlation between Saliva Levels and Serum Levels of Free Uremic Toxins in Healthy Volunteers. Toxins (Basel). 2023 Feb 13;15(2):150. doi: 10.3390/toxins15020150. PMID: 36828466; PMCID: PMC9967652.
Gryp T, Vanholder R, Vaneechoutte M, Glorieux G. p-Cresyl Sulfate. Toxins (Basel). 2017 Jan 29;9(2):52. doi: 10.3390/toxins9020052. PMID: 28146081; PMCID: PMC5331431.
Pretorius CJ, McWhinney BC, Sipinkoski B, Johnson LA, Rossi M, Campbell KL, Ungerer JP. Reference ranges and biological variation of free and total serum indoxyl- and p-cresyl sulphate measured with a rapid UPLC fluorescence detection method. Clin Chim Acta. 2013 Apr 18;419:122-6. doi: 10.1016/j.cca.2013.02.008. Epub 2013 Feb 18. PMID: 23428591.
Yousef Selim N, Farag Mannaa H, Atef. Sharaki O, Zaytoun T, Elkholy N, Arafat W. Highlighting Levels of Indoxyl Sulphate among Critically Ill Patients with Acute Nephrotoxicity; Correlations Between Indoxyl Sulphate Levels and Patients' Characteristics. Rep Biochem Mol Biol. 2021 Jul;10(2):266-279. doi: 10.52547/rbmb.10.2.266. PMID: 34604416; PMCID: PMC8480295.
Boelaert J, Lynen F, Glorieux G, Eloot S, Van Landschoot M, Waterloos MA, Sandra P, Vanholder R. A novel UPLCMS-MS method for simultaneous determination of seven uremic retention toxins with cardiovascular relevance in chronic kidney disease patients. Anal. Bioanal. Chem. 2013, 405, 1937–1947.
Lin CJ, Chen HH, Pan CF, Chuang CK, Wang TJ, Sun FJ, Wu CJ. p-Cresylsulfate and indoxyl sulfate level at different stages of chronic kidney disease. J Clin Lab Anal. 2011;25(3):191-7. doi: 10.1002/jcla.20456. PMID: 21567467; PMCID: PMC6647585.
Cuoghi A, Caiazzo M, Bellei E, Monari E, Bergamini S, Palladino G, Ozben T, Tomasi A. Quantification of p-cresol sulphate in human plasma by selected reaction monitoring. Anal Bioanal Chem. 2012 Oct;404(6-7):2097-104. doi: 10.1007/s00216-012-6277-z. Epub 2012 Aug 7. PMID: 22868475.
PON Ricerca e Innovazione “4FRAILTY – Sensoristica intelligente, infrastrutture e modelli gestionali per la sicurezza di soggetti fragili”.
Filosa C, Leopoldo M, Colabufo NA. LC-MS and HPLC-UV for Detecting Uremic Toxins: Two Validated Methods with Simultaneous Sensitivity and Specificity Evaluation. IgMin Res. April 23, 2024; 2(4): 266-0. IgMin ID: igmin175; DOI: 10.61927/igmin175; Available at: igmin.link/p175
How to cite this article: Filosa C, Leopoldo M, Colabufo NA. LC-MS and HPLC-UV for Detecting Uremic Toxins: Two Validated Methods with Simultaneous Sensitivity and Specificity Evaluation. IgMin Res. April 23, 2024; 2(4): 266-0. IgMin ID: igmin175; DOI: 10.61927/igmin175; Available at: igmin.link/p175
Figure 1: Chemical Structure of Indossyl Sulphate....
Figure 2: Chemical Structure of P Cresyl Sulphate....
Figure 3: 3D graph of a standard sample of PCS-IS analysed v...
Figure 4: Calibration curve of Indossyl Sulphate obtained vi...
Figure 5: Calibration curve of P-Cresol Sulphate obtained vi...
Figure 6: HPLC-UV Chromatogram and 3D Graph of the peaks ref...
Figure 7: HPLC-UV Chromatogram and 3D Graph of the peaks ref...
Figure 8: HPLC-UV Chromatogram and 3D Graph of the peaks ref...
Figure 9: Calibration curve of Indossyl Sulphate obtained vi...
Figure 10: Calibration curve of P-Cresol Sulphate obtained vi...
Figure 11: Example of a Chromatogram showing IS and PCS at th...
Figure 12: Example of a Chromatogram showing IS and PCS at th...
Figure 13: Example of a Chromatogram showing IS and PCS at th...
Figure 14: This graph shows the initial calibration curve per...
Figure 15: This graph shows the initial calibration curve per...
Figure 1: Chemical Structure of Indossyl Sulphate....
Table 3: Data referring to the 4-point calibration of IS an...
Table 4: Data referring to the 4-point calibration of pCS a...
Table 1: Operating conditions for the determination of pCS ...
Table 2: Operating conditions for the determination of pCS ...
The gut microbiome and the kidney. Renu Regunathan-Shenk, ... Dominic S. Raj, in Nutritional Management of Renal Disease (Fourth Edition), 2022.
Hematologic Complications of Chronic Kidney Disease. Feras F. Karadsheh, Matthew R. Weir, in Chronic Renal Disease, 2015.
Chen TK, Knicely DH, Grams ME. Chronic Kidney Disease Diagnosis and Management: A Review. JAMA. 2019 Oct 1;322(13):1294-1304. doi: 10.1001/jama.2019.14745. PMID: 31573641; PMCID: PMC7015670.
Jha V, Garcia-Garcia G, Iseki K, Li Z, Naicker S, Plattner B, Saran R, Wang AY, Yang CW. Chronic kidney disease: global dimension and perspectives. Lancet. 2013 Jul 20;382(9888):260-72. doi: 10.1016/S0140-6736(13)60687-X. Epub 2013 May 31. Erratum in: Lancet. 2013 Jul 20;382(9888):208. PMID: 23727169.
Falconi CA, Junho CVDC, Fogaça-Ruiz F, Vernier ICS, da Cunha RS, Stinghen AEM, Carneiro-Ramos MS. Uremic Toxins: An Alarming Danger Concerning the Cardiovascular System. Front Physiol. 2021 May 14;12:686249. doi: 10.3389/fphys.2021.686249. PMID: 34054588; PMCID: PMC8160254.
Vanholder R., De Smet R., Glorieux G., Argilés A., Baurmeister U., Brunet P., et al. (2003). Review on uremic toxins: classification, concentration, and interindividual variability. Kidney Int. 63 1934–1943. 10.1046/j.1523-1755.2003.00924.
Evenepoel P, Meijers BK, Bammens BR, Verbeke K. Uremic toxins originating from colonic microbial metabolism. Kidney Int Suppl. 2009 Dec;(114):S12-9. doi: 10.1038/ki.2009.402. PMID: 19946322.
Caldiroli L, Armelloni S, Eskander A, Messa P, Rizzo V, Margiotta E, Cesari M, Vettoretti S. Association between the uremic toxins indoxyl-sulfate and p-cresyl-sulfate with sarcopenia and malnutrition in elderly patients with advanced chronic kidney disease. Exp Gerontol. 2021 May;147:111266. doi: 10.1016/j.exger.2021.111266. Epub 2021 Jan 30. PMID: 33529747.
Barreto FC, Barreto DV, Liabeuf S, Meert N, Glorieux G, Temmar M, Choukroun G, Vanholder R, Massy ZA; European Uremic Toxin Work Group (EUTox). Serum indoxyl sulfate is associated with vascular disease and mortality in chronic kidney disease patients. Clin J Am Soc Nephrol. 2009 Oct;4(10):1551-8. doi: 10.2215/CJN.03980609. Epub 2009 Aug 20. PMID: 19696217; PMCID: PMC2758258.
Niwa T, Ise M. Indoxyl sulfate, a circulating uremic toxin, stimulates the progression of glomerular sclerosis. J Lab Clin Med. 1994 Jul;124(1):96-104. PMID: 8035108.
Korytowska N, Wyczałkowska-Tomasik A, Pączek L, Giebułtowicz J. Evaluation of Salivary Indoxyl Sulfate with Proteinuria for Predicting Graft Deterioration in Kidney Transplant Recipients. Toxins (Basel). 2021 Aug 16;13(8):571. doi: 10.3390/toxins13080571. PMID: 34437442; PMCID: PMC8402605.
Fabresse N, Larabi IA, Abe E, Lamy E, Rigothier C, Massy ZA, Alvarez JC. Correlation between Saliva Levels and Serum Levels of Free Uremic Toxins in Healthy Volunteers. Toxins (Basel). 2023 Feb 13;15(2):150. doi: 10.3390/toxins15020150. PMID: 36828466; PMCID: PMC9967652.
Gryp T, Vanholder R, Vaneechoutte M, Glorieux G. p-Cresyl Sulfate. Toxins (Basel). 2017 Jan 29;9(2):52. doi: 10.3390/toxins9020052. PMID: 28146081; PMCID: PMC5331431.
Pretorius CJ, McWhinney BC, Sipinkoski B, Johnson LA, Rossi M, Campbell KL, Ungerer JP. Reference ranges and biological variation of free and total serum indoxyl- and p-cresyl sulphate measured with a rapid UPLC fluorescence detection method. Clin Chim Acta. 2013 Apr 18;419:122-6. doi: 10.1016/j.cca.2013.02.008. Epub 2013 Feb 18. PMID: 23428591.
Yousef Selim N, Farag Mannaa H, Atef. Sharaki O, Zaytoun T, Elkholy N, Arafat W. Highlighting Levels of Indoxyl Sulphate among Critically Ill Patients with Acute Nephrotoxicity; Correlations Between Indoxyl Sulphate Levels and Patients' Characteristics. Rep Biochem Mol Biol. 2021 Jul;10(2):266-279. doi: 10.52547/rbmb.10.2.266. PMID: 34604416; PMCID: PMC8480295.
Boelaert J, Lynen F, Glorieux G, Eloot S, Van Landschoot M, Waterloos MA, Sandra P, Vanholder R. A novel UPLCMS-MS method for simultaneous determination of seven uremic retention toxins with cardiovascular relevance in chronic kidney disease patients. Anal. Bioanal. Chem. 2013, 405, 1937–1947.
Lin CJ, Chen HH, Pan CF, Chuang CK, Wang TJ, Sun FJ, Wu CJ. p-Cresylsulfate and indoxyl sulfate level at different stages of chronic kidney disease. J Clin Lab Anal. 2011;25(3):191-7. doi: 10.1002/jcla.20456. PMID: 21567467; PMCID: PMC6647585.
Cuoghi A, Caiazzo M, Bellei E, Monari E, Bergamini S, Palladino G, Ozben T, Tomasi A. Quantification of p-cresol sulphate in human plasma by selected reaction monitoring. Anal Bioanal Chem. 2012 Oct;404(6-7):2097-104. doi: 10.1007/s00216-012-6277-z. Epub 2012 Aug 7. PMID: 22868475.
PON Ricerca e Innovazione “4FRAILTY – Sensoristica intelligente, infrastrutture e modelli gestionali per la sicurezza di soggetti fragili”.


 Open Access by