Published online Mar 7, 2013. doi: 10.3748/wjg.v19.i9.1472
Revised: February 6, 2013
Accepted: February 8, 2013
Published online: March 7, 2013
AIM: To investigate the normal hepatic magnetic resonance spectroscopy findings choline/lipid2 (Cho/Lip2) associated with age and body mass index (BMI).
METHODS: A total of 58 single-voxel proton spectra of the liver were acquired at 3.0 T using the eight-channel phased array abdominal coil as the receiver coil. Consecutive stacks of breath-hold spectra were acquired using the point resolved spectroscopy technique at a short echo time of 30 ms and a repetition time of 1500 ms. The spectra were processed with the SAGE software package. Areas and heights for metabolite resonance were obtained. Student’s t test for unpaired data was used for comparisons of shimming, Cho/Lip2, and lipid content.
RESULTS: There were significant negative correlations between the Cho/Lip2 peak height ratios and BMI (r = -0.615) and age (r = -0.398) (all P < 0.01). Compared with the high-BMI group, the low-BMI group was younger (39.1 ± 13.0 years vs 47.6 ± 8.5 years, t = -2.954, P = 0.005); had better water suppression (93.4% ± 1.4% vs 85.6% ± 11.6%, t = 2.741, P = 0.014); had higher Cho/Lip2 peak heights ratio (0.2 ± 0.14 vs 0.05 ± 0.04, t = 6.033, P < 0.000); and had lower lipid content (0.03 ± 0.08 vs 0.29 ± 0.31, t = -3.309, P = 0.004). Compared with the older group, the younger group had better shimming effects (17.1 ± 3.6 Hz vs 22.0 ± 6.8 Hz, t = -2.919, P = 0.008); higher Cho/Lip2 peak heights ratios (0.03 ± 0.05 vs 0.09 ± 0.12, t = 2.4, P = 0.020); and lower lipid content (0.05 ± 0.11 vs 0.23 ± 0.32, t = -2.337, P = 0.031). Compared with the low-choline peak group, the high-choline peak group had lower lipid content (0.005 ± 0.002 vs 0.13 ± 0.23, t = -3.796, P < 0.000); lower BMI (19.6 ± 2.4 vs 23.9 ± 3.0, t = -4.410, P < 0.000); and younger age (34.7 ± 10.0 years vs 43.2 ± 12.5 years, t = -2.088, P = 0.041).
CONCLUSION: Lipid accumulation could result from the increased fat in the body depending on age and BMI. Lipid can mask the resonance signal of choline.
- Citation: Xu L, Liu B, Huang Y, Liu X, Zhang SW, Xin XG, Zheng JZ. 3.0 T proton magnetic resonance spectroscopy of the liver: Quantification of choline. World J Gastroenterol 2013; 19(9): 1472-1477
- URL: https://www.wjgnet.com/1007-9327/full/v19/i9/1472.htm
- DOI: https://dx.doi.org/10.3748/wjg.v19.i9.1472
Magnetic resonance spectroscopy (MRS) is a non-invasive technique that is being increasingly applied to describe biochemical changes in the liver[1-5]. The recent installation of higher field strength (3 T) clinical magnets with multicoil arrays offers new opportunities for performing whole-body MRS. The improved signal-to-noise ratio (SNR) can reduce acquisition times, and the higher field strength also provides better separation of resonances[6,7].
Choline is a precursor of acetylcholine and a component of the phospholipid metabolism of cell membranes. It is known that MRS may be used to diagnose malignancy; usually by measuring the choline peak. Absolute quantification of hepatic metabolite concentrations offers several advantages for the evaluation of in vivo MRS data. Unfortunately, absolute quantification of choline-containing compounds is impractical for most clinical applications. A few studies of in vivo MRS have reported an increase in choline-containing compounds relative to lipids within tumors such as hepatocellular carcinoma, and a reduction in the lipid-to-choline ratio after transarterial embolization for hepatocellular carcinoma. However, the ability to distinguish reliably benign and malignant tumors from normal liver parenchyma has yet to be established. A major limitation is the observation that relatively large amounts of choline-containing compounds may occur even in normal liver[8-13].
Knowledge of the normal findings associated with age and body mass index (BMI) is valuable. Therefore, the central questions of our study were: (1) does choline/lipid2 (Cho/Lip2) have a relationship with BMI? and (2) does Cho/Lip2 have a relationship with age? Finally, we try to explain why no observable choline peak was detected on liver MRS in obese and elderly individuals.
The study was approved by our institutional review board, and written informed consent was obtained from all patients. We evaluated non-hepatic disease and fatty liver in 58 patients (29 men, 29 women; age range, 19-65 years; median age, 42 years) with no history of liver disease and with normal liver function test results. The mean height of the cohort was 164.4 ± 7.4 cm (range, 150-178 cm), mean body weight was 62.7 ± 11.3 kg (range, 39-93 kg), and mean BMI was 23.1 ± 3.3 (range, 16.9-30.4).
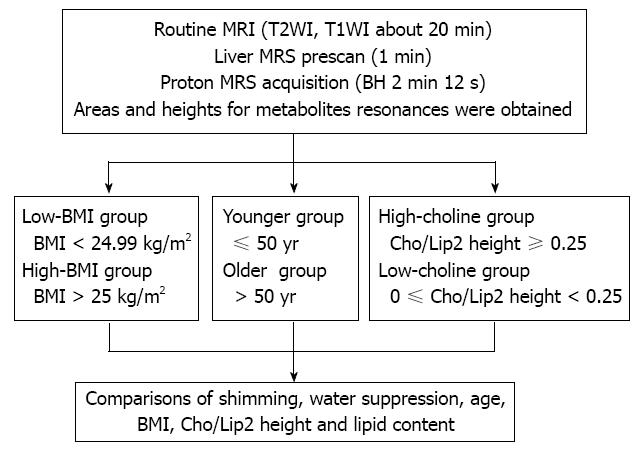
MRS was performed using a GE Signa 3.0 T whole-body system (GE Signa Excite HD; GE Medical Systems, Milwaukee, WI, United States) with the standard proton MRS acquisition software provided by the manufacturer. The body coil was used as the transmitter, and a torso phased-array coil (eight coils, four anterior and four posterior coils; Waukesha, WI, United States) was used as the receiver. Single-volume spin-echo point-resolved spectroscopy was used with parameters of 1500/30/64 [repetition time (TR)/echo time (TE)/excitations] in all patients. The patients entered the magnetic field in the supine position with their feet first. The total acquisition time (2 min 12 s per scan) was split into consecutive blocks to match the length of a breath-hold period of about 15-40 s, while data acquisition was performed at end expiration. Volume of interest of 2 cm × 2 cm × 2 cm was localized in the middle portion of the right hepatic lobe, on the basis of T2-weighted single-shot fast spin-echo pictures in the transverse planes with a TR of 935 ms, TE of 83 ms, a matrix of 288 × 192, field of view of 40 cm, section thickness of 8 mm, an intersection gap of 1.5 mm, and a number of excitations of 0.62. The voxel was localized in such a way as to avoid large vessels, bile ducts, and fatty tissue (Figure 1).
After acquisition, data were processed by using the MR spectroscopic analysis package provided by the manufacturer (SAGE 7.1; GE Medical Systems). The raw data were zero-filled once, apodized with a 5-Hz Gaussian filter, Fourier transformed, and phase and baseline corrected. Marquardt curve fitting was performed by using a Gaussian line shape to calculate the area under the peak. MR spectroscopic data were analyzed by a single medical physicist (Xu L) with > 7 years experience in MRS analysis. For each MRS measurement of unsuppressed water, we normalized the amplitude of the lipid signal to the sum of the lipid plus water signals to obtain the percentage lipid within the liver.
For all data acquisition, water suppression was performed using a series of three chemical-shift-selective pulses with predefined flip angles to leave a significant amount of residual water in the spectrum, and high-order shimming followed by automatic local shimming adjustment was used. Line widths (full-width half-maximum) and water suppression were obtained.
The study group was divided into two subgroups: low BMI (< 24.99 kg/m2) and high BMI group (> 25 kg/m2). The participants were divided into two subgroups according to age: younger (≤ 50 years) and older (> 50 years). The participants were divided into two subgroups based on the Cho/Lip2 ratio: high choline (Cho/Lip2 ≥ 0.25) and low/non-choline (0 ≤ Cho/Lip2 < 0.25) (Figure 1).
For all tests, P < 0.05 was considered to indicate statistically significant differences. Statistical analysis was performed using SPSS version 10.0.1 (SPSS, Chicago, IL, United States). Using Spearman’s correlation, we determined the relationship between Cho/Lip2 and BMI, and between Cho/Lip2 and age.
Student’s t test for unpaired data was used for comparison of shimming, Cho/Lip2 and lipid content between the low-BMI and high-BMI groups, and between the younger and older groups. Student’s t test for unpaired data was also used for comparison of shimming, BMI and age between the high-choline and non-choline groups.
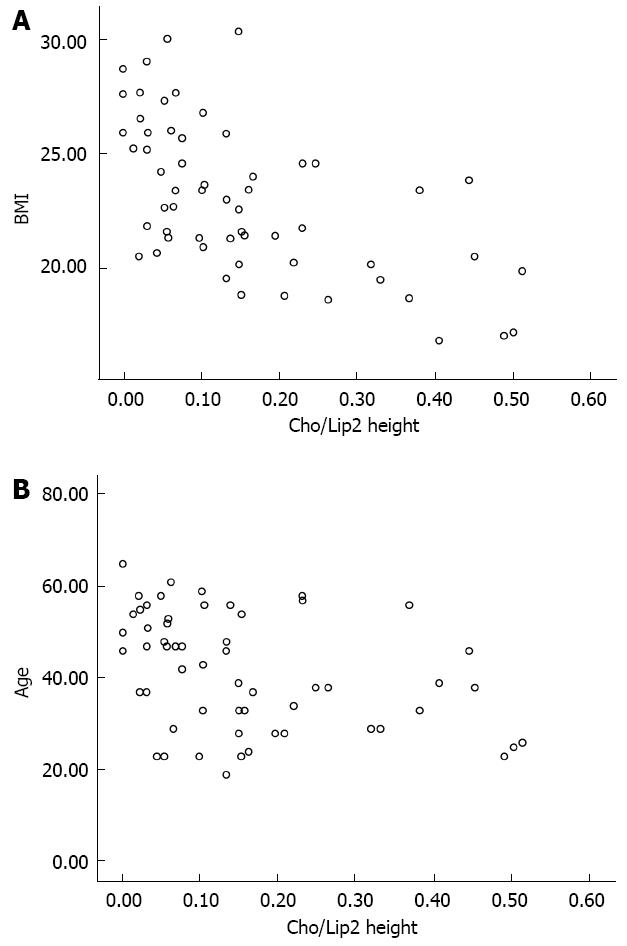
The scatter plots were used to reveal the relationships between the variables (Figure 2). There were significant negative correlations between the Cho/Lip2 peak heights ratios and BMI (r = -0.615, P < 0.000), and age (r = -0.398, P = 0.002).
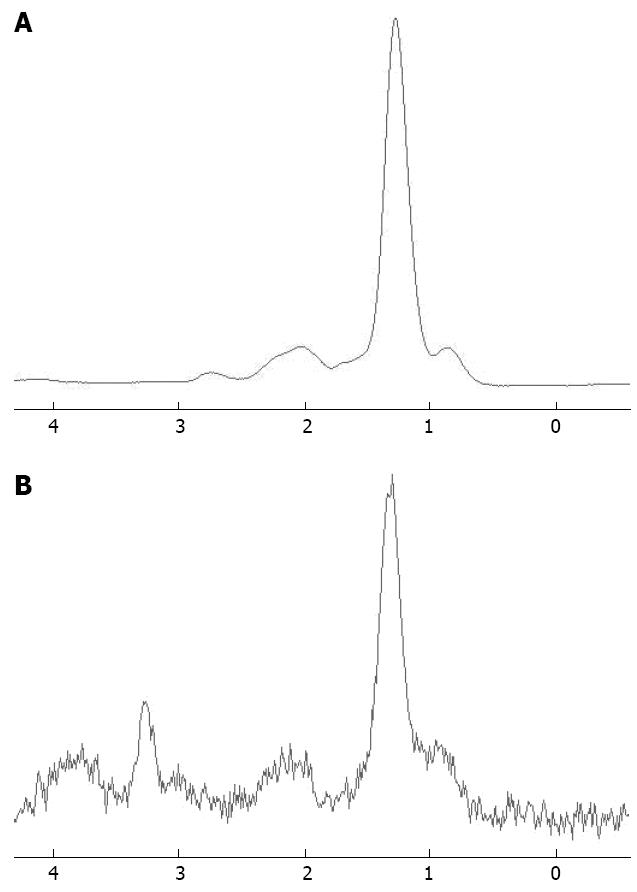
Compared with the high-BMI group, the low-BMI group was younger (39.1 ± 13.0 years vs 47.6 ± 8.5 years, t = -2.954, P = 0.005); had better water suppression (93.4% ± 1.4% vs 85.6% ± 11.6%, t = 2.741, P = 0.014); had higher Cho/Lip2 peak heights ratios (0.20 ± 0.14 vs 0.05 ± 0.04, t = 6.033, P < 0.000); and had lower lipid content (0.03 ± 0.08 vs 0.29 ± 0.31, t = -3.309, P = 0.004) (Figure 3).
Compared with the older group, the younger group had better shimming effects (17.1 ± 3.6 Hz vs 22.0 ± 6.8 Hz, t = -2.919, P = 0.008); higher Cho/Lip2 peak heights ratios (0.03 ± 0.05 vs 0.09 ± 0.12, t = 2.4, P = 0.020); and lower lipid content (0.05 ± 0.11 vs 0.23 ± 0.32, t = -2.337, P = 0.031) (Figure 3).
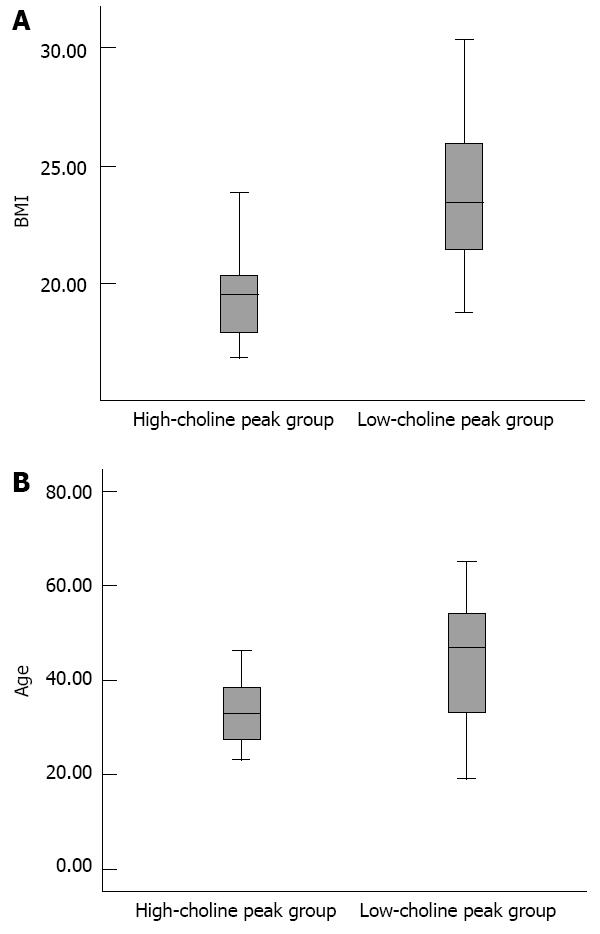
Compared with the low-choline group, the high-choline group had lower lipid content (0.005 ± 0.002 vs 0.13 ± 0.23, t = -3.796, P < 0.000); lower BMI (19.6 ± 2.4 vs 23.9 ± 3.0, t = -4.410, P < 0.000); and younger age (34.7 ± 10.0 years vs 43.2 ± 12.5 years, t = -2.088, P = 0.041) (Figure 4).
MRS at 3.0 T provides improved SNR and spectral resolution compared with 1.5 T MRI scanners, therefore, it is expected to yield more reliable measurements of metabolite concentrations[6,8,14]. The principal metabolite that has been targeted in focal liver disease is choline. In general, choline is elevated in tumors, because choline is a cell membrane component and increased cell turnover is associated with malignancy. In vivo1H MRS has proved valuable in the diagnosis of tumors in the brain, prostate, breast, and uterine cervix. 1H MRS is also useful for evaluation of treatment responses in malignant tumors of the head and neck, as well as in breast cancer[1,13,15-17].
However, the ability to distinguish reliably benign and malignant tumors from normal liver parenchyma has yet to be established. According to the data from our study, the lipid content in liver parenchyma increased with both age and BMI; there were significant negative correlations between Cho/Lip2 and age; and there was no observable choline peak in obese and elderly individuals. Possible reasons for the above conclusions include: (1) the lipid content in liver parenchyma increased with both age and BMI; and (2) the choline level in liver parenchyma changed with both age and BMI.
The signals of the corresponding lipid groups can be observed at 1.3 ppm for (-CH2) n and 0.9 ppm for (-CH3), and between 2.0 and 2.3 ppm for (-CH=CH-CH2-), with signals of markedly lower intensity. In this study, the analysis of the spectra only focused on the concentrations of (-CH2) n. The lipid content in liver parenchyma increased with both age and BMI. This conclusion has been confirmed by Müller et al[1] and Fischbach et al[18]. Assuming that all of the metabolites that contribute to the choline peak remain constant, when the lipid volume fraction is high, the choline fraction should decrease in signal intensity. In other words, the hydrogen found in lipid can produce very strong resonance signals that can mask the resonance signal of lower concentration compounds of interest, usually metabolites such as choline[18-23].
Choline is a nutrient essential for normal function of all cells. It is a precursor not only for acetylcholine but also for phospholipids that are found in intracellular membranes and in the cell membrane. The liver parenchyma already contains large choline metabolite pools. Although catabolic and anabolic reactions are predominant in the liver, leading to elevated choline-containing compounds (CCC) levels. Aging and high BMI may decrease hepatic metabolism, resulting in lower choline concentration. Unfortunately, this conclusion has not been confirmed by previous studies. Fischbach et al[18] have acquired 113 spectra in normal-appearing parenchyma. The mean ± SD of the normalized measurements of CCC for the younger group (≤ 40 years) and the older group (> 40 years) was 8.14 ± 6.0 and 7.20 ± 4.32, respectively. The researchers found that no significant differences were observed.
The presence of a large lipid peak should in principle not influence the fitting of the choline peak. It is known that the concentration of lipid in human liver is 10-1000 times greater than that of most tissue metabolites such as choline. Consequently, the signal of lipid is dominant in 1H-MRS in some cases. Experimental evidence suggests that spectroscopic data, or metabolic measurements, may be affected by a dominant lipid peak, which makes visualization of the metabolites of interest difficult. This is because the large lipid peak overlaps with adjacent small peaks, and scaling the signal intensity is difficult. This is the reason why no observable choline peak was detected on liver MRS in obese and elderly individuals. To compensate, fat-suppression techniques are recommended for hepatic MRS to distinguish benign and malignant tumors from normal liver parenchyma[23-26].
This technique has its limitations in methodology. Although we used a 3.0 T MR imager and shorter TE to increase SNR, spectra containing only noise without any identifiable choline metabolite peaks still existed in a few cases. High-field MRI equipment and/or advanced techniques, such as nuclear Overhauser effect enhancement and proton decoupling, may demonstrate improved SNRs and spectral resolution between MRS peaks. The application of those new techniques may be necessary to answer this question.
In conclusion, Lipid accumulation in the liver could result from increased fat in the body, depending on age and BMI. Hydrogen found in subjects with lipid accumulation can produce very strong resonance signals that can mask the resonance signal of lower concentration compounds such as choline. This is the reason why no observable choline peak was detected on liver MRS in obese and elderly individuals. Fat suppression techniques are recommended for hepatic MRS to distinguish benign and malignant tumors from normal liver parenchyma.
It is known that magnetic resonance spectroscopy (MRS) can be used to diagnose malignancy; usually by measuring the choline peak. A major limitation is the observation that relatively large amounts of choline-containing compounds may occur even in normal liver. Knowledge of the normal findings associated with age and body mass index (BMI) is valuable.
A few studies of in vivo MRS have reported an increase in choline-containing compounds relative to lipids within tumors such as hepatocellular carcinoma, and a reduction in the lipid-to-choline ratio after transarterial embolization for hepatocellular carcinoma. However, the ability to distinguish reliably benign and malignant tumors from normal liver parenchyma has yet to be established.
The ability to distinguish reliably benign and malignant tumors from normal liver parenchyma has yet to be established. According to the data from this study, the lipid content in liver parenchyma increased with both age and BMI, there was a significant negative correlation between choline/lipid2 (Cho/Lip2) and age, and there was no observable choline peak in obese and elderly individuals.
Fat suppression techniques are recommended for hepatic MRS to distinguish benign and malignant tumors from normal liver parenchyma.
Breathholding either eliminated or markedly reduced phase and frequency shifts and outer voxel contamination that were associated with the motion of the abdomen during breathing.
The authors investigated the normal hepatic MRS findings (Cho/Lip2) associated with age and BMI. The study was well designed, and this paper is important and interesting.
P- Reviewer Buell J S- Editor Wen LL L- Editor A E- Editor Li JY
| 1. | Müller C, Hübner F, Bisdas S, Herzog C, Hammerstingl RM, Ackermann H, Vorbuchner M, Vogl TJ. In vivo proton MR spectroscopy of normal liver parenchyma: technique and results. Rofo. 2006;178:1128-1136. [PubMed] [DOI] [Cited in This Article: ] [Cited by in Crossref: 2] [Cited by in F6Publishing: 4] [Article Influence: 0.2] [Reference Citation Analysis (0)] |
| 2. | Chen CY, Li CW, Kuo YT, Jaw TS, Wu DK, Jao JC, Hsu JS, Liu GC. Early response of hepatocellular carcinoma to transcatheter arterial chemoembolization: choline levels and MR diffusion constants--initial experience. Radiology. 2006;239:448-456. [PubMed] [DOI] [Cited in This Article: ] [Cited by in Crossref: 128] [Cited by in F6Publishing: 143] [Article Influence: 7.9] [Reference Citation Analysis (0)] |
| 3. | Cho SG, Kim MY, Kim HJ, Kim YS, Choi W, Shin SH, Hong KC, Kim YB, Lee JH, Suh CH. Chronic hepatitis: in vivo proton MR spectroscopic evaluation of the liver and correlation with histopathologic findings. Radiology. 2001;221:740-746. [PubMed] [DOI] [Cited in This Article: ] [Cited by in Crossref: 68] [Cited by in F6Publishing: 74] [Article Influence: 3.2] [Reference Citation Analysis (0)] |
| 4. | Thomas EL, Hamilton G, Patel N, O’Dwyer R, Doré CJ, Goldin RD, Bell JD, Taylor-Robinson SD. Hepatic triglyceride content and its relation to body adiposity: a magnetic resonance imaging and proton magnetic resonance spectroscopy study. Gut. 2005;54:122-127. [PubMed] [DOI] [Cited in This Article: ] [Cited by in Crossref: 240] [Cited by in F6Publishing: 245] [Article Influence: 12.9] [Reference Citation Analysis (0)] |
| 5. | Kuo YT, Li CW, Chen CY, Jao J, Wu DK, Liu GC. In vivo proton magnetic resonance spectroscopy of large focal hepatic lesions and metabolite change of hepatocellular carcinoma before and after transcatheter arterial chemoembolization using 3.0-T MR scanner. J Magn Reson Imaging. 2004;19:598-604. [PubMed] [DOI] [Cited in This Article: ] [Cited by in Crossref: 67] [Cited by in F6Publishing: 74] [Article Influence: 3.7] [Reference Citation Analysis (0)] |
| 6. | Katz-Brull R, Rofsky NM, Lenkinski RE. Breathhold abdominal and thoracic proton MR spectroscopy at 3T. Magn Reson Med. 2003;50:461-467. [PubMed] [DOI] [Cited in This Article: ] [Cited by in Crossref: 58] [Cited by in F6Publishing: 61] [Article Influence: 2.9] [Reference Citation Analysis (0)] |
| 7. | Xu L, Liang CH, Huang B, Tan SH, Cen D, Cui YH, Xiao YQ. Effects of contrast agent on water suppression and shimming of kidney single-volume proton MR spectroscopy at 3.0T. Acad Radiol. 2010;17:1462-1467. [PubMed] [DOI] [Cited in This Article: ] [Cited by in Crossref: 4] [Cited by in F6Publishing: 5] [Article Influence: 0.4] [Reference Citation Analysis (0)] |
| 8. | Di Costanzo A, Trojsi F, Tosetti M, Schirmer T, Lechner SM, Popolizio T, Scarabino T. Proton MR spectroscopy of the brain at 3 T: an update. Eur Radiol. 2007;17:1651-1662. [PubMed] [DOI] [Cited in This Article: ] [Cited by in Crossref: 52] [Cited by in F6Publishing: 56] [Article Influence: 3.3] [Reference Citation Analysis (0)] |
| 9. | Haddadin IS, McIntosh A, Meisamy S, Corum C, Styczynski Snyder AL, Powell NJ, Nelson MT, Yee D, Garwood M, Bolan PJ. Metabolite quantification and high-field MRS in breast cancer. NMR Biomed. 2009;22:65-76. [PubMed] [DOI] [Cited in This Article: ] [Cited by in Crossref: 120] [Cited by in F6Publishing: 89] [Article Influence: 5.9] [Reference Citation Analysis (0)] |
| 10. | Sardanelli F, Fausto A, Podo F. MR spectroscopy of the breast. Radiol Med. 2008;113:56-64. [PubMed] [DOI] [Cited in This Article: ] [Cited by in Crossref: 35] [Cited by in F6Publishing: 36] [Article Influence: 2.3] [Reference Citation Analysis (0)] |
| 11. | Yamamoto T. MRS for diagnosis of brain tumors. Nihon Rinsho. 2005;63 Suppl 9:222-227. [PubMed] [Cited in This Article: ] |
| 12. | Mueller-Lisse UG, Scherr MK. Proton MR spectroscopy of the prostate. Eur J Radiol. 2007;63:351-360. [PubMed] [DOI] [Cited in This Article: ] [Cited by in Crossref: 62] [Cited by in F6Publishing: 48] [Article Influence: 2.8] [Reference Citation Analysis (0)] |
| 13. | Fayad LM, Barker PB, Jacobs MA, Eng J, Weber KL, Kulesza P, Bluemke DA. Characterization of musculoskeletal lesions on 3-T proton MR spectroscopy. AJR Am J Roentgenol. 2007;188:1513-1520. [PubMed] [DOI] [Cited in This Article: ] [Cited by in Crossref: 51] [Cited by in F6Publishing: 56] [Article Influence: 3.3] [Reference Citation Analysis (0)] |
| 14. | Lange MC, Braatz VL, Tomiyoshi C, Nóvak FM, Fernandes AF, Zamproni LN, Piovesan EJ, Nóvak EM, Teive HA, Werneck LC. Neurological diagnoses in the emergency room: differences between younger and older patients. Arq Neuropsiquiatr. 2011;69:212-216. [PubMed] [Cited in This Article: ] |
| 15. | Fayad LM, Wang X, Salibi N, Barker PB, Jacobs MA, Machado AJ, Weber KL, Bluemke DA. A feasibility study of quantitative molecular characterization of musculoskeletal lesions by proton MR spectroscopy at 3 T. AJR Am J Roentgenol. 2010;195:W69-W75. [PubMed] [DOI] [Cited in This Article: ] [Cited by in Crossref: 37] [Cited by in F6Publishing: 40] [Article Influence: 2.9] [Reference Citation Analysis (0)] |
| 16. | Bolan PJ, Meisamy S, Baker EH, Lin J, Emory T, Nelson M, Everson LI, Yee D, Garwood M. In vivo quantification of choline compounds in the breast with 1H MR spectroscopy. Magn Reson Med. 2003;50:1134-1143. [PubMed] [Cited in This Article: ] |
| 17. | Fischbach F, Bruhn H. Assessment of in vivo 1H magnetic resonance spectroscopy in the liver: a review. Liver Int. 2008;28:297-307. [PubMed] [DOI] [Cited in This Article: ] [Cited by in Crossref: 52] [Cited by in F6Publishing: 57] [Article Influence: 3.6] [Reference Citation Analysis (0)] |
| 18. | Fischbach F, Schirmer T, Thormann M, Freund T, Ricke J, Bruhn H. Quantitative proton magnetic resonance spectroscopy of the normal liver and malignant hepatic lesions at 3.0 Tesla. Eur Radiol. 2008;18:2549-2558. [PubMed] [DOI] [Cited in This Article: ] [Cited by in Crossref: 35] [Cited by in F6Publishing: 40] [Article Influence: 2.5] [Reference Citation Analysis (0)] |
| 19. | Martin K. Concentrative accumulation of choline by human erythrocytes. J Gen Physiol. 1968;51:497-516. [PubMed] [DOI] [Cited in This Article: ] [Cited by in Crossref: 136] [Cited by in F6Publishing: 158] [Article Influence: 2.8] [Reference Citation Analysis (0)] |
| 20. | Qayyum A. MR spectroscopy of the liver: principles and clinical applications. Radiographics. 2009;29:1653-1664. [PubMed] [DOI] [Cited in This Article: ] [Cited by in Crossref: 73] [Cited by in F6Publishing: 83] [Article Influence: 5.9] [Reference Citation Analysis (0)] |
| 21. | Sijens PE. Parametric exploration of the liver by magnetic resonance methods. Eur Radiol. 2009;19:2594-2607. [PubMed] [DOI] [Cited in This Article: ] [Cited by in Crossref: 26] [Cited by in F6Publishing: 28] [Article Influence: 1.9] [Reference Citation Analysis (0)] |
| 22. | McPherson S, Jonsson JR, Cowin GJ, O’Rourke P, Clouston AD, Volp A, Horsfall L, Jothimani D, Fawcett J, Galloway GJ. Magnetic resonance imaging and spectroscopy accurately estimate the severity of steatosis provided the stage of fibrosis is considered. J Hepatol. 2009;51:389-397. [PubMed] [DOI] [Cited in This Article: ] [Cited by in Crossref: 127] [Cited by in F6Publishing: 134] [Article Influence: 8.9] [Reference Citation Analysis (0)] |
| 23. | Reeder SB, Robson PM, Yu H, Shimakawa A, Hines CD, McKenzie CA, Brittain JH. Quantification of hepatic steatosis with MRI: the effects of accurate fat spectral modeling. J Magn Reson Imaging. 2009;29:1332-1339. [PubMed] [DOI] [Cited in This Article: ] [Cited by in Crossref: 190] [Cited by in F6Publishing: 198] [Article Influence: 13.2] [Reference Citation Analysis (0)] |
| 24. | van Werven JR, Hoogduin JM, Nederveen AJ, van Vliet AA, Wajs E, Vandenberk P, Stroes ES, Stoker J. Reproducibility of 3.0 Tesla magnetic resonance spectroscopy for measuring hepatic fat content. J Magn Reson Imaging. 2009;30:444-448. [PubMed] [DOI] [Cited in This Article: ] [Cited by in Crossref: 57] [Cited by in F6Publishing: 59] [Article Influence: 3.9] [Reference Citation Analysis (0)] |
| 25. | Zhong L, Chen JJ, Chen J, Li L, Lin ZQ, Wang WJ, Xu JR. Nonalcoholic fatty liver disease: quantitative assessment of liver fat content by computed tomography, magnetic resonance imaging and proton magnetic resonance spectroscopy. J Dig Dis. 2009;10:315-320. [PubMed] [DOI] [Cited in This Article: ] [Cited by in Crossref: 28] [Cited by in F6Publishing: 32] [Article Influence: 2.1] [Reference Citation Analysis (0)] |
| 26. | Cobbold JF, Patel JH, Goldin RD, North BV, Crossey MM, Fitzpatrick J, Wylezinska M, Thomas HC, Cox IJ, Taylor-Robinson SD. Hepatic lipid profiling in chronic hepatitis C: an in vitro and in vivo proton magnetic resonance spectroscopy study. J Hepatol. 2010;52:16-24. [PubMed] [Cited in This Article: ] |


