Article

Evaluation of the Degree of Polymerization of the Proanthocyanidins in Cranberry by Molecular Sieving and Characterization of the Low Molecular Weight Fractions by UHPLC-Orbitrap Mass Spectrometry

DeFENS—Department of Food, Environmental and Nutritional Sciences, Università degli Studi di Milano, Via Celoria 2, 20133 Milano, Italy
*
Author to whom correspondence should be addressed.
Molecules 2019, 24(8), 1504; https://doi.org/10.3390/molecules24081504
Submission received: 27 March 2019 / Revised: 9 April 2019 / Accepted: 15 April 2019 / Published: 17 April 2019
(This article belongs to the Section Natural Products Chemistry)

Abstract

:
4-dimethylammino-cinnamaldehyde (DMAC) assays quantify total proanthocyanidins (PACs) but do not provide qualitative PAC molecular weight distribution information and cannot discriminate between A- and B-type PACs. We developed an efficient method for assessing PAC molecular weight distributions. The PACs from three commercial cranberry extracts (A1–A3) were fractionated by molecular sieves with cut-offs of 3, 10, 30, 50, and 100 kDa, and each fraction was analyzed by DMAC assays. A1, A2, and A3 contained 27%, 33%, and 15% PACs, respectively. Approximately 28 PACs, 20 flavonols, and 15 phenolic acids were identified by UHPLC-DAD-Orbitrap MS in A1 and A3, while A2 contained only flavan-3-ols. Epicatechin was the main monomer in A1 and A3, and catechin was the main in A2. Procyanidin A2 was the main dimer in A1 and A3, representing more than 85% of the total dimers, while it constituted approximately only 24% of A2. A1 and A3 contained quercetin, isorhamnetin, myricetin, and their glycosides, which were totally absent in A2. In A1 and A3 the PACs were mainly distributed in the fractions 30–3 and <3 kDa, while in A2 more than 70% were present in the fraction less than 3 kDa. Overall, obtained data strongly suggests that A2 is not cranberry-derived, or is adulterated with another source of PACs.

Graphical Abstract

1. Introduction

Cranberry, Vaccinium macrocarpon, has various biological benefits for human health including the prevention of microbial adhesion in urinary tract infections (UTIs) [1], reduction in biofilm formation [2], antioxidant action [3], cholesterol reduction [4], and anticancer effects [5]. In particular, UTIs are very common and are responsible for approximately 10 million doctor visits annually in the USA [6], and it has been estimated that about 30% of women diagnosed with a UTI will suffer a recurrence within six months [7].
Several mechanisms have been proposed for the actions of cranberry in the prevention of UTIs, with attention especially on its interference with bacterial adhesion in the urinary tract [1].
Cranberry has a complex phytochemical composition including mainly flavon-3-ols, anthocyanins, aromatic acid, and monomeric flavan-3-ols together with oligomeric and polymeric proanthocyanidins (PACs), respectively [8]. Flavanones and stilbenes has been found in cranberries in lower amounts [9].
Cranberry flavon-3-ols occur mainly as glycosylated forms of quercetin, myricetin, and kaempferol, respectively [10], and their total amount in the fruit is in the range of 0.3–0.5 mg/kg [11].
Regarding anthocyanins, cranberry seems to have a unique qualitative profile [12]. Indeed, fruit contains four main anthocyanins corresponding to peonidin-galactoside, peonidin-arabinoside, cyanidin-arabinoside, and cyanidin-galactoside. Peonidin-glucoside and cyanidin-glucoside have been found in lower amounts. The monomeric anthocyanin content ranged from 25 to 70 mg/100 g FW, and galactosides, arabinosides, and glucosides comprised approximately 53, 42, and 5% of the total anthocyanins, respectively [12,13,14].
Among these phytochemicals, anti-UTI action has been attributed to the proanthocyanidin fraction [15]. The oligomeric and polymeric nature of PACs has several structural variations depending on the degree of polymerization (DP), linkage types [i.e., C-C bond (B-type) or a CC- and ether bond (A-type)], interflavan bond positions (describe C-C positions), and type of monomeric units. Catechin and epicatechin are the two most common flavan-3-ol units present in PACs. Gallocatechin and epigallocatechin units, which present an additional hydroxyl group, are also present [16]. Since these four monomers and the several different linkages can be distributed randomly within the polymer, the number of possible isomers of PACs increases exponentially with the degree of polymerization. For example, for a 20-unit degree of polymerization, approximately five hundred thousand PACs are theoretically possible [16]. In addition, at DP greater than 2, both A- and B-types may be present. Because of these issues, and the lack of reference standards, PAC quantification has been problematic. Thiolysis has been used to estimate the average DP of cranberry. DPs of 4.7 and 8.5 have been reported [17,18] and subsequently, by MALDI-TOF MS, a DP higher than 23 has been detected [16]. Establishing the DP of PACs in cranberry is problematic because what is detected in a given sample depends on several factors, such as the origins of the plant materials and methods of preparation used.
Due to the complexity of PACs in terms of the large ranges of molecular weights and linkage types, currently there is no universally accepted standard method for their quantification. The methods currently in use to quantify total PACs include those based on hydrolysis in an acidic solution with the formation of colored compounds (Bate-Smith), and on hydrolysis with the production of monomers that are determined by HPLC (thiolysis and phloroglucinolysis), gravimetric, and colorimetric (vanillin or 4-dimethylamino-cinnamaldehyde (DMAC)) analyses. Among these, the most used are the Bate-Smith, vanillin acid, and DMAC assays. In the Bate-Smith assay, PACs are hydrolyzed in n-butanol-HCl to produce anthocyanidins, which are then quantified spectrophotometrically at 520–550 nm [19]. The Bate-Smith assay has drawbacks, such as possible incomplete PAC hydrolysis and transformation, and the lack of a suitable extinction percentage coefficient.
In the vanillin acid assay, the aldehyde group reacts with PACs, forming a colored derivative that absorbs at 510 nm. The presence of anthocyanins may confound the measured absorbance, and compounds such as ascorbic acid and other flavonoids may lead to overestimation of the PAC amount [20,21].
Regarding the DMAC assay, in acidic solutions, the reagent gives a strongly reactive electrophilic carbocation that reacts selectively with compounds with meta-oriented di- or tri-hydroxyl phenols, as found in PACs. The reaction produces a green derivative that absorbs at 640 nm. DMAC does not react with hydroxyl-phenylalkyl acids, ascorbic acid, or other flavonoids. Thus, it seems more specific and reproducible than the Bate-Smith and vanillin assays. The belief that the molar absorption coefficient is constant across the various PAC species is the most significant reason why the DMAC assay is preferred to this day [22]. However, Feliciano et al. showed that the standard used in the DMAC assay, procyanidin A2, leads to an underestimation of the PAC content in cranberry products, especially those containing higher molecular weight PACs [23]. Indeed, the slope of the PAC standard curve was 2.5 times lower than those of procyanidins A2 and B2 were, and it was 7.1 times lower than that of catechin, indicating that the PAC content in cranberry would be underestimated by 2.5- or 7-fold if these standards were used for the DMAC assay.
The reported methods give quantitative information, but they do not provide qualitative information on PAC molecular weight distributions, nor can they discriminate between A- and B-type PACs.
To get qualitative information, PACs have been analyzed by MALDI-TOF [16,24] or liquid chromatography coupled to low- [25,26,27,28] or high-resolution mass spectrometers [29,30,31]. These techniques allow the determination of both the low molecular weight PACs (DP < 10) and the distinction between type A and B. All too often, though, the PACs must be isolated from the matrix before analysis, and this requires lengthy and time-consuming methods such as those that need open-column chromatography [32,33].
The purpose of our study was to develop a simple method for fractioning PACs from cranberry extracts. Thus, the PACs of three different commercial extracts were split by ultra-centrifugal filter with cut-offs of 3, 10, 30, 50, and 100 kDa, and each fraction was analyzed by the DMAC assay to assess total PACs. Finally, the fractions lower than 3 KDa were also analyzed by UHPLC-DAD-Orbitrap MS to determine monomers and oligomers.

2. Results

2.1. Total Amount of PACs in Commercial Extracts

The use of procyanidin A2 as a standard for the DMAC assay has been shown to underestimate total PACs content compared to cranberry-derived PACs. Nevertheless, in this study the evaluation of total PACs was carried out using PA2 for both because it is normally used in quality control laboratories.
The cranberry extracts were entirely soluble in the extraction solution. The total amounts of PACs in A1, A2, and A3, as determined by the DMAC assay, were 27.1 ± 1.1, 33.1 ± 2.1, and 14.7 ± 1.0% (Table 1), respectively. The repeatability and inter-day precision were in the range of 3.9–6.3% and 4.3–7.3%, respectively. These results are in good agreement with those reported by Prior et al. [34].

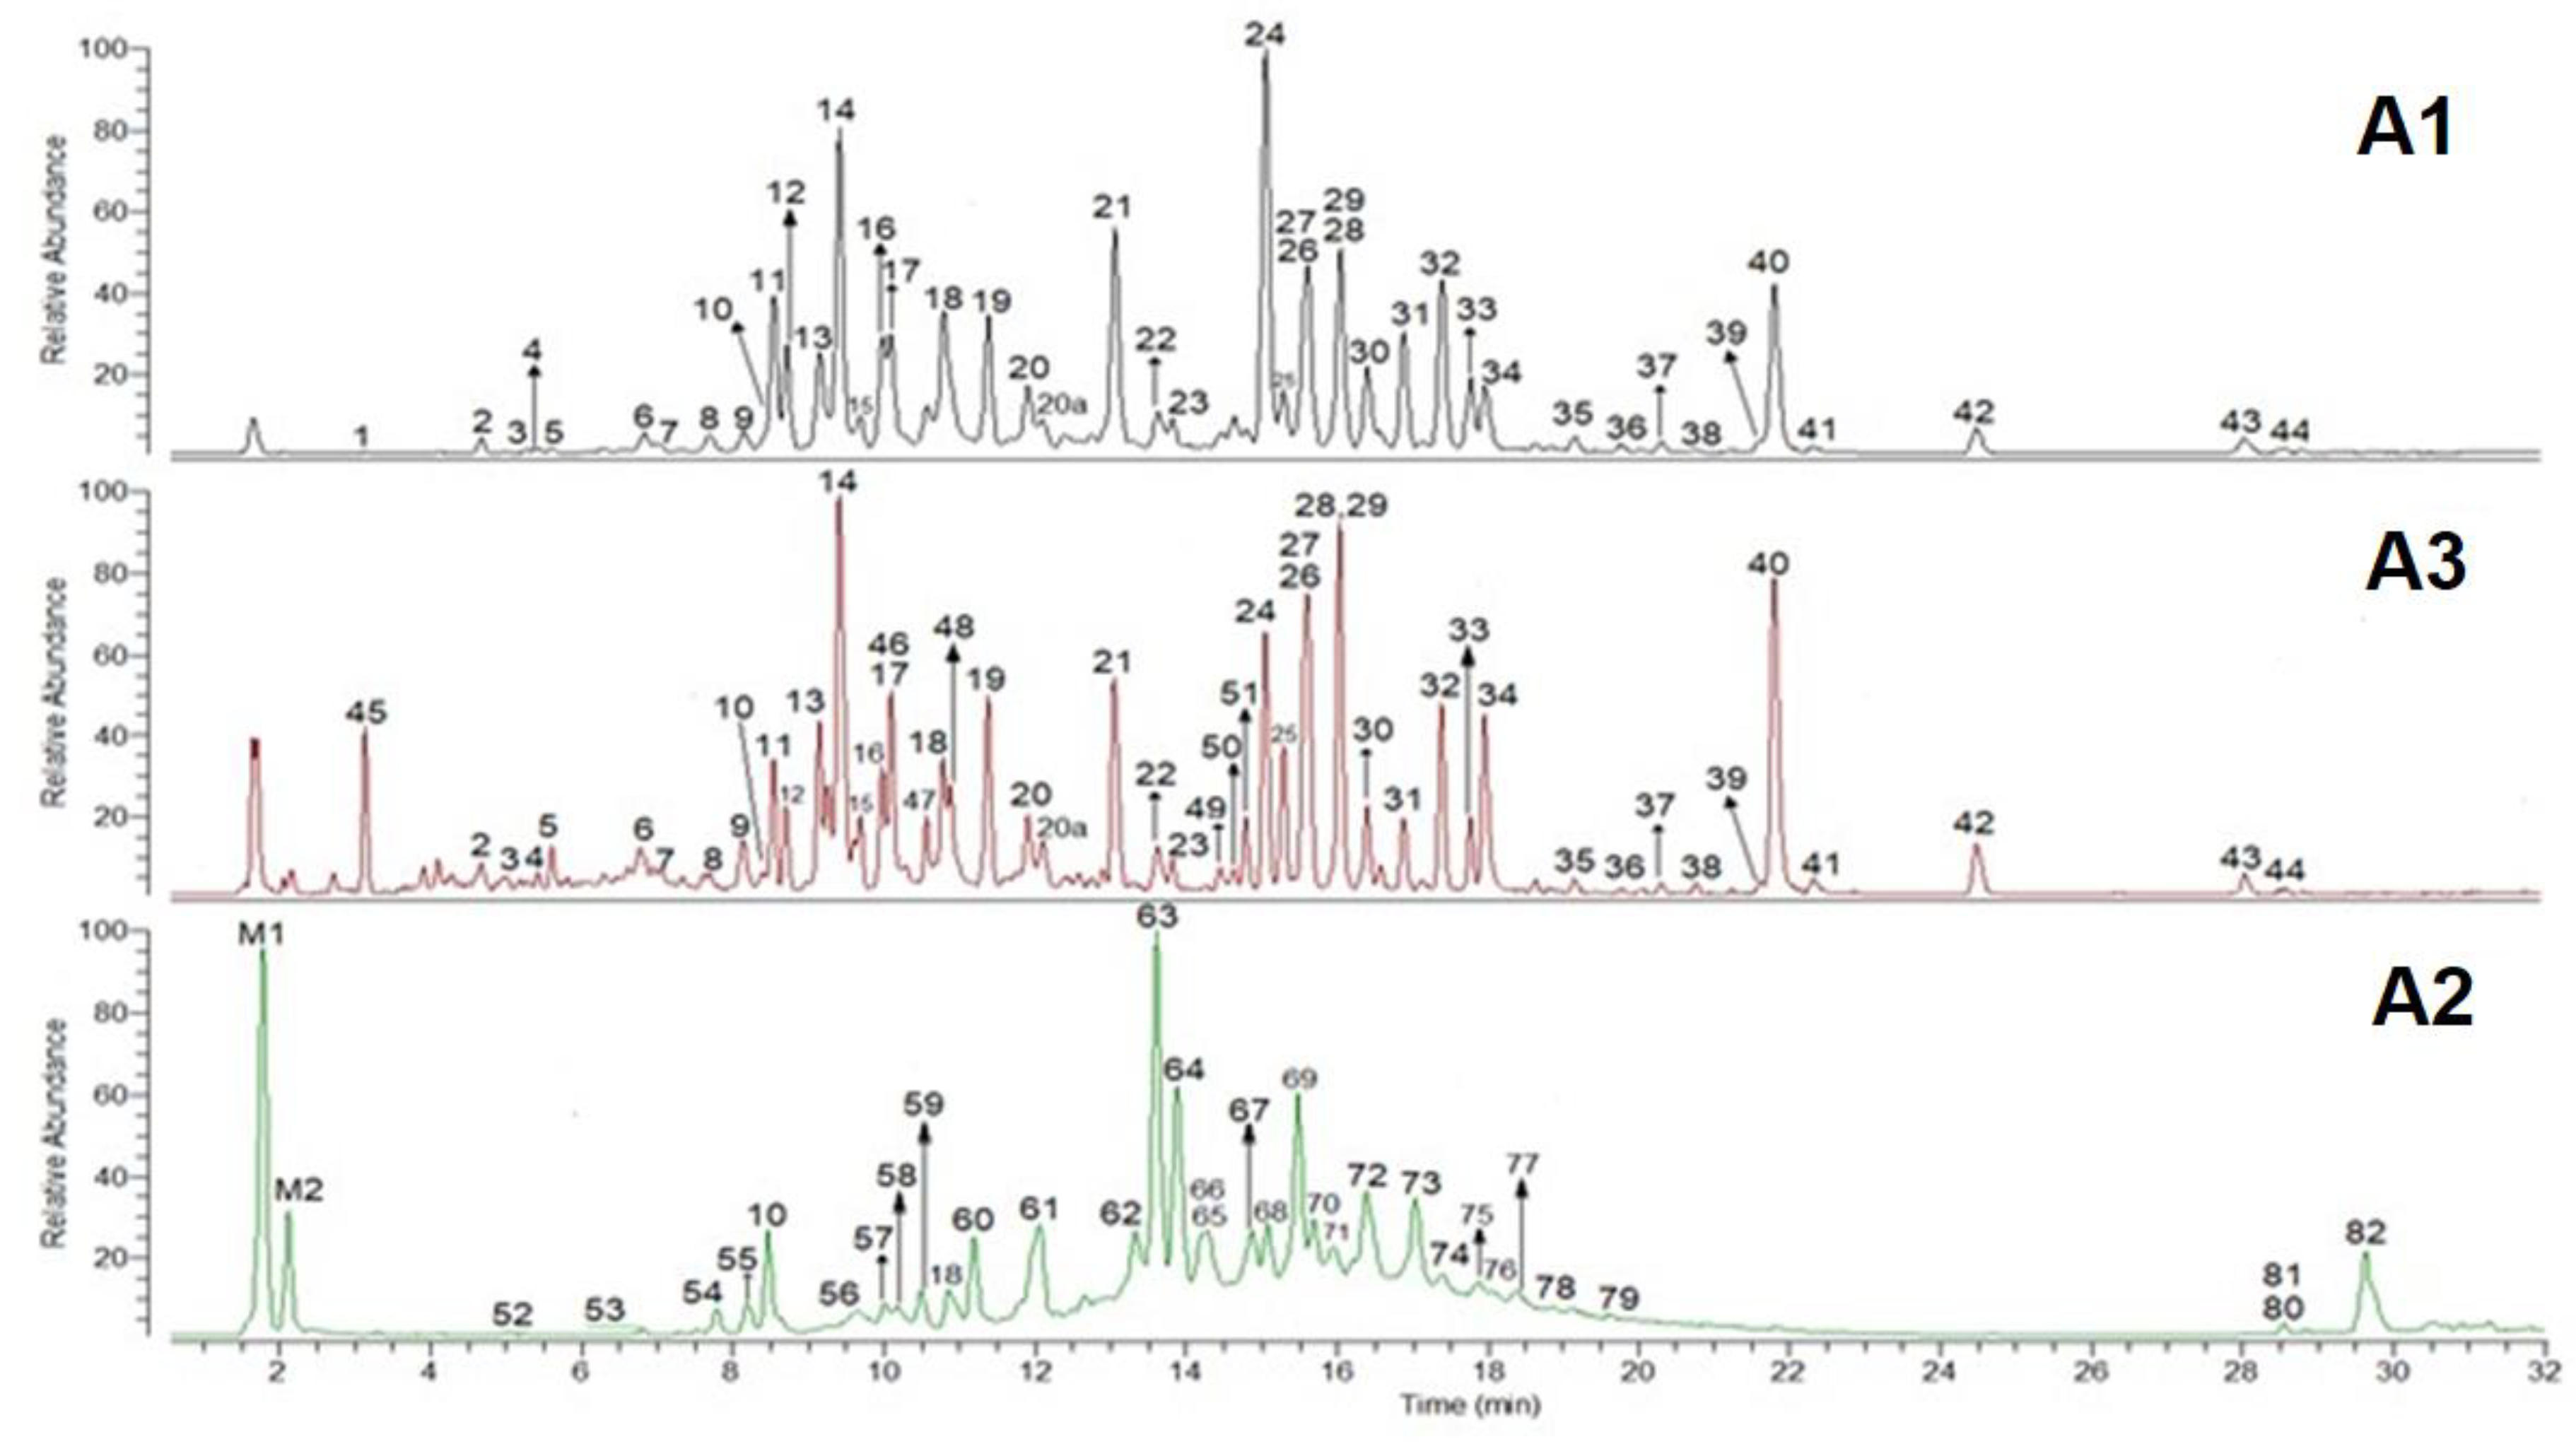
2.2. PACs Determination by UPLC-DAD-Orbitrap MS

Low molecular weight flavan-3-ols in the cranberry extracts have been characterized by reversed phase UHPLC coupled to DAD and Fourier transform mass spectrometers operating in the negative mode. High mass resolution (50 K) and high mass accuracy (2 ppm) allow the empirical formula of deprotonated and fragmented ions to be obtained. These features, together with enhanced efficiency of the UHPLC technique, made the system we used a powerful tool for the identification of unknown analytes in the cranberry extract. Untargeted analysis, however, cannot be done based only on elemental composition data. Additional information is required, such as UV spectra and fragmentation patterns with CIDs of the parent ions. An example of the UHPLC-HR MS profiles of sample A1, A2, and A3, extracted in the range of 100–2000 u, is shown in Figure 1. Table 2 reports the on-line UV spectra, deprotonated ion, and fragments of the main compounds such as flavan-3-ols and flavon-3-ols detected in cranberry extracts.
The main monomers found in all the extracts were EC and CAT. Epicatechin was the main monomer in A1 and A3, representing more than 90% of the total monomers (Table 1). However, CAT was the main monomer in A2, and it accounted for more than 80% of the total monomers. These data are in agreement with some authors’, which reported that in cranberry, epicatechin was more abundant than catechin [28]. Regarding dimers, the A-types were the main dimers in all of the extracts, representing approximately more than 80% of the total dimers in A1 and A2 and 60% in A3 (Table 1). Procyanidin A2 was the main dimer in A1 and A3, representing more than 75% and 60% of the total dimers, respectively. Regarding A2, PA2 was not the main dimer; it constituted approximately 5% of the total dimers. The main dimer in A2 was the peak 63 (Figure 1), retention time (RT) 13.5 min, which constituted approximately 55% of the total dimers.
AB-types were the main trimers in A1, A2, and A3 and represented approximately 72%, 90%, and 76% of the total trimers, respectively. AA-types were not found in A3, while in A1 and A2 they represented approximately 7% of the total trimers. Proanthocyanidin C1 was the main BB-type trimer in A1 and A3, representing approximately 60% of the total BB-types. On the contrary, PC1 was not detected in the extract A2. The main BB-type trimer in A2 was the peak 52, RT 5 min (Figure 1), which constituted approximately 57% of the trimers BB-type.
Catechin and EC showed the same fragmentation pattern, and the most abundant ion had an m/z of 123.0454 u, corresponding to a 3,4-dihydroxy-toluene moiety (B-ring). Dimers of A- and B-type gave a different fragmentation pattern, and the main ions had m/z of 285.0410 (C15H9O6) and 289.0732 u, respectively. Besides the deprotonated ions, the MS spectra of the A- and B-type dimers showed the presence of the dimer [2M-H]-. Adducts with formic acid or doubly charged ions were not detected.
Four main trimers, with an m/z of 863.1830 u, containing one A-type bond, were present in the extract A1 and A2. Three of them had a common fragmentation pattern, and the main ions had m/z of 575.1220, 693.1280, 449.0900, 285.0419, and 711.1388 u. The other AB-trimer, RT 11.9 min, produced mainly ions with m/z of 411.0726 and 289.0721 u. Ions with m/z of 1727.3725 and 1731.4040 u, which corresponded to the dimer [2M − H]-, were present in much lower quantities. Adducts or doubly charged ions were not detected. Two main BB-type trimers, with m/z of 865.1990 u, were present in the extracts A1 and A3, and one of them was PC1, RT 12.1 min. The other trimer had lower retention time, 10 min, indicating that one of the monomers or both could be catechin. These trimers shared the fragment with m/z of 407.0791, 287.0574, 577.1368, and 125.0247 u. In addition, the trimer with RT 10 min also showed a fragment with m/z of 160.0169 u, which matched the formula C9H4O4. The MS spectra of a compound with DP > 3 showed the presence of doubly charged ions [M − 2H]2-. In particular, for the ABB-type tetramer detected in the extract A2, Peak 57 (Figure 1), the doubly charged ions were the most abundant species.
Signals attributable to glycosylated-flavonols and their aglycones were almost exclusively detected at 354 and 370 nm, respectively. Thus, twenty peaks have been tentatively identified, most of which were glycosylated forms of quercetin and myricetin, present with the corresponding aglycones. Minor signals were assigned to glycosides of isorhamnetin and methyl-myricetin.
Regarding the non-flavanol fraction, the A1 and A3 samples differed significantly from A2. Indeed, A1 and A3 contained phenolic acid and flavonol derivatives, which were totally absent in A2. In particular, they contained glycosylated forms of quercetin, isorhamnetin, and myricetin. Quercetin was the main aglycone, while the major glycosides were quercetin-3-O- and myricetin-3-O-glucoside. The identities of these compounds was then confirmed by an authentic standard. These data were in agreement with those reported by different authors [35].
Identification of some phenolic acids by MS could be difficult due to the presence of the isobaric moieties glucose (C6H12O6) and caffeic acid (C9H8O4), which both present an m/z ratio of 179 u. Differing by 118 ppm, they are indistinguishable with a low resolution mass spectrometer but can be easily resolved by the high resolution MS used in this study. Thus, several phenolic acids have been detected and identified (Table 2), and the main ones were glycosides of caffeic and p-coumaric acid. Moreover, glycosylated forms of benzoic, vanillic, sinapic, 4-hydroxy-benzoic, and 3,4-dihydroxy-benzoic acid were found in lower amounts.

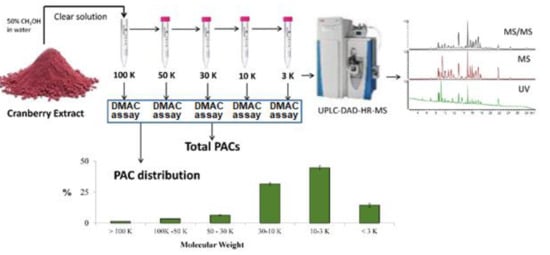
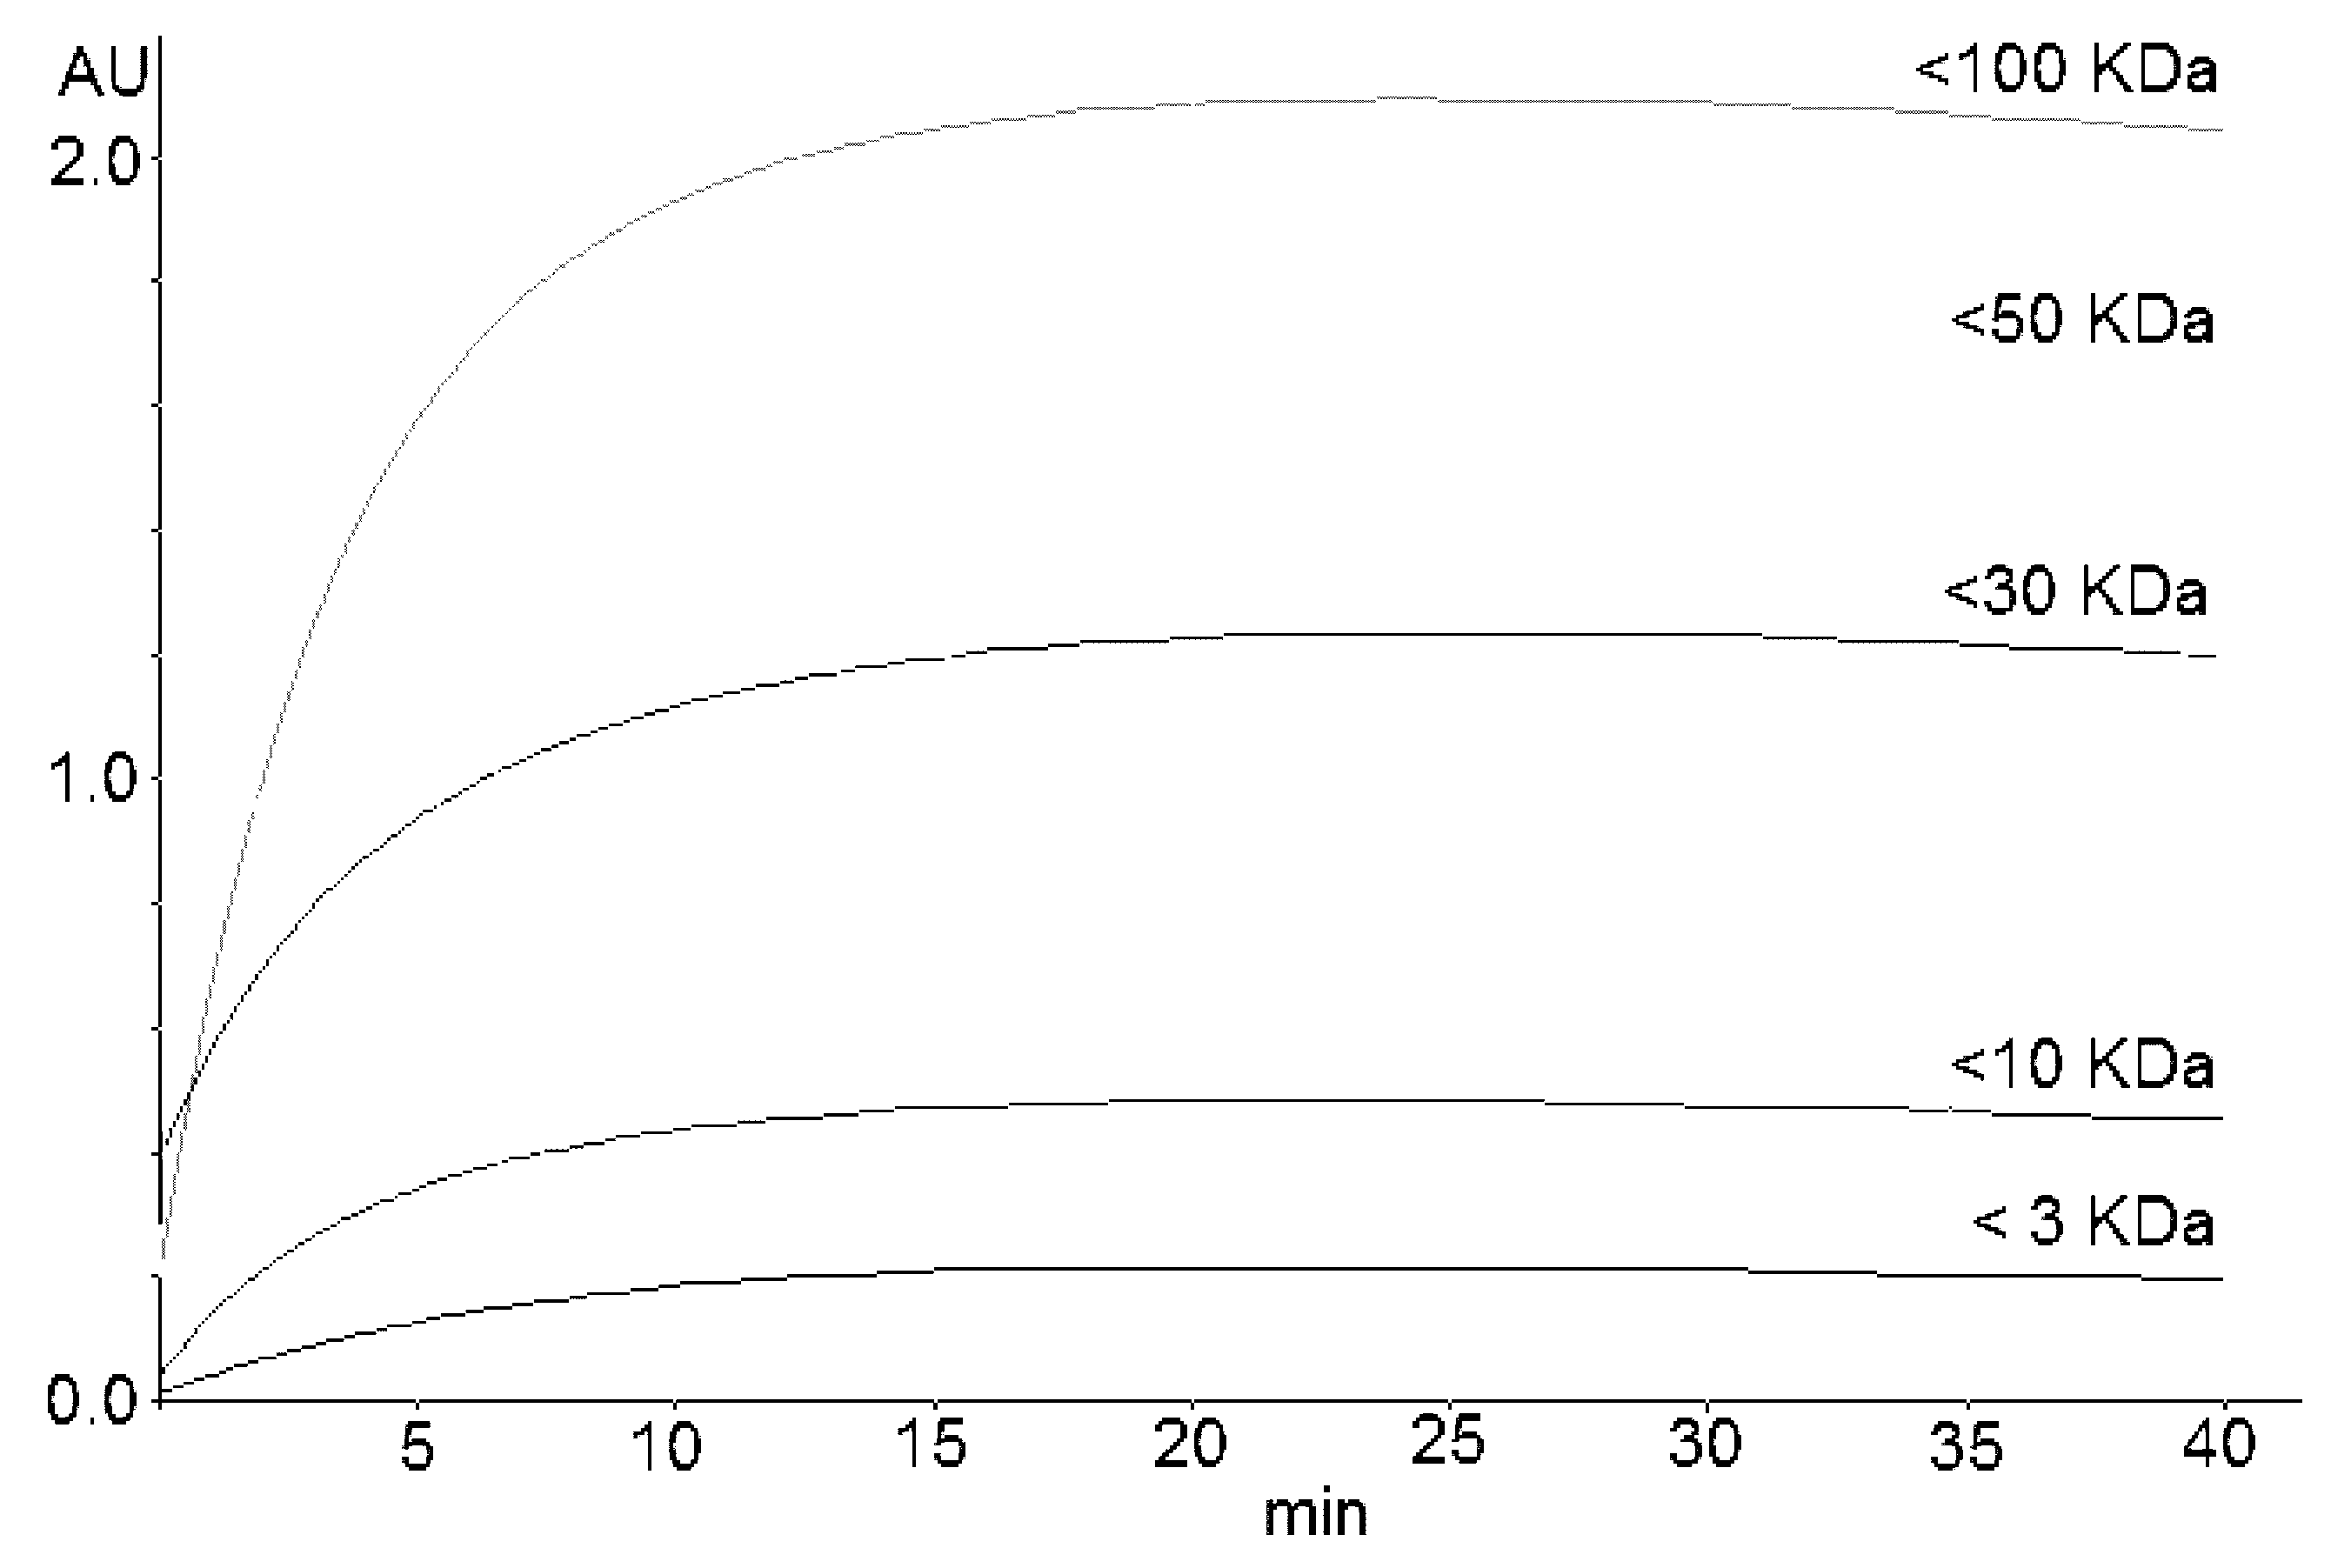
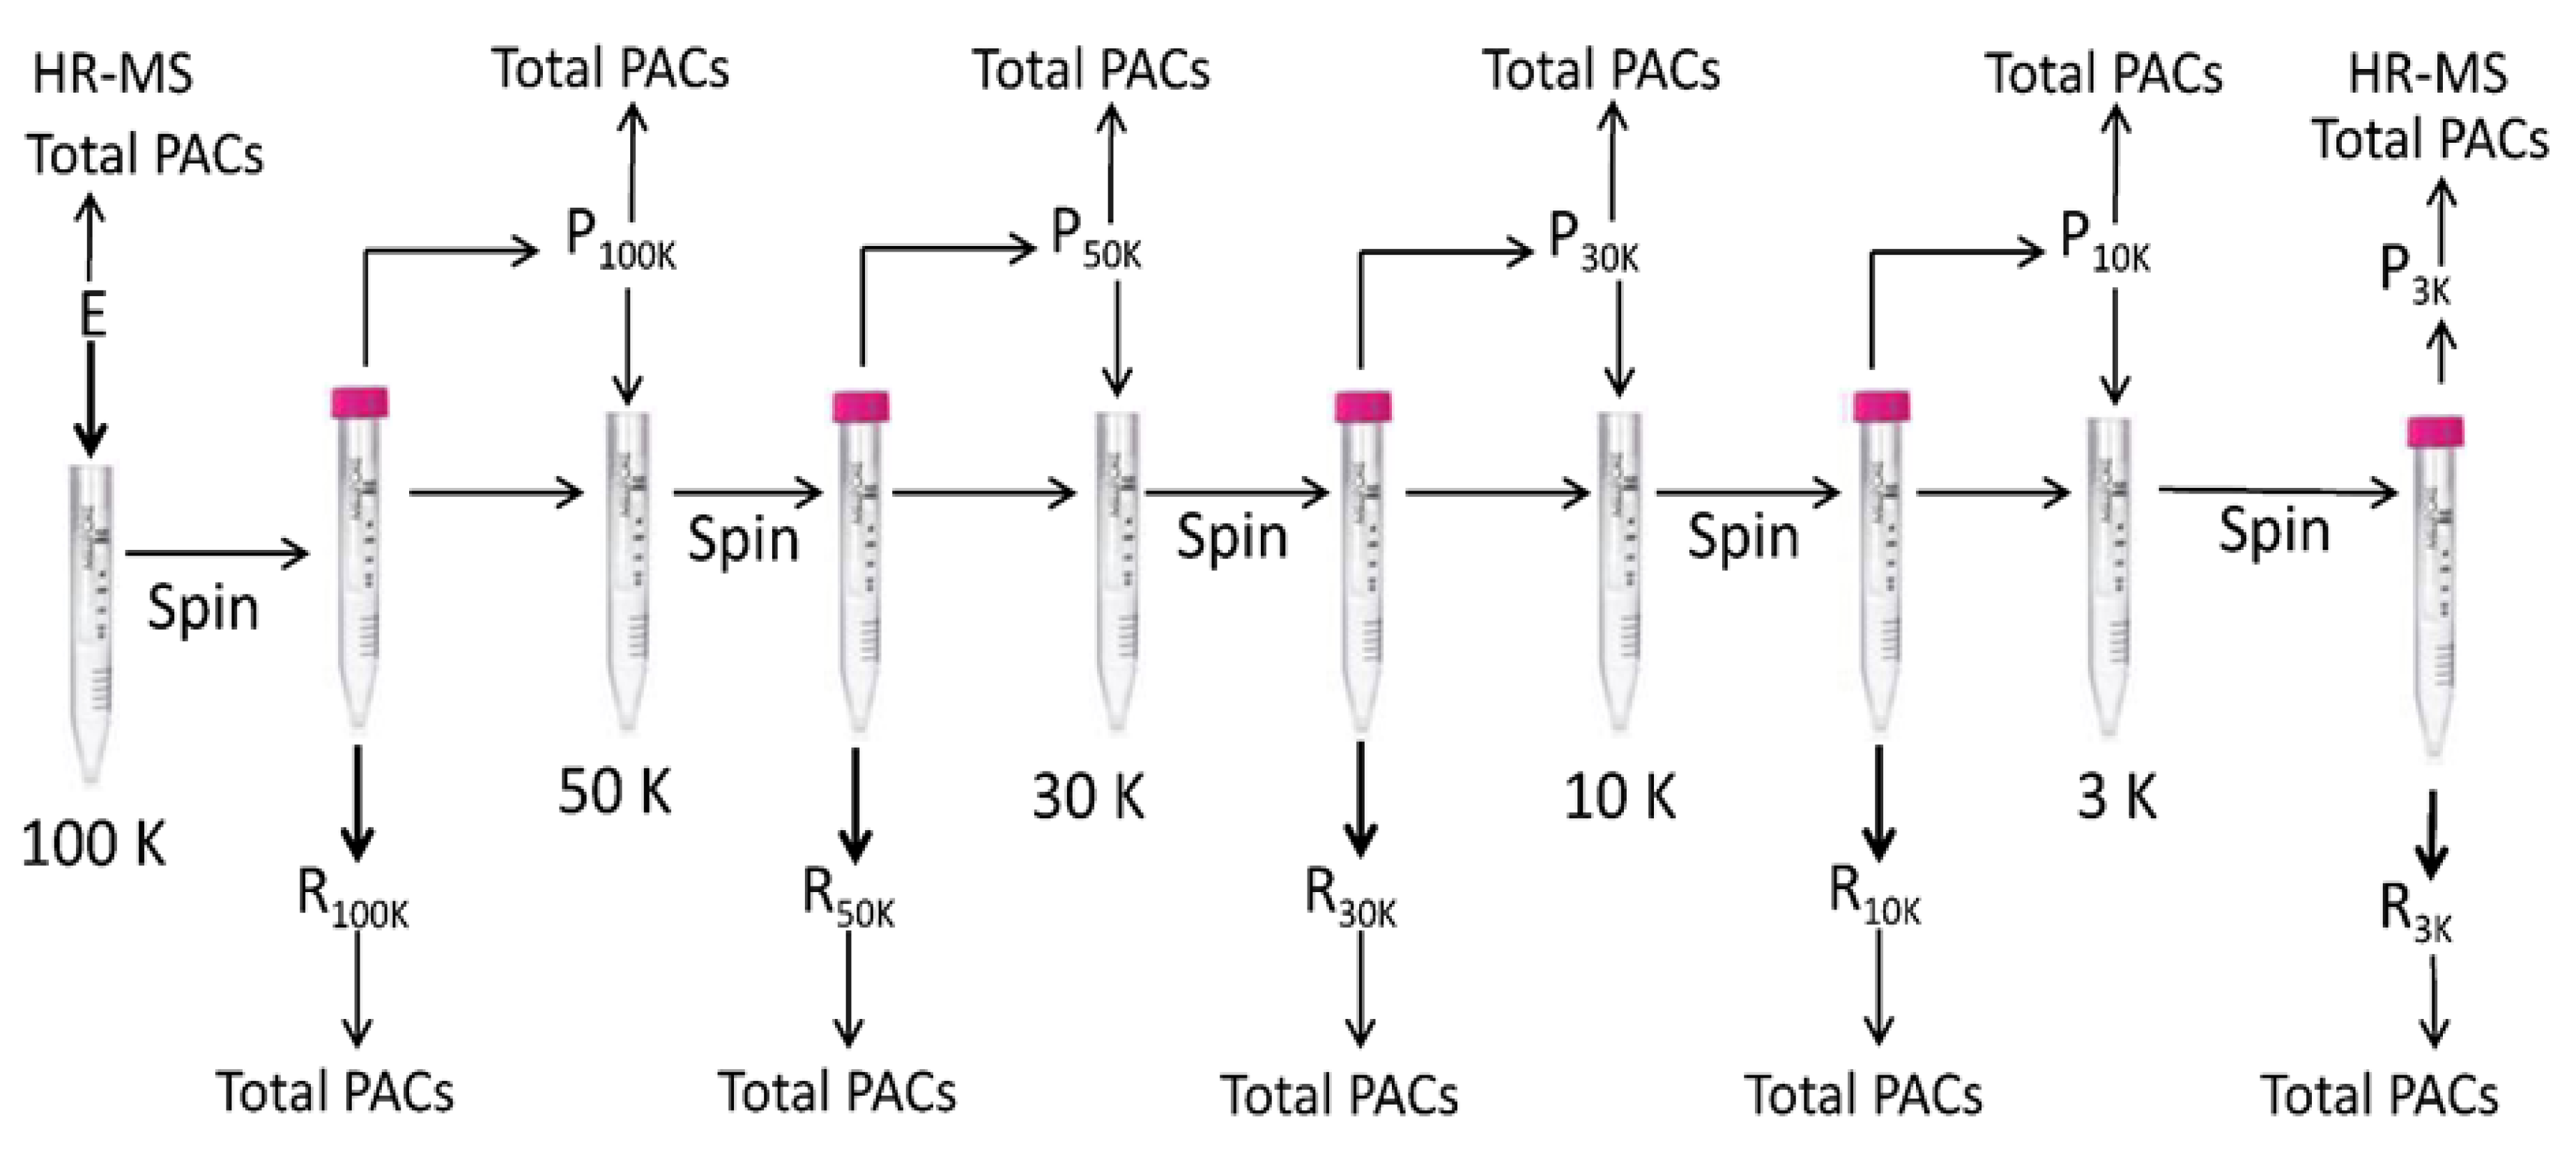
2.3. Proanthocyanidin Fractioning by Molecular Sieve

Regarding the reaction of the DMAC with flavanols, several authors report that the maximum absorption at 640 nm occurs after about 20 min [34], while others report shorter times, about 12 min [36]. Accordingly, even considering that fractions with different molecular weights could react with DMAC faster or slower, the reaction of the flavan-3-ols with DMAC was monitored every minute for 60 min to evaluate maximum absorption.
The reaction stabilizes to a plateau in the ranges of 18–25, 15–20, and 20–30 min for A1, A2, and A3, respectively. Figure 2 shows the kinetics obtained by reacting the permeates (obtained by fractionating A3 using molecular sieves) with DMAC. Table 3 reports the percentage distribution of PACs in the commercial cranberry extracts that were analyzed.
In all samples, approximately 90% of PACs had molecular weights less than 30 kDa, and there were some differences between the extracts. In particular, in A1 and A3, the PACs were mainly distributed in the fractions 30–10, 10–3 and < 3 kDa, while in A2, more than 70% were present in the low molecular weight fraction, which was less than 3 kDa. In this regard, it must be emphasized that the solution behavior of PACs is subject to aggregation due to hydrogen bonding among PACs and with other molecules such as phenolics and carbohydrates. Thus, the molecular weight cut-offs of the used filters may not be an accurate indicator of the PAC molecular weight.
The composition of the analyzed extracts showed significant variations in terms of the relative amounts of different PACs as well as flavonols. Extract A2 differed from A1 and A3 with regard to the main monomer, CAT, rather than EC, and the main dimer. The lack of well-established cranberry constituents strongly suggests that A2 is not cranberry-derived, or is adulterated with another source of PACs [37].
Thus, the standardization of cranberry extract should be carried out both by spectrophotometric assay and LC-MS analysis, leading to the determination of PACs and other flavonoids. Cranberry extracts used in clinical studies were poorly standardized, and this led to conflicting results and made it difficult to compare the outcomes. Our “multi-component” standardization could facilitate the interpretation of results from different clinical studies.
Overall, the procedure developed to obtain fractions containing PACs with different molecular weights is reproducible and faster than those using open columns containing resins such as Sephadex LH-20 and subsequent chromatography with preparative HPLC [38]. Furthermore, the availability of molecular sieves with different cut-offs from those we used will allow others to obtain further fractions to better characterize the PACs of cranberry.

3. Materials and Methods

3.1. Chemicals and Materials

Standards of catechin (CAT), epicatechin (EC), myricetin-3-O-glucoside, quercetin-3-O-glucoside, quercetin, procyanidin C1 (PC1), and procyanidin A2 (PA2) were purchased from Extrasynthese (Genay, France). Methanol, acetonitrile, 4-dimethylammino-cinnamaldehyde (DMAC), and acetic acid were from Sigma-Aldrich (St. Louis, MO, USA). Amicon ultra-4 centrifugal filter units of 3, 10, 30, 50, and 100 nominal molecular weight limits (NMWL) were supplied from Merck Millipore (Milan, Italy). Water was from a Milli-Q apparatus (Millipore, Milford, CT, USA). Commercial dried cranberry extracts (A1, A2, and A3) were obtained from different manufacturers. Notably, A1 and A3 were obtained from an industrial producer of natural ingredients starting from whole berry. On the contrary, A2 was produced by a small company through a proprietary purification and concentration process starting from cranberry commercial extracts. Details regarding the plant origins and manufacturing processes of the extracts are not available.

3.2. Determination of Total Proanthocyanidins

Approximately 25 mg of the cranberry extracts were dissolved in 40 mL of a solution of acetone:water:acetic acid (75:24.5:0.5 v/v/v). The mixture was vortexed for 30 sec, sonicated for 10 min, and then the volume was adjusted to 50 mL by a solution of acetone:water:acetic acid (75:24.5:0.5 v/v/v). The extract was diluted 2-, 5-, 10-, 20-, and 50-fold for DMAC assays. For the calibration, a stock solution (1 mg/mL) of PA2 was prepared by dissolving 20 mg of the standard in 20 mL of methanol. This solution was subsequently diluted with a solution of acetone:water:acetic acid (75:24.5:0.5 v/v/v) to produce six working solutions in the range of 2–50 µg/mL. Total PAC was determined according to Prior et al. [34], with slight variations. Briefly, an acidified ethanol solution was prepared by adding 12.5 mL of 37% HCl to 12.5 mL of deionized water and 75 mL of ethanol, and then 50 mg of DMAC reagent was dissolved in 50 mL of this solution immediately prior to use. Then 70 µL of sample or standard was added to 2.1 mL of DMAC solution, and the reaction was monitored at 640 nm every minute for 60 min by a Lambda 20 spectrophotometer (PerkinElmer, Waltham, MA, USA). The blanks were reagents and samples diluted in acidified ethanol. The assay was performed in triplicate, and the total percentages of the PACs, expressed as PA2 equivalents, were calculated as follows:
Total   PACs   ( % ) =   ( A q ) V D 10 m   W
where A is the absorbance (AU), q is the intercept of the procyanidin A2 calibration curve (0.004), m is the slope of the PA2 calibration curve (0.024), V is the extraction volume (mL), D is the dilution factor, and W is the sample weight (mg).

3.3. Proanthocyanidin Determination by UHPLC-DAD-Orbitrap MS

Approximately 20 mg of cranberry extract were dissolved into 5 ml of a methanol:water (60:40, v/v) solution. The mixture was centrifuged at 500× g for 10 min, and the supernatant transferred to a 10 mL volumetric flask. The residue was washed with 4 mL of a methanol:water (60:40, v/v) solution, and the mixture was treated as described above. The resulting solutions were mixed, and water was added to adjust the volume. The solution was centrifuged at 1000× g for 2 min, and 5 µL was injected into the UHPLC system. The analysis was performed on an Acquity UHPLC system (Waters, Milford, MA, USA) coupled with an eLambda DAD (Waters) and a high-resolution Fourier Transform Orbitrap mass spectrometer, Exactive model (Thermo Scientific, Rodano, Italy), equipped with a HESI-II probe for ESI and a collision cell (HCD). The operative conditions were as follows: Spray voltage −3.0 kV, sheath gas flow rate 55 (arbitrary units), auxiliary gas flow rate 20 (arbitrary units), capillary temperature 350 °C, capillary voltage −60 V, tube lens −100 V, skimmer −26 V, and heater temperature 130 °C. A BEH Shield C18 column (150 × 2.1 mm, 1.7 µm, Waters) maintained at 50 °C was used for the separation. The flow rate was 0.45 mL/min, and the eluents were 0.05% formic acid in water (A) and acetonitrile (B). The UHPLC separation was achieved by the following linear elution gradient: 5–35% of B for 10 min, which was then increased from 35–80% B for 10 min. The acquisition was made in the full-scan mode in the range (m/z)- 100–2000 and 200–4000 u, using an isolation window of ±2 ppm. The AGC target, injection time, mass resolution, energy, and gas in the collision cell were 1 × 10⁶, 100 ms, 50 K, 60 V, and N2, respectively. The MS data were processed using Xcalibur software (Thermo Scientific). The peak identity was ascertained by evaluating the accurate mass, the fragments obtained in the collision cell, and the on-line UV spectra (200–450 nm).
Catechin, EC, PC1, and PA2 stock solutions (1 mg mL-1) were prepared in methanol and stored at −20 °C. Working solutions (n = 5) were prepared in the range of 0.2–20 µg/mL and stored at 4 °C. Analysis was carried out in duplicate. The amounts of the dimers and trimers that were not available as reference standard were estimated using the PA2 and PC1 calibration curve equations, respectively.

3.4. Proanthocyanidin Fractioning by Ultra-Centrifugal Filter

Approximately 100 mg of the cranberry extract was dissolved in 40 mL of a methanol:water (50:50, v/v) solution. The mixture was vortexed for 1 min, sonicated for 10 min, and then the volume of the clear solution was adjusted to 50 mL by a methanol:water (50:50, v/v) solution. The solutions were diluted and analyzed by DMAC assays to determine total PACs.
Then 4 mL of the extract was loaded on a 100K NMWL filter, which was then centrifuged at 4000 × g until the solution was completely passed through the filter. Permeate was transferred to a 10 mL tube, and the volume was adjusted by methanol. The residue (retained) was dissolved in 4 mL of a methanol:water (50:50, v/v) solution, transferred to a 5 mL flask, and the volume was adjusted with methanol. Permeate (4 mL) was loaded on a 50K NMWL filter and treated as described above. The procedure was then repeated on 30, 10, and 3 K NMWL filters. Permeate and residue were analyzed by DMAC assay to determine total PACs and the 3K NMWL permeate was also analyzed by UHPLC-DAD-MS. The entire procedure is schematized in Figure 3.

3.5. Statistical Analysis

The statistical analysis was performed using Excel software. The singly charged ions of the different PACs were calculated according to the following equation:
HRMW = 12(15DP) + 1.0078(12DP + 2 – 2A) + 15.9949(6DP) – 1.0078
where DP was the polymerization degree, and A was the number of A-type bonds. The masses of C, H, and O were 12, 1.0078, and 15.9949, respectively.

Author Contributions

Conceptualization, C.G. and P.S.; methodology, C.G. and P.S.; formal analysis, C.G.; investigation, C.G. and P.S.; resources, P.S.; data curation, C.G. and P.S.; writing–original draft preparation, C.G.; writing–review & editing, C.G., P.S. and Proof Reading Service.

Funding

This research received no external funding.

Conflicts of Interest

The authors declare no conflict of interest.

References

  1. Howell, A.B.; Vorsa, N.; Der Marderosian, A.; Foo, L.Y. Inhibition of the adherence of P-fimbriated Escherichia coli to uroepithelial-cell surfaces by proanthocyanidin extracts from cranberries. N. Eng. J. Med. 1998, 339, 1085–1086. [Google Scholar] [CrossRef]
  2. Peron, G.; Pellizzaro, A.; Brun, P.; Schievano, E.; Mammi, S.; Sut, S.; Castagliuolo, I.; Dall’Acqua, S. Antiadhesive activity and metabolomics analysis of rat urine after cranberry (Vaccinium macrocarpon Aiton) administration. J. Agric. Food Chem. 2017, 65, 5657–5667. [Google Scholar] [CrossRef]
  3. Yan, X.; Murphy, B.T.; Hammond, G.B.; Vinson, J.A.; Neto, C.C. Antioxidant activities and antitumor screening of extracts from cranberry fruit (Vaccinium macrocarpon). J. Agric. Food Chem. 2002, 50, 5844–5849. [Google Scholar] [CrossRef] [PubMed]
  4. Peixoto, T.C.; Moura, E.G.; de Oliveira, E.; Soares, P.N.; Guarda, D.S.; Bernardino, D.N.; Ai, X.X.; Rodrigues, V.D.S.T.; de Souza, G.; da Silva, A.J.R.; et al. Cranberry (Vaccinium macrocarpon) extract treatment improves triglyceridemia, liver cholesterol, liver steatosis, oxidative damage and corticosteronemia in rats rendered obese by high fat diet. Eur. J. Nutr. 2018, 57, 1829–1844. [Google Scholar] [CrossRef] [PubMed]
  5. Weh, K.M.; Clarke, J.; Kresty, L.A. Cranberries and cancer: An update of preclinical studies evaluating the cancer inhibitory potential of cranberry and cranberry derived constituents. Antioxidants 2016, 5, 27. [Google Scholar] [CrossRef]
  6. Foxman, B. Urinary tract infection syndromes: Occurrence, recurrence, bacteriology, risk factors, and disease burden. Infect. Dis. Clin. North Am. 2014, 28, 1–13. [Google Scholar] [CrossRef]
  7. Wang, C.H.; Fang, C.C.; Chen, N.C.; Liu, S.S.; Yu, P.H.; Wu, T.Y.; Chen, W.; Lee, C.; Chen, S.C. cranberry-containing products for prevention of urinary tract infections in susceptible populations: A systemic review and meta-analysis of randomized controlled trials. Arch. Intern. Med. 2012, 172, 988–996. [Google Scholar] [CrossRef] [PubMed]
  8. Cunningham, D.G.; Vannozzi, S.A.; Turk, R.; O’Shea, E.; Brilliant, K. Cranberry phytochemicals and their health benefits. In Nutraceutical Beverages. Chemistry, Nutrition, and Health Effects; Shahidi, F., Weerasinghe, D.K., Eds.; American Chemical Society: Washington, DC, USA, 2004; Volume 871, pp. 35–50. [Google Scholar]
  9. Pappas, E.; Schaich, K.M. Phytochemicals of cranberries and cranberry products: Characterization, potential health effects, and processing stability. Crit. Rev. Food Sci. Nutr. 2009, 49, 741–781. [Google Scholar] [CrossRef]
  10. Vvedenskaya, I.O.; Rosen, R.T.; Guido, J.E.; Russell, D.J.; Mills, K.A.; Vorsa, N. Characterization of flavonols in cranberry (Vaccinium macrocarpon) powder. J. Agric. Food Chem. 2004, 52, 188–195. [Google Scholar] [CrossRef] [PubMed]
  11. Wang, Y.; Johnson-Cicalese, J.; Singh, A.P.; Vorsa, N. Characterization and quantification of flavonoids and organic acids over fruit development in American cranberry (Vaccinium macrocarpon) cultivars using HPLC and APCI-MS/MS. Plant Sci. 2017, 262, 91–102. [Google Scholar] [CrossRef] [PubMed]
  12. Brown, P.N.; Shipley, P.R. Determination of anthocyanins in cranberry fruit and cranberry fruit products by high-performance liquid chromatography with ultraviolet detection: Single-laboratory validation. J. AOAC Int. 2011, 94, 459–466. [Google Scholar] [CrossRef]
  13. Česonienė, L.; Jasutienė, I.; Šarkinas, A. Phenolics and anthocyanins in berries of European cranberry and their antimicrobial activity. Medicina (Kaunas) 2009, 45, 992–999. [Google Scholar] [CrossRef] [PubMed]
  14. Prior, R.L.; Lazarus, S.A.; Cao, G.; Muccitelli, H.; Hammerstone, J.F. Identification of procyanidins and anthocyanins in Blueberries and Cranberries (Vaccinium Spp.) using high-performance liquid chromatography/mass spectrometry. J. Agric. Food Chem. 2001, 49, 1270–1276. [Google Scholar] [CrossRef]
  15. Howell, A.B. Bioactive compounds in cranberries and their role in prevention of urinary tract infections. Mol. Nutr. Food Res. 2007, 51, 732–737. [Google Scholar] [CrossRef]
  16. Reed, J.D.; Krueger, C.G.; Vestling, M.M. MALDI-TOF mass spectrometry of oligomeric food polyphenols. Phytochemistry 2005, 66, 2248–2263. [Google Scholar] [CrossRef]
  17. Foo, L.Y.; Lu, Y.R.; Howell, A.B.; Vorsa, N. The structure of cranberry proanthocyanidins which inhibit adherence of uropathogenic P-fimbriated Escherichia coli in vitro. Phytochemistry 2000, 54, 173–181. [Google Scholar] [CrossRef]
  18. Gu, L.; Kelm, M.A.; Hammerstone, J.F.; Beecher, G.; Holden, J.; Haytowitz, D.; Prior, R.L. Screening of foods containing proanthocyanidins and their structural characterization using LC-MS/MS and thiolytic degradation. J. Agric. Food Chem. 2003, 51, 7513–7521. [Google Scholar] [CrossRef]
  19. Bate-Smith, E.C. Colour reactions of flowers attributed to (a) flavanols and (b) carotenoid Oxides. J. Exp. Bot. 1953, 4, 1–9. [Google Scholar] [CrossRef]
  20. Sun, B.; Ricardo da Silva, J.M.; Spranger, I. Critical factors of vanillin assay for catechins and proanthocyanidins. J. Agric. Food Chem. 1998, 46, 4267–4274. [Google Scholar] [CrossRef]
  21. Cunningham, D.G.; Vannozzi, S.; O’Shea, E.; Turk, R. Analysis and standardization of cranberry products. In Quality Management of Nutraceuticals; Ho, C., Zheng, Q.Y., Eds.; ACS: Washington, DC, USA, 2002; Volume 803, pp. 152–167. [Google Scholar]
  22. Wang, Y.; Singh, A.P.; Hurst, W.J.; Glinski, J.; Koo, H.; Vorsa, N. Influence of degree-of-polymerization and linkage on the quantification of proanthocyanidins using 4-Dimethylaminocinnamaldehyde (DMAC) Assay. J. Agric. Food Chem. 2016, 64, 2190–2199. [Google Scholar] [CrossRef]
  23. Feliciano, R.P.; Shea, M.P.; Shanmuganayagam, D.; Krueger, C.G.; Howell, A.B.; Reed, J.D. Comparison of isolated cranberry (Vaccinium macrocarpon Ait.) proanthocyanidins to catechin and procyanidins A2 and B2 for use as standards in the 4-(dimethylamino) cinnamaldehyde assay. J. Agric. Food Chem. 2012, 60, 4578–4585. [Google Scholar] [CrossRef]
  24. Ye, L.; Neilson, A.; Sarnoski, P.; Ray, W.K.; Duncan, S.; Boyer, R.; O’Keefe, S.F. Comparison of A-type Proanthocyanidins in cranberry and Peanut skin extracts using matrix assisted laser desorption ionization-time of flight mass spectrometry. J. Mol. Genet. Med. 2016, 10, 1–7. [Google Scholar] [CrossRef]
  25. Li, H.J.; Deinzer, M.L. Tandem mass spectrometry for sequencing proanthocyanidins. Anal. Chem. 2007, 79, 1739–1748. [Google Scholar] [CrossRef] [PubMed]
  26. Parets, L.; Alechaga, E.; Núñez, O.; Saurina, J.; Hernández-Cassou, S.; Lluis Puignou, L. Ultrahigh pressure liquid chromatography-atmospheric pressure photoionization-tandem mass spectrometry for the determination of polyphenolic profiles in the characterization and classification of cranberry-based pharmaceutical preparations and natural extracts. Anal. Methods 2016, 8, 4363–4378. [Google Scholar]
  27. van Dooren, I.; Foubert, K.; Theunis, M.; Naessens, T.; Pieters, L.; Apers, S. Advantages of a validated UPLC-MS/MS standard addition method for the quantification of A-type dimeric and trimeric proanthocyanidins in cranberry extracts in comparison with well-known quantification methods. J. Pharm. Biomed. Anal. 2018, 148, 32–41. [Google Scholar] [CrossRef] [PubMed]
  28. Sánchez-Patán, F.; Bartolomé, B.; Martín-Alvarez, P.J.; Anderson, M.; Howell, A.; Monagas, M. Comprehensive assessment of the quality of commercial cranberry products. Phenolic characterization and in vitro bioactivity. J. Agric. Food Chem. 2012, 60, 3396–3408. [Google Scholar]
  29. Lin, L.Z.; Sun, J.; Chen, P.; Monagas, M.J.; Harnly, J.M. UHPLC-PDA-ESI/HRMSn profiling method to identify and quantify oligomeric proanthocyanidins in plant products. J. Agric. Food Chem. 2014, 62, 9387–9400. [Google Scholar] [CrossRef] [PubMed]
  30. del Mar Contreras, M.; Arráez-Román, D.; Fernández-Gutiérrez, A.; Segura-Carretero, A. Nano-liquid chromatography coupled to time-of-flight mass spectrometry for phenolic profiling: A case study in cranberry syrups. Talanta 2015, 132, 929–938. [Google Scholar] [CrossRef]
  31. Barbosa, S.; Pardo-Mates, N.; Hidalgo-Serrano, M.; Saurina, J.; Puignou, L.; Núñez, O. Detection and quantitation of frauds in the authentication of cranberry-based extracts by UHPLC-HRMS (Orbitrap) polyphenolic profiling and multivariate calibration methods. J. Agric. Food Chem. 2018, 66, 9353–9936. [Google Scholar] [CrossRef] [PubMed]
  32. Singh, A.P.; Wilson, T.; Kalk, A.J.; Cheong, J.; Vorsa, N. Isolation of specific cranberry flavonoids for biological activity assessment. Food Chem. 2009, 116, 963–968. [Google Scholar] [CrossRef] [PubMed]
  33. Hellenbrand, N.; Sendker, J.; Lechtenberg, M.; Petereit, F.A. Isolation and quantification of oligomeric and polymeric procyanidins in leaves and flowers of Hawthorn (Crataegus spp.). Fitoterapia 2015, 104, 14–22. [Google Scholar] [CrossRef] [PubMed]
  34. Prior, R.L.; Fan, E.; Ji, H.; Howell, A.; Nio, C.; Payne, M.J.; Reed, J. Multi-laboratory validation of a standard method for quantifying proanthocyanidins in cranberry powders. J. Sci. Food Agric. 2010, 90, 1473–1478. [Google Scholar] [CrossRef] [PubMed]
  35. Rodríguez-Pérez, C.; Quirantes-Piné, R.; Contreras Mdel, M.; Uberos, J.; Fernández-Gutiérrez, A.; Segura-Carretero, A. Assessment of the stability of proanthocyanidins and other phenolic compounds in cranberry syrup after gamma-irradiation treatment and during storage. Food Chem. 2015, 174, 392–399. [Google Scholar]
  36. Engström, M.T.; Pälijärvi, M.; Fryganas, C.; Grabber, J.H.; Mueller-Harvey, I.; Salminen, J.P. Rapid qualitative and quantitative analyses of proanthocyanidin oligomers and polymers by UPLC-MS/MS. J. Agric. Food Chem. 2014, 62, 3390–3399. [Google Scholar]
  37. Cardellina, J.H.; Gafner, S. Cranberry product laboratory guidance document; UNPA: Austin, TX, USA, 2018. [Google Scholar]
  38. Koo, H.; Duarte, S.; Murata, R.M.; Scott-Anne, K.; Gregoire, S.; Watson, G.E.; Singh, A.P.; Vorsa, N. Influence of Cranberry proanthocyanidins on formation of biofilms by Streptococcus mutans on saliva-coated apatitic surface and on dental caries development in vivo. Caries Res. 2010, 44, 116–126. [Google Scholar] [CrossRef] [PubMed]
Sample Availability: Samples A1–A3 are available from the authors.
Figure 1. The total ion chromatography, 100–2000 u, of cranberry extracts A1, A2, and A3. See Table 2 for peak identifications.
Molecules 24 01504 g001
Figure 2. Kinetics of the DMAC reaction of permeates obtained by fractionating the cranberry extract A3. Permeates were obtained by molecular sieves with cut-offs of 3, 10, 30, 50, and 100 kDa.
Molecules 24 01504 g002
Figure 3. Fractionation of the proanthocyanidins (PACs) by centrifugal filter devices. The extract solution was centrifuged at 4000× g by a centrifugal filter device containing an ultracel-PL PLHK 100 kDa regenerated cellulose membrane, which allowed the ultrafiltration into the lower chamber (permeate) of substances with MW  < 100 kDa. Substances with MW > 100 kDa were collected in the upper chamber (retained). Permeate was then loaded on a 50 kDa filter and centrifuged at 4000 × g until the solution passed completely through the filter. The procedure was repeated on 30, 10, and 3 kDa filters. Permeates and retained fractions were analyzed by the DMAC assay, and the permeates less than 3 kDa were analyzed by UHPLC-DAD-HR MS.
Molecules 24 01504 g003
Table 1. Total PACs in Cranberry extracts by DMAC assay and percentage of the main monomers, dimers, and trimers quantified by UHPLC-HR MS.
AnalyteA1 (%)A2 (%)A3 (%)
Total PACs27.1 ± 1.1a33.1 ± 2.1a14.7 ± 1.0a
Catechin0.1 ± 0.00.4 ± 0.00.0 ± 0.0
Epicatechin1.3 ± 0.10.1 ± 0.00.4 ± 0.0
Dimers, A-type1.8 ± 0.13.3 ± 0.10.5 ± 0.0
(PA2) 1.8 ± 0.10.2 ± 0.00.5 ± 0.0
Dimers, B-type0.5 ± 0.00.5 ± 0.10.3 ± 0.1
Trimers, AA-type0.1 ± 0.00.2 ± 0.1n.f.
Trimers, AB-type1.4 ± 0.12.5 ± 0.10.5 ± 0.0
Trimers, BB-type0.4 ± 0.00.1 ± 0.00.1 ± 0.0
(PC1)0.2 ± 0.0n.f.0.1 ± 0.0
a DMAC assay, n.f. not found (<LOD).
Table 2. Compounds identified in the analyzed commercial cranberry extracts (A1-A3). For each compound is reported the retention time (RT, min), λmax (nm), HR mass of the deprotonated ion [M-H]-, molecular formula, and fragment ions [M − H].
PeakRTλmax[M − H]FormulaFragment IonsCompound
13.2270169.0146C7 H5 O5125.0246GA
24.7315315.0735C13 H15 O9152.0118DHBA-Hex
35.3277329.0883C14 H17 O9167.0353, 152.0118, 123.0454VA-Hex
45.4263299.0784C13 H15 O8137.0247HBA-Hex
55.6302315.1091C14 H19 O8163.0404, 153.056, 145.0298, 123.0454VH-Hex
66.8295503.1428C21 H27 O14341.0883, 179.0354, 161.0249, 135.0455CA-di-Hex
77.0328341.0884C15 H17 O9179.0354, 161.0249, 133.0298CA-Hex
87.7277577.1363C30 H25 O12407.0792, 289.0731, 125.0247DP2, B
98.1310341.0884C15 H17 O9179.0354, 161.0249, 133.0298CA-Hex
108.4227, 277289.0726C15 H13 O6159.0456, 137.0247, 123.0455CAT
118.5320353.0884C16 H17 O9191.0567, 163.0567CHL
128.7313325.0938C15 H17 O8163.0404, 145.0298pC-Hex
139.1234, 277591.1147C30 H23 O13447.0947, 347.0576, 284.0339DP2 A1
149.4234461.1307C19 H25 O13121.0297HBA-di-Hex
159.7241445.1360C19 H25 O12323.0989, 121.0297BA-di-Hex
1610.0234, 277865.2005C45 H37 O18407.0791, 287.0574, 577.1368 160.0170, 125.0247DP3, BB
1710.1234461.1307C19 H25 O13121.0297HBA-di-Hex
1810.9227, 277289.0726C15 H13 O6159.0456, 137.0247, 123.0455EC
1911.4234371.0991C16 H19 O10359.1515, 344.1277, 249.0625, 121.0298BA-X
2011.9234, 278863.1857C45 H35 O18573.1061, 451.1053, 411.0742, 289.0732DP3, AB
20a12.1234, 280865.2007C45 H37 O18407.0791, 287.0574, 577.1368, 125.0247PC1
2113.1255, 356479.0841
959.1754
C22 H19 O13
[2M-H]-
316.0237, 271.026M-Glc
2213.6230, 280863.1853C45 H35 O18575.1894, 449.1099DP3, AB
2313.8230, 275577.2055C32 H33 O10397.1423, 373.1157, 203.0833N.I.
23a14.8254, 311535.1469C25 H27 O13316.0238, 271.0262, 191.0356, 163.0405, 147.0455N.I.
2415.0255, 356463.0893
927.1860
C21 H19 O12
[2M-H]-
300.0290, 271.0261, 151.0040Q-Glc
2515.3254, 312535.1469C25 H27 O13407.0789, 289.0730, 191,0356, 163.0405, 147.0455N.I.
2615.5 493.1008C22 H21 O13330.0395, 315.0161, 163.0404methyl-M
2715.6230, 280575.1200
1151.2485
C30 H23 O12
[2M-H]-
285.0417PA2
2816.0313537.1624
1075.3317
C25 H19 O13
[2M-H]-
163.0405, 149.0611dh-MT-pC
2916.1 433.0783C20 H17 O11300.0289, 271.0261Q-Ara
3016.4255, 352433.0787C20 H17 O11300.0288, 271.0260, 255.0310, 151.0040Q-Ara
3116.9255, 352433.0787C20 H17 O11300.0288, 271.0260, 255.0310Q-Ara
3217.4255, 348447.0943C21 H19 O11300.0288, 271.0259, 255.0310, 151.0040Q-Rha
3317.8252, 359507.1155C23 H23 O13344.0551, 329.0319, 316.0601, 301.0367, 273.0419dm-M-Hex
3417.9252, 377317.031C15 H19 O8271.0259, 151.004M
3519.2254, 352447.0951C21 H19 O11314.0447, 285.0419, 271.0262, 243.0309I-Ara
3619.8252, 348447.0951C21 H19 O11314.0447, 285.0419, 271.0262, 243.0310I-Ara
3720.3262, 359477.1049C22 H21 O12344.0551, 329.0317, 316.0601, 301.0367, 273.0418dm-M-Pentose
3820.8280, 316445.1158C22 H21 O10179.0355, 135.0455, 121.0297CA-Hex-BA
3921.6285, 310609.1270C30 H25 O14463.0902, 300.0288, 163.0041, 151.0040Q-Hex-pC
4021.8255, 370301.0363C15 H9 O7151.0040Q
4122.3254, 373331.0468C16 H11 O8316.0239, 271.0262, 164.0120, 151.0041I
4224.5255, 352567.1158C28 H23 O13300.0289Q-Hex-BA
4328.1255, 366345.0622C217 H13 O8315.0519, 300.0288, 287.0211, 271.0260, 151.0041dm-M
4428.8266, 252593.1318C30 H25 O13300.0288, 271.0261Q-Rha-pC
453.2235391.1254
783.2287
C16 H23 O11
[2M-H]-
229.0724 (A), 211.0618, 167.0717, 149.0611, 123.0454A-Hex
4610.1230, 277415.1257
461.1311
C18 H23 O11
[M+COOH]-
284.0340, 121.0298N.I.
4710.5248, 352385.1151C17 H21 O10205.0513, 190.0287, 175.0042, 149.0248SA-Hex
4810.9 385.1877
431.1931
C19 H29 O8
[M+COOH]-
298.0495, 283.0260, 205.1240, 153.0925, 125.0247N.I.
4914.4260, 359449.0737C20 H17 O12316.0238, 287.0211, 271.0262M-Pentose
5014.6266, 348449.0737C20 H17 O12316.0238, 287.0212, 271.0262M-Pentose
5114.8248, 309535.1471
1071.3013
C25 H27 O13
[2M-H]-
316.0236, 271.0264, 191.0356, 163.0405, 147.0455M-Pentose-X
M11.8 341.1093
665.2165
C12 H21 O11,
C24 H41 O21
161.0456Maltodextrin
M22.1 989.3204
1151.3730
1313.4260
C36 H61 O31
C42 H71 O36
C48 H81 O41
341.1093, 827.2680, 665.2165, 161.0458Maltodextrin
525.0230, 277865.2011C45 H37 O18407.0791, 287.0574, 577.1368DP3, BB
536.8230, 2771439.3153
719.1533
C75 H59 O30
[2M-H]-
573.1053, 411.0738, 289.0731, 125.0247DP5, ABBB
547.7230, 277577.1367C30 H25 O12407.0791, 289.0730, 245.0830, 125.0247DP2, B
558.2230, 277577.1367C30 H25 O12407.0791, 289.0730, 245.0830, 125.0247DP2, B
569.6230, 277577.1367C30 H25 O12447.0944, 284.0341, 125.0248DP2, B
5710.0230, 2771151.2487
575.1208
C60 H47 O24
[M-2H]2-
447.0943, 285.0419, 125.0248DP4, ABB
5810.2230, 2771151.2489
575.1208
C60 H47 O24
[M-2H]2-
863.1873, 285.0418, 125.0248DP4, ABB
5910.5230, 277863.1857C45 H35 O18693.1282, 575.1221, 449.0899, 423.0743, 407.0791, 285.0419, 125.0247DP3, AB
6011.2234, 277863.1857C45 H35 O18411.0742, 289.0732DP3, AB
6112.1237, 278863.1857C45 H35 O18693.1282, 575.1221, 449.0899, 289.0732, 125.0247DP3, AB
6213.3232, 278863.1850C45 H35 O18693.1282, 575.1221, 449.0899, 289.0732, 125.0247DP3, AB
6313.6231, 277575.1221C30 H23 O12449.0899, 289.0732, 125.0247DP2, A
6413.9234, 278863.1850C45 H35 O18575.1221, 449.0899, 289.0732, 125.0247DP3, AB
6514.2236, 2801726.2633
862.1778
C90 H69 O361153.2630, 863.1860, 411.0741, 289.0731DP6, AABBB
6614.3234, 2781437.2966
718.1456
C75 H57 O30
[M-2H]2-
1149.2328, 862.1768, 575.1221, 411.0740, 285.0419, 125.0247DP5, AABB
6714.9234, 2781149.2328C60 H45 O24575.1221, 411.0740, 285.0419, 125.0247DP4, AAB
6815.1237, 2781437.2878C75 H57 O30863.1839, 575.1221, 411.074, 285.0419, 125.0247DP5, AABB
6915.7234, 279575.1212C30 H23 O12447.0743. 411.0741, 285.0419, 125.0247DP2, A
7015.7234, 279575.1212C30 H23 O124479.0902. 411.0745, 285.0419, 125.0247DP2, A
7116.0237, 2781149.2328C60 H45 O24575.1221, 449.0899, 411.0740, 285.0419, 125.0247DP4, AAB
7216.4237, 2791149.2323C60 H45 O24575.1221, 449.0899, 411.0740, 285.0419, 125.0247DP4, AAB
7317.0234, 277575.1212C30 H23 O12285.0419, 125.0247DP2, A
7417.4234, 2781149.2323C60 H45 O24575.1221, 449.0899, 411.0740, 285.0419, 125.0247DP4, AAB
7517.9 1149.2323C60 H45 O24575.1221, 411.0740, 285.0419, 125.0247DP4, AAB
7618.1 1149.2323C60 H45 O24861.1715, 573.1060, 411.0740, 125.0247DP4, AAB
7718.4 1149.2323C60 H45 O24575.1221, 497.2778, 411.0740, 285.0419DP4, AAB
7818.9 1149.2323C60 H45 O24575.1221, 411.0740, 285.0419, 125.0247DP4, AAB
7919.6 1149.2323C60 H45 O24575.1219, 411.0740, 285.0419DP4, AAB
8028.5 965.4270C44 H69 O23803.3750, 641.3204N.I.
8128.5 327.2186C18 H31 O5 N.I.
8229.6 329.2344C18 H33 O5283.0671, 211.1347, 183.1394, 171.1031, 139.1131, 127.1131N.I.
1 dimer EC(C)-EGC, DP: degree of polymerization, N.I.: not identified. Ara: arabinose, BA: benzoic acid, CA: caffeic acid, CAT: catechin, CHL: chlorogenic acid, DHBA: 3,4-dihydroxy-benzoic acid, dh-MT-pC: dihydro-monotropein-p-coumaroyl, dm-M-pentose: di-methyl-myricetin-pentose, dm-M-Hex: di-methyl-myricetin-hexose, EC: epicatechin, GA: gallic acid, Glc: glucose, HBA: hydroxy-benzoic acid, Hex: hexose, I: isorhamnetin, M: myricetin, PA2: procyanidin A2, pC: p-coumaric acid, PC1: procyanidin C1, Q: quercetin, SA: sinapic acid, VA: vanillic acid, VH: vanillyl alcohol, X: unknown residue.
Table 3. PAC distribution in commercial cranberry extracts (A1–A3). The relative percentages of PACs were determined by DMAC assays after fractionation by molecular sieves. Values are reported as averages ± S.D.
NMWLA1A2A3
>100 K0.1 ± 0.00.9 ± 0.01.1 ± 0.1
100–50 K2.5 ± 0.10.6 ± 0.03.8 ± 0.2
50–30 K4.9 ± 0.28.3 ± 0.49.2 ± 0.5
30–10 K21.6 ± 1.111.6 ± 0.622.4 ± 1.1
10–3 K36.3 ± 1.45.7 ± 0.337.8 ± 1.6
<3 K34.6 ± 1.472.9 ± 3.625.7 ± 1.2
NMWL: nominal molecular weight limit.

