
Microstructure of Brain Nuclei in Early Parkinson’s Disease: Longitudinal Diffusion Kurtosis Imaging
Abstract
Background:
Diffusion kurtosis imaging provides in vivo measurement of microstructural tissue characteristics and could help guide management of Parkinson’s disease.
Objective:
To investigate longitudinal diffusion kurtosis imaging changes on magnetic resonance imaging in the deep grey nuclei in people with early Parkinson’s disease over two years, and whether they correlate with disease progression.
Methods:
We conducted a longitudinal case-control study of early Parkinson’s disease. 262 people (Parkinson’s disease: n = 185, aged 67.5±9.1 years; 43% female; healthy controls: n = 77, aged 66.6±8.1 years; 53% female) underwent diffusion kurtosis imaging and clinical assessment at baseline and two-year timepoints. We automatically segmented five nuclei, comparing the mean kurtosis and other diffusion kurtosis imaging indices between groups and over time using repeated-measures analysis of variance, and Pearson correlation with the two-year change in Movement Disorder Society Unified Parkinson’s Disease Rating Scale Part III.
Results:
At baseline, mean kurtosis was higher in Parkinson’s disease than controls in the substantia nigra, putamen, thalamus and globus pallidus when adjusting for age, sex, and levodopa equivalent daily dose (p < 0.027). These differences grew over two years, with mean kurtosis increasing for the Parkinson’s disease group while remaining stable for the control group; evident in significant “group ×time” interaction effects for the putamen, thalamus and globus pallidus (
Conclusion:
Diffusion kurtosis imaging of specific grey matter structures shows abnormal microstructure in PD at baseline and abnormal progression in PD over two years.
INTRODUCTION
Parkinson’s disease (PD) is a neurodegenerative disease characterized by resting tremor and hypokinetic symptoms, and the primary pathological correlate is neuronal loss in the substantia nigra (SN). The proposed histopathological staging of PD is supported by Lewy pathology in striatal neurons resulting from intracytoplasmic aggregation of alpha-synuclein [1]. SN and Lewy pathology leads to microstructural disruption and complex remodeling of grey matter nuclei of the basal ganglia and thalamo-cortical circuits downstream and, later, involvement of cortical regions [2–4]. These nuclei primarily include the thalamus, caudate, putamen, and globus pallidus. As such, these are now the main targets for neuromodulatory PD therapy. However, there is a paucity of evidence on the longitudinal microstructural dynamics in these nuclei, especially in the early stages of PD.
One experimental MRI technique, diffusion kurtosis imaging (DKI), provides in vivo measurement of the restricted motion of endogenous water molecules, allowing quantification of microstructural tissue characteristics. DKI improves upon conventional diffusion tensor imaging (DTI) because it accounts for restricted diffusion of water molecules by cell membranes and organelles [5], instead of assuming that it is Gaussian. For example, mean kurtosis (MK) is the average magnitude of water molecular displacement by diffusion, and thus reflects tissue density and the extracellular fluid compartment. DKI has already shown promise for characterization of tissue microstructure in neurological disease [6–9], but has not yet been used to support longitudinal tracking of disease progression in PD.
In PD, pathological processes reduce the morphological integrity of the cellular environment [10], changing the diffusion kurtosis characteristics of the tissue [8]. Early studies investigating DKI in PD have overall been inconclusive but were limited by modest sample sizes and non-ideal imaging parameters [11–16]. Such studies have not reported on axial or radial kurtosis, involved mid-study scanner software changes and used manual drawing of regions of interest (ROIs). There has been one longitudinal study of DKI in PD, but none in early (< 1 year duration) PD. The one longitudinal study of DKI in PD found only a decrease in putaminal FA over two years in PD (5.5 years’ duration) compared to controls [16]. A cross-sectional study of DKI at different stages of PD progression found that mid/late-stage PD patients had lower kurtosis in the globus pallidus and thalamus versus early-stage PD patients [17].
We conducted a large case-control longitudinal study of early PD, hypothesizing that DKI characteristics of key brain nuclei would be altered between baseline and two-year timepoints in PD patients compared to controls. Secondly, we hypothesized that the DKI measures would correlate with the decline in motor function. Specifically, we expect MK to be increased in PD and to further increase with disease progression and severity.
METHODS
Participants
We recruited people with early PD and age-matched healthy controls for the Parkinson’s Disease Longitudinal Singapore (PALS) prospective cohort study between 2014 and 2020 [18–22]. We recruited people with PD within one year of diagnosis and within two years of the first motor symptom onset from two tertiary hospitals in Singapore. PD patients were diagnosed according to the National Institute of Neurological Disorders and Stroke (NINDS) diagnostic criteria [23]. Participants were excluded if they later changed to a non-PD diagnosis (all patients had at least 2 years’ follow-up), met the diagnostic criteria for dementia, were illiterate, had a history of stroke, active malignancy, end-organ failure or major orthopedic abnormalities, had other neurological and psychiatric conditions, not have complete MRI and clinical data, or had excessive head motion or atrophy such that it precluded analysis. Healthy controls were recruited from the community and were free of significant neurological, psychiatric, or systemic disease. Both groups underwent the same MRI and detailed clinical assessment at baseline and 2-year time points.
Standard protocol approvals, registrations, and patient consents
All participants gave written, informed consent and the study was approved by the Singapore Health Services Centralised Institutional Review Board.
Data acquisition
We acquired MRI data on a 3T Siemens Skyra MRI scanner (Siemens, Erlangen, Germany) equipped with a 32-channel head coil and the Syngo MR D13 software version, located at Singapore General Hospital between September 2014 and 2021. The MRI scan included a DKI sequence with the following parameters: TE = 102 ms, TR = 10.118 s, FA = 90°, in-plane voxel size = 1.8×1.8 mm, slice thickness = 2.5 mm, matrix = 112×112, 55 contiguous slices, anterior-posterior phase encoding, 60 diffusion-weighted volumes (30 at b = 1000 mm/s2 and 30 at 2000 mm/s2) evenly distributed on the unit sphere and 3 volumes with b = 0 mm/s2. It also included a sagittal T1-weighted MPRAGE sequence with the following parameters: TE = 0.002 s, TR = 1.9 s, FA = 9°, in-plane voxel size = 1×1 mm, slice thickness = 1 mm, matrix = 256×256, 256 contiguous slices. No changes to the scanner software or hardware were made during the course of the study.
Clinical assessments included the Movement Disorder Society Unified Parkinson’s Disease Rating Scale Part III (MDS-UPDRS-III; [24]), Hoehn & Yahr stage [25] and Montreal Cognitive Assessment (MoCA) [26], and were obtained by a neurologist during the same visit as the MRI. Patients’ Levodopa equivalent daily dose (LEDD) was recorded. All data were gathered during the “on” medication state.
Image analysis
Figure 1 shows the image analysis pipeline and example ROI segmentations. We pre-processed diffusion data using MRTrix3 with the following steps: denoising, correction of Gibbs’ ringing artefacts, motion and eddy current correction (using FSL eddy [27]), and bias field correction (using ANTS [28]). DKI parameters were then calculated using Diffusion Kurtosis Estimator [29] (DKE) to produce maps of the following eight metrics: axial, radial and mean diffusivity (AD, RD, MD), fractional anisotropy (FA), axial radial and mean kurtosis (AK, RK, MK), and fractional anisotropy of kurtosis (KFA). DKE uses a linearly-constrained linear least-squares model to estimate tensors. We treated MK as the “primary” imaging outcome and the other measures as “secondary”.
Fig. 1
Stages of image processing. Beginning with the raw T1 image, diffusion data and atlases, our processing pipeline included automatic brain segmentation using FreeSurfer, substantia nigra mask from the CITI atlas, and the preprocessing of the diffusion data using MRTrix3, before co-registration of the three to extract diffusion kurtosis imaging values for key regions of interest. Images of T1-weighted and diffusion data were taken from an example participant.
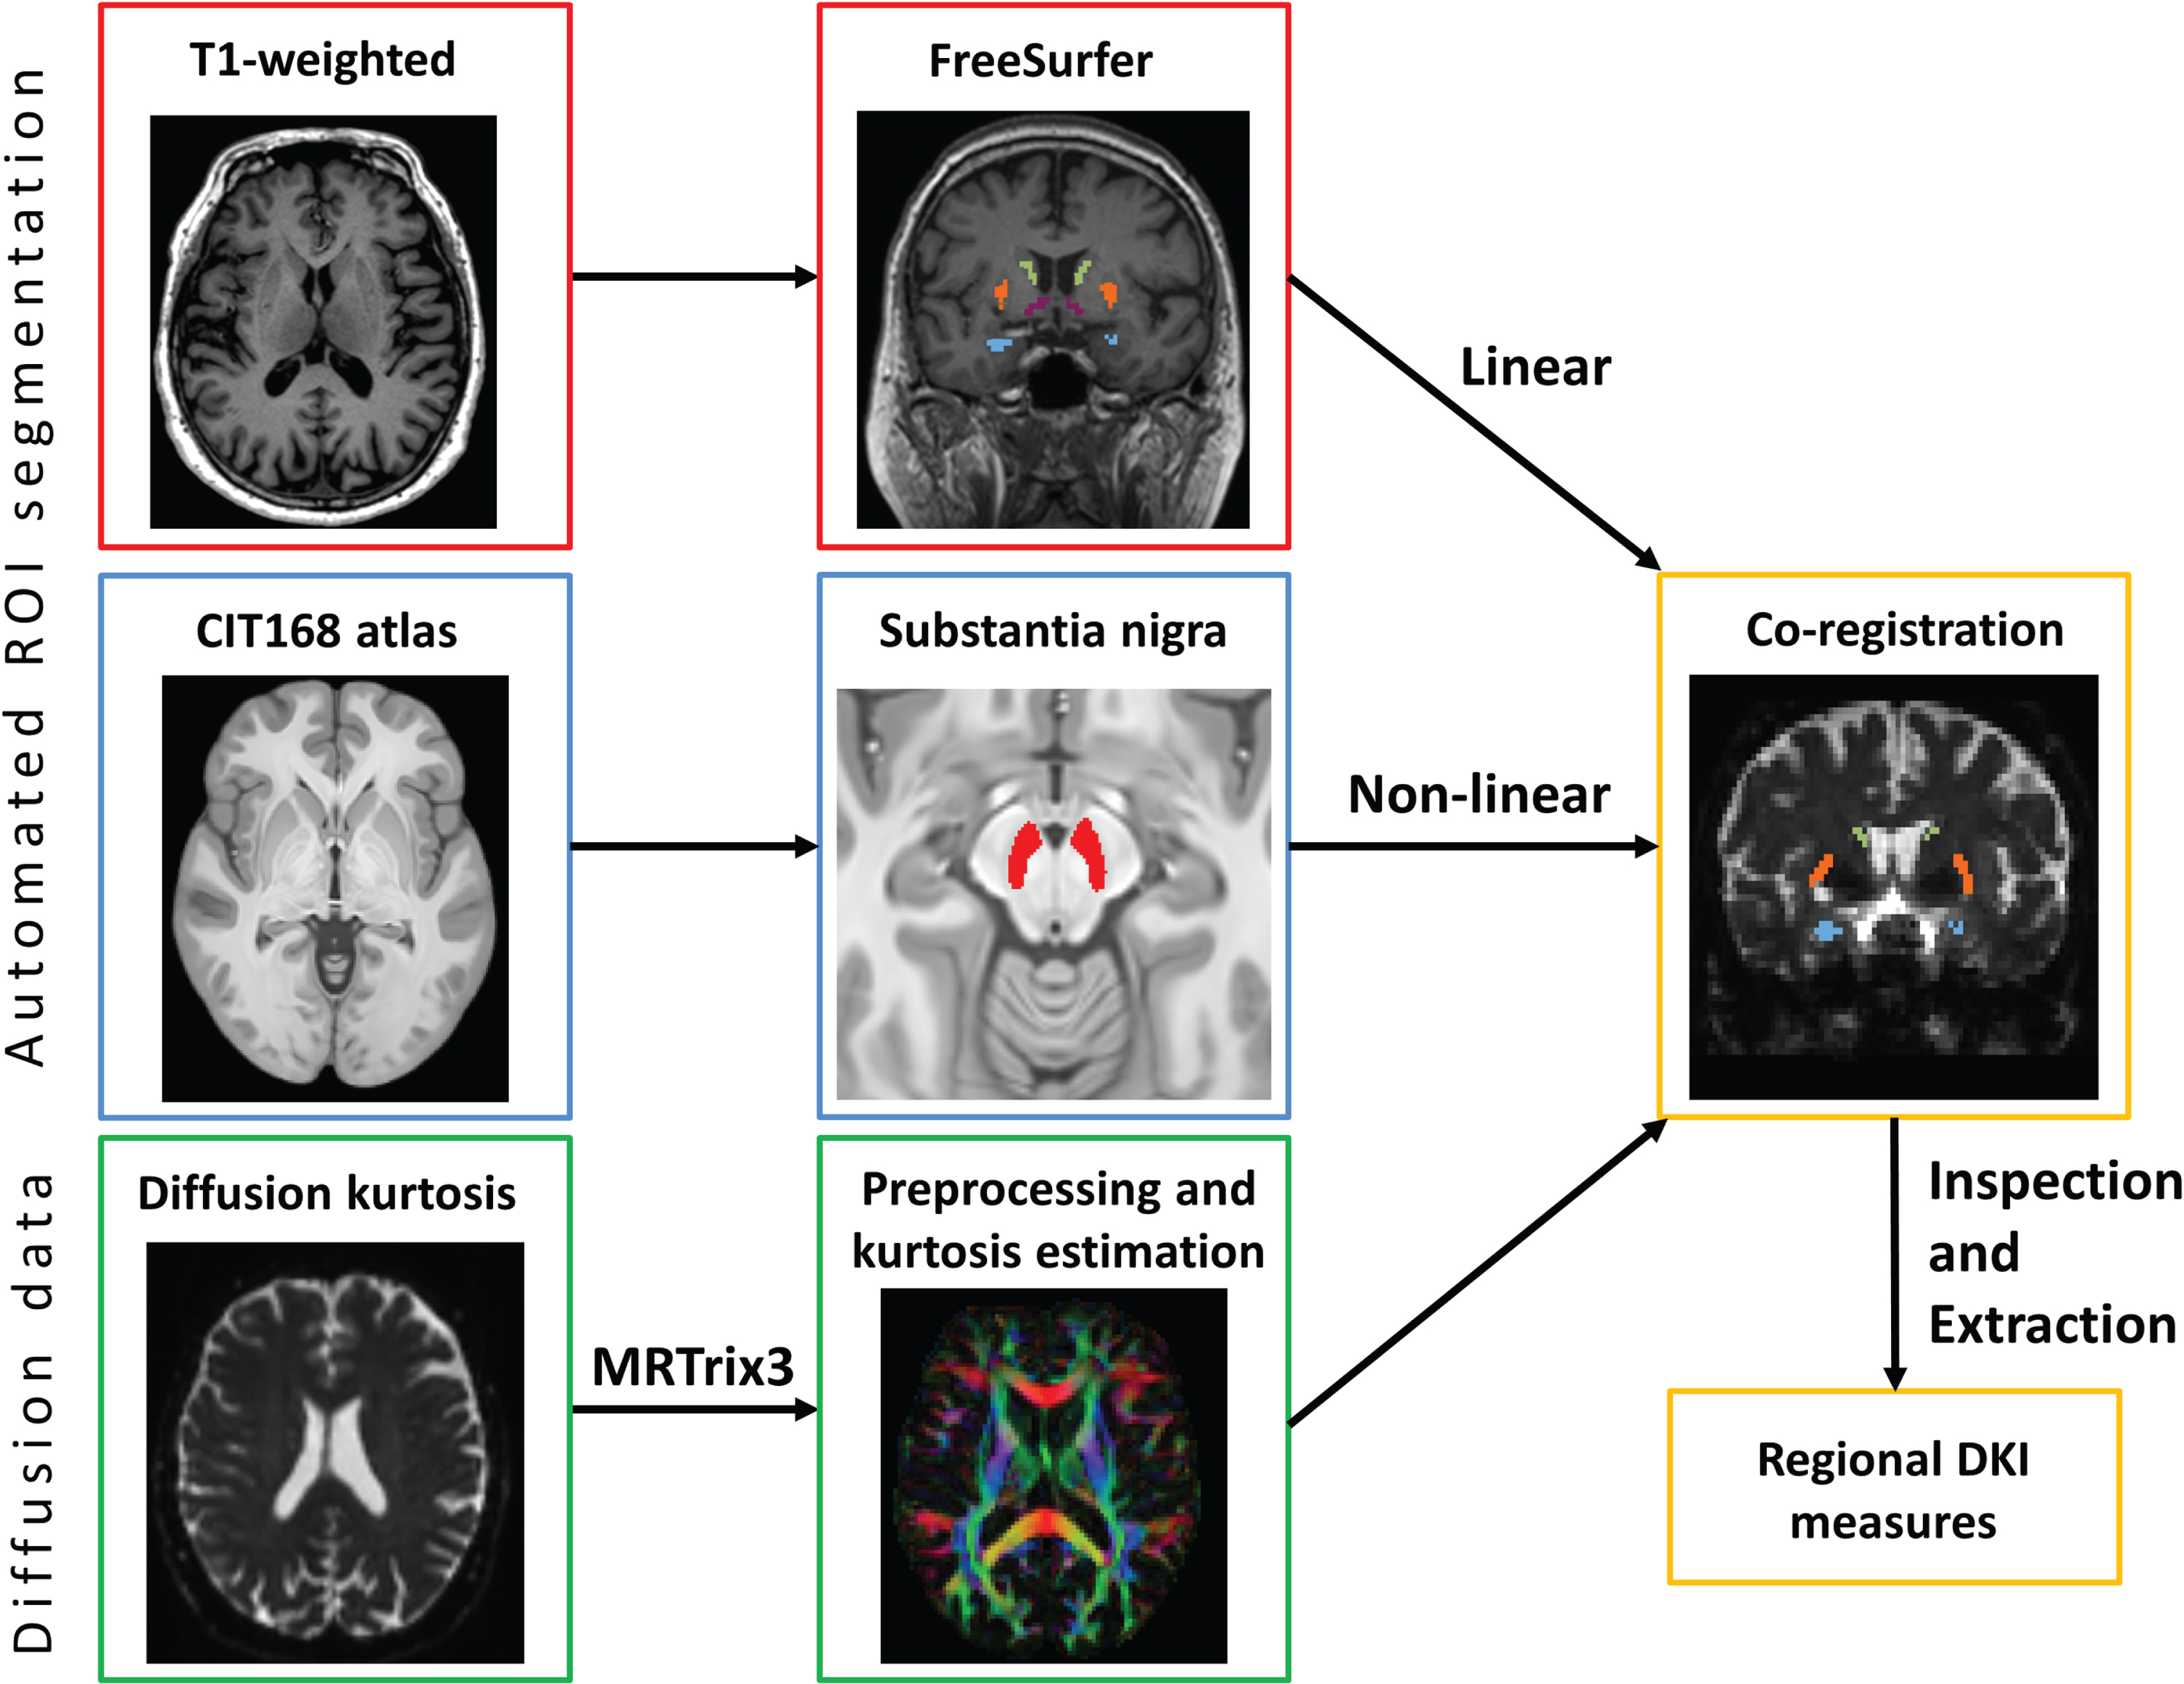
We included five deep grey nuclear ROIs: the thalamus, caudate, globus pallidus, putamen, and substantia nigra (SN). We also gathered data from all cerebral white matter (WM) voxels as a control region. These regions were chosen to reflect a range of levels of involvement in motor function. These were extracted from the T1-weighted image using FreeSurfer (version 6) [30] segmentation for both hemispheres. For the SN, we non-linearly registered the CIT168 atlas [31] to each participant’s T1-weighted image and then linearly to their DTI data in two steps using FSL FLIRT boundary-based registration and FNIRT [32]. Masks were thresholded and eroded by 1 voxel to reduce partial voluming effects. We visually inspected the masks in diffusion space to ensure correct positioning and confirmed that all masks met a minimum threshold number of voxels (≥10) to be valid. To improve signal-to-noise ratio, we measured and averaged all voxels in both left and right hemispheres for each nucleus.
Statistics
We first tested all variables for extreme outliers (defined as the 1st or third quartile±3×inter-quartile range) and normal distribution by visual inspection of histograms and Kolmogorov-Smirnov test. Our analysis focused on MK as the primary imaging outcome, as a summary measure of diffusional kurtosis and the best comparator to previous studies.
For the baseline comparison of PD and controls on MK, the primary imaging measure was the mean MK in each of the ROIs, which we compared between PD and control groups using linear regression. For each test, we used the mean MK in the ROI as the independent variable and entered a dummy group variable, age, sex and LEDD as the dependent variables. Last, we checked the normality of the residuals using visual inspection of P-P plots. We also used the same linear regression approach for all secondary DKI metrics (AD, RD, MD, FA, AK, RK) and represented the results in radial plots. Because these imaging measures were interdependent, we controlled the false discovery rate (FDR) using the Benjamini-Hochberg procedure. In this case, the number of comparisons was equal to the number of test ROIs multiplied by the number of DKI metrics (5×8 = 40).
To test the longitudinal change in MK and how it differs between PD and controls, we used repeated measures ANOVA with time as the within-subject factor, group as the between-subjects factor and the following variables as covariates: age, sex, LEDD, and the follow-up interval in days. Using the same procedure, we also tested the other DKI metrics as secondary tests and applied the same multiple comparison correction procedure.
To test for linear relationships between the 2-year change in MK and 2-year change in disease severity, we used Pearson correlation with the regional MK and the MDS-UPDRS-III for each ROI.
Data availability statement
Anonymized data will be shared upon reasonable request from qualified investigators.
RESULTS
Sample characteristics
From a total of 209 PD and 97 controls recruited, we finally included data from 185 PD and 77 controls after filtering (Table 1). Overall, our PD sample was representative of early stage PD with minimal cognitive impairment: the time since diagnosis was approximately 3 months and MoCA scores were considered mildly impaired (25.3±3.0; threshold for “normal” cognition: 26). The combined sample was closely compliant to the two-year follow-up and was well matched between PD and controls on key demographic variables, with no significant differences in age between patients and controls at either timepoint.
Table 1
Demographic and clinical data for PD and control groups at baseline. Values shown as mean (standard deviation). Group and time differences tested by ANOVA or Chi-square test
| Group | Parkinson’s disease | Healthy controls | ||||
| n = 185 | n = 77 | |||||
| Timepoint | Baseline | Year 2 | Baseline | Year 2 | Group effect, p | Time effect in PD group, p |
| Age at MRI scan, years | 67.5 (9.1) | 66.6 (8.1) | 0.450 | |||
| Sex, M:F | 106:79 | 36:41 | 0.119 | |||
| Disease duration (days)a | 135.5 (100.8) | |||||
| Age at first symptoms onset, years | 61.9 (9.2) | |||||
| LEDD, mg/day | 225.3 (123.7) | 242.5 (137.7) | 0.600 | |||
| Follow-up interval, years | 2.01 (0.21) | 2.12 (0.41) | 0.165 | |||
| MDS-UPDRS-III | 20.8 (9.8) | 25.2 (10.1) | 1.3 (1.3) | 3.7 (4.2) | < 0.001 | 0.040 |
| Hoehn & Yahr stage | 1.77 (0.44) | 1.98 (0.40) | 0.121 | |||
| MoCA score | 25.3 (3.0) | 24.7 (3.9) | 26.5 (0.7) | 27.0 (2.8) | 0.327 | 0.603 |
MDS-UPDRS-III, Movement Disorder Society Unified Parkinson’s Disease Rating Scale Part III; MoCA, Montreal Cognitive Assessment; LEDD, Levodopa equivalent daily dose. aDisease duration is defined as the time between symptom onset and clinical assessment/MRI acquisition.
Baseline abnormalities in mean kurtosis of key grey matter nuclei
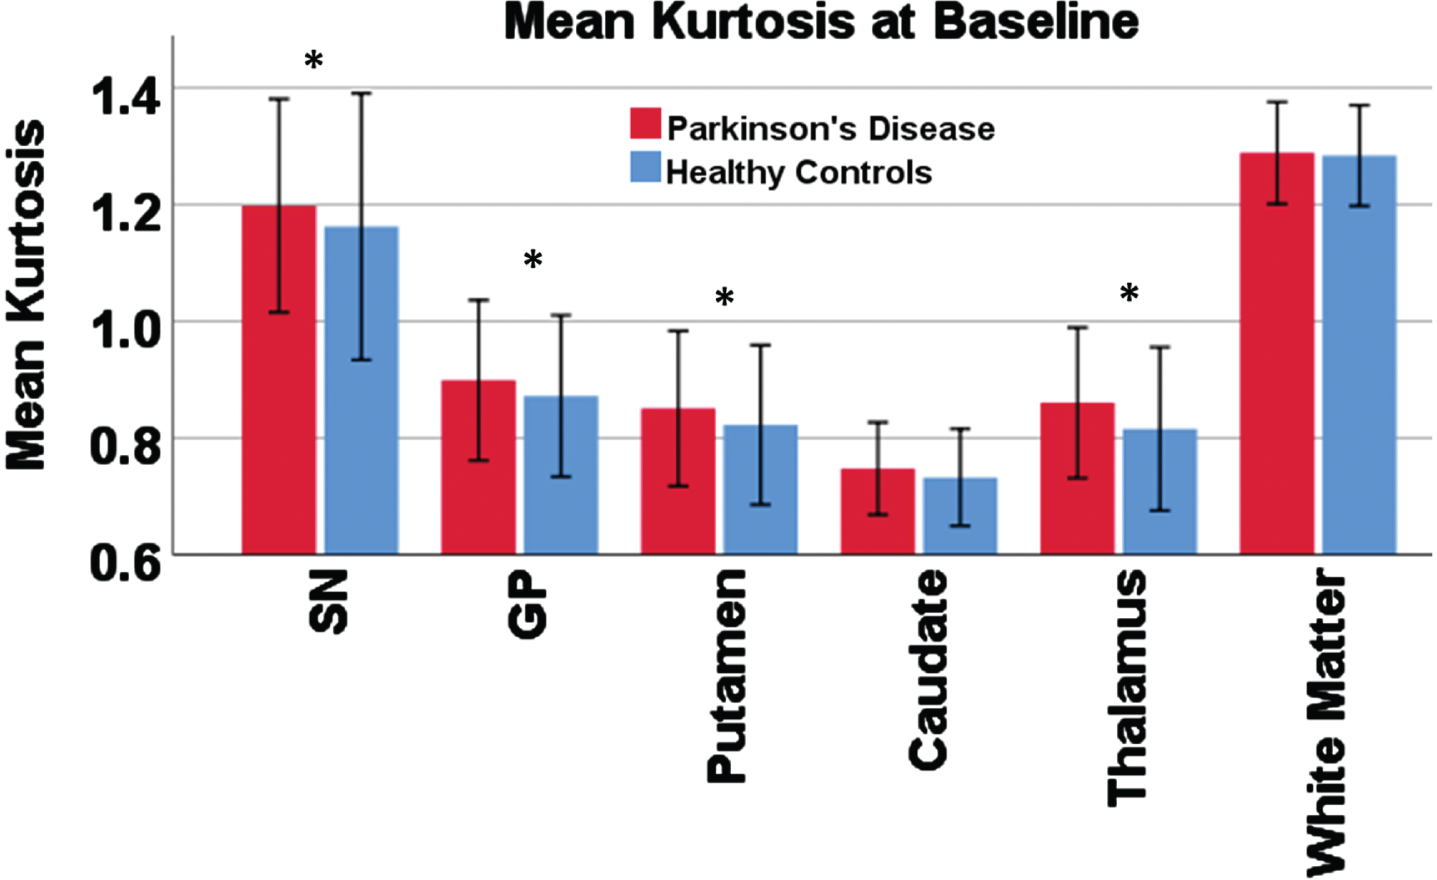
When controlling for age, sex, and LEDD, MK was significantly higher in the early PD group compared to controls in all of the included grey matter nuclei except the caudate nucleus and was not different in the WM control region. These were the SN, globus pallidus, putamen, and thalamus (all p < 0.05; Supplementary Table 1). All residuals were approximately normally distributed. Figure 2 shows the group differences in the MK data.
Fig. 2
Mean kurtosis in each region of interest compared between groups. Bar chart showing the result of the group comparison for baseline mean kurtosis. Error bars show 2 standard deviations. An asterisk is shown for regions with significant group difference in a linear regression model controlling for age, sex, and levodopa-equivalent dose.
Baseline abnormalities in secondary kurtosis measures of key grey matter nuclei
When inspecting the differences between groups for the other (secondary) DTI and DKI metrics in each ROI, we found a general pattern of increased diffusivity (MD, AD, and RD), increased kurtosis (MK, AK, and RK), decreased KFA and minimal/no differences in FA in the PD group compared to controls (Table 2).
Table 2
Baseline group differences. Results of the baseline group comparison between Parkinson’s disease and healthy controls controlling for age, sex, LEDD and years of education. Each cell shows the p-value for the group difference
| Diffusion tensor metrics | Diffusion kurtosis metrics | |||||||
| Axial | Radial | Mean | Fractional anisotropy | Axial | Radial | Mean | Fractional anisotropy | |
| Substantia nigra | 0.002** | 0.109 | 0.041* | 0.099 | 0.720 | 0.021* | 0.027* | 0.004* |
| Caudate | 0.010* | 0.033* | 0.009* | 0.601 | 0.142 | 0.519 | 0.061 | 0.103 |
| Putamen | 0.025* | 0.034* | 0.029* | 0.095 | 0.010* | 0.018* | 0.010** | 0.111 |
| Thalamus | 0.299 | 0.009* | 0.021* | 0.938 | 0.045* | 0.020* | < 0.001** | 0.435 |
| Globus Pallidus | 0.404 | 0.580 | 0.774 | 0.739 | 0.030* | 0.055 | 0.022* | 0.582 |
| White Matter | < 0.001** | 0.544 | 0.094 | 0.802 | 0.713 | 0.821 | 0.548 | 0.011* |
*Significant at α= 0.05; **Significant at α= 0.01.
However, these differences varied across ROIs, as shown in Supplementary Figure 1, in which the value for each measure is scaled across the ROIs. The differential shape of the radial plots highlights the variation in microstructural complexity across ROIs and shows that the interpretation of changes in each region will be different and depend on the full range of available metrics.
For example, while the thalamus and SN both exhibited higher MK in the PD group to similar extents, the shape of their microstructural profile is quite different as a result of (a) differences in absolute value of the measures between ROIs, and (b) variation in which measures are different between the groups.
In all ROIs, the AD/RD/MD trio and, likewise, the AK/RK/MK trio, tended to increase or decrease in unison, thus having little impact on the FA measures. The SN and WM had relatively high kurtosis compared to basal ganglia ROIs.
Longitudinal change in mean kurtosis of grey matter nuclei between groups
When looking at the change in MK over 2 years for the groups individually, we found that several of the nuclei had significantly increased MK in the PD group, but not in the control group. This PD group MK increase between baseline and follow-up was significant for the putamen, globus pallidus (GP), and thalamus. The control group, on the other hand, did not show significant changes over time in MK of any region, nor was there any longitudinal change in MK of the cerebral WM control region for either group. Figure 3 indicates significant effects for “time” with a “†”.
Fig. 3
Plots of the estimated marginal means from repeated-measures ANOVA of mean kurtosis. Results of the repeated measures ANOVA. Significant effects for “time”: “†”. Significant effects for “group”: “‡”. Significant effects for “group×time”: “§” (all p < 0.05). All subfigures use the same y-axis, consistent with that used in Fig. 2.
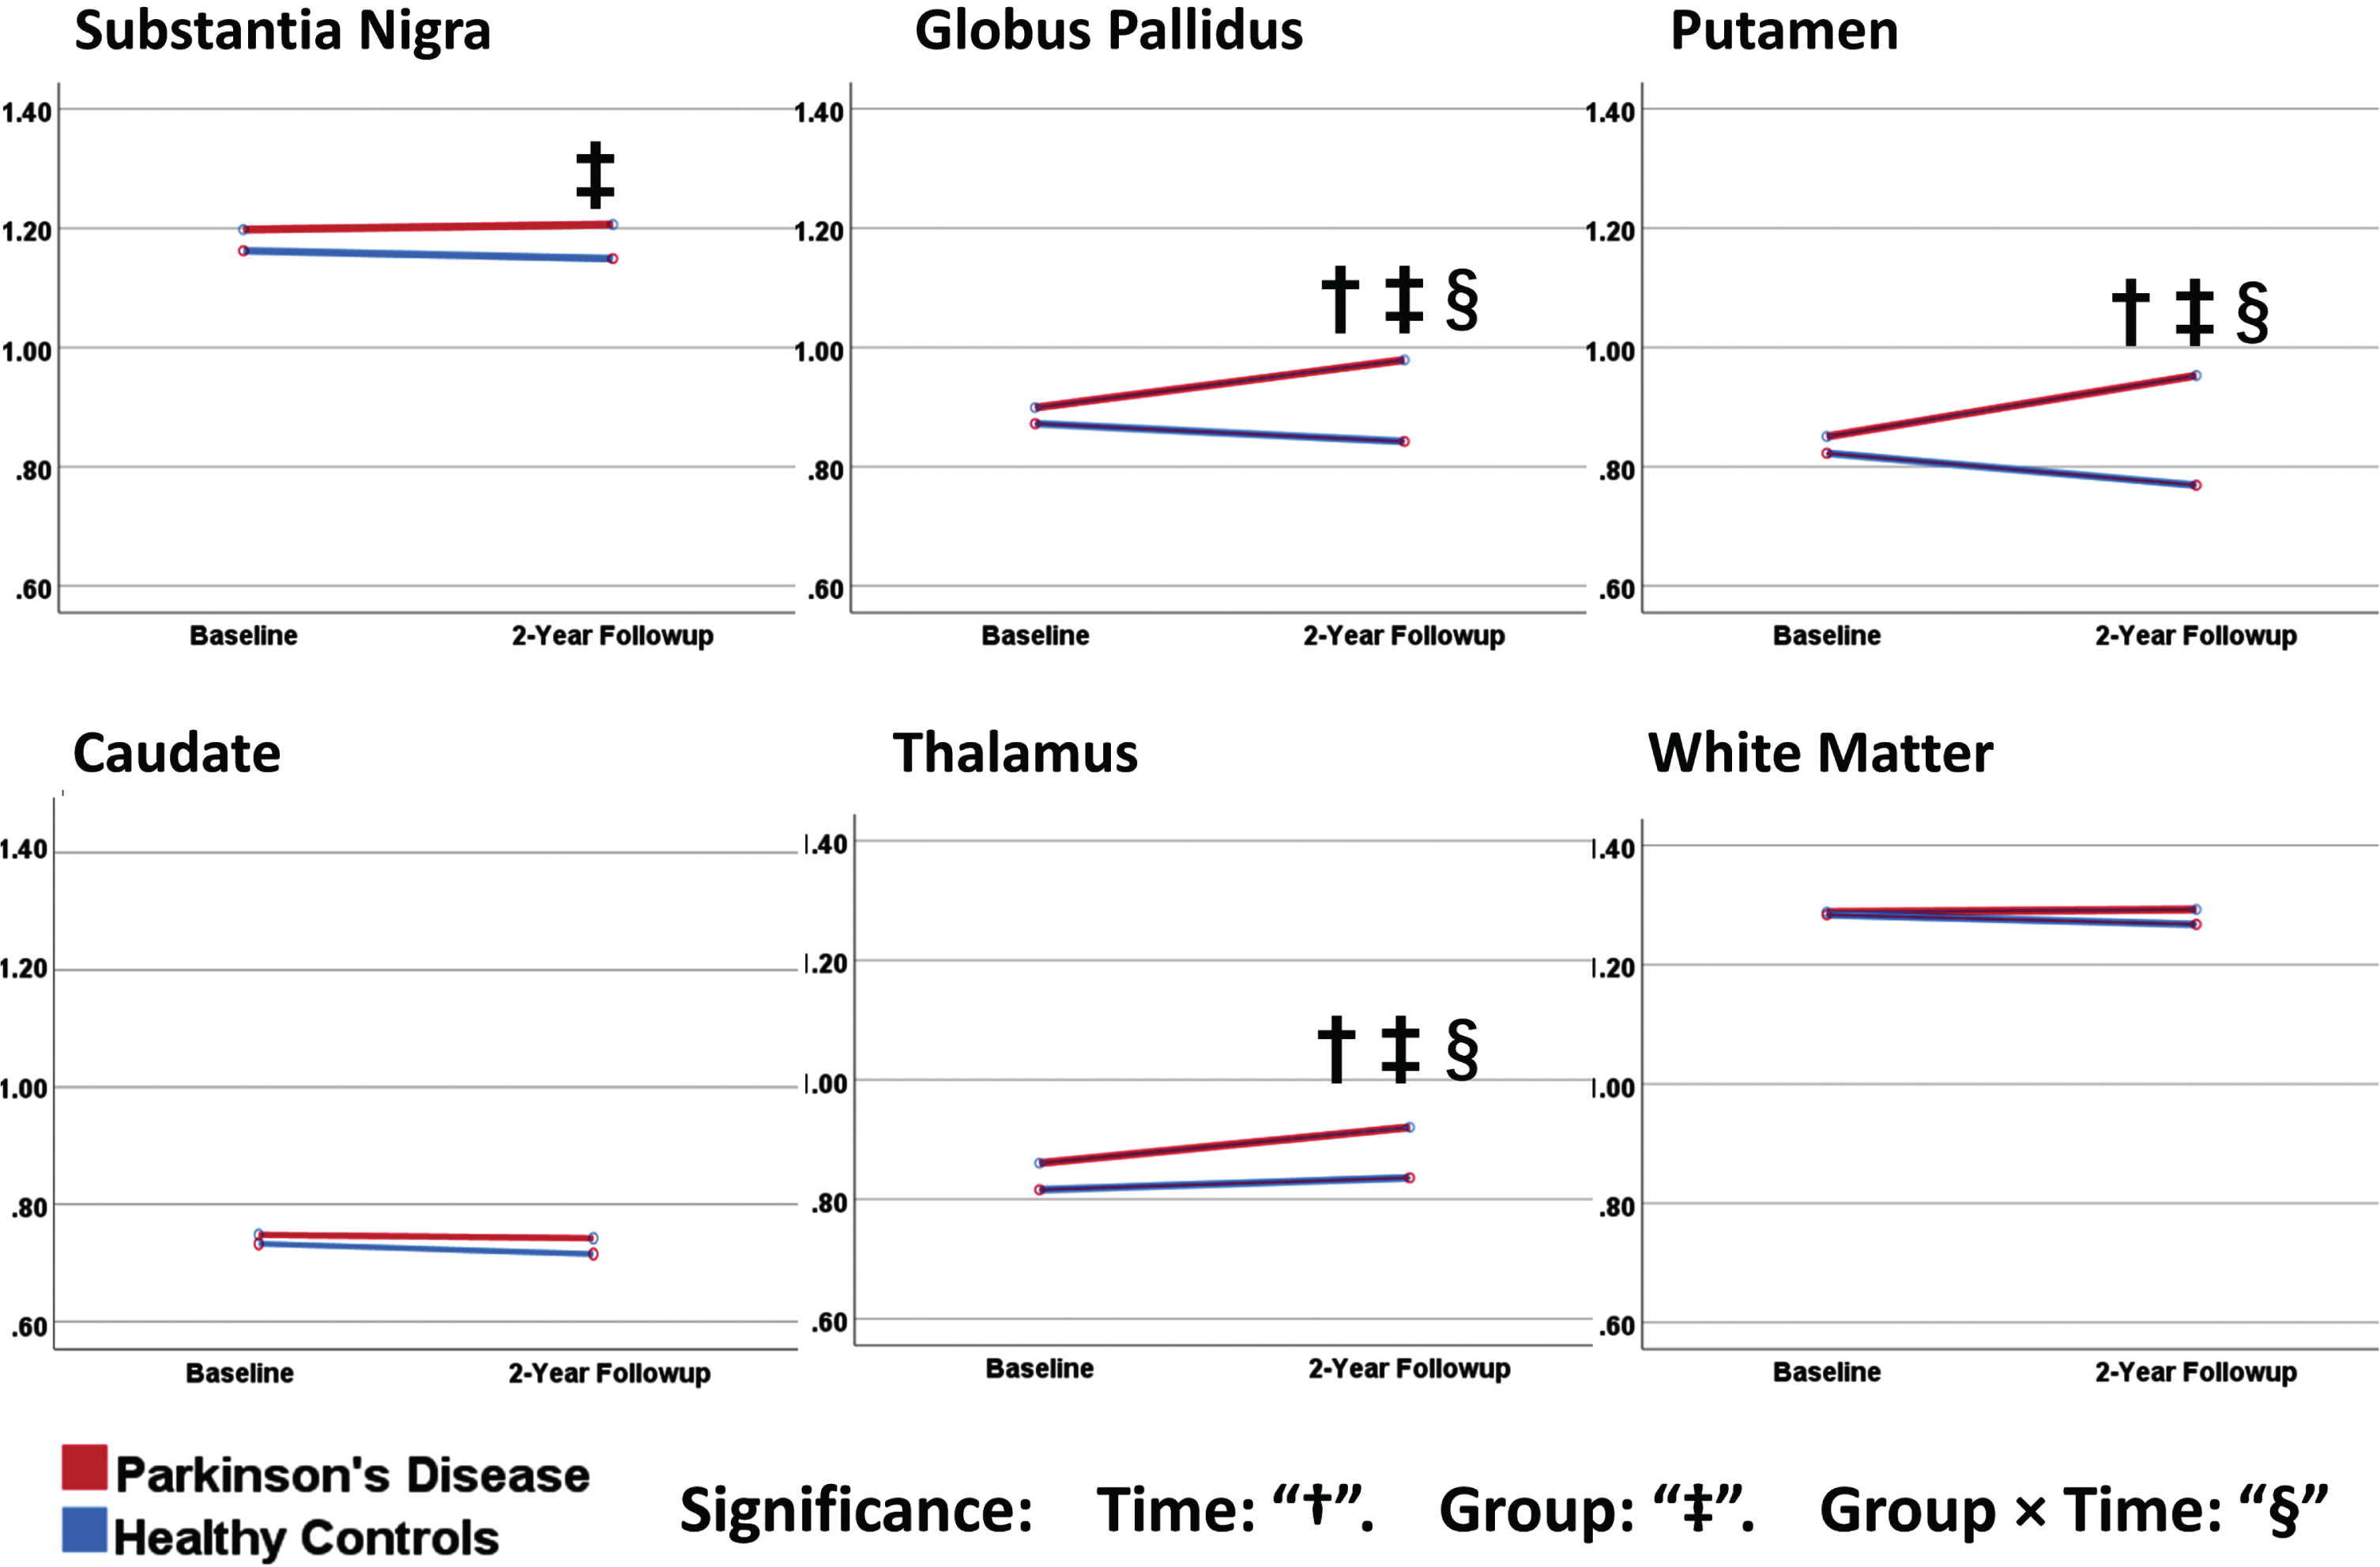
When looking at significant effects for group differences at individual timepoints, the baseline results were concordant with our above findings in the “Baseline abnormalities” section (SN, putamen, GP, and thalamus). At follow-up, the same group differences either persisted (SN) or grew (putamen, GP and thalamus, caudate) in the same regions. Figure 3 indicates significant effects for “group” with a “‡”.
When we looked at the interaction of “group” and “time”, we found significant effects for the putamen, GP, and thalamus (
Longitudinal change in secondary kurtosis measures of grey matter nuclei between groups
We then investigated longitudinal changes in the secondary DTI and DKI measures using the same approach. We found significant “group×time” interaction effects for the SN, putamen, thalamus, and GP (Supplementary Table 3). In each region, the PD group had an increase in either RD, MD, or AK while the control group had stable or decreasing AD, RD, MD, or AK. The SN, putamen, GP, and thalamus had significant interaction effects for AK. The putamen had a significant interaction effect for RD. However, none of the results for secondary imaging measures were significant when controlling for multiple comparisons. There were no significant interaction effects for AD, MD, FA, KFA, or RK, or in the caudate or WM. These findings show that the above interaction effects for MK in the putamen, GP, and thalamus may have been driven primarily by changes in the axial diffusion/kurtosis components (rather than the radial components).
Correlations of change in mean kurtosis and change in PD motor or cognitive symptoms
We did not detect any significant correlations between the 2-year change in regional MK and two-year change in MDS-UPDRS-III (Supplementary Table 4), although this test may be flawed due to a large number of participants with no change in MDS-UPDRS-III and the small discrete range of MDS-UPDRS-III data. We also found that decline in cognitive (MoCA) performances was also not significantly correlated with change in MK in any ROI. There was however a marginal effect in the putamen, suggesting association of declining MoCA scores with increasing MK (p = 0.064). When investigating baseline imaging predictors of PD clinical worsening, we found that the two-year change in MDS-UPDRS-III was not correlated with baseline MK in any region.
DISCUSSION
We present a longitudinal study of DKI in early PD, in a large sample (n = 262) including analysis of a range of DTI and DKI indices. We found clear divergence between PD and controls for MK of the GP and putamen, even in early-stage PD patients, and over the relatively short time period of the study (two years). Our results show early evidence for the added value of the parallel and transversal diffusion/kurtosis components to the differentiation of early PD from controls. These results signify a possible future role for DKI in tracking progression of brain microstructural change and monitoring the effects of interventions on brain microstructure.
Our results confirmed our first hypothesis that DKI characteristics of key nuclei would be altered between baseline and two-year timepoints in PD patients compared to controls, even in the earliest disease stages after diagnosis. First, our baseline measurements showed increased MK in all regions in the PD group compared to controls, which are known to be closely associated with motor dysfunction in PD. We then further investigated baseline changes in the secondary DTI/DKI indices, which showed a wide variation in profile (Fig. 2). This variation implies the need for a nuanced approach when interpreting MK changes. For example, our data show that the largest differences from controls are not always found in FA, MD, or MK, and that, importantly, the best differentiators vary across nuclei. While MK reflects heterogeneity of the diffusion environment, the parallel and transversal kurtosis components reflect heterogeneity either specifically along or across the principal axis of diffusion [5]. Previous cross-sectional studies using conventional DTI show higher MD and lower FA in basal ganglia in PD, which our baseline data agree with [33–35].
We then found divergence of the two groups for MK in the same regions (putamen, GP, and thalamus) over the 2-year interval, as shown by significant interaction effects for group×time. These regions are involved in PD pathology [36] and form part of a generalized “tremor network” [37]. Progressive increases in diffusion heterogeneity could reflect remodeling downstream of dopaminergic neuronal degeneration in the SN, or direct degeneration of the SN’s extensive arborization in the striatum and basal ganglia. Our longitudinal analysis of secondary DKI measures may inform the driving forces behind these MK changes: our data showed that all regions with MK changes also had MD changes, and that the axial component was more likely the cause of the MK changes than the radial component. One previous longitudinal study, albeit in more advanced PD (5.5 years duration), found putaminal changes in FA, which we did not observe [16], so this may be present only with longer disease duration.
Previous studies using conventional DTI in PD have demonstrated changes over shorter timeframes [35, 38] (13 and 19 months). One [38] found only changes (increased MD and reduced FA) in the SN in PD using manual ROI drawing and also without correlation to clinical scores in a smaller sample (n = 18 with PD). Another [35] showed longitudinal changes in the SN, midbrain, and thalamus in PD (increased diffusivity and reduced FA) based on automated ROIs in 120 PD patients. The added value of our study is clear in the increased sample size, earlier disease stage, more advanced imaging, automatic analysis approach and additional, detailed findings, over a 24-month timeframe.
In the SN itself, we did not detect a significant change over time, although MK in the SN is more difficult to accurately measure because of its small size, irregular shape, and susceptibility to imaging artefacts from iron deposition and geometric distortion [39]. These can lead to partial volume effects, imprecise segmentation, and reduced signal-to-noise ratio. The cerebral WM also did not show significant group or time differences in MK, which supports the specificity of our positive results for PD, since WM changes are only typically associated with later-stage PD pathology [40].
Our secondary hypothesis, that the DKI measures would correlate with the decline in motor function, was not confirmed. One possibility is that this test lacked the capability to detect such a relationship since the patients have been medically treated, which affected the MDS-UPDRS-III scores of patients measured during the “on” state in our study. Secondly, due to the early disease stage of our cohort and relatively short (2-year) interval, the decline in motor function during the study was also limited. We also did not detect significant correlations with declining cognitive performance, although we did find a marginal (non-significant) effect between increasing MK and declining MoCA performance in the putamen. The putamen is typically more associated with motor function than cognitive function, although previous studies have shown relationships between iron deposition and MoCA in the putamen [41].
Strengths
Our study has the following strengths. First, we did not allow any scanner upgrades to take place during the course of the study, eliminating a potential confound. We took care to closely match our control group. Our imaging sequence was optimized to prioritize image quality while retaining a voxel size that would permit accurate measurements of small nuclei with reasonable signal-to-noise ratio. Further strengths are the sample size, longitudinal study design and early disease stage.
DKI itself has advantages in comparison to conventional DTI; for example, DKI has an additional shell with higher b-value (b = 2000) that is more sensitive to certain pathologies by emphasizing the effect of restricted diffusion, while having no major time penalty. Furthermore, compared to neurite orientation dispersion and density imaging (NODDI), DKI is more accessible and is computationally more straightforward, as well as being model-free (not limited to WM in its interpretation).
Limitations
A limitation of our study is that it is spatially constrained to the selected regions. A spatially unbiased data-driven study design might identify relevant changes in new regions that were not investigated here. Secondly, the biological meaning of altered DKI values is not fully understood and, while thought to reflect tissue heterogeneity, further studies are needed to better understand what various types of DKI alterations mean in the context of neurodegeneration. All our data were gathered during the “on” medication state, which may mask some clinical severity. Our DKI acquisition included only 30 directions per shell, which is considered a minimum for reasonable DTI and DKI measurements and may explain some of the variance in these measures. Free-water imaging is a second promising technique for imaging brain microstructure in PD and should be investigated in a similar manner [42].
Conclusion
In a longitudinal study, we demonstrated that DKI can detect increased MK in the putamen, GP, caudate, and thalamus in early PD, and that this effect increases over 2 years. This supports the notion that there is a progressive alteration of brain microstructure in these specific regions which is (a) not observed in other basal ganglia regions, (b) specific to early PD and not controls, and (c) is measurable using DKI and automatic segmentation techniques. While further technical improvements are needed, this could indicate a future role for DKI in tracking the progression of brain microstructural change, e.g., in response to treatment. However, a relationship between longitudinal change in microstructure and clinical severity was not strongly supported.
ACKNOWLEDGMENTS
We thank the MR radiographers, physicists and research coordinators at the Department of Diagnostic Radiology, Singapore General Hospital, and Siemens Medical Solutions, Singapore for their support in this study.
We acknowledge funding support from the National Medical Research Council (STaR and PD LCG 0002 to TEK, CSA award to CLL, OF-YIRG to TW [OFYIRG20nov-0032]), and an Open Fund Large Collaborative Grant (MOH-OFLCG18May-0002).
CONFLICT OF INTEREST
The authors declare no conflicts of interest. Tan Eng-King has received honoraria for editorial work for Elsevier and Wiley. Tan Eng-King is an Editorial Board Member of this journal but was not involved in the peer-review process nor had access to any information regarding its peer-review.
SUPPLEMENTARY MATERIAL
[1] The supplementary material is available in the electronic version of this article: https://dx.doi.org/10.3233/JPD-225095.
REFERENCES
[1] | Braak H , Braak E ((1991) ) Neuropathological stageing of Alzheimer-related changes. Acta Neuropathol 82: , 239–259. |
[2] | Stoessl AJ , Lehericy S , Strafella AP ((2014) ) Imaging insights into basal ganglia function, Parkinson’s disease, and dystonia. Lancet 384: , 532–544. |
[3] | Galvan A , Devergnas A , Wichmann T ((2015) ) Alterations in neuronal activity in basal ganglia-thalamocortical circuits in the parkinsonian state. Front Neuroanat 9: , 5. |
[4] | Obeso JA , Marin C , Rodriguez-Oroz C , Blesa J , Benitez-Temiño B , Mena-Segovia J , Rodríguez M , Olanow CW ((2008) ) The basal gangliain Parkinson’s disease: Current concepts and unexplained observations. Ann Neurol 64(Suppl 2): , S30–S46. |
[5] | Jensen JH , Helpern JA , Ramani A , Lu H , Kaczynski K ((2005) ) Diffusional kurtosis imaging: The quantification of non-gaussian water diffusion by means of magnetic resonance imaging. Magn Reson Med 53: , 1432–1440. |
[6] | Hellewell SC , Welton T , Eisenhuth K , Tchan MC , Grieve SM ((2021) ) Diffusion kurtosis imaging detects subclinical white matter abnormalities in Phenylketonuria. Neuroimage Clin 29: , 102555. |
[7] | Welton T , Maller JJ , Lebel RM , Tan ET , Rowe DB , Grieve SM ((2019) ) Diffusion kurtosis and quantitative susceptibility mapping MRI are sensitive to structural abnormalities in amyotrophic lateral sclerosis. Neuroimage Clin 24: , 101953. |
[8] | Zhuo J , Xu S , Proctor JL , Mullins RJ , Simon JZ , Fiskum G , Gullapalli RP ((2012) ) Diffusion kurtosis as an imaging marker for reactive astrogliosis in traumatic brain injury. Neuroimage 59: , 467–477. |
[9] | Zhu LH , Zhang ZP , Wang FN , Cheng QH , Guo G ((2019) ) Diffusion kurtosis imaging of microstructural changes in brain tissue affected by acute ischemic stroke in different locations. Neural Regen Res 14: , 272–279. |
[10] | Braak H , Ghebremedhin E , Rüb U , Bratzke H , Del Tredici K ((2004) ) Stages in the development of Parkinson’s disease-related pathology. Cell Tissue Res 318: , 121–134. |
[11] | Guan J , Ma X , Geng Y , Qi D , Shen Y , Shen Z , Chen Y , Wu E , Wu R ((2019) ) Diffusion kurtosis imaging for detection of early brain changes in Parkinson’s disease. Front Neurol 10: , 1285. |
[12] | Ito K , Sasaki M , Ohtsuka C , Yokosawa S , Harada T , Uwano I , Yamashita F , Higuchi S , Terayama Y ((2015) ) Differentiation among parkinsonisms using quantitative diffusion kurtosis imaging. Neuroreport 26: , 267–272. |
[13] | Wang JJ , Lin WY , Lu CS , Weng YH , Ng SH , Wang CH , Liu HL , Hsieh RH , Wan YL , Wai YY ((2011) ) Parkinson disease: Diagnostic utility of diffusion kurtosis imaging. Radiology 261: , 210–217. |
[14] | Bingbing G , Yujing Z , Yanwei M , Chunbo D , Weiwei W , Shiyun T , Yangyingqiu L , Jin S , Qingwei S , Ailian L , Lizhi X ((2020) ) Diffusion kurtosis imaging of microstructural changes in gray matter nucleus in Parkinson disease. Front Neurol 11: , 252. |
[15] | Kamagata K , Zalesky A , Hatano T , Ueda R , Di Biase MA , Okuzumi A , Shimoji K , Hori M , Caeyenberghs K , Pantelis C , Hattori N , Aoki S ((2017) ) Gray matter abnormalities in idiopathic Parkinson’s disease: Evaluation by diffusional kurtosis imaging and neurite orientation dispersion and density imaging. Hum Brain Mapp 38: , 3704–3722. |
[16] | Surova Y , Nilsson M , Lampinen B , Lätt J , Hall S , Widner H , van Westen D , Hansson O ((2018) ) Alteration of putaminal fractional anisotropy in Parkinson’s disease: A longitudinal diffusion kurtosis imaging study. Neuroradiology 60: , 247–254. |
[17] | Bai X , Zhou C , Guo T , Guan X , Wu J , Liu X , Gao T , Gu L , Xuan M , Gu Q , Huang P , Song Z , Yan Y , Pu J , Zhang B , Xu X , Zhang M ((2021) ) Progressive microstructural alterations in subcortical nuclei in Parkinson’s disease: A diffusion magnetic resonance imaging study. Parkinsonism Relat Disord 88: , 82–89. |
[18] | Huang X , Wen MC , Ng SYE , Hartono S , Chia NSY , Choi X , Tay KY , Au WL , Chan LL , Tan EK , Tan LCS ((2020) ) Periventricular white matter hyperintensity burden and cognitive impairment in early Parkinson’s disease. Eur J Neurol 27: , 959–966. |
[19] | Huang X , Ng SY , Chia NS , Acharyya S , Setiawan F , Lu ZH , Ng E , Tay KY , Au WL , Tan EK , Tan LC ((2018) ) Serum uric acid level and its association with motor subtypes and non-motor symptoms in early Parkinson’s disease: PALS study. Parkinsonism Relat Disord 55: , 50–54. |
[20] | Huang X , Ng SYE , Chia NSY , Setiawan F , Tay KY , Au WL , Tan EK , Tan LCS ((2019) ) Non-motor symptoms in early Parkinson’s disease with different motor subtypes and their associations with quality of life. Eur J Neurol 26: , 400–406. |
[21] | Ng YS , Abbas MM , Heng SH , Setiawan F , Sanchalika A , Tay K-Y , Au W-L , Tan E-K , Tan CL ((2018) ) Physical activity and its impact on non-motor aspects of Parkinson’s disease-the Early Parkinson’s Disease Longitudinal Singapore (PALS) study. Parkinsonism Relat Disord 46: , e18. |
[22] | Koh M , Chua CY , Ng S , Chia N , Saffari SE , Chen R , Choi X , Heng DL , Neo S , Tay KY , Au WL , Tan EK , Tan L , Xu Z (2020) Poor sleep quality is associated with fatigue in early Parkinson’s disease: A longitudinal study in the Early Parkinson’s Disease Longitudinal Singapore Study (PALS) Cohort. Mov Disord 35(Suppl 1), https://www.mdsabstracts.org/abstract/poor-sleep-quality-is-associated-with-fatigue-in-early-parkinsons-disease-a-longitudinal-study-in-the-early-parkinsons-disease-longitudinal-singapore-study-pals-cohort/ |
[23] | Gelb DJ , Oliver E , Gilman S ((1999) ) Diagnostic criteria for Parkinson disease. Arch Neurol 56: , 33–39. |
[24] | Goetz CG , Tilley BC , Shaftman SR , Stebbins GT , Fahn S , Martinez-Martin P , Poewe W , Sampaio C , Stern MB , Dodel R , Dubois B , Holloway R , Jankovic J , Kulisevsky J , Lang AE , Lees A , Leurgans S , LeWitt PA , Nyenhuis D , Olanow CW , Rascol O , Schrag A , Teresi JA , van Hilten JJ , LaPelle N ; Movement Disorder Society UPDRS Revision Task Force ((2008) ) Movement Disorder Society-sponsored revision of the Unified Parkinson’s Disease Rating Scale (MDS-UPDRS): Scale presentation and clinimetric testing results. Mov Disord 23: , 2129–2170. |
[25] | Goetz CG , Poewe W , Rascol O , Sampaio C , Stebbins GT , Counsell C , Giladi N , Holloway RG , Moore CG , Wenning GK , Yahr MD , Seidl L ; Movement Disorder Society Task Force on Rating Scales for Parkinson’s Disease ((2004) ) Movement Disorder Society Task Force report on the Hoehn and Yahr staging scale: Status and recommendations The Movement Disorder Society Task Force on rating scales for Parkinson’s disease. Mov Disord 19: , 1020–1028. |
[26] | Nasreddine ZS , Phillips NA , Bédirian V , Charbonneau S , Whitehead V , Collin I , Cummings JL , Chertkow HJ ((2005) ) The Montreal Cognitive Assessment, MoCA: A brief screening tool for mild cognitive impairment. J Am Geriatr Soc 53: , 695–699. |
[27] | Andersson JLR , Sotiropoulos SN ((2016) ) An integrated approach to correction for off-resonance effects and subject movement in diffusion MR imaging. Neuroimage 125: , 1063–1078. |
[28] | Avants BB , Tustison N , Song GJIj ((2009) ) Advanced normalization tools (ANTS). Insight J 2: , 1–35. |
[29] | Tabesh A , Jensen JH , Ardekani BA , Helpern JA ((2011) ) Estimation of tensors and tensor-derived measures in diffusional kurtosis imaging. Magn Reson Med 65: , 823–836. |
[30] | Fischl B ((2012) ) FreeSurfer. Neuroimage 62: , 774–781. |
[31] | Pauli WM , Nili AN , Tyszka JM ((2018) ) A high-resolution probabilistic atlas of human subcortical brain nuclei. Sci Data 5: , 180063. |
[32] | Andersson JL , Jenkinson M , Smith S (2007) Non-linear registration aka Spatial normalisation. FMRIB Technical Report TR07JA2. FMRIB Analysis Group of the University of Oxford, pp. 1–22. |
[33] | Chan LL , Rumpel H , Yap K , Lee E , Loo HV , Ho GL , Fook-Chong S , Yuen Y , Tan EK ((2007) ) Case control study of diffusion tensor imaging in Parkinson’s disease. J Neurol Neurosurg Psychiatry 78: , 1383–1386. |
[34] | Lenfeldt N , Hansson W , Larsson A , Nyberg L , Birgander R , Forsgren L ((2013) ) Diffusion tensor imaging and correlations to Parkinson rating scales. J Neurol 260: , 2823–2830. |
[35] | Zhang Y , Wu IW , Tosun D , Foster E , Schuff N ((2016) ) Progression of regional microstructural degeneration in Parkinson’s disease: A multicenter diffusion tensor imaging study. PLoS One 11: , e0165540. |
[36] | Poewe W , Seppi K , Tanner CM , Halliday GM , Brundin P , Volkmann J , Schrag A-E , Lang AE ((2017) ) Parkinson disease. Nat Rev Dis Primers 3: , 17013. |
[37] | Welton T , Cardoso F , Carr JA , Chan L-L , Deuschl G , Jankovic J , Tan E-K ((2021) ) Essential tremor. Nat Rev Dis Primers 7: , 83. |
[38] | Loane C , Politis M , Kefalopoulou Z , Valle-Guzman N , Paul G , Widner H , Foltynie T , Barker RA , Piccini P ((2016) ) Aberrant nigral diffusion in Parkinson’s disease: A longitudinal diffusion tensor imaging study. Mov Disord 31: , 1020–1026. |
[39] | Tan S , Hartono S , Welton T , Ann CN , Lim SL , Koh TS , Li H , Setiawan F , Ng S , Chia N , Liu S , Mark Haacke E , King Tan E , Chew Seng Tan L , Ling Chan L ((2021) ) Utility of quantitative susceptibility mapping and diffusion kurtosis imaging in the diagnosis of early Parkinson’s disease. Neuroimage Clin 32: , 102831. |
[40] | Tanner JJ , McFarland NR , Price CC ((2017) ) Striatal and hippocampal atrophy in idiopathic Parkinson’s disease patients without dementia: A morphometric analysis. Front Neurol 8: , 139. |
[41] | Zhao Y , Qu H , Wang W , Liu J , Pan Y , Li Z , Xu G , Hu C ((2022) ) Assessing mild cognitive impairment in Parkinson’s disease by magnetic resonance quantitative susceptibility mapping combined voxel-wise and radiomic analysis. Eur Neurol 85: , 280–290. |
[42] | Planetta PJ , Ofori E , Pasternak O , Burciu RG , Shukla P , DeSimone JC , Okun MS , McFarland NR , Vaillancourt DE ((2016) ) Free-water imaging in Parkinson’s disease and atypical parkinsonism. Brain 139: , 495–508. |

