
Neuropsychological Markers of Medial Perirhinal and Entorhinal Cortex Functioning are Impaired Twelve Years Preceding Diagnosis of Alzheimer’s Dementia
Abstract
Neurofibrillary pathology in Alzheimer’s dementia (AD) is associated with cognitive impairments and cortical thinning, and begins in medial perirhinal cortex (mPRC) before entering entorhinal cortex (ERC). Thus, mPRC dysfunction (e.g., semantic object memory impairments) may predate or accompany ERC (i.e., episodic memory) dysfunction in the preclinical course of typical AD. We developed formulae estimating mPRC and ERC integrity (i.e., cortical thickness) using common neuropsychological tests in 31 healthy individuals and 58 early AD patients. These formulae estimated the longitudinal courses of mPRC and ERC functioning in independent groups of 28 optimally healthy individuals who developed AD (NC-AD) over 2.8–13.4 years and 28 pairwise-matched, stable, healthy individuals (NC-NC). Mixed models demonstrated significantly worse NC-AD than NC-NC estimated mPRC and ERC functioning at the earliest observation, 12 years preceding diagnosis, and a significant decline 4 years preceding the AD diagnosis. These findings demonstrate that specific neuropsychological impairments occur early in the course of preclinical AD and that tasks measuring mPRC functioning may serve as additional, powerful markers of preclinical AD.
INTRODUCTION
The search for cognitive markers of preclinical Alzheimer’s dementia (AD) is informed by the pattern of progressive cortical neurofibrillary tangle (NFT) pathology in Alzheimer’s disease, as the largely intracellular, abnormally phosphorylated tau proteins are deemed responsible for functional deficits [1–3]. Episodic memory is commonly impaired first in the preclinical course of typical AD, predating the diagnosis by up to 10 years (see [4] and Supplementary Table 1). These findings are consistent with NFT-induced disruption of neuronal functioning in the entorhinal cortex (ERC) and hippocampus (HP) in the earliest stages of the disease. However, cortical NFT pathology begins in the medial perirhinal cortex (mPRC) before spreading to the ERC and HP [5, 6], suggesting that cognitive impairments associated with mPRC dysfunction may precede or accompany episodic memory impairments in the preclinical course of AD [6, 7].
Perirhinal (PRC) functions have traditionally been studied in non-human primates [8], and only more recently in humans (e.g., [9, 10]). Human neurocognitive research suggests that the PRC is required for processing semantic memories of individual objects, especially those that are easily confused with other similar objects [10, 11]. For example, patients with brain damage including the PRC are significantly impaired at processing semantically confusable versus semantically less confusable objects during picture naming and audiovisual crossmodal feature integration [12, 13] and in early AD patients, the disambiguation of semantically confusable objects specifically depended on mPRC (but not ERC) integrity [14]. Moreover, a delayed matching-to-sample task [15], which depends on the PRC [14, 15], has a high predictive value for progression from MCI to AD [7].
Longitudinal data are required to determine the relative temporal appearance of PRC and ERC/HP (i.e., episodic memory impairments) dysfunction in the preclinical course of AD. However, many well-established clinical neuropsychological tests used in current longitudinal studies are more meta-cognitive in nature, lacking the anatomical specificity to target the PRC. For example, Hirni et al. [16] demonstrated that both clinical tests of episodic memory and semantic object memory significantly predicted ERC/HP and PRC atrophy. However, linear regression analyses differentiated the relationships between PRC integrity and semantic memory functioning, and ERC/HP integrity and episodic memory functioning: when the opposing memory performance was controlled, episodic memory performance was associated with ERC/HP but not PRC integrity, whereas semantic memory was associated with both PRC and ERC/HP integrity [16]. These results indicate that when existing clinical neuropsychological data are used to assess PRC and ERC/HP functions, one way to increase anatomical specificity for medial temporal lobe substructures would be to control for the opposing memory performance.
This study aimed to determine the optimal combination of common clinical neuropsychological test variables to specifically predict mPRC and ERC functioning (prediction study). In a critical analysis, these formulae were applied to the neuropsychological test performance of longitudinal groups of initially optimally healthy individuals, some of whom progressed to AD, to determine whether and when mPRC and ERC functioning decline in the prodromal phase of AD (longitudinal study). If also mPRC functions decline in the prodromal phases of AD, corresponding neuropsychological measures may prove powerful diagnostic markers of very early AD.
METHODS
Prediction study: Estimating mPRC and ERC functioning
Participants
Demographically matched groups of 31 normal control (NC) subjects, 31 patients with amnestic mild cognitive impairment (aMCI), a putative prodrome of AD, and 27 early AD patients participated (see Table 1). All NC participants were cognitively and neurologically healthy. aMCI patients were diagnosed according to the Winblad et al. [17] criteria and early AD patients according to DSM-IV [18] and McKhann et al. [19]. No participant suffered from depression according to ICD-10 criteria [20].
Neuropsychological tests
All participants completed the German version of the California Verbal Learning Test (CVLT) [21] and one-minute category verbal fluency task (animals) (VF) [22]. The numbers correct on the long delay free recall of the CVLT and VF were used as measures of episodic and semantic memory, respectively.
MRI
All participants underwent high resolution T1-weighted 3D MPRAGE imaging (12 channel headcoil; inversion time = 1000 ms, repetition time = 2000 ms, echo time = 3.37 ms, flip angle = 8°; acquisition matrix = 256×256 mm, voxel size = 1 mm isotropic) on the same 3-T MRI scanner (MAGNETOM Verio, Siemens) at the University Hospital Basel. MRI scanning was conducted within three months of behavioral testing (mean = 52 days, SD = 43 days).
MPRAGEs were preprocessed in FreeSurfer (http:/surfer.nmr.mgh.harvard.edu) as described elsewhere [14] and regions of interest (ROIs) for the mPRC and ERC were drawn by the same, blinded rater on cortical surface reconstructions of segmented T1-weighted images based on anatomical landmarks described elsewhere [23, 24]. Only left hemisphere ROIs were drawn because of the verbal nature of the neuropsychological tasks. Mean cortical thicknesses for each ROI in each participant were normalized by their respective mean cortical thickness of the entire left hemisphere to account for inter-individual differences in the thickness of the cortical mantle. Two linear multiple regression analyses predicted mean mPRC and ERC cortical thickness, respectively, with VF, CVLT, and age, thereby generating formulae to estimate mPRC and ERC functioning. To determine the specificity of neuropsychological test performance for mPRC and ERC integrity, three additional linear multiple regression analyses tested whether CVLT and VF performance (covarying total intracranial volume and age) predicted mean left hemisphere frontal, parietal, and temporal lobe region of interest thickness, which were normalized in the same manner as the mPRC and ERC ROI.
Longitudinal study: Preclinical course of estimated mPRC and ERC functioning
Participants
An independent sample of 28 originally optimally healthy individuals who progressed to AD [18, 19] over a mean of 8.7 (range: 2.8–13.4) years (NC-AD) were pairwise matched (age, gender, education, observation period) to 28 optimally healthy NC participants who remained cognitively healthy within the same timeframe (NC-NC) as defined by normal test performance on a comprehensive battery of neuropsychological tests (Table 1, “Longitudinal Study”). Critically, groups were comparable with respect to ApoE status (see Table 1). All participants were members of a longitudinal study on preclinical cognitive markers of AD [25], for which they fulfilled inclusion criteria (i.e., cognitively normal and native German or Swiss-German speakers) and the following stringent exclusion criteria to ensure optimal cognitive health: no sensory or motor deficit that hinders neuropsychological testing or everyday life, continuous light to intense pain, psychiatric disturbance, potent psychoactive medication (except tranquilizers), or general anesthesia within last three months, history of central nervous system disease, psychiatric disease requiring hospitalization, drug or substance abuse, cerebrovascular disease, generalized atherosclerosis, insulin-resistant diabetes, or loss of consciousness lasting more than 5 minutes.
Procedure
Participants were assessed with a neuropsychological battery including, among other tests, the Mini-Mental State Examination score (MMSE) [26], VF and the German version of the CVLT [21]. mPRC and ERC functioning was estimated at each visit using the formulae derived from Study 1. The Consortium to Establish a Registry for Alzheimer’s Disease-Neuropsychological Assessment Battery (CERAD-NAB) word list [27] was administered in lieu of the CVLT at 89/295 examinations, in which cases validated CERAD-NAB-to-CVLT transformation formulae were first applied to the CERAD-NAB delayed recall score [28, 29] before applying the Study 1 formulae.
Statistical analyses
Linear mixed-effects models fit by REML (restricted maximum likelihood) modeled the course of estimated mPRC and ERC functioning as well as MMSE scores for comparison purposes of the NC-NC and NC-AD groups [30], where participants were modeled as random effects and diagnostic category and time until AD diagnosis (months) as fixed effects. First, common potential changepoints in the course of estimated mPRC and ERC functioning were determined by maximizing the model likelihood on a grid of potential changepoints every 0.25 years from the earliest testing up until diagnosis. The ‘changepoint’ was defined as a difference in slope of the line fitting behavioral measures prior to and following the modeled changepoints; when a changepoint x was identified (i.e., a difference in slopes prior to and following timepoint x), the significance of the difference in slopes was tested in subsequent models. Three different models were then fitted for each behavioral measure, all of which modeled group (NC-NC versus NC-AD) as fixed effects and (1) a common NC-NC and NC-AD slope before the changepoint and different slopes after the changepoint, (2) a single slope for NC-NC (no changepoint) and different slopes before and after the NC-AD changepoint, and (3) a common NC-NC and NC-AD slope prior to the changepoint and a different NC-AD slope after the changepoint.
RESULTS
Prediction study: Estimating mPRC and ERC functioning
The linear regression model predicting mean mPRC thickness with age, VF, and CVLT reached significance (F(3, 83) = 7.8812, p = 0.0001; R2 = 0.222). Both VF and CVLT significantly predicted mean mPRC thickness (t = 2.0143, p = 0.0472 and t = 2.0401, p = 0.0445, respectively), while age did not (t = –0.7743, p = 0.4409), resulting in the following formula: [estimated mPRC thickness] = 1.126829 + [(–2.374 * age) + (8.476 * VF) + (10.782 * CVLT)]/1000.
The linear regression model predicting mean ERC thickness with age, VF, and CVLT was likewise significant (F(3, 83) = 7.1060, p < 0.001; R2 = 0.204). However, CVLT was the only significant predictor (t = 2.3761, p = 0.0198; VF: t = 1.6906, p = 0.0947; age: t = 0.0235, p = 0.9813). The final model is: [estimated ERC thickness] = 1.293357 + [(0. 069 * age) + (6.851 * VF) + (12.092 * CVLT)]/1000.
To determine the specificity of these findings, three additional linear multiple regression analyses tested whether CVLT and VF performance significantly predicted normalized left frontal, parietal or temporal lobe thickness. Neither CVLT nor VF performance was a significant predictor for normalized left frontal (CVLT: β= –0.13, p = 0.263; VF: β= –0.21, p = 0.066), parietal (CVLT: β= –0.06, p = 0.578; VF: β= –0.17, p = 0.127) or temporal lobe thickness (CVLT: β= –0.03, p = 0.787; VF: β= –0.12, p = 0.273).
Longitudinal study: Preclinical courses of estimated mPRC and ERC functioning
The longitudinal courses of estimated mPRC and ERC functioning, as well as MMSE scores, of the NC-NC and NC-AD groups are shown in Fig. 1a and b.
Linear mixed-effects models testing for changes in the slopes of estimated mPRC and ERC functioning (i.e., changepoints) in the NC-NC and NC-AD revealed no change of slopes for the NC-NC group (mPRC: estimate (SE) = 0.0002 (0.0028), t = 0.0844, p = 0.9328; ERC: estimate (SE) = –0.0005 (0.0026), t = –0.1942, p = 0.8462), but changes in the slopes of the NC-AD group (mPRC: estimate (SE) = –0.0228 (0.0029), t = –7.8952, p < 0.0001; ERC: estimate (SE) = –0.0218 (0.0027), t = –8.2229, p < 0.0001) corresponding to 4.25 years preceding diagnosis (see Fig. 1, black asterisks). The second set of models demonstrated that NC-NC and NC-AD groups had comparable slopes of estimated mPRC and ERC functioning prior to the changepoints (mPRC: estimate (SE) = –0.0018 (0.0021), t = 0.8286, p = 0.4081; ERC: estimate (SE) = 0.0014 (0.0020), t = 0.6937, p = 0.4886). We therefore describe the third set of models in detail below, i.e., those which modeled common NC-NC and NC-AD slopes prior to the changepoint and different NC-AD slopes after the changepoint.
Critically, estimated mPRC and ERC functioning differed significantly between NC-NC and NC-AD individuals at the earliest timepoint, 12 years preceding diagnosis (mPRC intercepts: estimate (SE) = 0.0409 (0.0156), t = 2.6257, p = 0.01; ERC intercepts: estimate (SE) = 0.0418 (0.0133), t = 3.1293, p < 0.01) (see Fig. 1, red asterisks). The courses of estimated mPRC and ERC functioning of the NC-NC and NC-AD groups differed significantly following the respective changepoints, 4.25 years preceding diagnosis (change of slope in NC-AD group, mPRC: estimate (SE) = –0.0229 (0.0024), t = –9.6280, p < 0.0001; ERC: estimate (SE) = –0.0215 (0.0022), t = –9.8356, p < 0.0001).
Linear mixed models of longitudinal MMSE performance demonstrated that the NC-NC group did not display a change in performance (estimate (SE) = –0.1827 (1.0509), t = –0.1738, p = 0.8622), while the NC-AD group did (estimate (SE) = –6.6474 (1.1361), t = –5.8513, p < .0001). However, the change in NC-AD MMSE performance occurred at the timepoint of the AD diagnosis. The slopes of the NC-NC and NC-AD MMSE performance prior to diagnosis were comparable (estimate (SE) = 0.0189 (0.0427), t = 0.4434, p = 0.6579), as were their intercepts (estimate (SE) = 0.3325 (0.2737), t = 1.2144, p = 0.2299). Thus, NC-NC and NC-AD groups displayed identical courses of MMSE functioning during the 12 years prior to and up until the AD diagnosis (see Fig. 1, right panel), consistent with previous clinical experience [31, 32].
DISCUSSION
Common clinical neuropsychological tests significantly predicted the mean cortical thicknesses of the mPRC and ERC: both semantic and episodic memory measures were significant predictors of mPRC thickness, while only episodic memory significantly predicted ERC thickness. These findings were specific to mPRC and ERC structural integrity, since semantic and episodic test performance failed to significantly predict left temporal, parietal, or frontal lobe thickness. While these findings require confirmation in a larger longitudinal cohort, ideally with CSF and/or PET measures of pathological amyloid-β and tau load, the present approach, and formulae, may be applied in clinical settings to more specifically assess the functional integrity of these circumscribed anterior medial temporal lobe (aMTL) regions.
These formulae were used here to estimate longitudinal mPRC and ERC functioning in two independent groups of originally optimally healthy older individuals: those that went on to develop AD (NC-AD) and pairwise matched individuals who remained cognitively healthy (NC-NC). We note that stringent inclusion and exclusion criteria ensured that all participants were optimally healthy at baseline. The slight decrease in performance of the NC-NC participants over time most likely reflects the known slight decline in cognitive test performance (such as, for example, in episodic, source, semantic, and procedural memory probably due to reduced processing speed and increased liability to interference) associated with advancing age [33]. Both the estimated mPRC and ERC functioning of the NC-AD group was significantly inferior to that of the pairwise-matched NC-NC group at the earliest available testing, 12 years preceding diagnosis, and further declined circa 4 years preceding diagnosis, corresponding roughly to the timepoint when MCI is typically diagnosed [34, 35]. In contrast, the widely-used MMSE, a measure of global cognitive functioning, did not distinguish the NC-NC and NC-AD groups until immediately prior to the AD diagnosis. These findings are consistent with the earliest cortical deposition of AD neurofibrillary pathology in mPRC and ERC [5, 6] and suggest that not only episodic, but also semantic memory, may be early and specific cognitive markers of future AD.
Additionally, the present results are in line with a longitudinal MRI study demonstrating significant atrophy in medial temporal, inferolateral temporal, and parietal lobes and posterior cingulate in families with early-onset AD circa five years before the diagnosis of AD [36], as well as studies with sporadic AD patients which demonstrated atrophy of medial temporal lobe structures four to ten years before the AD diagnosis [37–41].
The majority of large-scale longitudinal studies of cognitive functioning in preclinical AD report that episodic memory is the first function to decline, up to ten years preceding the diagnosis of AD, while semantic memory becomes impaired many years later (see [2] and Supplementary Table 1). However, Amieva et al. [32] reported a notable exception to this rule: in the PAQUID study, semantic memory as measured by semantic fluency was significantly impaired at the earliest testing 12 years preceding the diagnosis of AD in their group of 350 NC-AD patients. Episodic memory became impaired three years later, i.e., 9 years preceding the diagnosis of AD. Similar findings were reported by Wilson et al. [42], who showed that an average of three semantic memory tests (i.e., verbal fluency, Boston Naming Test, and a measure of reading recognition) was affected earlier than episodic memory performance (76 versus 63 months, respectively) in a group of 462 NC-AD patients. Since the mPRC presumably codes for semantic object memories [14, 16], the findings of Amieva et al. [32] and Wilson et al. [42] are in line with the pattern of cortical NFT pathology in AD, which affects the mPRC before the ERC in the preclinical course of AD [5].
A commonly cited biomarker model of preclinical AD [43] states that cognitive dysfunction occurs in the last preclinical stages of the disease, i.e., at diagnosis. Specifically, NFT pathology occurs prior to cortical atrophy as measured by MRI, followed by clinical symptoms. Thus, at a given point in time, MR atrophy will be more abnormal than cognitive functioning (cf. [33], Figure 2A). However, longitudinal studies demonstrate that significant aMTL atrophy is apparent only circa 3.5 years prior to the AD diagnosis [44–46], i.e., after semantic and episodic memory impairments as shown here. Also, NFT pathogenesis supports the initial affectation of function followed by structural atrophy, since the earliest stages of tau pathology are associated with neuronal dysfunction but not yet significant atrophy [47]. For example, experimentally induced abnormal tau hyperphosphorylation in rats resulted in significant learning and memory impairments just months later [48], i.e., before the tissue loss could occur [47]. Thus, NFT-induced functional mPRC impairments appear early in the preclinical course of AD, offering clinicians an inexpensive, early and specific additional AD biomarker. The challenge to future studies will be to develop more specific cognitive measures of mPRC functioning than the current clinical neuropsychological tools [14, 15, 23] by taking advantage of the wealth of primarily non-human primate research on these structures [8].
ACKNOWLEDGMENTS
This study was financed by an Ambizione Fellowship from the Swiss National Science Foundation (KIT), grants from the Alzheimer’s Association of both Basels and the Foundation for Dementia Research Basel (KIT), grant Nr. 3200–049107 from the Swiss National Science Foundation, the Velux Foundation, the Alfred and Anneliese Sutter-Stöttner Stiftung (AUM) and the Novartis Foundation. The funding sources had no involvement in study design, in the collection, analysis and interpretation of data. The Department of Radiology (coauthors: CS, SU, JR), University Hospitals Basel, Switzerland receives financial support from Bayer Healthcare, Bracco and Guerbet and has a research agreement with SIEMENS Medical Solutions. The submitted work is not related to these agreements.
Authors’ disclosures available online (http://j-alz.com/manuscript-disclosures/15-0158r1).
Appendices
The supplementary material is available in the electronic version of this article: http://dx.doi.org/10.3233/JAD-150158.
REFERENCES
[1] | Giannakopoulos P , Herrmann FR , Bussière T , Bouras C , Kövari E , Perl DP , Morrison JH , Gold G , Hof PR ((2003) ) Tangle and neuron numbers, but not amyloid load, predict cognitive status in Alzheimer’s disease. Neurology 60: , 1495–1500. |
[2] | Giannakopoulos P , Kövari E , Gold G , von Gunten A , Hof PR , Bouras C ((2009) ) Pathological substrates of cognitive decline in Alzheimer’s disease. Front Neurol Neurosci 24: , 20–29. |
[3] | Wirth M , Madison CM , Rabinovici GD , Oh H , Landau SM , Jagust WJ ((2013) ) Alzheimer’s disease neurodegenerative biomarkers are associated with decreased cognitive function but not β-amyloid in cognitively normal older individuals. J Neurosci 33: , 5553–5563. |
[4] | Schmid NS , Taylor KI , Foldi NS , Berres M , Monsch AU ((2012) ) Neuropsychological signs of Alzheimer’s disease 8 years prior to diagnosis. J Alzheimers Dis 34: , 537–546. |
[5] | Braak H , Braak E ((1991) ) Neuropathological stageing of Alzheimer-related changes. Acta Neuropathol (Berl) 82: , 239–259. |
[6] | Taylor KI , Probst A ((2008) ) Anatomic localization of the transentorhinal region of the perirhinal cortex. Neurobiol Aging 29: , 1591–1596. |
[7] | Didic M , Barbeau EJ , Felician O , Tramoni E , Guedj E , Poncet M , Ceccaldi M ((2011) ) Which memory system is impaired first in Alzheimer’s disease? J Alzheimers Dis 27: , 11–22. |
[8] | Murray EA , Bussey TJ , Saksida LM ((2007) ) Visual perception and memory: A new view of medial temporal lobe function in primates and rodents. Annu Rev Neurosci 30: , 99–122. |
[9] | Davies RR , Graham KS , Xuereb JH , Williams GB , Hodges JR ((2004) ) The human perirhinal cortex and semantic memory. Eur J Neurosci 20: , 2441–2446. |
[10] | Tyler LK , Stamatakis EA , Bright P , Acres K , Abdallah S , Rodd JM , Moss HE ((2004) ) Processing objects at different levels of specificity. J Cogn Neurosci 16: , 351–362. |
[11] | Taylor KI , Moss HE , Stamatakis EA , Tyler LK ((2006) ) Binding crossmodal object features in perirhinal cortex. Proc Natl Acad Sci U S A 103: , 8239–8244. |
[12] | Moss HE , Rodd JM , Stamatakis EA , Bright P , Tyler LK ((2005) ) Anteromedial temporal cortex supports fine-grained differentiation among objects. Cereb Cortex 15: , 616–627. |
[13] | Taylor KI , Stamatakis EA , Tyler LK ((2009) ) Crossmodal integration of meaningful object features: Voxel-based correlations implicate anteromedial temporal lobe and temporal pole. Brain 132: , 671–683. |
[14] | Kivisaari SL , Tyler LK , Monsch AU , Taylor KI ((2012) ) Medial perirhinal cortex disambiguates confusable objects. Brain 135: , 3757–3769. |
[15] | Barbeau E , Didic M , Tramoni E , Felician O , Joubert S , Sontheimer A , Ceccaldi M , Poncet M ((2004) ) Evaluation of visual recognition memory in MCI patients. Neurology 62: , 1317–1322. |
[16] | Hirni D , Kivisaari SL , Monsch AU , Taylor KI ((2013) ) Distinct neuroanatomical bases of episodic and semantic memory performance in Alzheimer’s disease. Neuropsychologia 51: , 930–937. |
[17] | Winblad B , Palmer K , Kivipelto M , Jelic V , Fratiglioni L , Wahlund L-O , Nordberg A , Bäckman L , Albert M , Almkvist O , Arai H , Basun H , Blennow K , De Leon M , Decarli C , Erkinjuntti T , Giacobini E , Graff C , Hardy J , Jack C , Jorm A , Ritchie K , Van Duijn C , Visser P , Petersen RC ((2004) ) Mild cognitive impairment - beyond controversies, toward a consensus: Report of the International Working Group on Mild Cognitive Impairment. J Intern Med 256: , 240–246. |
[18] | American Psychiatric Association ((1994) ) DSM-IV: Diagnostic and Statistical Manual of Mental Disorders, American Psychiatric Press, Washington, DC. |
[19] | McKhann G , Drachman D , Folstein M , Katzman R , Price D , Stadlan E ((1984) ) Clinical diagnosis of Alzheimer’s disease: Report of the NINCDS-ADRDA work group under the auspices of department of health and human services task force on Alzheimer’s disease. Neurology 34: , 939–944. |
[20] | ICD-10: International statistical classification of diseases and related health problems ((2011) ), World Health Organization, Geneva. |
[21] | Delis DC , Kramer JH , Kaplan E , Ober BA ((1987) ) California Verbal Learning Test, Psychological Corporation, San Antonio, TX. |
[22] | Lezak MD , Howieson DB , Loring DW ((2004) ) Neuropsychological Assessment, Oxford University Press, Oxford. |
[23] | Kivisaari SL , Probst A , Taylor KI ((2013) ) The perirhinal, entorhinal, and parahippocampal cortices and hippocampus: An overview of functional anatomy and protocol for their segmentation in MR images. In fMRI: Basics and Clinical Application,Ulmer S, Jansen O, eds. Springer Berlin Heidelberg, pp. 239–267. |
[24] | Krumm S , Kivisaari SL , Probst A , Monsch AU , Reinhardt J , Ulmer S , Stippich C , Kressig RW , Taylor KI ((2016) ) Cortical thinning of parahippocampal subregions in very early Alzheimer’s disease. Neurobiol Aging 38: , 188–196. |
[25] | Monsch AU , Thalmann B , Schneitter M , Bernasconi F , Aebi C , Camachova-Davet Z , Stähelin HB ((2000) ) The Basel Study on the Elderly’s search for preclinical cognitive markers of Alzheimer’s disease. Neurobiol Aging 21: , 31 (abstract). |
[26] | Folstein MF , Folstein SE , McHugh PR ((1975) ) “Mini Mental State” - a practical method for grading the cognitive state of patients for the clinician. J Psychiatry Res 12: , 189–198. |
[27] | Morris JC , Heyman A , Mohs RC , Hughes JP , van Belle G , Fillenbaum G , Mellits ED , Clark C ((1989) ) The Consortium to Establish a Registry for Alzheimer’s Disease (CERAD). Part I. Clinical and neuropsychological assessment of Alzheimer’s disease. Neurology 39: , 1159–1165. |
[28] | Beck IR , Gagneux-Zurbriggen A , Berres M , Taylor KI , Monsch AU ((2012) ) Comparison of verbal episodic memory measures: Consortium to establish a registry for Alzheimer’s disease–Neuropsychological Assessment Battery (CERAD-NAB) versus California Verbal Learning Test (CVLT). Arch Clin Neuropsychol 27: , 510–519. |
[29] | Berres M , Monsch AU , Bernasconi F , Thalmann B , Stähelin HB ((2000) ) Normal ranges of neuropsychological tests for the diagnosis of Alzheimer’s disease. Std Health Technol Inf 77: , 195–199. |
[30] | Baayen R , Davidson D , Bates D ((2008) ) Mixed-effects modeling with crossed random effects for subjects and items. J Mem Lang 59: , 390–412. |
[31] | Mitchell AJ ((2009) ) A meta-analysis of the accuracy of the mini-mental state examination in the detection of dementia and mild cognitive impairment. J Psychiatr Res 43: , 411–431. |
[32] | Amieva H , Le Goff M , Millet X , Orgogozo J-M , Péerès K , Barberger-Gateau P , Jacqmin-Gadda H , Dartigues J-F ((2008) ) Prodromal Alzheimer’s disease: Successive emergence of the clinical symptoms. Ann Neurol 64: , 492–498. |
[33] | Hultsch DF ((1998) ) Memory Change in the Aged, Cambridge University Press, UK. |
[34] | Gauthier S , Reisberg B , Zaudig M , Petersen RC , Ritchie K , Broich K , Belleville S , Brodaty H , Bennett D , Chertkow H , Cummings JL , de Leon M , Feldman H , Ganguli M , Hampel H , Scheltens P , Tierney MC , Whitehouse P , Winblad B , International Psychogeriatric Association Expert Conference on mild cognitive impairment ((2006) ) Mild cognitive impairment. Lancet Lond Engl 367: , 1262–1270. |
[35] | Shinagawa S , Ikeda M , Fukuhara R , Tanabe H ((2006) ) Initial symptoms in frontotemporal dementia and semantic dementia compared with Alzheimer’s disease. Dement Geriatr Cogn Disord 21: , 74–80. |
[36] | Fox NC , Crum WR , Scahill RI , Stevens JM , Janssen JC , Rossor MN ((2001) ) Imaging of onset and progression of Alzheimer’s disease with voxel-compression mapping of serial magnetic resonance images. Lancet 358: , 201–205. |
[37] | Bernard C , Helmer C , Dilharreguy B , Amieva H , Auriacombe S , Dartigues J-F , Allard M , Catheline G ((2014) ) Time course of brain volume changes in the preclinical phase of Alzheimer’s disease. Alzheimers Dement 10: , 143–151.e1. |
[38] | Tondelli M , Wilcock GK , Nichelli P , De Jager CA , Jenkinson M , Zamboni G ((2012) ) Structural MRI changes detectable up to ten years before clinical Alzheimer’s disease. Neurobiol Aging 33: , 825.e25-36. |
[39] | Dickerson BC , Stoub TR , Shah RC , Sperling RA , Killiany RJ , Albert MS , Hyman BT , Blacker D , Detoledo-Morrell L ((2011) ) Alzheimer-signature MRI biomarker predicts AD dementia in cognitively normal adults. Neurology 76: , 1395–1402. |
[40] | Apostolova LG , Mosconi L , Thompson PM , Green AE , Hwang KS , Ramirez A , Mistur R , Tsui WH , de Leon MJ ((2010) ) Subregional hippocampal atrophy predicts Alzheimer’s dementia in the cognitively normal. Neurobiol Aging 31: , 1077–1088. |
[41] | Heijer T Den , Geerlings MI , Hoebeek FE , Hofman A , Koudstaal PJ , Breteler MMB ((2006) ) Use of hippocampal and amygdalar volumes on magnetic resonance imaging to predict dementia in cognitively intact elderly people. Arch Gen Psychiatry 63: , 57–62. |
[42] | Wilson RS , Leurgans SE , Boyle PA , Bennett DA ((2011) ) Cognitive decline in prodromal Alzheimer disease and mild cognitive impairment. Arch Neurol 68: , 351–356. |
[43] | Jack CR , Holtzman DM ((2013) ) Biomarker modeling of Alzheimer’s disease. Neuron 80: , 1347–1358. |
[44] | Adaszewski S , Dukart J , Kherif F , Frackowiak R , Draganski B , Alzheimer’s Disease Neuroimaging Initiative ((2013) ) How early can we predict Alzheimer’s disease using computational anatomy? Neurobiol Aging 34: , 2815–2826. |
[45] | Nestor PJ , Scheltens P , Hodges JR ((2004) ) Advances in the early detection of Alzheimer’s disease. Nat Med 10: Suppl, S34–S41. |
[46] | Schott JM , Fox NC , Frost C , Scahill RI , Janssen JC , Chan D , Jenkins R , Rossor MN ((2003) ) Assessing the onset of structural change in familial Alzheimer’s disease. Ann Neurol 53: , 181–188. |
[47] | Hanger DP , Seereeram A , Noble W ((2009) ) Mediators of tau phosphorylation in the pathogenesis of Alzheimer’s disease. Expert Rev Neurother 9: , 1647–1666. |
[48] | Nie J , Duan L , Yan Z , Niu Q ((2013) ) Tau hyperphosphorylation is associated with spatial learning and memory after exposure to benzo[a]pyrene in SD rats. Neurotox Res 24: , 461–471. |
Figures and Tables
Fig.1
Longitudinal course of (a) estimated mPRC and (b) estimated ERC and (c) MMSE functioning for (i) raw NC-NC (top panel) and (ii) raw NC-AD (middle panel) data and (iii) linear mixed-effects modelled data (bottom panel). Triangles reflect significant group differences and asterisks significant ‘changepoints’ in the courses of estimated functioning prior to the diagnosis of Alzheimer’s dementia.
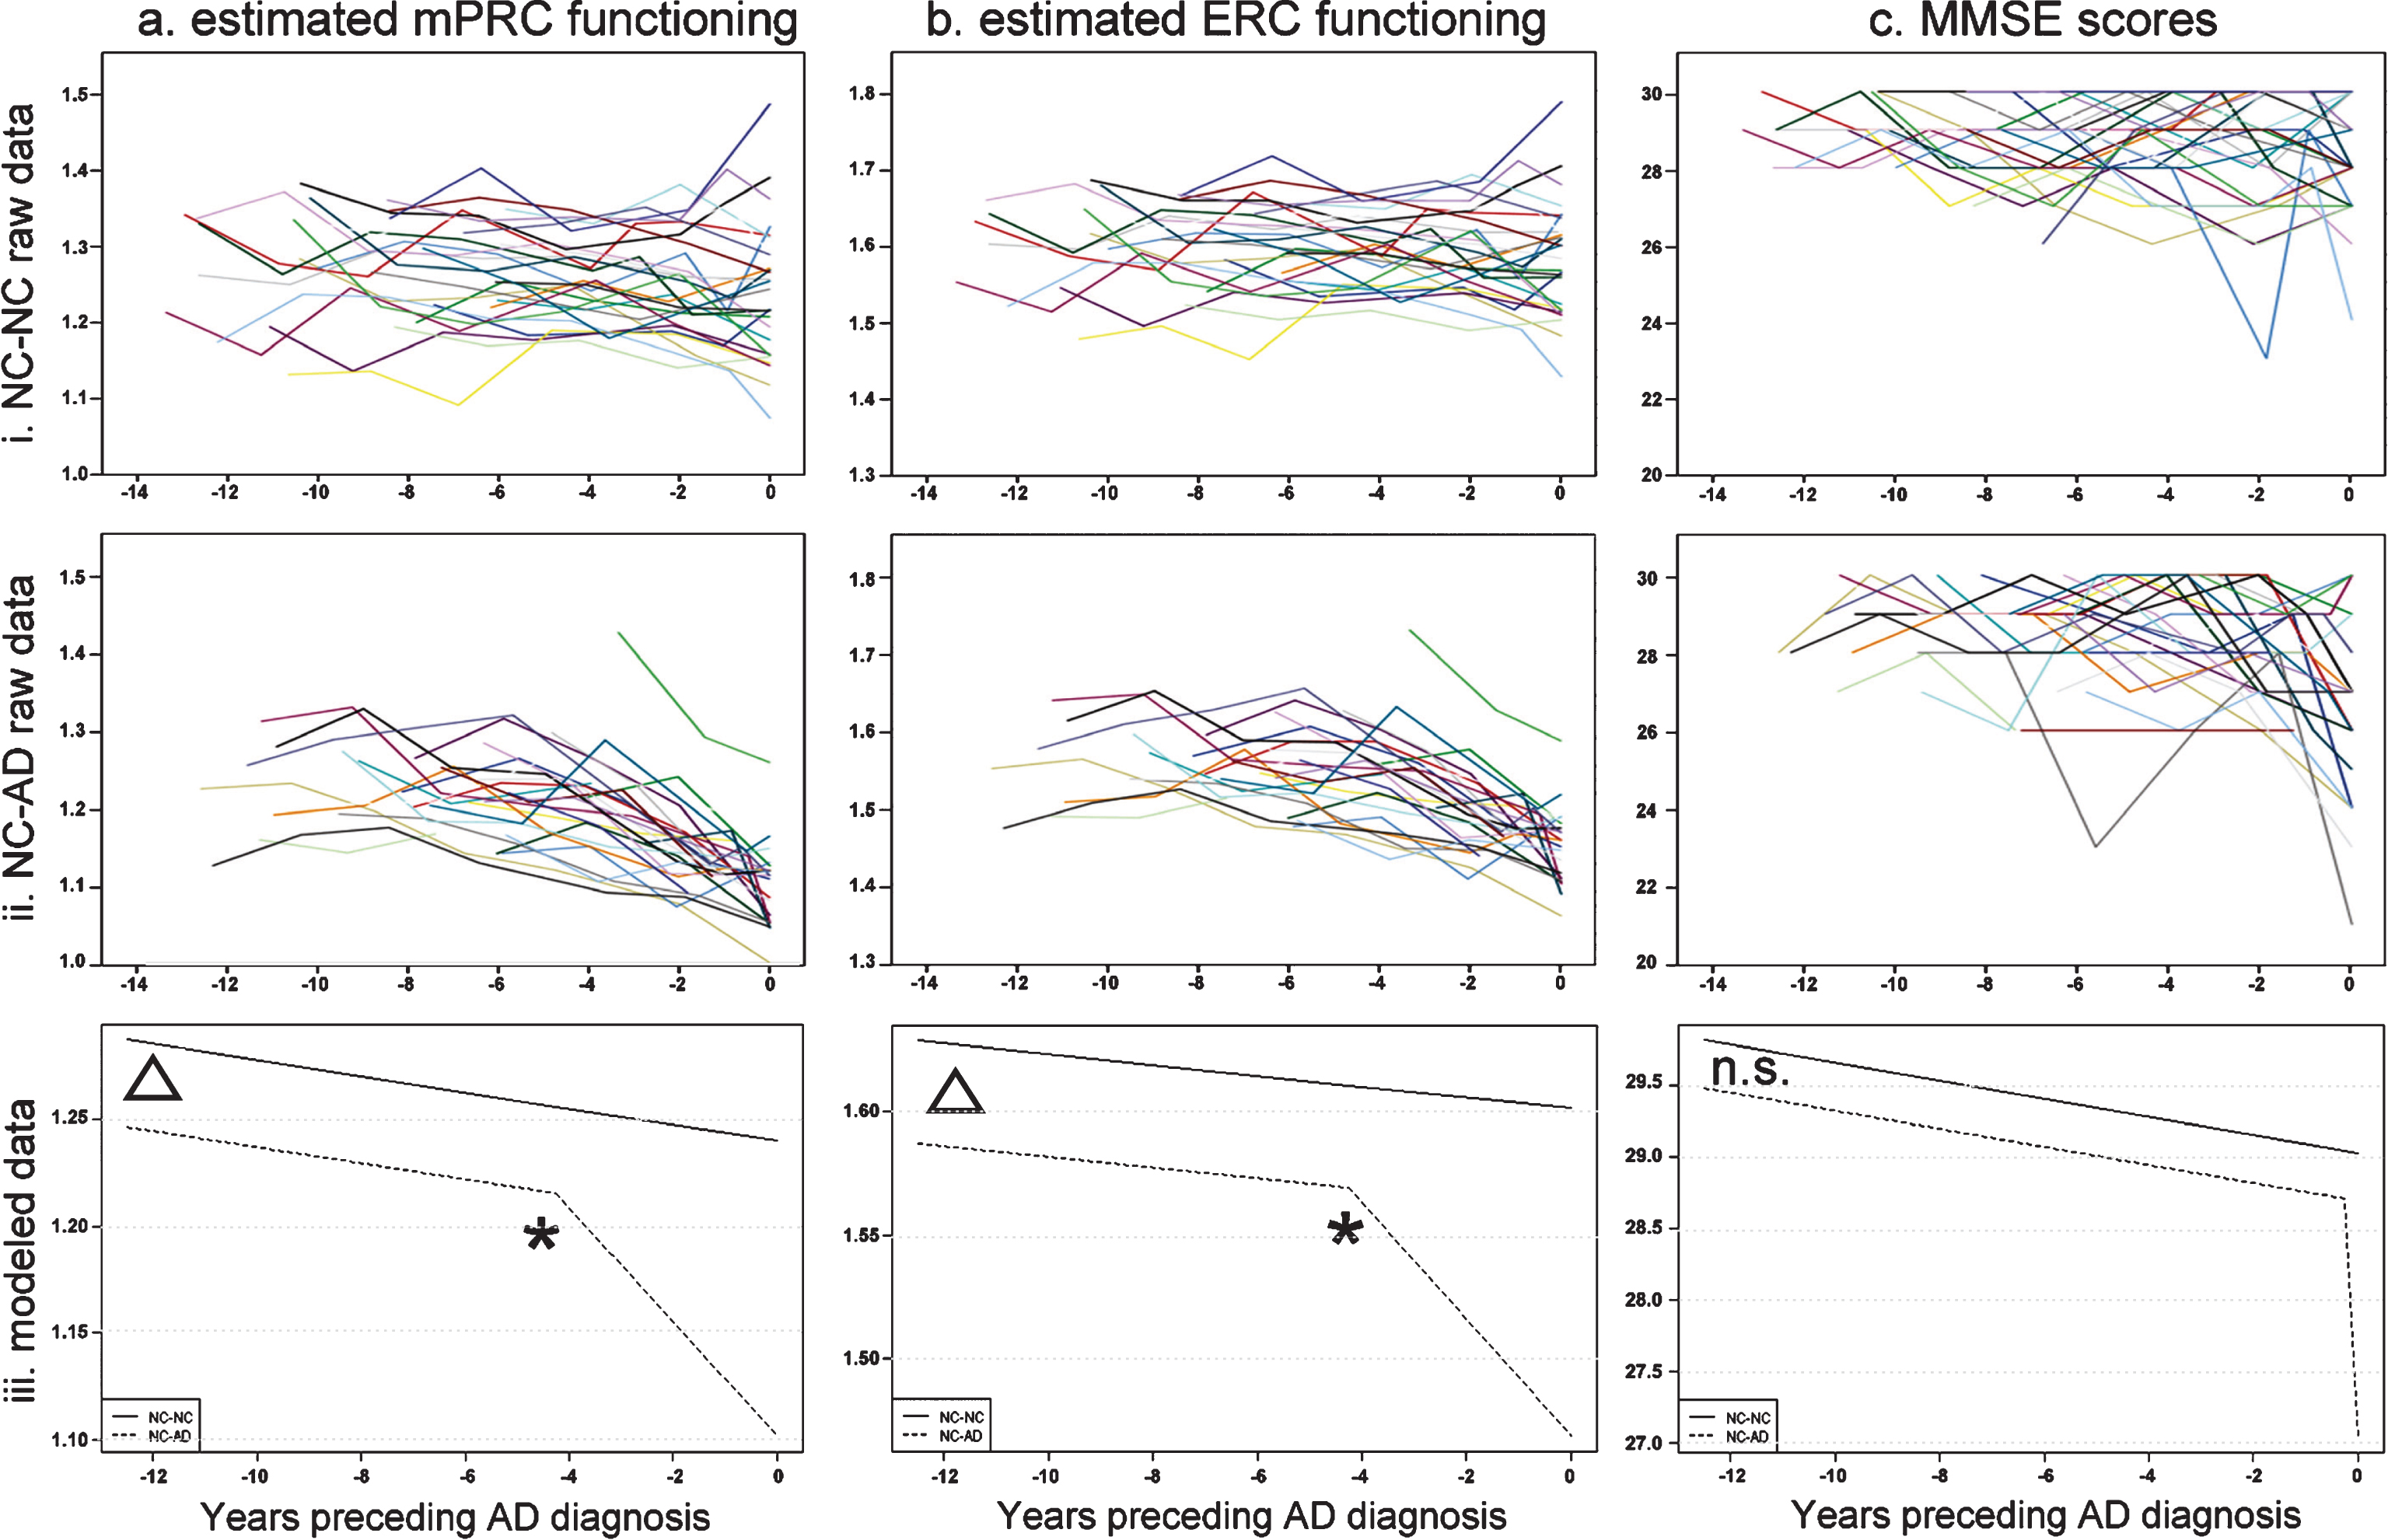
Table 1
Characteristics of the prediction and longitudinal (baseline values) samples
| Prediction Study | NC (n = 31) | aMCI (n = 31) | AD (n = 27) | F (p) F/χ2 (p-value) |
| Age (y) | 74.806±6.853 | 74.677±8.276 | 77.667±5.609 | 1.618 (0.204) |
| Education (y) | 12.548±2.127 | 13.452±3.075 | 12.370±2.950 | 1.339 (0.268) |
| Gender (m:f) | 18 : 13 | 14 : 17 | 11 : 16 | 1.924 (0.382)a |
| MMSE score | 29.290±0.902 | 28.484±1.610 | 26.148±2.051 | 30.732 (<0.0001) |
| Longitudinal Study | NC-NC (n = 28) | NC-AD (n = 28) | T/χ2 (p-value) |
| Age (y) | 73.179±5.618 | 73.393±4.549 | 0.157 (0.876) |
| Education (y) | 12.714±2.651 | 12.571±2.847 | 0.194 (0.847) |
| Gender (m:f) | 15 : 13 | 15 : 13 | n/aa |
| ApoE Status | 3 : 15 : 10 : 0 | 2 : 13 : 12 : 1 | 1.525 (0.677)a |
| (E2/E3: E3/E3: E3/E4: E4/E4) | |||
| MMSE score | 29.036±0.999 | 28.714±1.182 | 1.099 (0.277) |
aχ2-test.

