
Characterizing Neighborhood Vulnerabilities in Mild Cognitive Impairment using the Environmental Justice Index
Abstract
Background:
There is a need for integration and comprehensive characterization of environmental determinants of Alzheimer’s disease. The Environmental Justice Index (EJI) is a new measure that consolidates multiple environmental health hazards.
Objective:
This analysis aims to explore how environmental vulnerabilities vary by race/ethnicity and whether they predict cognitive outcomes in a clinical trial of mild cognitive impairment (MCI).
Methods:
We used data from a clinical trial of 107 MCI participants (28% minorities). Using the EJI, we extracted 40 measures of neighborhood environmental and social vulnerability including air and water pollution, access to recreational spaces, exposure to coal and lead mines, and area poverty. We also examined the relationship of the EJI to the Area Deprivation Index (ADI). Data was analyzed using regressions, correlations, and t-tests.
Results:
Environmental Burden Rank (EBR) across the sample (0.53±0.32) was near the 50th percentile nationally. When divided by race/ethnicity, environmental (p = 0.025) and social (p < 0.0001) vulnerabilities were significantly elevated for minorities, specifically for exposure to ozone, diesel particulate matter, carcinogenic air toxins, and proximity to treatment storage and disposal sites. ADI state decile was not correlated with the EBR. Neither EBR nor ADI were a significant predictor of cognitive decline.
Conclusions:
To our knowledge, this is the first study to link the EJI to an MCI trial. Despite limitations of a relatively small sample size, the study illustrates the potential of the EJI to provide deeper phenotyping of the exposome and diversity in clinical trial subjects.
INTRODUCTION
While there is great interest in studying the impact of the exposome on aging and Alzheimer’s disease (AD) [1–5], mapping the comprehensive range of exposures that can impact health risks has proven challenging [1]. A notable advance in integrating geographic data on social inequities with health outcomes was the 2018 creation of the Neighborhood Atlas by the University of Wisconsin-Madison using measures created by the Health Resources & Services Administration [6, 7]. With this atlas, researchers could extract the Area Deprivation Index (ADI), a ranking of census block groups at the state or national level based on their socioeconomic disadvantage [6, 7], including measures of education, employment, housing, and other household characteristics [8]. Subsequent studies have used the ADI socioeconomic ranking to link to risk for incident dementia or AD pathology [3, 9]. For example, in a cross-sectional study of 447 brains, those who had lived in the most deprived neighborhoods were about two-fold more likely to have AD neuropathology [3]. In another study of 601 cognitively normal elderly subjects, subjects living in the 20% most disadvantaged neighborhoods had greater cortical thinning in regions relevant to AD as well as lower cognitive scores on executive function [9]. These associations were in-part mediated by racial differences. One limitation of the ADI is that it does not include direct measures of environmental hazards.
The 2020 NIA workshop identified several environmental factors, in addition to social risk factors, for the development of AD, including gestational exposure to metals and extreme temperature changes, emphasizing the need for greater data integration across multiple exposures [1]. For example, a study of 249,405 older adults in Miami-Dade county found that neighborhoods in highest tertile of greenness, measured by mean Census block level Normalized Difference Vegetation Index (NDVI), had a 20% reduced odds for AD [4]. This study as well as the NIA workshop suggested that environment modification may be a means to dementia risk reduction and should be studied further [1, 4].
Advances in geospatial mapping and sensors have allowed for greater visualization, integration, and analyses of environmental impacts at a neighborhood level. Such advances also made it possible to track whether all individuals, regardless of factors such as race or economic status, enjoyed the same degree of protection from environmental and health hazards—a term referred to as “environmental justice” [10].
To further this, in 2022, the Environmental Justice Index (EJI) was launched as the first nationwide database to integrate a wide range of environmental and social vulnerabilities for each census tract in the US [11]. Using data from the U.S. Census Bureau, the U.S. Environmental Protection Agency, the U.S. Mine Safety and Health Administration, and the U.S. Centers for Disease Control and Prevention, the EJI ranks these census tracts, subdivisions of counties, on 47 environmental, social, and health indicators. It groups them into three modules and ten different domains. The three modules are Environmental Burden (EBR), Social Vulnerability (SVR), and Health Vulnerability [12].
Each of the 40 indicators in the EBR and SVR is given a percentile ranking from 0 to 1. The health vulnerability module is also taken into account as each census block is marked as yes/no for high prevalence (> 66.66%) of certain chronic diseases. These are compiled to make up the overall EJI percentile rank that also ranges from 0 to 1. Higher scores indicate greater burden for that tract, e.g., a score of 0.70 indicates that 70% of census tracts experience less burden, and 0.50 is the national median. The EJI is a dynamic index that allows for the comparison of environmental and social risks and the identification of areas with disproportionate burden [13]. The tool is improved and updated through engagement with communities.
To our knowledge, no prior study has used the EJI to characterize neighborhood vulnerabilities in subjects at risk for AD or those in a clinical trial. This exploratory study aimed to link the EJI to subjects who meet the criteria for mild cognitive impairment (MCI) in an AD prevention trial to 1) characterize the spectrum of environmental exposures at a neighborhood level in MCI subjects, 2) examine how such environmental vulnerabilities differed by race/ethnicity, 3) examine how environmental vulnerabilities differed between a semi-urban and urban study site, and 4) test if baseline environmental exposures impacted cognitive decline.
METHODS
Subjects and study design
Data used in this study came from an MCI clinical trial aimed to test if cognitive training slowed MCI progression. The study was approved by institutional IRBs at Duke University and Colombia University, and all participants provided written informed consent. Details of study design, selection criteria, and study outcomes have been previously reported [14, 15]. In brief, 107 MCI participants were recruited from the community at two sites: Durham, North Carolina, and New York City, New York. Participants were a heterogeneous mix drawn from high and low income neighborhoods in the areas surrounding these two sites. Participants were recruited via traditional strategies for clinical trials, including community engagement, involvement in churches, flyers, advertisements, referrals, and registries. The goal in recruitment was that at least 20% of these participants were racial/ethnic minorities, as self-identified by the participants. Inclusion criteria required that participants be 55-95 years old, be English-speaking, meet criteria for amnestic MCI, including objective memory impairment on the WMS-III Logical Memory delayed recall, and be free free of major confounding neuropsychiatric illness [14, 15]. All subjects underwent a thorough clinical history and clinical diagnosis through neuropsychological testing with the Alzheimer’s Disease Assessment Scale –Cognitive Subscale (ADAS-Cog11) and other testing methods at baseline and specified intervals through the end of the study, at week 78 [14, 15].
Environmental Justice Index (EJI)
Participants’ census tracts were used to extract neighborhood social and environmental data from the publicly available online EJI database, including the indicators of the environmental burden and social vulnerability modules.
Supplementary Tables 1 and 2 contain definitions of all the individual component indicators for the EBR (Supplementary Table 1) and SVR (Supplementary Table 2). For each subject, we extracted scores for each of the social and environmental exposures as well as the total EBR and SVR according to their geographic tract. The EJI’s third module, health vulnerability, accounts for the high burden of pre-existing chronic disease (asthma, cancer, high blood pressure, diabetes, poor mental health) in the census tract [12]. We did not include this module in secondary analyses of cognitive decline, per CDC/ASDTR guidance for use of EJI, due to risk of multicollinearity between the health-related variables.
Area Deprivation Index (ADI)
The ADI is a refined and validated version of an index originally created by the Health Resources & Services Administration. Participant data and the Neighborhood Atlas were used to compile the ADI rankings for each individual per their census block, which are smaller geographic regions within a census tract, and thus the best approximation for neighborhood-level data [6]. Supplementary Table 3 outlines the census variables used to compile the ADI rankings. Many of these are similar to those included in the EJI social vulnerability module, though there are added measures for home values and income disparity, among others.
State decile rank (STA) is calculated by ranking the ADI scores of each census block in the state and then dividing them into deciles (1-10), with higher deciles marking neighborhoods with increased deprivation [6, 7]. National percentile (NAT) is calculated by ranking the ADI scores across the nation and creating percentile rankings (1-100) with higher percentiles for more disadvantaged neighborhoods [6, 7]. One subject had missing ADI values due to insufficient data in their census block.
Data and analysis
The main purpose of this pilot study was to examine the insights that could be gained by linking EBR, SVR, and ADI metrics to an MCI clinical trial.
Specifically, the focus was on understanding how these subjects fared relative to the nation with regard to environmental and social exposures and how these exposures differed by race/ethnicity. For this analysis, Black (n = 24), non-Hispanic Asian (n = 1), and Hispanic (n = 4) participants are combined into a minority group, as this was a pilot study with a relatively small sample size. Their rankings on the EJI are compared to those of the non-Hispanic White participants. Furthermore, the study also examined how EJI and ADI rankings compared between participants at the two sites in the trial. These were evaluated using 2-sample t-tests.
We also use Pearson’s correlations to explore how EBR, SVR and ADI measures correlated to one another. The final exploratory aim was to examine the effects of EBR and SVR on the longitudinal change from baseline in cognition (ADAS-Cog) of MCI subjects over 78 weeks. For this last aim, all MCI subjects were pooled, regardless of treatments, and data was analyzed using regressions. EJI and ADI scores were retrieved on November 15, 2023.
RESULTS
Baseline characteristics
Table 1 depicts the baseline characteristics of the 107 MCI subjects, shown between minorities (n = 29) and non-Hispanic white (n = 78) participants. There were no significant differences in baseline cognition between these groups, as noted by the insignificant p-values for EMCI/ LMCI, MMSE, and ADAS-Cog scores.
Table 1
Baseline characteristics of MCI subjects by race/ethnicity
| Non-Hispanic Whites | Minority Groups | p | |
| Sample size | N = 78 | N = 29 | – |
| NYC/Durham | 34/45 | 21/8 | 0.008 |
| Female/Male | 39/39 | 23/6 | 0.006 |
| Age (mean±SD) | 73.15±8.76 | 65.86±6.52 | < 0.001 |
| Education (mean±SD) | 17.05±3.35 | 15.76±2.28 | 0.058 |
| EMCI / LMCI | 30/48 | 14/15 | 0.359 |
| MMSE (mean±SD) | 26.95±1.68 | 27.03±1.55 | 0.811 |
| ADAS-Cog (mean±SD) | 9.74±3.73 | 9.07±2.71 | 0.376 |
EMCI, early mild cognitive impairment; LMCI, late mild cognitive impairment; MMSE, Mini-Mental State Examination; ADAS-Cog, Alzheimer’s Disease Assessment Scale –Cognitive Subscale.
EJI index by race/ethnicity
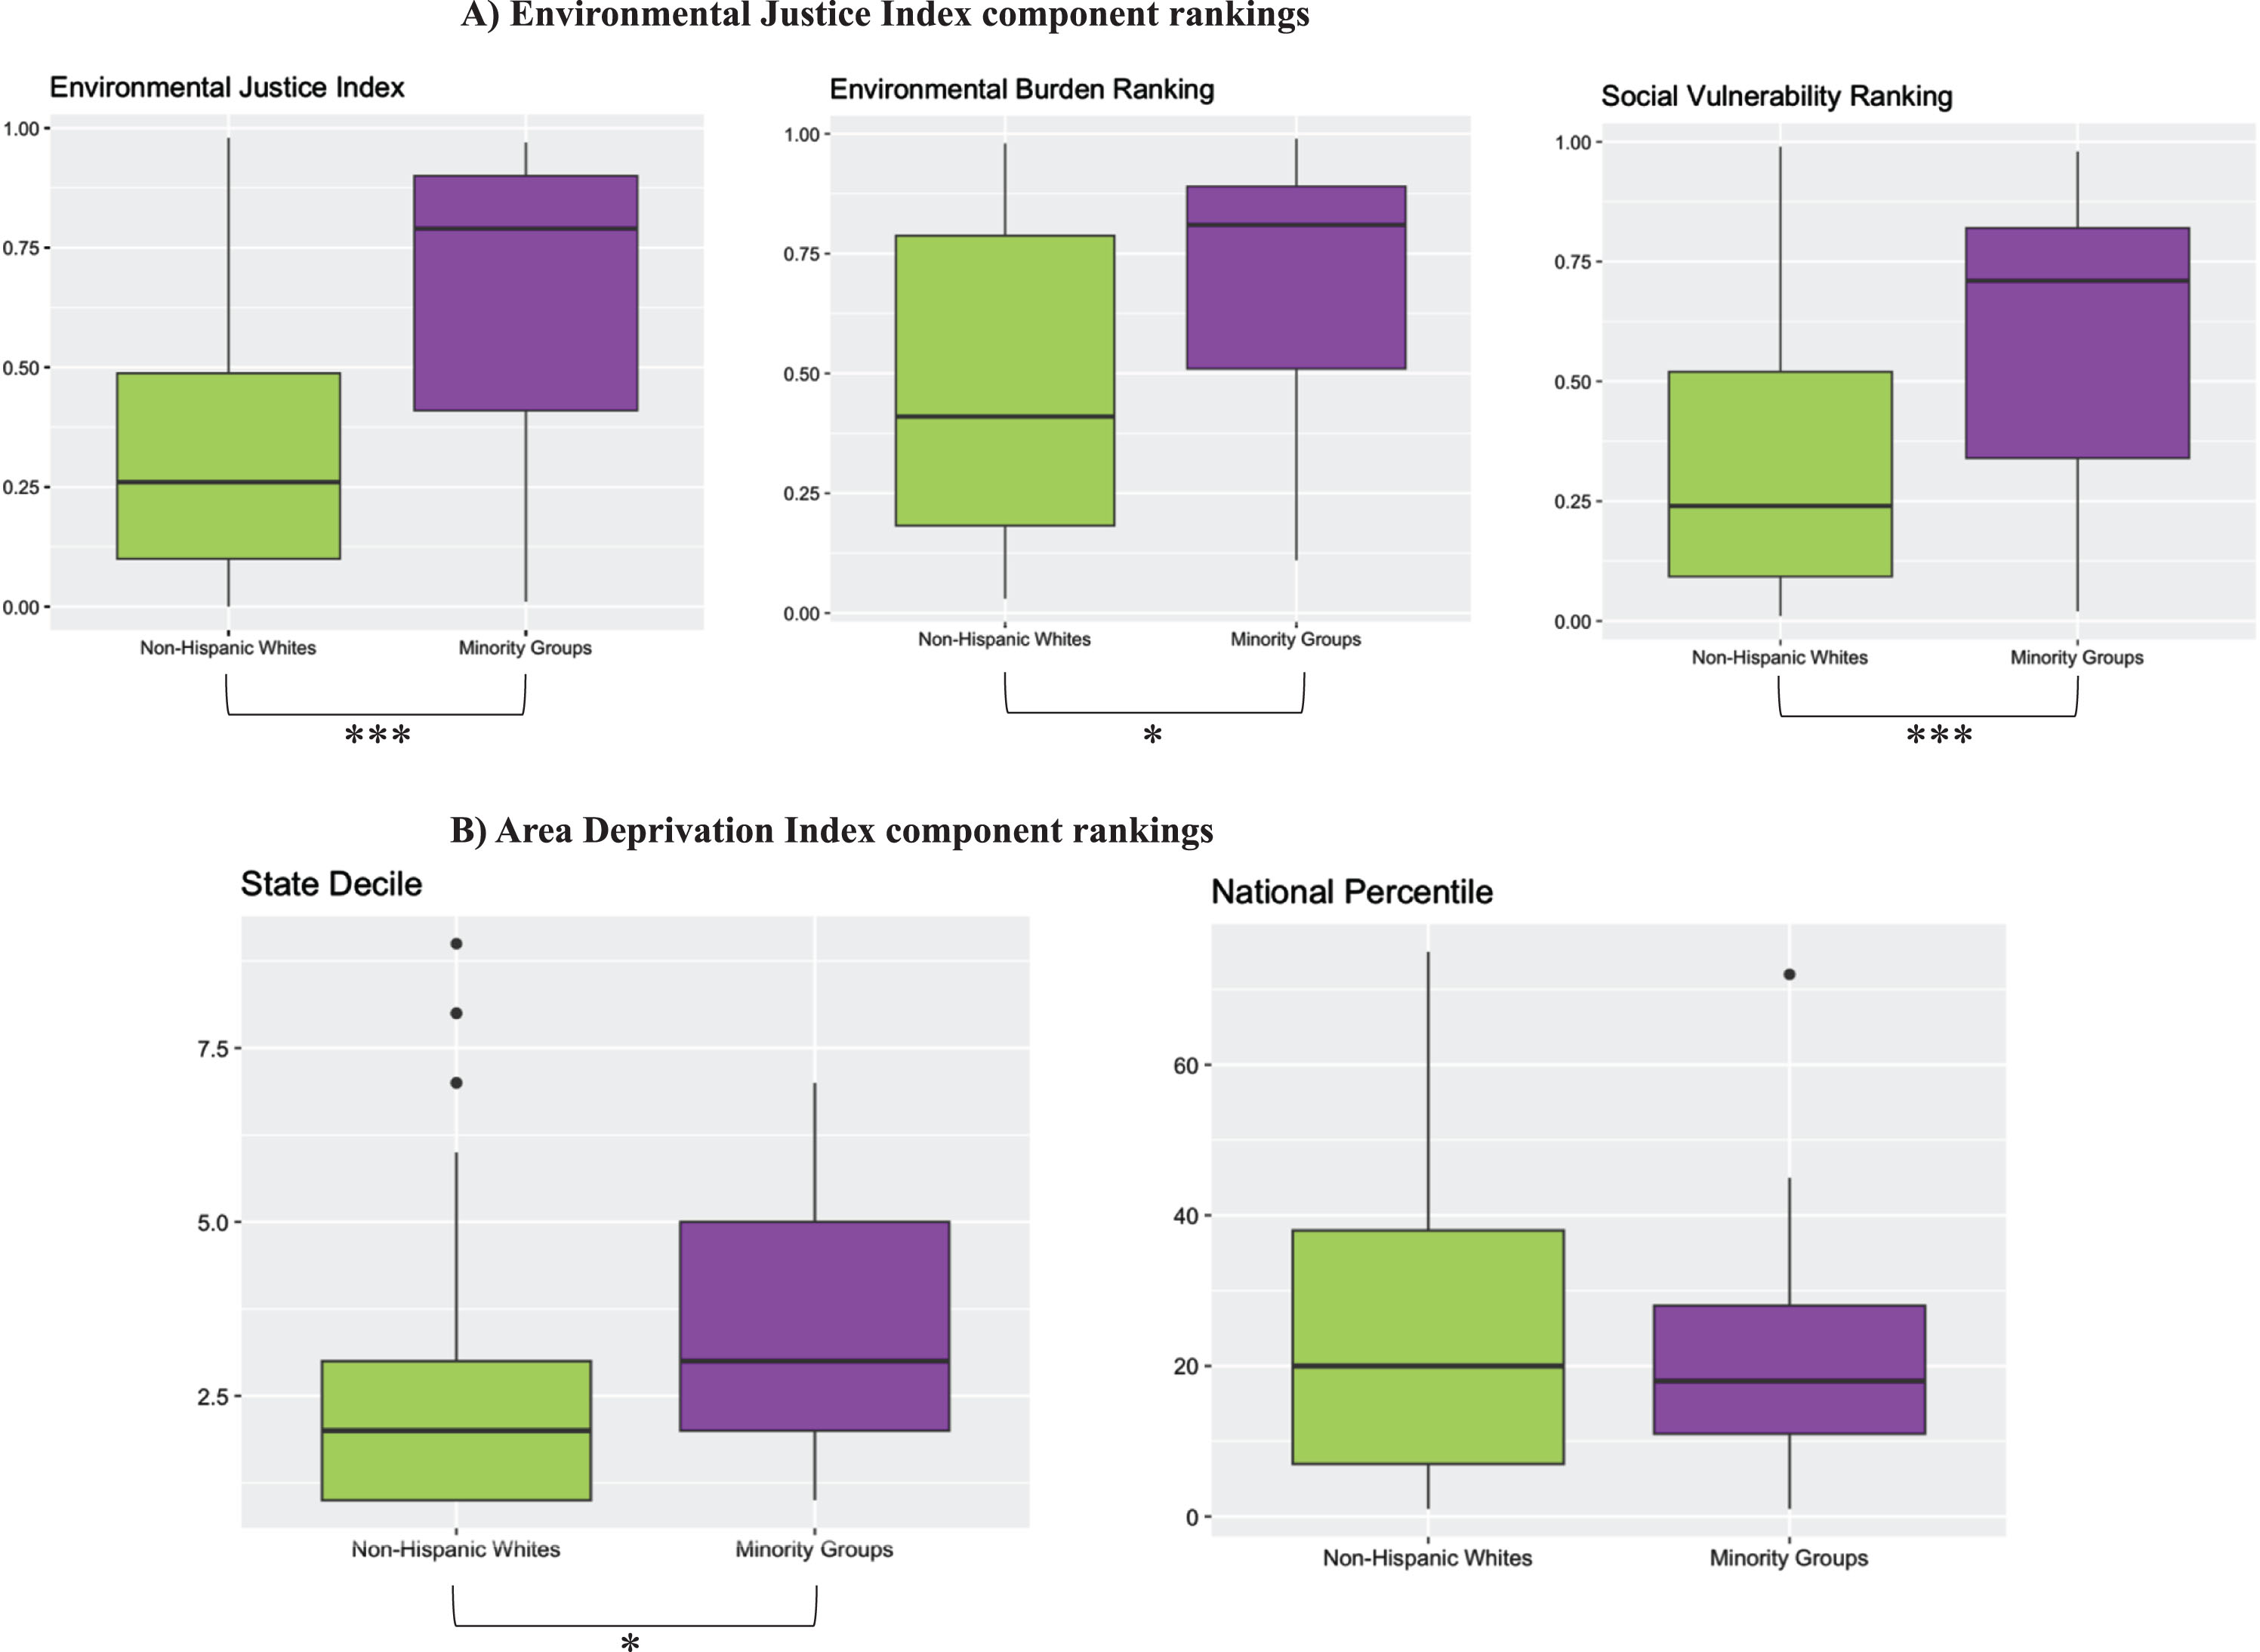
The overall EJI score, computed by combining the Environmental Burden, Social Vulnerability, and health vulnerability modules, was significantly different between non-Hispanic White (0.33±0.27) and minority (0.63±0.32) participants (p < 0.001) with minority participants having higher scores (Fig. 1A).
Fig. 1
Comparisons of non-hispanic whites and minority groups. Figure depicts component rankings by race/ethnicity for the Environmental Justice Index (A) as well as the Area Deprivation Index (B). There were significant differences between non-Hispanic whites and minority groups in the Environmental Justice Index, Environmental Burden Ranking, Social Vulnerability Ranking, and State Decile, indicated by the asterisk (*p < 0.05, ***p < 0.001). Minority participants have greater values for these measures, indicating increased deprivation in the geographical areas where they live. There was no significant difference in the means for National Percentile.
EBR differences by race/ethnicity
Across the whole MCI sample, the mean EBR was 0.53±0.32 and was significantly higher for minority participants as compared to non-Hispanic Whites (p = 0.025) (Fig. 1A). As shown in Table 2 and Fig. 2, several EBR indices differed significantly between racial/ethnic groups.
Fig. 2
Figure portrays the mean values of all Environmental Burden indicators by race/ethnicity. Minority participants had significantly higher ranking for several variables compared to non-Hispanic white participants, indicating greater deprivation in these geographic areas: overall environmental burden ranking, air pollution, ozone, diesel particular matter, air toxics cancer risk, treatment, storage, and disposal sites, lack of recreational parks, and lack of walkability. Significance is represented by the asterisks (*p < 0.05, ** p < 0.01, *** p < 0.001).
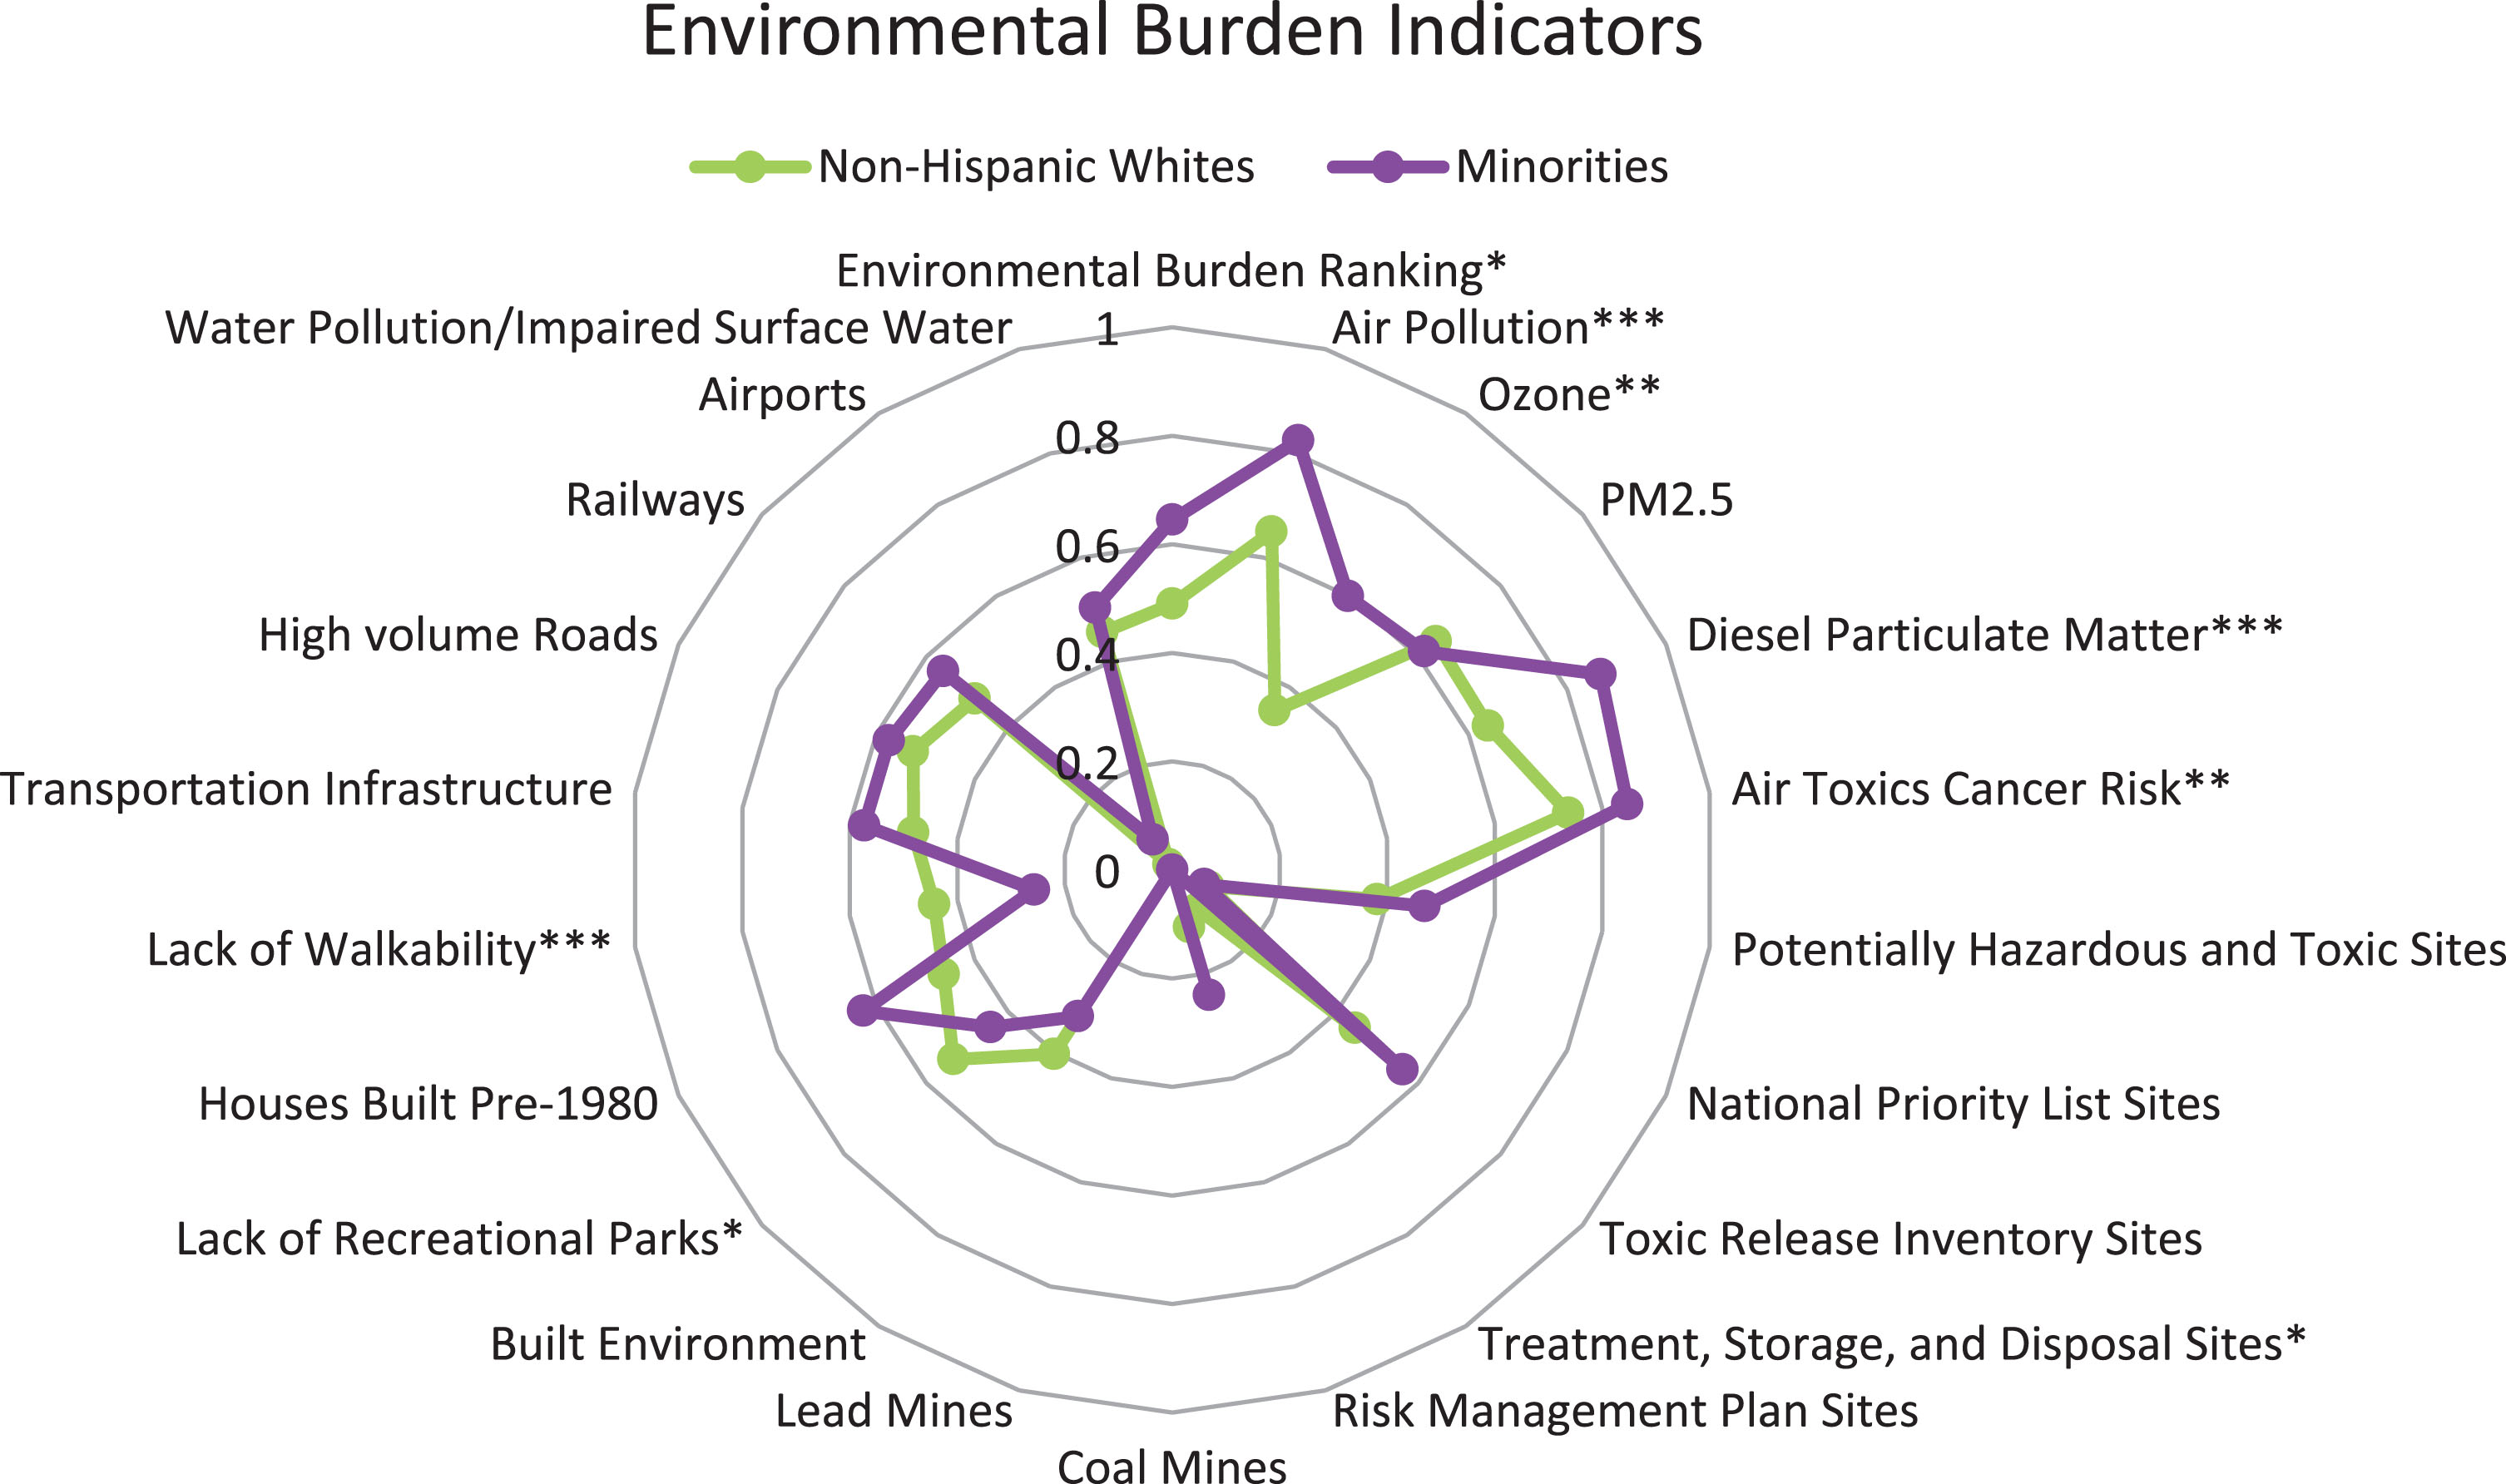
Table 2
Environmental Burden Ranking Scores by Race/Ethnicity (mean±SD)
| Indicators | Non-Hispanic | Minority | p |
| Whites | Groups | ||
| Air Pollution | 0.65±0.22 | 0.82±0.16 | < 0.001 |
| Ozone | 0.35±0.40 | 0.60±0.38 | 0.004 |
| PM2.5 | 0.64±0.14 | 0.61±0.11 | 0.317 |
| Diesel Particulate Matter | 0.64±0.28 | 0.87±0.19 | <0.001 |
| Air Toxics Cancer Risk | 0.74±0.20 | 0.85±0.09 | 0.005 |
| Potentially Hazardous and Toxic Sites | 0.38±0.32 | 0.47±0.31 | 0.204 |
| National Priority List Sites | 0.07±0.26 | 0.06±0.24 | 0.865 |
| Toxic Release Inventory Sites | 0.45±0.36 | 0.56±0.40 | 0.152 |
| Treatment, Storage, and Disposal Sites | 0.09±0.27 | 0.00±0.00 | 0.007 |
| Risk Management Plan Sites | 0.11±0.28 | 0.24±0.40 | 0.060 |
| Coal Mines | 0.00±0.00 | 0.00±0.00 | – |
| Lead Mines | 0.00±0.00 | 0.00±0.00 | – |
| Built Environment | 0.40±0.22 | 0.32±0.19 | 0.076 |
| Lack of Recreational Parks | 0.53±0.18 | 0.44±0.12 | 0.015 |
| Houses Built Pre-1980 | 0.46±0.39 | 0.63±0.37 | 0.055 |
| Lack of Walkability | 0.44±0.24 | 0.26±0.17 | <0.001 |
| Transportation Infrastructure | 0.48±0.28 | 0.57±0.26 | 0.126 |
| High volume Roads | 0.52±0.26 | 0.57±0.30 | 0.413 |
| Railways | 0.48±0.32 | 0.56±0.35 | 0.280 |
| Airports | 0.01±0.11 | 0.07±0.25 | 0.265 |
| Water Pollution/Impaired Surface Water | 0.46±0.29 | 0.50±0.36 | 0.491 |
| Overall Environmental Burden Rank | 0.49±0.32 | 0.65±0.30 | 0.025 |
While air pollution exposure was higher than the national median for both non-Hispanic White and minority subjects, minority participants lived in areas with significantly higher exposure to air pollution (p < 0.001), including ozone (p = 0.004), diesel particulate matter (p < 0.001), and air toxics cancer risk (p = 0.005).
For some indicators, such as the presence of National Priority List Sites, Treatment, Storage, and Disposal (TSD) Sites, Lead Mines, Coal Mines, and Airports, the mean percentiles for all subjects were below the 10th percentile, suggesting that this MCI sample was relatively well-off in comparison to the national average. Metrics related to access to recreational spaces, roads, and railways hovered around the national median and did not differ significantly between minorities and non-Hispanic Whites.
SVR component scores by race/ethnicity
Across the whole MCI sample, the mean SVR was 0.41±0.30, and minority participants had a significantly higher average than non-Hispanic Whites (p < 0.001) (Fig. 1A).
Within specific SVR categories, minorities had higher scores on the minority status percentile (p < 0.001) as compared to their non-Hispanic White counterparts, indicating they lived in areas with greater minority presence. Minority participants also had significantly higher mean percentiles for all indicators in the socioeconomic status category (p < 0.001), including poverty (p < 0.001), lack of high school diploma (p < 0.001), unemployment (p = 0.005), housing tenure (p = 0.003), housing burdened lower-income households (p < 0.001), lack of health insurance (p = 0.019), and lack of broadband access (p < 0.001) (Table 3, Fig. 3).
Fig. 3
Figure portrays the mean values of all Social Vulnerability indicators by race/ethnicity. Minority participants had significantly higher ranking for several variables compared to non-Hispanic white participants, indicating greater deprivation in these geographic areas: overall social vulnerability, racial/ethnic minority status, socioeconomic status, poverty, no high school diploma, unemployment, housing tenure, housing burdened lower-income households, lack of health insurance, lack of broadband access, and speaks English “less than well”. Significance is represented by the asterisks (*p < 0.05, **p < 0.01, ***p < 0.001).
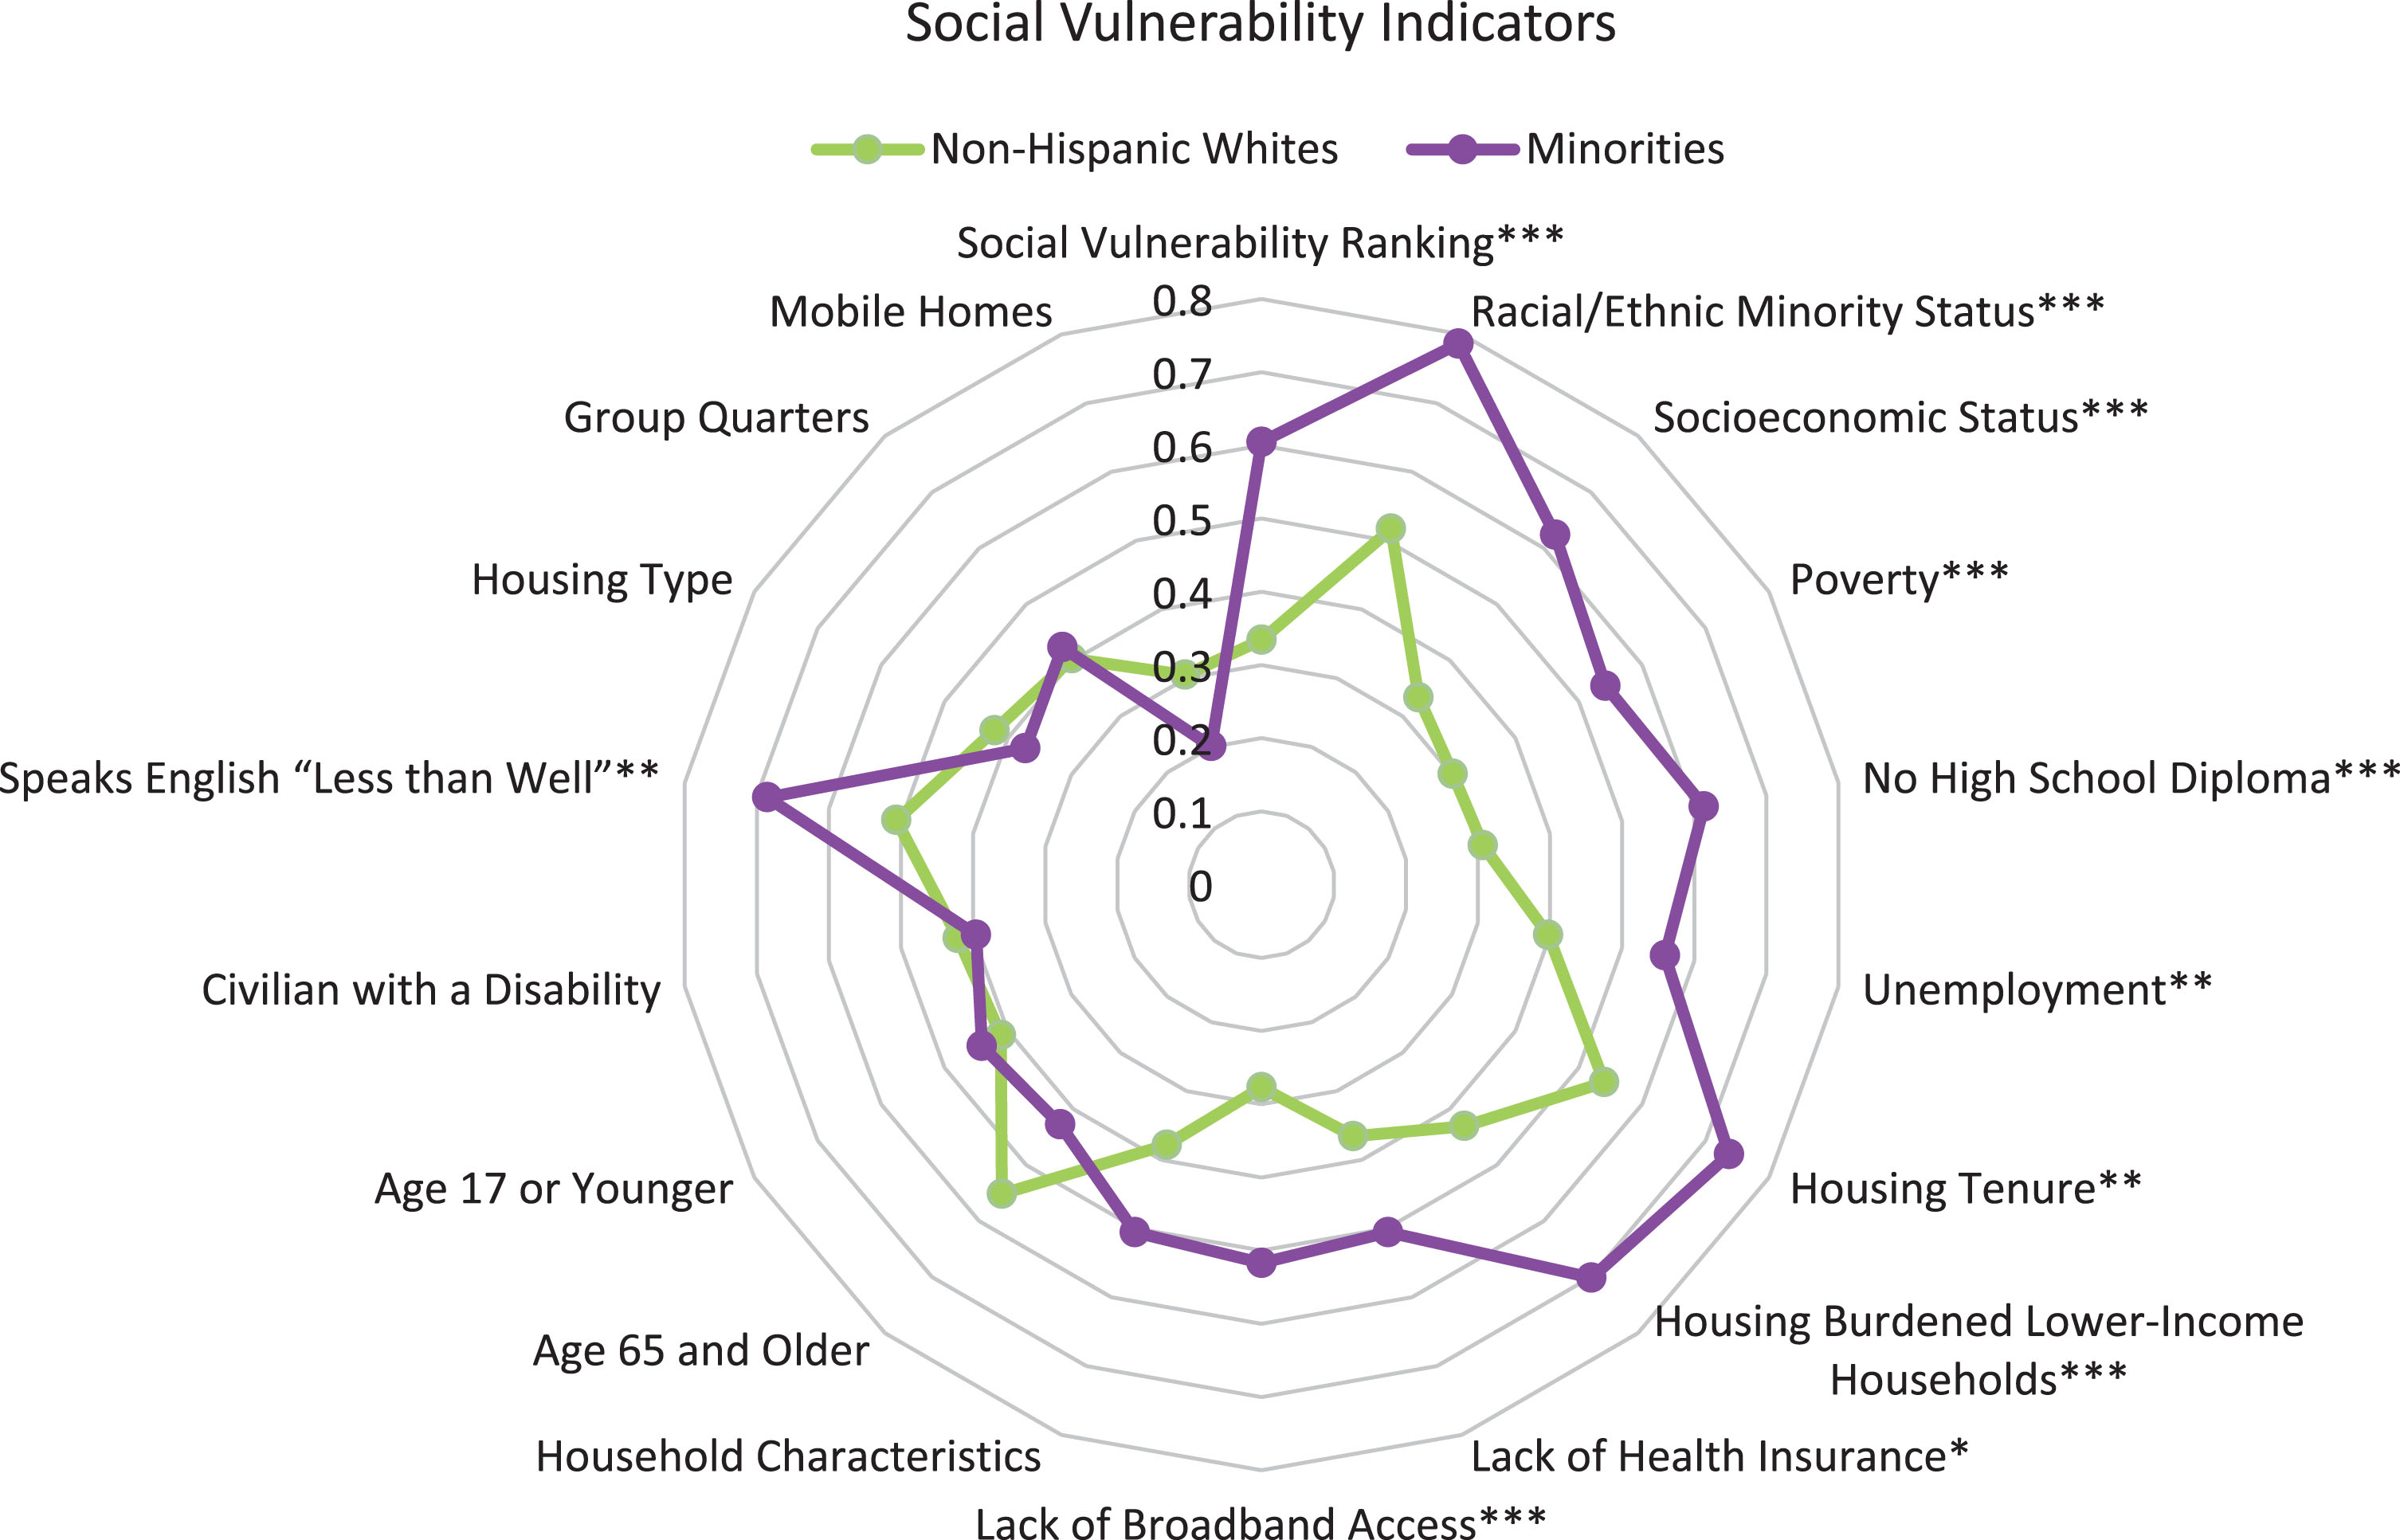
Table 3
Social Vulnerability Ranking Scores by Race/Ethnicity (mean±SD)
| Indicators | Non-hispanic whites | Minority groups | p |
| Racial/Ethnic Minority Status | 0.52±0.21 | 0.79±0.23 | < 0.001 |
| Socioeconomic Status | 0.33±0.28 | 0.62±0.30 | < 0.001 |
| Poverty | 0.30±0.24 | 0.54±0.29 | <0.001 |
| No High School Diploma | 0.31±0.27 | 0.61±0.34 | <0.001 |
| Unemployment | 0.40±0.25 | 0.56±0.28 | 0.005 |
| Housing Tenure | 0.54±0.31 | 0.74±0.28 | 0.003 |
| Housing Burdened Lower-Income Households | 0.43±0.28 | 0.70±0.31 | <0.001 |
| Lack of Health Insurance | 0.37±0.27 | 0.51±0.26 | 0.019 |
| Lack of Broadband Access | 0.28±0.24 | 0.52±0.28 | <0.001 |
| Household Characteristics | 0.38±0.30 | 0.51±0.29 | 0.056 |
| Age 65 and Older | 0.55±0.30 | 0.43±0.34 | 0.069 |
| Age 17 or Younger | 0.41±0.29 | 0.44±0.32 | 0.642 |
| Civilian with a Disability | 0.42±1.02 | 0.40±0.27 | 0.895 |
| Speaks English “Less than Well” | 0.51±0.31 | 0.69±0.27 | 0.007 |
| Housing Type | 0.42±0.30 | 0.37±0.26 | 0.438 |
| Group Quarters | 0.40±0.33 | 0.42±0.37 | 0.785 |
| Mobile Homes | 0.30±0.32 | 0.20±0.29 | 0.129 |
| Overall Social Vulnerability Rank | 0.33±0.28 | 0.60±0.28 | < 0.001 |
Housing type and household characteristics did not differ significantly by race/ethnicity. The standard deviations around the mean for all of these indicators were relatively high, indicating a large dispersion of data for the participants in this study.
ADI state and national scores by race/ethnicity
The average state decile (STA) across all 107 MCI participants was 2.90±1.96 with higher scores for minorities than non-Hispanic Whites (p = 0.010) (Fig. 1B). For the national percentile (NAT) the average was 23.09±17.87 among all participants, with no significant difference in the means between white and minority participants (Fig. 1B). The standard deviations for STA and NAT suggest a large spread of individual data points about the mean.
Comparison of EBR, SVR, and ADI indices between the New York City and Durham Sites
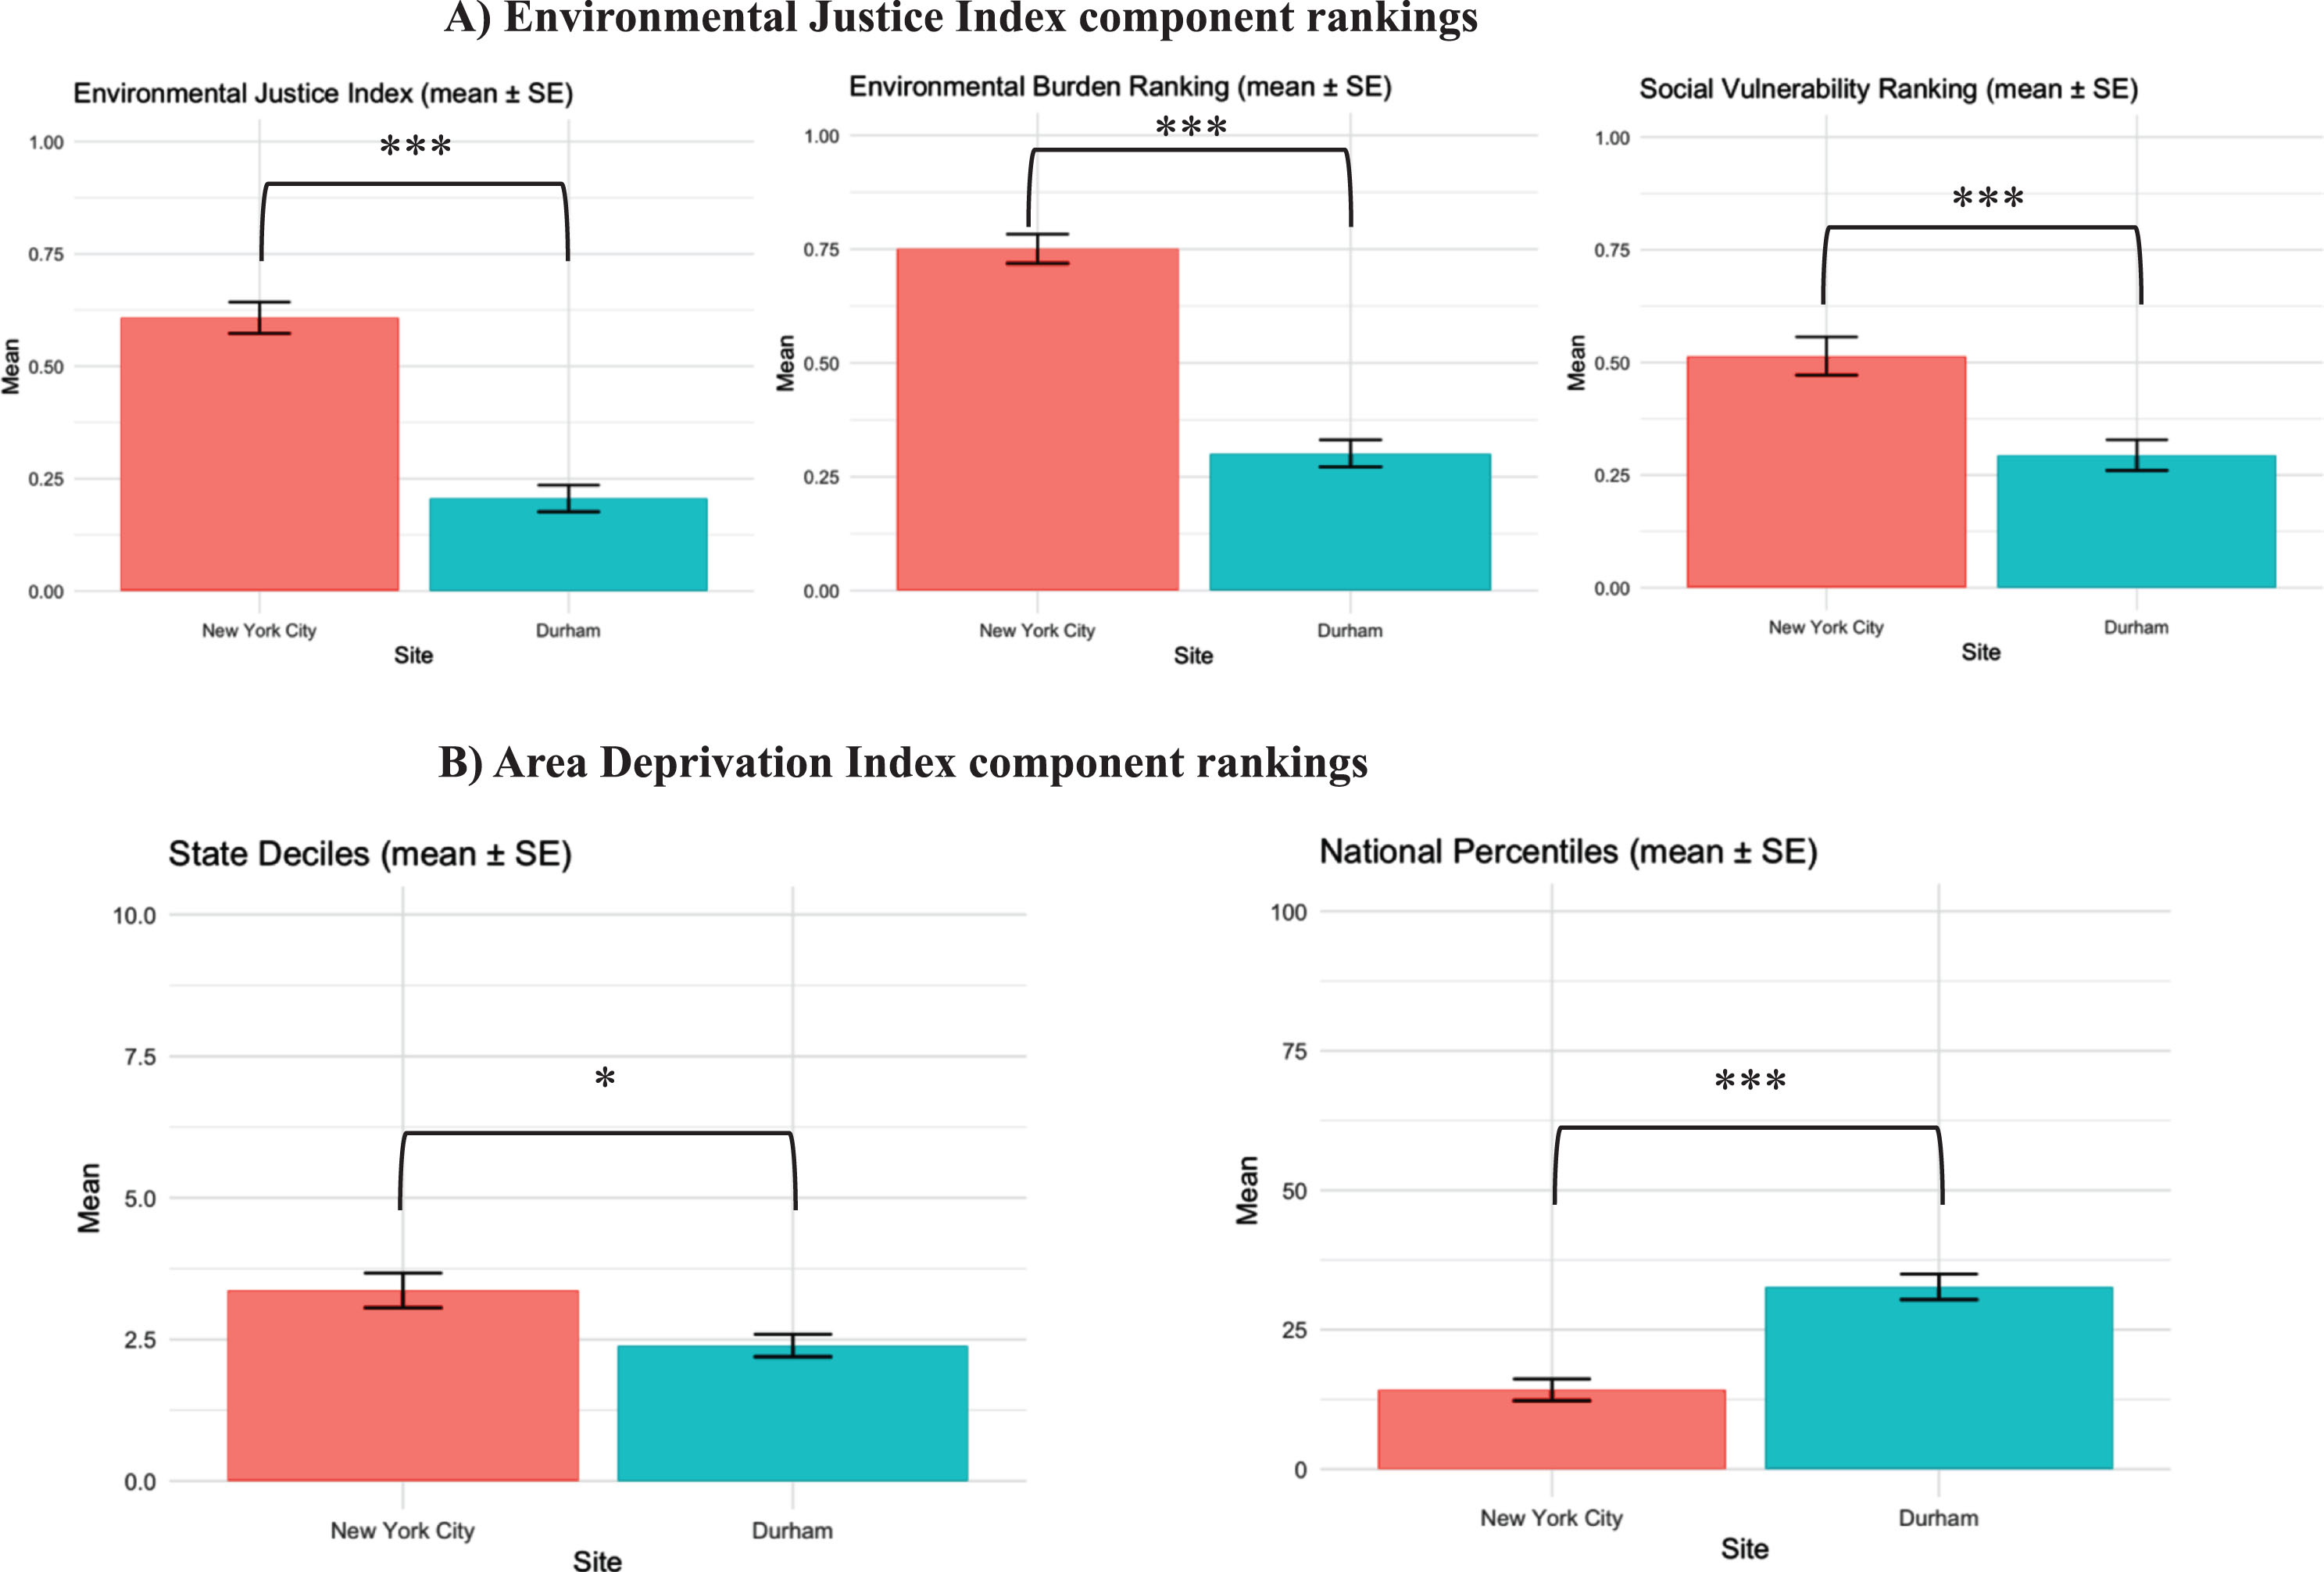
The New York City site had significantly higher mean values for EJI (p < 0.001), EBR (p < 0.001), and SVR (p < 0.001) rankings than Durham, (Fig. 4A). Average STA values were also higher in New York City (p = 0.01), but Durham had a higher NAT percentile on average (p < 0.001).
Fig. 4
Comparisons of New York City and Durham study sites. Figure depicts component rankings by study site for the Environmental Justice Index (A) as well as the Area Deprivation Index (B). There were significant differences between the sites in the Environmental Justice Index, Environmental Burden Ranking, and Social Vulnerability Ranking as well as the State Decile and National Percentile. Significance is indicated by asterisks (*p < 0.05, ***p < 0.001). Participants in New York City have greater values for EJI, EBR, SVR, and STA, indicating increased deprivation in these geographical areas. Unlike the other variables, the average National Percentile was significantly higher for Durham average was higher for Durham residents as compared to the participants at the New York City site. Please see text for more detail.
Correlations among EJI and ADI component scores
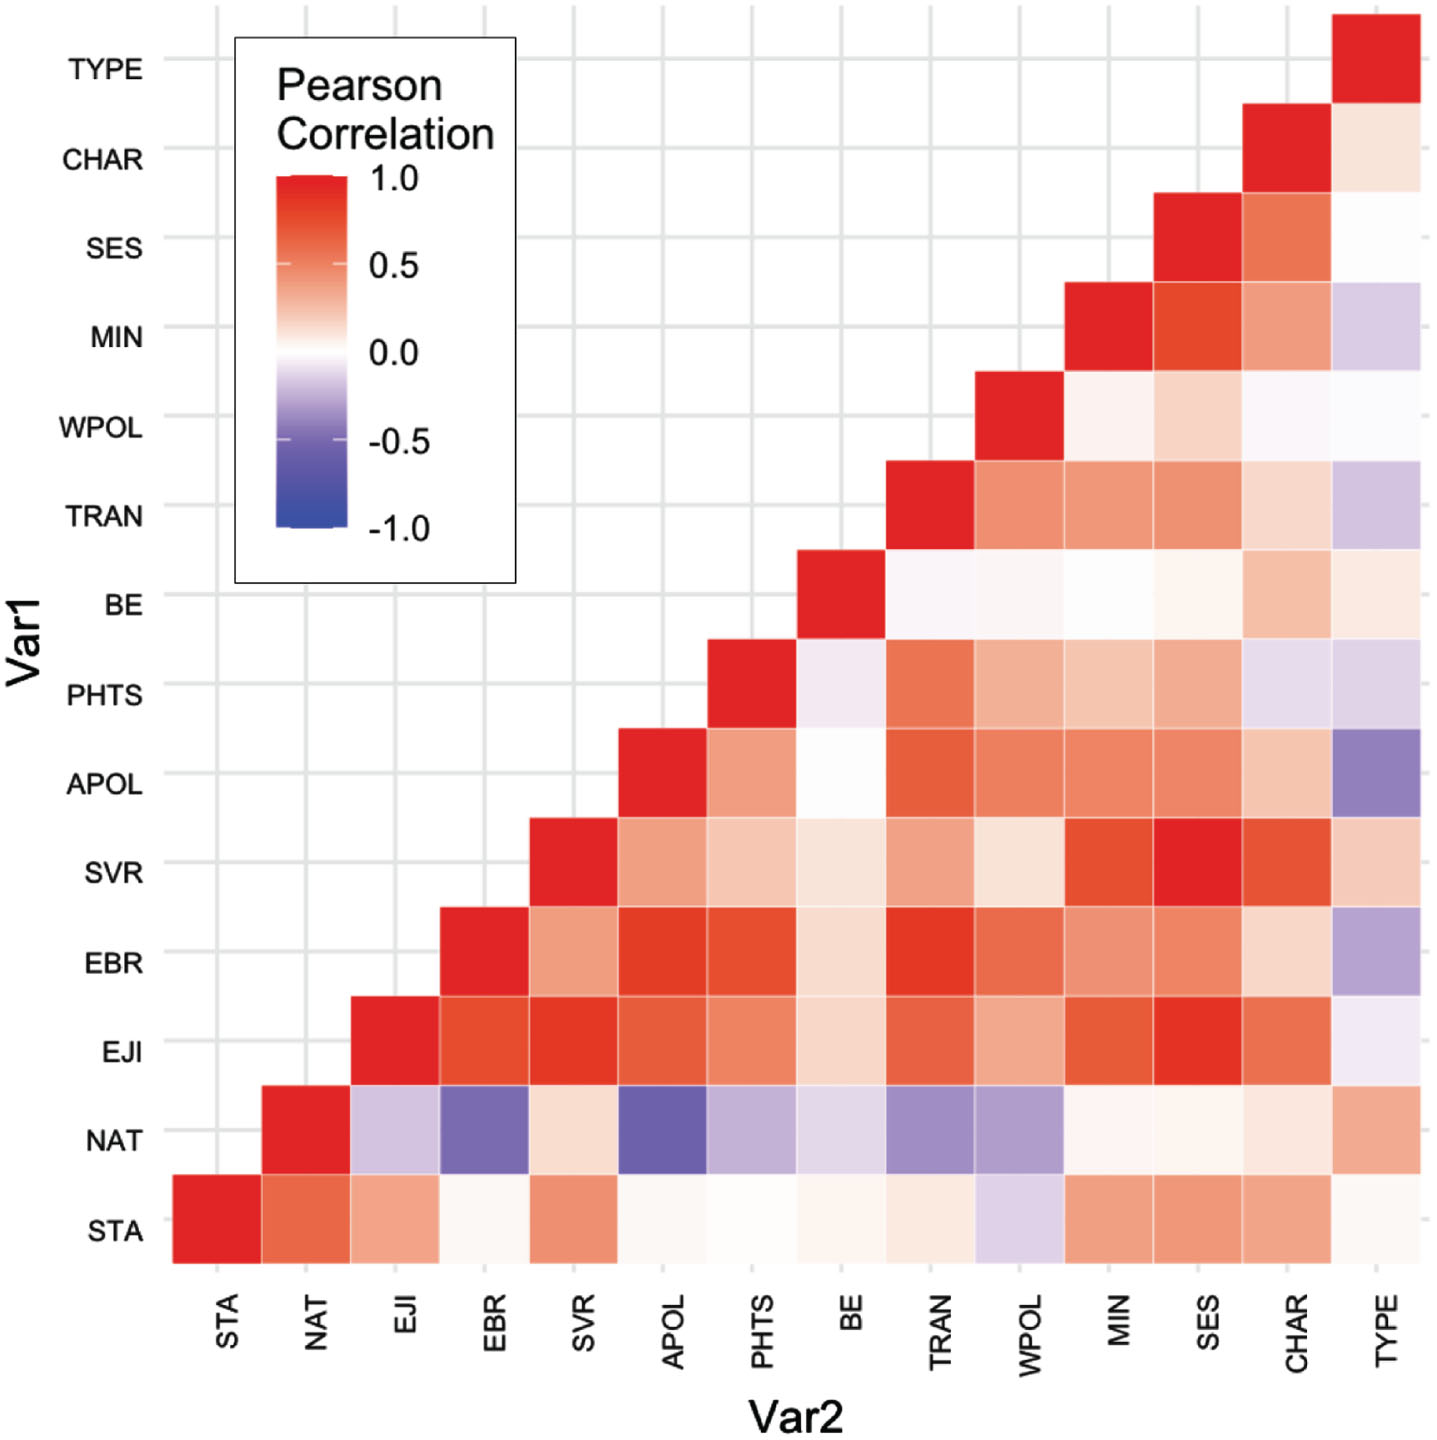
Figure 5 depicts the correlations between the EJI indices and ADI variables. The EBR and SVR were positively correlated with each other (r = 0.39, p < 0.001). The SVR was also significantly correlated with STA (r = 0.44, p < 0.001), but not with NAT (r = 0.13, p = 0.183). The EBR was not correlated with STA (r = 0.03, p = 0.754). Within the ADI, the STA and NAT were also positively correlated (r = 62, p < 0.001).
Fig. 5
Heat map depicting the correlations between EJI and ADI indices. ADI variables include state (STA) decile and national (NAT) percentiles. Categorical variables from the environmental burden (EBR) module: air pollution (APOL), potentially hazardous and toxic sites (PHTS), built environment (BE), transportation infrastructure (TRAN), and water pollution (WPOL). From the social vulnerability module: minority status (MIN), socioeconomic status (SES), household characteristics (CHAR), housing type (TYPE). EJI is the overall score. Please see text for details of the correlation results and p-values.
Effect of EBR, SVR, and ADI status on the change from baseline in ADAS-Cog
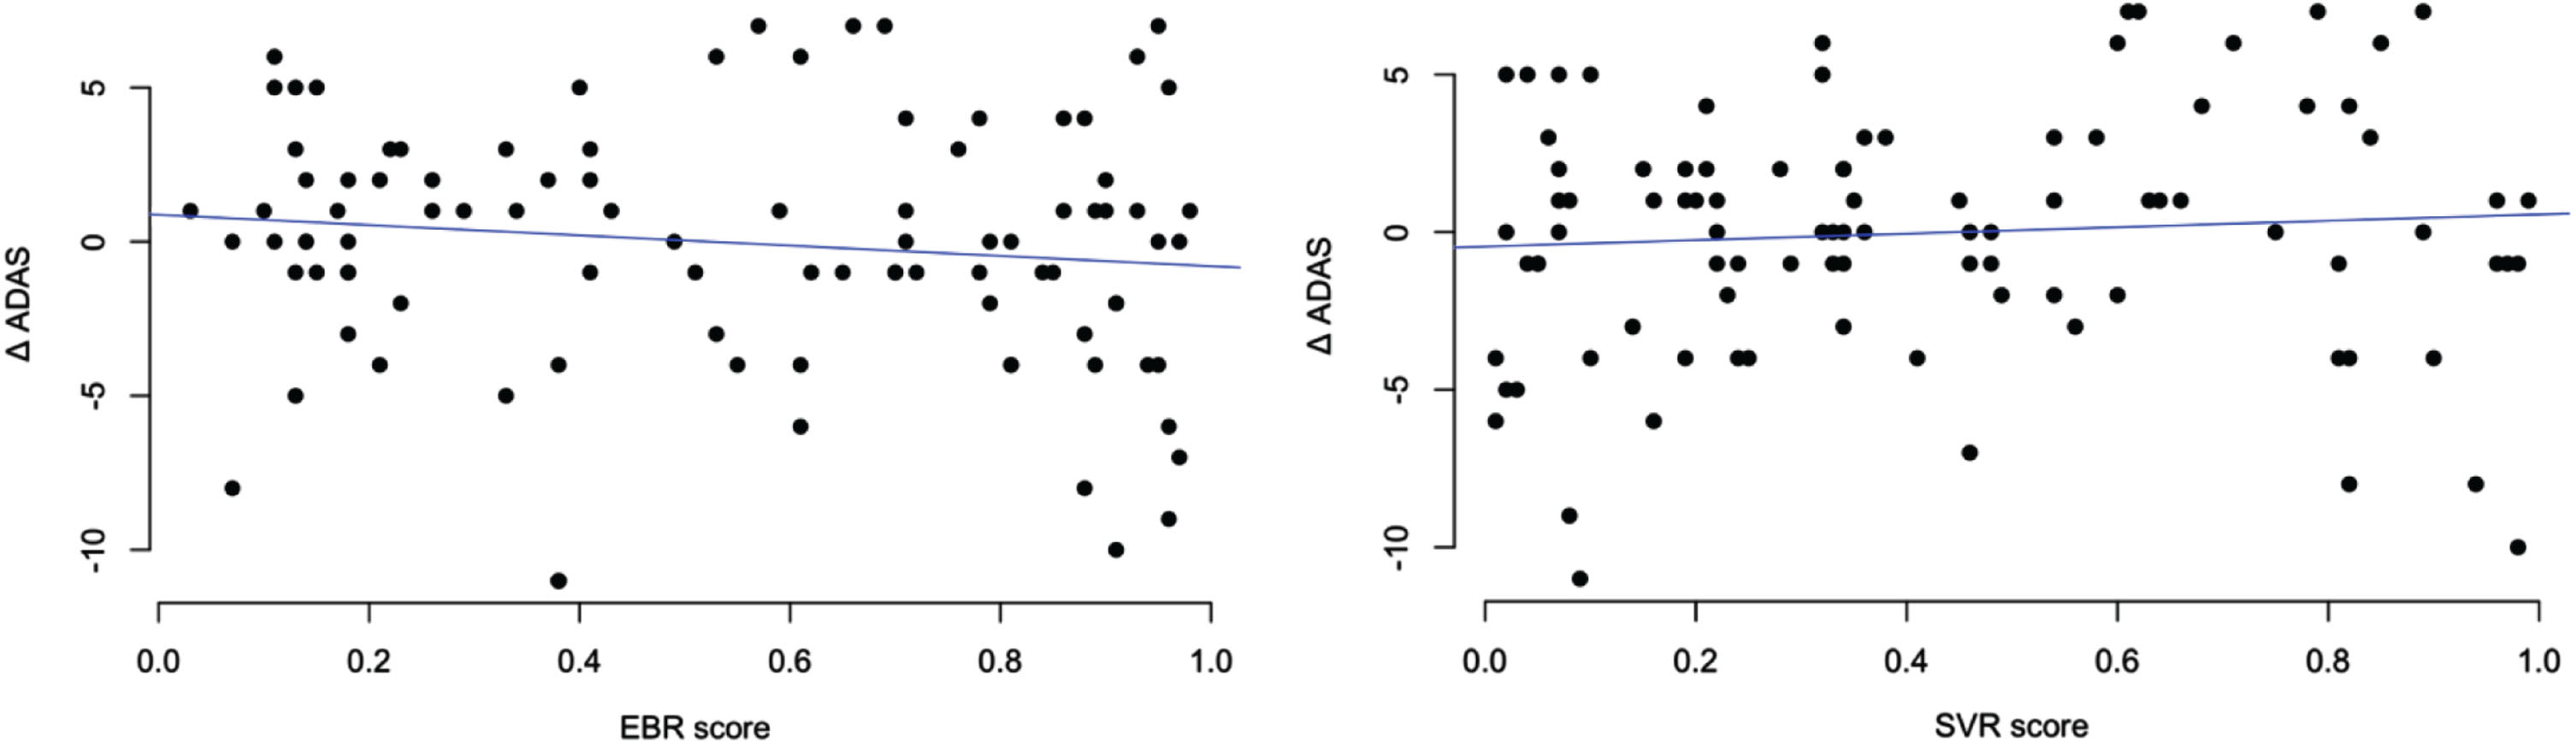
There was no significant effect of baseline EBR, SVR, or ADI status on the change in ADAS-Cog from baseline to week 78 (Fig. 6).
Fig. 6
Correlation of Environmental Justice Index components with 78-week change in ADAS scores. Figure depicts the scatter of Environmental Burden Rankings and Social Vulnerability Rankings with the change in ADAS over time. There is no significant relationship between these variables.
DISCUSSION
To our knowledge, this is the first study to link the Environmental Justice Index to a clinical trial of mild cognitive impairment. There is increasing acknowledgment of the failure of prior clinical trials to be inclusive [16, 17] and the need to more fully capture the effects of the exposome on health outcomes [1–5]. There is also increasing interest in climate medicine and in linking environmental variables, such as air pollution [1, 2], metallic toxicity [1, 18–20], and greenspace availability [1, 4], to cognitive decline.
Several findings emerged from our study. While the overall mean of the EBR in the pooled sample was near the national average, several air pollution metrics, such as particulate matter 2.5, diesel particulate matter and other air toxics (formaldehyde, carbon tetrachloride, acetaldehyde, and benzene), were worse than the national average. On the other hand, metrics for air ozone, walkability, access to airports, and proximity to lead and coal mines were much better than the national average. When divided by race/ethnicity, minorities were significantly more likely to live in areas with greater exposure to air pollution, ozone, diesel particulate matter, air toxics cancer risk, and greater proximity to treatment, storage and disposal sites. However, minorities were more likely to live in areas that were more walkable with more recreational parks. These findings are notable since many of these factors have been linked to risk for neurodegenerative processes or cognitive impairment [1–5, 18–21].
As with EBR, the overall SVR rank as well as several neighborhood-level socioeconomic metrics (poverty, education, unemployment, lack of health insurance, lack of broadband access) were worse for minority participants. ADI STA ranking was also higher for minorities. Thus, MCI participants who identified as minorities were more likely to live in a geographic area with greater socioeconomic deprivation. The lack of correlation between the ADI STA and EBR suggests they are meant to evaluate disparate constructs, as the ADI is meant to capture socioeconomic variables and the EBR measures environmental exposures.
The relationship between race/ethnicity and environmental vulnerability has been documented in the literature, observing that minority communities tend to be located in places with more environmental hazards, such as pollution and contaminants, including pesticides and waste products [22–24]. Our findings confirm the systemic nature of environmental injustice and extend this to MCI - marginalized MCI subjects may face a disproportionate burden of environmental hazards including many factors known to be risks for AD. This inherent geographic separation is a result of past injustices, such as racial segregation, discriminatory zoning practices, and unequal access to resources [25].
If larger studies confirm a link between environmental burden and/or social vulnerability and a greater risk for cognitive decline, especially in minorities, they may have direct implications for how resources should be allocated to mitigate environmental hazards in MCI to prevent long-term impacts on health. The higher risk for AD in African Americans and Native Americans has been largely attributed in prior studies to lower educational levels and decreased cognitive reserve [26–28] but accumulated findings [1, 2, 4] suggest a need to examine the potential synergistic role of multiple environmental hazards, such as air pollution, and proximity to treatment, storage, and disposal sites.
Our findings also have implications for the integration of neighborhood-level environmental data in multi-site observational and interventional trials. We found differences by study site in a range of environmental exposures—a factor rarely taken into account in AD treatment or prevention trials. Further, as AD clinical trials strive to enhance diversity [16, 17], it will become more important to fully characterize the differential risks faced by study subjects at entry and during the trial. A subject living in an area with high indoor and outdoor environmental hazards may potentially have a different outcome than a subject living in a clean neighborhood. While our study did not find any significant relationship between baseline EBR or ADI and longitudinal cognitive change, we believe this may be due to a lack of power and the fact that all subjects in the study were on active cognitive enhancing therapy. We are not stating that the EJI should be used as a criterion for entry into clinical trials, but rather that it can be used as a measure of neighborhood exposures in post-hoc analysis to examine potential environmental impacts as confounds or mediators of outcomes. It also illustrates the power of this tool to test for differences across sites and to better characterize the exposome subjects for studies. Future research should also directly measure the effect of environmental hazards at an individual patient level using careful clinical history, sensors, and blood biomarkers of toxicity (from pollutants and metals) to complement the EJI data.
The strengths of this study include the careful characterization of study subjects with regards to MCI diagnosis, cognition, and a range of neighbourhood exposures as well as being the first study to directly examine the utility of the EJI in a prevention trial. There are also some limitations as this was an exploratory study. First is the relatively small sample size. We also recognize that there are significant differences between the minority groups we chose to combine, and future studies should aim to increase sample size to allow the power to study each group separately. Furthermore, the variables in the EJI and ADI are integrated through different sources and may not have been collected in immediate temporal proximity to when our subjects’ cognition was assessed. The development of MCI and/or AD is also not likely to be attributed to any one environmental or social factor, as AD is a heterogeneous disease with many kinds of risk factors, many of them longitudinal. Additionally, the grouping of neighborhoods as census tracts or census blocks may not necessarily reflect the true vulnerabilities of a given subject or house in that area. Combining information specific to a particular individual or house with the neighborhood-level data would be more specific at a causal level. However, such house-specific data are unlikely to be available at a national level due to technological limitations and privacy concerns. Lastly, measuring exposure when a subject already has symptoms may not capture exposure during early childhood or mid-life when they may have lived at a different location. Future research should ideally measure cumulative lifetime exposure, but again, such metrics are not available at this time. Hence, our findings should be interpreted as preliminary, and warranting replication in larger studies.
Despite these limitations, our study documents a link between a range of environmental hazards and race/ethnicity in MCI subjects. While we are not insinuating that the EJI is a replacement for clinical history and measurement of individual environmental exposures, it is an additional tool. Indices such as the EJI and the ADI may help our efforts to better study the exposome, reduce environmental exposures, and promote environmental justice in marginalized communities.
AUTHOR CONTRIBUTIONS
Alisa Adhikari (Conceptualization; Data curation; Investigation; Methodology; Visualization; Writing – original draft; Writing – review & editing); Adaora Nwosu (Data curation; Methodology; Writing – review & editing); Min Qian (Data curation; Formal analysis; Methodology; Writing – review & editing); Caroline Hellegers (Data curation; Investigation; Project administration; Writing – review & editing); Davangere P. Devanand (Funding acquisition; Investigation; Methodology; Project administration; Resources; Writing – review & editing); P. Murali Doraiswamy (Conceptualization; Investigation; Methodology; Project administration; Resources; Supervision; Writing – original draft; Writing – review & editing).
ACKNOWLEDGMENTS
We would like to thank Drs. Anne Weaver and Kristin Rapazzo for their helpful discussions. We would also like to acknowledge Julia Phillips and Sansara Mahtani for their technical support.
FUNDING
Data collection was supported by National Institute of Aging NIA1R01AG052440.
CONFLICT OF INTEREST
DPD has received research grants from the National Institute on Aging and the Alzheimer’s Association and has served as a consultant on scientific advisory boards to Acadia, Corium, Genentech, TauRx, and a DSMB for BioXcel. PMD has received research grants from the NIH, DARPA, DOD, ONR, Salix, Avanir, Avid, Cure Alzhaimer’s Fund, Karen L. Wrenn Trust, US Highbush Blueberry Council, Steve Aoki Foundation, and advisory/board fees from Apollo, Clearview, Lumos, Prospira, Keel Digital, Otsuka, Compass, Sermo, Nutricia, UMethod, and Transposon. PMD is a co-inventor on patents for the diagnosis or treatment of Alzheimer disease and a patent for infection detection. PMD owns shares in UMethod, Alzheon, Transposon and MarvelBiome whose products are not discussed here. Other authors have received grant support from NIH and report no other competing interests.
DATA AVAILABILITY
Individual research subject data are not available for sharing to protect privacy. EJI and ADI data for geographic locations are available on their respective websites.
SUPPLEMENTARY MATERIAL
[1] The supplementary material is available in the electronic version of this article: https://dx.doi.org/10.3233/ADR-240020.
REFERENCES
[1] | National Institute on Aging (2020) NIA Virtual Workshop: Understanding the role of the exposome in brain aging, Alzheimer’s disease (AD) and AD-related dememtias (ADRD). https://www.nia.nih.gov/sites/default/files/2021-12/Understanding-the-Role-of-the-Exposome-Meeting-Summary.pdf |
[2] | Gao X , Coull B , Lin X , Vokonas P , Spiro A , Hou L , Schwartz J , Baccarelli AA ((2021) ) Short-term air pollution, cognitive performance and nonsteroidal anti-inflammatory drug use in the Veterans Affairs Normative Aging Study. Nat Aging 1: , 430–437. |
[3] | Powell WR , Buckingham WR , Larson JL , Vilen L , Yu M , Salamat MS , Bendlin BB , Rissman RA , Kind AJH ((2020) ) Association of neighborhood-level disadvantage with Alzheimer disease neuropathology. JAMA Netw Open 3: , e207559. |
[4] | Aitken WW , Lombard J , Wang K , Toro M , Byrne M , Nardi MI , Kardys J , Parrish A , Dong C , Szapocznik J , Rundek T , Brown SC ((2021) ) Relationship of neighborhood greenness to Alzheimer’s disease and non-Alzheimer’s dementia among 249,405 U.S. Medicare Beneficiaries. J Alzheimers Dis 81: , 597–606. |
[5] | Finch CE , Kulminski AM ((2019) ) The Alzheimer’s disease exposome. Alzheimers Dement 15: , 1123–1132. |
[6] | Kind AJH , Buckingham W ((2018) ) Making neighborhood disadvantage metrics accessible: The neighborhood atlas. N Engl J Med 378: , 2456–2458. |
[7] | University of Wisconsin School of Medicine and Public Health (2021) 2021 Area Deprivation Index v4. https://www.neighborhoodatlas.medicine.wisc.edu/ |
[8] | Maroko AR , Doan TM , Arno PS , Hubel M , Yi S , Viola D ((2016) ) Integrating social determinants of health with treatment and prevention: A new tool to assess local area deprivation. Prev Chronic Dis 13: , E128. |
[9] | Hunt JFV , Vogt NM , Jonaitis EM , Buckingham WR , Koscik RL , Zuelsdorff M , Clark LR , Gleason CE , Yu M , Okonkwo O , Johnson SC , Asthana S , Bendlin BB , Kind AJH ((2021) ) Association of neighborhood context, cognitive decline, and cortical change in an unimpaired cohort. Neurology 96: , e2500–e2512. |
[10] | United States Environmental Protection Agency. Learn About Environmental Justice. https://www.epa.gov/environmentaljustice/learn-about-environmental-justice |
[11] | Centers for Disease Control and Prevention and Agency for Toxic Substances Disease Registry (2022). Environmental Justice Index (EJI) Fact Sheet. https://www.atsdr.cdc.gov/placeandhealth/eji/index.html |
[12] | Centers for Disease Control and Prevention and Agency for Toxic Substances Disease Registry (2022) Environmental Justice Index (EJI) Indicators. www.atsdr.cdc.gov/placeandhealth/eji/indicators.html |
[13] | Centers for Disease Control and Prevention and Agency for Toxic Substances Disease Registry (2022) Environmental Justice Index (EJI) Technical Documentation. https://www.atsdr.cdc.gov/placeandhealth/eji/docs/EJI-2022-Documentation.pdf |
[14] | Devanand DP , Goldberg TE , Qian M , Rushia SN , Sneed JR , Andrews HF , Nino I , Phillips J , Pence ST , Linares AR , Hellegers CA , Michael AM , Kerner NA , Petrella JR , Doraiswamy PM ((2022) ) Computerized games versus crosswords training in mild cognitive impairment.. NEJM Evid 1: , 10.1056/evidoa2200121.=. |
[15] | D’Antonio J , Simon-Pearson L , Goldberg T , Sneed JR , Rushia S , Kerner N , Andrews H , Hellegers C , Tolbert S , Perea E , Petrella J , Doraiswamy PM , Devanand D ((2019) ) Cognitive training and neuroplasticity in mild cognitive impairment (COG-IT): Protocol for a two-site, blinded, randomised, controlled treatment trial. BMJ Open 9: , e028536. |
[16] | Shin J , Doraiswamy PM ((2016) ) Underrepresentation of African-Americans in Alzheimer’s trials: A call for affirmative action. Front Aging Neurosci 8: , 123. |
[17] | Raman R , Aisen PS , Carillo MC , Detke M , Grill JD , Okonkwo OC , Rivera-Mindt M , Sabbagh M , Vellas B , Weiner M , Sperling R ((2022) ) Tackling a major deficiency of diversity in Alzheimer’s disease therapeutic trials: An CTAD Task Force Report. J Prev Alzheimers Dis 9: , 388–392. |
[18] | Killin LO , Starr JM , Shiue IJ , Russ TC ((2016) ) Environmental risk factors for dementia: A systematic review. BMC Geriatr 16: , 175. |
[19] | Rondeau V , Jacqmin-Gadda H , Commenges D , Helmer C , Dartigues JF ((2009) ) Aluminum and silica in drinking water and the risk of Alzheimer’s disease or cognitive decline: Findings from 15-year follow-up of the PAQUID cohort. Am J Epidemiol 169: , 489–496. |
[20] | Gillette-Guyonnet S , Andrieu S , Nourhashemi F , de LaGuéronnière V , Grandjean H , Vellas B ((2005) ) Cognitiveimpairment and composition of drinking water in women: Findings ofthe EPIDOS Study. Am J Clin Nutr 81: , 897–902. |
[21] | Chen H , Kwong JC , Copes R , Hystad P , van Donkelaar A , Tu K , Brook JR , Goldberg MS , Martin RV , Murray BJ , Wilton AS , Kopp A , Burnett RT ((2017) ) Exposure to ambient air pollution and the incidence of dementia: A population-based cohort study. Environ Int 108: , 271–277. |
[22] | Mohai P , Lantz PM , Morenoff J , House JS , Mero RP ((2009) ) Racial and socioeconomic disparities in residential proximity to polluting industrial facilities: Evidence from the Americans’ Changing Lives Study. Am J Public Health 99 Suppl 3: , S649–656. |
[23] | Mohai P , Saha R ((2014) ) Racial inequality in the distribution of hazardous waste: A national-level reassessment. Social Problems 54: , 343–370. |
[24] | Gochfeld M , Burger J ((2011) ) Disproportionate exposures in environmental justice and other populations: The importance of outliers. Am J Public Health 101 Suppl 1: , S53–63. |
[25] | Morello-Frosch R , Zuk M , Jerrett M , Shamasunder B , Kyle AD ((2011) ) Understanding the cumulative impacts of inequalities in environmental health: Implications for policy. Health Aff (Millwood) 30: , 879–887. |
[26] | Rosselli M , Uribe IV , Ahne E , Shihadeh L ((2022) ) Culture, ethnicity, and level of education in Alzheimer’s disease. Neurotherapeutics 19: , 26–54. |
[27] | Stern Y ((2012) ) Cognitive reserve in ageing and Alzheimer’s disease. Lancet Neurol 11: , 1006–1012. |
[28] | Tyas SL , Manfreda J , Strain LA , Montgomery PR ((2001) ) Risk factors for Alzheimer’s disease: A population-based, longitudinal study in Manitoba, Canada. Int J Epidemiol 30: , 590–597. |

