
Manuscript accepted on :05-09-2022
Published online on: 07-10-2022
Plagiarism Check: Yes
Reviewed by: Dr. Cherry Bansal
Second Review by: Dr. Moumita Hazra
Final Approval by: Dr. H Fai Poon
Rajesh Kumar Bhola* , Tapan Biswal, Sarita Pradhan, Ripunjaya Mohanty and Gayatri Behera
Laboratory Hematology Division, Department of Pathology, IMS and SUM Hospital, Siksha ‘O’ Anusandhan (Deemed to be) University, Bhubaneswar, Odisha, India
Corresponding Author E-mail: rajeshkumarbhola@soa.ac.in
DOI : https://dx.doi.org/10.13005/bpj/2549
Abstract
Clot waveforms generated by different automated coagulometry are of immense utility in predicting the risk of bleeding or thrombosis. They are part of global hemostasis testing. Different automated analyzers use different technology for clotting screening tests. The clotting screening results depends on the instrument and the reagents used. Hence clot waveform analysis may have different kinetics based on instrument or reagents used. A baseline characteristic can help in clinical interpretation.Total 47 voluntary blood donors (23 males and 24 females) between 20-50 years age are included in the study. We have analyzed the kinetics of clot waveform of Prothrombin time (PT) using Dade Innovin, activated partial thromboplastin time (aPTT) using Actin FS & Actin FSL and thrombin time (TT) on Sysmex CS2500 automated coagulometry. The baseline characteristics were analyzed and the reference intervals were determined as follows: PT using Dade Innovin reagent: 9.8 – 12.0s, its 1st derivative or maximum velocity (min1): 1.00-2.42 %/s, 2nd derivative or maximum acceleration (min2): 0.14-0.38%/s2, maximum deceleration (max2): 0.18-0.42 %/s2; aPTT using actin FSL: 26.2-34.5s, min1 2.73-6.17%/s, min2 0.41-0.95%/s2, max2 0.30-0.77 %/s2 ; aPTT using actin FS reagent: 21.2-30.5s, min1 2.73-6.33 %/s, min2 0.37-1.07 %/s2, max2 0.32-0.94 %/s2 ; TT: 16.8-19.6 s, min1 0.57-1.23 %/s, min2 0.08-0.20 %/s2, max2 0.03-0.11 %/s2 respectively. The clotting time shows an inverse moderate to weak relationship with maximum velocity, maximum acceleration and maximum deceleration. Analyzing the normal kinetics of clot waveform helps in understanding the clotting process and clinical interpretation.
Keywords
Automated Coagulometry; Coagulation; Clot Waveform Analysis; Hemophilia
Download this article as:| Copy the following to cite this article: Bhola R. K, Biswal T, Pradhan S, Mohanty R, Behera G. Baseline Kinetics of Clot Waveform Analysis of Clotting Screening Tests on Sysmex CS2500 Automated Coagulometry. Biomed Pharmacol J 2022;15(4). |
| Copy the following to cite this URL: Bhola R. K, Biswal T, Pradhan S, Mohanty R, Behera G. Baseline Kinetics of Clot Waveform Analysis of Clotting Screening Tests on Sysmex CS2500 Automated Coagulometry. Biomed Pharmacol J 2022;15(4). Available from: https://bit.ly/3SLLTgS |
Introduction
The prothrombin time (PT), activated partial thromboplastin time (aPTT) & thrombin time (TT) are the commonly used screening tests to evaluate hemostatic disorders. These tests measure the clotting time of citrated plasma after addition of different activating agents. The clot formation is detected manually by visual inspection whereas optical system or mechanical systems are being used in automated methods.1 These screening tests analyze the end point of the process of coagulation cascade, i.e. fibrin clot formation in vitro and the process of clot formation is represented by the clot waveform. The qualitative and quantitative kinetics of clot waveform analysis (CWA) allow the detection of several thrombotic and bleeding disorders. 2
Changes in characteristics of optical transmittance or absorbance data from coagulation assays can be examined for onset and completion of coagulation, magnitude of signal change, and rate of clot formation etc. This has formed the basis of expanded interpretation of coagulation assays’ optical data for further clinical or research application.3 A number of recent studies have shown its advantage and clinical usefulness in disseminated intravascular coagulation (DIC), sepsis, hemophilia, assessing the phenotypic heterogeneity of hemophilia, monitoring hemophilia therapy, bleeding risk in cirrhosis etc. 4-9
Different automated coagulation analyzers use different technology like mechanical or photo-optical technology for clotting time assessments. The photo-optical technologies use either the principle of light transmittance or absorbance for obtaining the clotting time. With coagulation the light transmittance is decreased or absorbance is increased by the formation of fibrin clot. This process of change in light transmission or absorption goes through pre-coagulation, coagulation and post-coagulation phases. In the initial pre-coagulation phase the light transmittance is 100% and absorbance is 0%. With the coagulation process, gradually the light transmittance is reduced and absorbance is increased till it tends to stabilize with a fibrin clot. Post-coagulation is normally stable unless affected by fibrinolysis which results in increase in light transmission or reduction in absorption. The whole process of change in optical properties is represented by a curve known as clot waveform which is usually linear in pre-coagulation phase, forms a slope in coagulation phase and again forms a linear segment in post-coagulation phase. This indicates that the whole process of coagulation can be understood as a function of the kinetics of clot waveform as depicted in the Fig 1. The change in light transmittance is represented as delta. The first derivative is derived from the change in transmittance which is presented as dT/dt. The maximum velocity at which the transmittance getting changed is represented as Min1 with corresponding time required to achieve Min1 as Tmin1. The second derivative is derived from the first derivative as d2T/dt2. The maximum acceleration is presented as Min2 with corresponding time required Tmin2 and maximum deceleration as Max2 with corresponding time required as Tmax2.10 Similarly instruments using light absorbance technology, the kinetics of clot waveform are represented by max1, max 2 and min2 respectively.
An in-depth assessment of CWA can provide additional clinically useful information than only clotting tests. But still it is not used widely as reportable parameter, especially due to lack of proper standardization.11 The aim of this work is to evaluate the normal kinetics of CWA and its biological reference interval on Sysmex CS 2500 automated coagulometry.
Materials and Methods
Selection of reference population
As part of standard protocol 47 healthy volunteers (23 males and 24 females) were recruited with informed consent to donate blood samples for coagulometry reference range verification. Normal healthy adults of either sex between 20 to 50 years were included in the study. All those on any medications that could have interfered with clotting factors and coagulation tests were excluded.
Blood sample collection and sample preparation:
All the donors were bled in the morning between 8 am to 11 am. Blood was collected by venipuncture in the antecubital vein by evacuated tube system (ETS) using a 22-gauge needle (Vaku-8, HMD Ltd) and collected into blue top vacutainer tubes with 0.109M (3.2%) trisodium citrate in 1:9 (v/v) ratios (BD Vacutainer, Becton, Dickinson and company). The sample was mixed properly by inversion. The samples were centrifuged at 2500g for 15 minutes to separate the plasma. All the procedures were completed within 4 hours including the individual plasma coagulation assay for reference interval calculation.
Instrument selection
Individual plasmas were screened for prothrombin time (PT), activated partial thromboplastin time (aPTT) & thrombin time (TT) in the fully automated coagulometry- Sysmex CS2500 (Sysmex Corporation, Kobe, Japan). The analysis method is based on clotting method which determines the clotting time using percentage detection method based on light transmittance principle. The level of transmitted light intensity that is present right after the reagent is added to the sample but before clotting has started is defined as 0% clotting, and the level of transmitted light intensity that is present after the clotting is completed is defined as 100%. The time that it takes for the level of transmitted light intensity to reach the pretest detection percentage is found from the reaction curve. Usually the detection percentage is set to 50% and is defined as clotting time. The optical detection system uses the principle of multi-wavelength transmitted light detection method with 5 filters of 340 nm, 405 nm, 575 nm, 660 nm, 800 nm respectively.
Reagent selection
Dade®Innovin® (Siemens Healthcare Diagnostics, GmbH, Germany) reagents for Prothrombin time (PT). For activated partial thromboplastin time assay we had used 2 different reagents – Dade® Actin® FS activated PTT reagent (Siemens Healthcare Diagnostics, GmbH, Germany) & Dade® Actin® FSL activated PTT reagent (Siemens Healthcare Diagnostics, GmbH, Germany). Test thrombin reagent (Siemens Healthcare Diagnostics, GmbH, Germany) was used for thrombin time (TT).
Clot waveform analysis data collection
The clotting time data were recorded in the automated analyzer. The research data like maximum velocity Min1, time to Min1 (Tmin1), maximum acceleration Min2, time to Min2 (Tmin2), maximum deceleration Max2 and time to max2 (Tmax2) were taken for the study from the analyzer database. All the data were anonymized for statistical analysis.
Statistical analysis
Statistical analysis was done using IBM SPSS statistics software version 20. The quantitative variables are analyzed by Kolmogorov—Smirnov’s test to ascertain normal Gaussian distribution. The parametric data were analyzed by one sample t-test and the mean, standard deviation (SD) were calculated. The non-parametric data were presented as median and interquartile range (IQR). The normal reference ranges were calculated as mean ± 2SD for parametric data and 25th to 75th percentile for nonparametric data. The associations between two quantitative variables were analyzed by Pearson’s correlation test.
Results
The sample was collected from total 47 healthy volunteers who included 23 males and 24 females. They were all adult persons between the ages of 20-50 years.
The normality distribution was studied for all parameters by Kolmogorov—Smirnov’s test with the null hypothesis that the data was normally distributed. The null hypothesis was rejected wherever the p<0.05. All parameters are normally distributed except for time to PT Min2 and time to TT Min2 which shows non-Gaussian distribution with a p value of <0.001 as depicted in table 1.
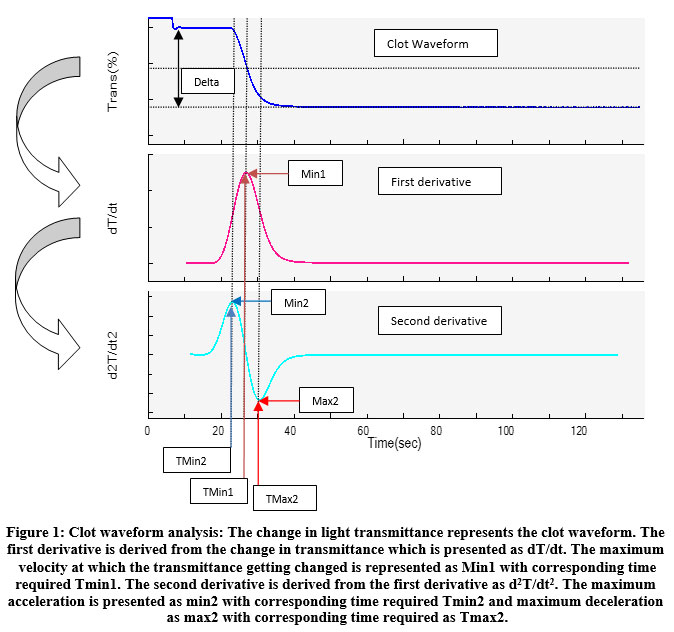 |
Figure 1: Clot waveform analysis: The change in light transmittance represents the clot waveform. The first derivative is derived from the change in transmittance which is presented as dT/dt. |
Table 1: Statistical properties of normal kinetics of clot waveform analysis of clotting screening tests.
| Parameter | P value | Min | Max | Mean | 95% CI | SD | Median | IQR | RI* |
| Prothrombin time (PT) | |||||||||
| PT (s) | .093 | 9.8 | 12.4 | 10.92 | 10.77–11.10 | .57 | 10.90 | 0.9 | 9.8- 12.0 |
| Min1 (%/s) | .374 | 1.067 | 2.626 | 1.71 | 1.60-1.81 | .36 | 1.61 | 0.57 | 1.00-2.42 |
| TMin1 (s) | .590 | 10.0 | 12.6 | 11.10 | 10.93-11.30 | .63 | 11.00 | 1.0 | 9.87-12.33 |
| Min2 (%/s2) | .978 | .130 | .415 | .26 | 0.24-0.28 | .06 | .26 | 0.07 | 0.14- 0.38 |
| TMin2 (s) | .000** | 9.5 | 9.8 | 9.51 | 9.49-9.52 | .04 | 9.50 | .0 | 9.50-9.74** |
| max2 (%/s2) | .394 | .179 | .450 | .30 | 0.28-0.31 | .06 | .28 | 0.10 | 0.18-0.42 |
| Tmax2 (s) | .981 | 13.1 | 15.8 | 14.33 | 14.17-14.52 | .60 | 14.40 | 0.8 | 13.15-15.50 |
| Activated partial thromboplastin time (aPTT) using FSL reagent | |||||||||
| APTT (s) | .083 | 27.1 | 39.6 | 30.36 | 29.82-31.05 | 2.10 | 30.20 | 1.8 | 26.24-34.48 |
| Min1 (%/s) | .734 | 2.802 | 6.795 | 4.45 | 4.18-4.71 | .88 | 4.25 | 1.36 | 2.73-6.17 |
| TMin1 (s) | .079 | 26.8 | 38.6 | 30.00 | 29.50-30.64 | 1.97 | 29.90 | 1.8 | 26.14-33.86 |
| Min2 (%/s2) | .845 | .382 | 1.079 | .68 | 0.63-0.72 | .14 | .65 | 0.20 | 0.41-0.95 |
| TMin2 (s) | .140 | 22.9 | 33.0 | 25.87 | 25.43-26.43 | 1.72 | 25.80 | 1.5 | 22.50-29.24 |
| max2 (%/s2) | .491 | .257 | .875 | .54 | 0.50-0.57 | .12 | .51 | 0.18 | 0.30-0.77 |
| Tmax2 (s) | .082 | 30.7 | 44.3 | 34.16 | 33.57-34.89 | 2.25 | 34.10 | 2.2 | 29.75-38.57 |
| Activated partial thromboplastin time (aPTT) using FS reagent | |||||||||
| APTT | .840 | 22.1 | 36.3 | 25.86 | 25.18-26.61 | 2.39 | 26.00 | 2.9 | 21.18-30.54 |
| Min1 (%/s) | .638 | 2.706 | 6.927 | 4.53 | 4.24-4.79 | .92 | 4.32 | 1.45 | 2.73-6.33 |
| TMin1 (s) | .890 | 22.0 | 36.0 | 25.75 | 25.08-26.49 | 2.35 | 25.90 | 2.9 | 21.14-30.35 |
| Min2 (%/s2) | .918 | .065 | 1.145 | .72 | 0.67-0.78 | .18 | .71 | 0.23 | 0.37-1.07 |
| TMin2 (s) | .806 | 18.4 | 31.0 | 21.97 | 21.36-22.65 | 2.17 | 22.00 | 2.8 | 17.72-26.22 |
| max2 (%/s2) | .901 | .073 | 1.007 | .63 | 0.58-0.68 | .16 | .61 | 0.20 | 0.32-0.94 |
| Tmax2 (s) | .712 | 25.6 | 41.0 | 29.49 | 28.76-30.29 | 2.55 | 29.70 | 2.9 | 24.49-34.49 |
| Thrombin time (TT) | |||||||||
| TT (s) | .741 | 16.9 | 19.8 | 18.23 | 18.03-18.45 | .70 | 18.10 | 1.1 | 16.86-19.60 |
| Min1 (%/s) | .383 | .528 | 1.349 | .90 | 0.85-0.95 | .17 | .88 | 0.26 | 0.57-1.23 |
| TMin1 (s) | .787 | 14.6 | 16.7 | 15.67 | 15.51-15.85 | .57 | 15.70 | 0.9 | 14.55-16.79 |
| Min2 (%/s2) | .541 | .080 | .213 | .14 | 0.13-0.15 | .03 | .13 | 0.04 | 0.08-0.20 |
| TMin2 (s) | 0.437 | 10.4 | 12.3 | 11.34 | 11.18-11.50 | 0.54 | 11.30 | 0.9 | 10.28-12.40 |
| max2 (%/s2) | .791 | .007 | .117 | .07 | 0.06-0.07 | .02 | .07 | 0.03 | 0.03-0.11 |
| Tmax2 (s) | .748 | 17.7 | 20.8 | 19.13 | 18.92-19.35 | .71 | 19.00 | 1.1 | 17.74-20.52 |
P value indicates the statistical significance of non-Gaussian distribution with value <0.05 indicates that non-Gaussian distribution of data and values >0.05 is indicative of Gaussian distribution. Min: minimum value of the data distribution, max: maximum value of the data distribution, CI: confidence interval of mean, SD: standard deviation, IQR: interquartile range, RI: reference interval, *in case of Gaussian distribution of data the RI is calculated as Mean ±1.96SD and in case of non-Gaussian distribution the RI is calculated as 2.5th to 97.5th percentile, **indicates non-Gaussian distribution.
Depending on the data distribution pattern the dispersion statistics like mean, confidence interval of mean, standard deviation, median and inter-quartile range were calculated for all types of objective parameters as depicted in table 1. The reference ranges for different kinetic parameters were calculated from it.
The reference interval for prothrombin time (PT) are clotting time: 9.8 – 12.0 s, the maximum velocity (min1): 1.00-2.42 %/s, maximum acceleration (min2): 0.14-0.38%/s2, maximum deceleration (max2): 0.18-0.42 %/s2, time to maximum velocity (Tmin1): 9.87-12.33s, time to maximum acceleration (Tmin2): 9.50-9.74 s, &time to maximum deceleration (Tmax2): 13.15-15.50 s respectively.
The reference interval for activated partial thromboplatin time (aPTT) using Actin FSL reagent are clotting time: 26.2-34.5 s, min1 2.73-6.17 %/s, min2 0.41-0.95 %/s2, max2 0.30-0.77 %/s2, Tmin1 26.14-33.86 s, Tmin2 22.5-29.2 s, & Tmax2 29.7-38.6 s respectively.
The reference interval for activated partial thromboplatin time (aPTT) using actin FS reagent are clotting time 21.2-30.5 s, min1 2.73-6.33 %/s, min2 0.37-1.07 %/s2, max2 0.32-0.94 %/s2, Tmin1 21.1-30.3 s, Tmin2 17.7-26.2 s, & Tmax2 24.5-34.5 s respectively.
The reference interval for thrombin time (TT) are clotting time 16.8-19.6 s, min1 0.57-1.23 %/s, min2 0.08-0.20 %/s2, max2 0.03-0.11 %/s2, Tmin1 14.6-16.8 s, Tmin2 10.3-12.4 s, & Tmax2 17.7-20.5 s respectively.
The correlation between different parameters of CWA for PT is depicted in table 2. It is observed that the PT shows statistically significant correlation with min1, min2, max2, Tmin1, Tmax2 except Tmin2. Strong positive correlation is observed between PT and Tmin1 as well as Tmax2. A negative association is seen between PT and maximum velocity and maximum acceleration. Similarly, the maximum velocity shows statistically significant correlation with all parameter except Tmin2. Maximum velocity shows a positive correlation with maximum acceleration and maximum deceleration but inverse correlation with Tmin1 and Tmax2. A stronger association is observed between min1 and max2 whereas the association is moderate with min2. Min2 shows statistically significant positive correlation with all parameters, but the strength of association is relatively weak as Pearson correlation coefficient I is nearly 0.5. Max2 has statistically significant correlation with all except Tmin2 and there is an inverse relationship between Max2 and Tmax2 and Tmin1.
Table 2: Correlation between different kinetic parameters of clot waveform of prothrombin time (PT).
| Correlations | ||||||||
| PT | PT Min1 | PT Min1 at | PT Min2 | PT Min2 at | PT max2 | PT max2 at | ||
| PT | Pearson Correlation | 1 | -.412** | .992** | .513** | .152 | -.363** | .996** |
| Sig. (1-tailed) | .002 | .000 | .000 | .153 | .006 | .000 | ||
| PT Min1 | Pearson Correlation | -.412** | 1 | -.389** | .469** | .149 | .990** | -.420** |
| Sig. (1-tailed) | .002 | .003 | .000 | .159 | .000 | .002 | ||
| PT Min1 at | Pearson Correlation | .992** | -.389** | 1 | .517** | .190 | -.339** | .989** |
| Sig. (1-tailed) | .000 | .003 | .000 | .101 | .010 | .000 | ||
| PT Min2 | Pearson Correlation | .513** | .469** | .517** | 1 | .248* | .527** | .524** |
| Sig. (1-tailed) | .000 | .000 | .000 | .046 | .000 | .000 | ||
| PT Min2 at | Pearson Correlation | .152 | .149 | .190 | .248* | 1 | .160 | .168 |
| Sig. (1-tailed) | .153 | .159 | .101 | .046 | .142 | .130 | ||
| PT max2 | Pearson Correlation | -.363** | .990** | -.339** | .527** | .160 | 1 | -.367** |
| Sig. (1-tailed) | .006 | .000 | .010 | .000 | .142 | .006 | ||
| PT max2 at | Pearson Correlation | .996** | -.420** | .989** | .524** | .168 | -.367** | 1 |
| Sig. (1-tailed) | .000 | .002 | .000 | .000 | .130 | .006 | ||
| **. Correlation is significant at the 0.01 level (1-tailed). | ||||||||
| *. Correlation is significant at the 0.05 level (1-tailed). | ||||||||
The correlation among different parameters of CWA of APTT using Actin FSL reagent is depicted in table 3. All parameters are well correlating with each other with p value <0.05. The APTT shows an inverse correlation with min1, min2 and max2 and the strength of association is weak or moderate in nature. In comparison there is a strong positive correlation with Tmin1, Tmin2 & Tmax2. Strong positive correlation is observed between min1, min2, & max2 whereas this kinetics shows a negative correlation with the time to achieve it, i.e. Tmin1, Tmin2, Tmax2.
Table 3: Correlation between different kinetic parameters of clot waveform of APTT using Actin FSL reagent.
| Correlations | ||||||||
| APTT (FSL) | APTT (FSL) Min1 | APTT (FSL) Min1 at | APTT (FSL) Min2 | APTT (FSL) Min2 at | APTT (FSL) max2 | APTT (FSL) max2 at | ||
| APTT (FSL) | Pearson Correlation | 1 | -.276* | .999** | -.404** | .994** | -.512** | .999** |
| Sig. (1-tailed) | .030 | .000 | .002 | .000 | .000 | .000 | ||
| APTT (FSL) Min1 | Pearson Correlation | -.276* | 1 | -.279* | .979** | -.282* | .938** | -.281* |
| Sig. (1-tailed) | .030 | .029 | .000 | .027 | .000 | .028 | ||
| APTT (FSL) Min1 at | Pearson Correlation | .999** | -.279* | 1 | -.403** | .997** | -.507** | .998** |
| Sig. (1-tailed) | .000 | .029 | .002 | .000 | .000 | .000 | ||
| APTT (FSL) Min2 | Pearson Correlation | -.404** | .979** | -.403** | 1 | -.401** | .982** | -.410** |
| Sig. (1-tailed) | .002 | .000 | .002 | .003 | .000 | .002 | ||
| APTT (FSL) Min2 at | Pearson Correlation | .994** | -.282* | .997** | -.401** | 1 | -.501** | .990** |
| Sig. (1-tailed) | .000 | .027 | .000 | .003 | .000 | .000 | ||
| APTT (FSL) max2 | Pearson Correlation | -.512** | .938** | -.507** | .982** | -.501** | 1 | -.515** |
| Sig. (1-tailed) | .000 | .000 | .000 | .000 | .000 | .000 | ||
| APTT (FSL) max2 at | Pearson Correlation | .999** | -.281* | .998** | -.410** | .990** | -.515** | 1 |
| Sig. (1-tailed) | .000 | .028 | .000 | .002 | .000 | .000 | ||
| *. Correlation is significant at the 0.05 level (1-tailed). | ||||||||
| **. Correlation is significant at the 0.01 level (1-tailed). | ||||||||
The correlation trends are different for APTT using Actin FS reagents as depicted in table 4. Though the clotting time shows a negative correlation with min1, min2 & max2 but statistically significant association is seen with max2. There is a strong positive association between clotting time and Tmin1, Tmin2 and Tmax2. When APTT was assayed using Actin FS reagent similar trends are seen. Min1 shows a strong positive association with min2 & max2. Max2 is the only parameter which has a statistically significant correlation with all other clotting parameter.
Table 4: Correlation between different kinetic parameters of clot waveform of aPTT using Actin FS.
| Correlations | ||||||||
| APTT (FS) | APTT (FS) Min1 | APTT (FS) Min1 at | APTT (FS) Min2 | APTT (FS) Min2 at | APTT (FS) max2 | APTT (FS) max2 at | ||
| APTT (FS) | Pearson Correlation | 1 | -.137 | 1.000** | -.188 | .998** | -.347** | .999** |
| Sig. (1-tailed) | .182 | .000 | .105 | .000 | .009 | .000 | ||
| APTT (FS) Min1 | Pearson Correlation | -.137 | 1 | -.136 | .872** | -.138 | .772** | -.127 |
| Sig. (1-tailed) | .182 | .184 | .000 | .181 | .000 | .200 | ||
| APTT (FS) Min1 at | Pearson Correlation | 1.000** | -.136 | 1 | -.186 | .999** | -.347** | .999** |
| Sig. (1-tailed) | .000 | .184 | .108 | .000 | .009 | .000 | ||
| APTT (FS) Min2 | Pearson Correlation | -.188 | .872** | -.186 | 1 | -.183 | .704** | -.185 |
| Sig. (1-tailed) | .105 | .000 | .108 | .112 | .000 | .109 | ||
| APTT (FS) Min2 at | Pearson Correlation | .998** | -.138 | .999** | -.183 | 1 | -.348** | .996** |
| Sig. (1-tailed) | .000 | .181 | .000 | .112 | .009 | .000 | ||
| APTT (FS) max2 | Pearson Correlation | -.347** | .772** | -.347** | .704** | -.348** | 1 | -.337* |
| Sig. (1-tailed) | .009 | .000 | .009 | .000 | .009 | .011 | ||
| APTT (FS) max2 at | Pearson Correlation | .999** | -.127 | .999** | -.185 | .996** | -.337* | 1 |
| Sig. (1-tailed) | .000 | .200 | .000 | .109 | .000 | .011 | ||
| **. Correlation is significant at the 0.01 level (1-tailed). | ||||||||
| *. Correlation is significant at the 0.05 level (1-tailed). | ||||||||
The correlation among different parameters of thrombin time CWA is shown in table 5. There is significant correlation among all parameters except min1 vs Tmin2. The clotting time is inversely related to min1, min2 and max2. There is a strong positive association between TT and Tmin1, Tmin2, Tmax2. Similarly, strong positive association is observed between min1, min2 and max2 whereas they are negatively correlated with Tmin1, Tmin2 and Tmax2.
Table 5: Correlation between different kinetic parameters of clot waveform of TT.
| Correlations | ||||||||
| TT | TT Min1 | TT Min1 at | TT Min2 | TT Min2 at | TT max2 | TT max2 at | ||
| TT | Pearson Correlation | 1 | -.632** | .935** | -.638** | .866** | -.603** | .994** |
| Sig. (1-tailed) | .000 | .000 | .000 | .000 | .000 | .000 | ||
| TT Min1 | Pearson Correlation | -.632** | 1 | -.394** | .995** | -.226 | .907** | -.663** |
| Sig. (1-tailed) | .000 | .003 | .000 | .065 | .000 | .000 | ||
| TT Min1 at | Pearson Correlation | .935** | -.394** | 1 | -.417** | .974** | -.411** | .925** |
| Sig. (1-tailed) | .000 | .003 | .002 | .000 | .002 | .000 | ||
| TT Min2 | Pearson Correlation | -.638** | .995** | -.417** | 1 | -.247* | .913** | -.665** |
| Sig. (1-tailed) | .000 | .000 | .002 | .049 | .000 | .000 | ||
| TT Min2 at | Pearson Correlation | .866** | -.226 | .974** | -.247* | 1 | -.259* | .852** |
| Sig. (1-tailed) | .000 | .065 | .000 | .049 | .041 | .000 | ||
| TT max2 | Pearson Correlation | -.603** | .907** | -.411** | .913** | -.259* | 1 | -.621** |
| Sig. (1-tailed) | .000 | .000 | .002 | .000 | .041 | .000 | ||
| TT max2 at | Pearson Correlation | .994** | -.663** | .925** | -.665** | .852** | -.621** | 1 |
| Sig. (1-tailed) | .000 | .000 | .000 | .000 | .000 | .000 | ||
| **. Correlation is significant at the 0.01 level (1-tailed). | ||||||||
| *. Correlation is significant at the 0.05 level (1-tailed). | ||||||||
Discussion
Hemostasis is a very complex process which involves adhesion of platelets to damaged endothelium, platelet activation, platelet aggregation, fibrin clot formation, fibrin stabilization and ends with fibrinolysis. The whole process is exposed in vivo to high shear stress due to circulating blood and controlled by factors released from the surrounding endothelium. There are different assays which can detect defect of different steps, e.g. Platelet aggregometry for platelet function, PT for extrinsic pathway or combined pathway defect, APTT for intrinsic or combined pathway defect etc. But an ideal hemostasis assay should preferably measure all these processes in real time based on which Global Hemostasis assays are conceptualized. Thromboelastography (TEG), Rotational thromboelastometry (ROTEM) and Thrombinoscope measuring thrombin generation are the examples of different global haemostasis assays. Though, no assays are available till date which can cover all functions of the haemostatic process, still the objective of these assays are to create sufficient evidence for the clinical condition and guide appropriate therapy. 12 Each assay comes with its pros and cons. Many of these technologies are expensive and not widely available. Instead, automated coagulation analyzers are widely available and PT, APTT are the widely used clotting screening assays. These analyzers can generate additional information during the process of clot formation and is presented as a waveform which can assess the entire clotting process in a more physiological and holistic manner. And thus CWA can be used as a cost effective and widely available platform for global hemostasis assay.13
There are very few studies where the normal kinetics has been studied. It has been recommended that laboratory, instrument and reagent specific reference interval should be established by each laboratory for clinical use.14 The clot waveform analysis is used mostly for research only and it is required to determine the normal kinetics of clot waveform based on technology and reagent for better clinical interpretation. Though 120 samples need to be screened for establishing the reference interval, we could analyze total 47 normal samples with our limited resources. This is one of the few studies where normal kinetics of CWA is determined for the entire major clotting screening assay – PT, aPTT& TT. For aPTT we have selected 2 reagents Actin FS & Actin FSL. Actin FS is a coagulation factor sensitive and lupus insensitive reagent whereas Actin FSL is both coagulation factor sensitive and lupus sensitive reagent.15
The normal kinetics is derived from the analysis and the reference intervals are mentioned in the table 1. We didn’t find many studies to in English literature to for comparison. The study performed by Tan et.al. showed comparable reference interval for aPTT clot waveform kinetics where they have used Sysmex CS2100i automated coagulometer using Actin FSL reagent. The observed reference ranges were APTT 26 – 32 s, min1 3.12 – 6.87 %/s, min2 0.51 – 1.05 %/s2, max2 0.40 – 0.91 %/ s2 respectively.16 Our findings are APTT 26.2-34.5s, min1 2.73-6.17 %/s, min2 0.41-0.95%/s2, max2 0.30-0.77 %/ s2 respectively.
The correlation analysis showed mostly a common relationship between the clotting time and the clot waveform characteristics. The lower clotting times show a higher maximum velocity, maximum acceleration & maximum deceleration though the strength of relationship is weak to moderate. It indicates that multiple factors are responsible in the clotting process. On the contrary, we observed a strong positive correlation between clotting time and time required to achieve maximum velocity, acceleration or deceleration. Following the normal rules of kinetics, maximum acceleration precedes achieving maximum velocity and the process slows down and maximum deceleration is achieved only after 50% of clot is being formed and gradually post-coagulation plateau is achieved. Thus pre-coagulation, coagulation and post-coagulation kinetics are better understood.
Conclusion
Understanding the normal kinetics of clot waveform and establishing the reference interval based on the method and reagent can be useful in the objective assessment of patient samples and clinical interpretation. Studies involving higher number of normal samples as recommended by CLSI guideline using different platforms can be of immense value.
Acknowledgments
We acknowledge the administrative support extended by our institution to carry out the study. We are thankful to our technical staffs – Prittam Priyadarshan, Pabitra Mohan Mohanty & Manoranjan Mohapatra who have helped in carrying out the study.
Conflict of Interest
All authors declare there is no conflict of interest among themselves.
Funding Source
There is no funding sources.
References
- “WFH eLearning Platform – Diagnosis of Hemophilia and Other Bleeding Disorders: A Laboratory Manual.” https://elearning.wfh.org/resource/diagnosis-of-hemophilia-and-other-bleeding-disorders-a-laboratory-manual/ (accessed Aug. 04, 2020).
- Sevenet P. O, and Depasse F. Clot waveform analysis: where do we stand in 2017?. Int. J. Lab. Hematol. 2017 ; 39(6): 561-8.
CrossRef - Braun P. J, Givens T. B, Stead A. G, Beck L. R, Gooch S. A, Swan R. J, Fischer T. J. Properties of optical data from activated partial thromboplastin time and prothrombin time assays. Thromb Haemost .1997; 78(09):1079-87.
CrossRef - Chan S, Mackenzie A, Ng D. T, Leung J. K. An evaluation of the implementation of case management in the community psychiatric nursing service. J. Adv. Nurs. 2000; 31(1): 144-56.
CrossRef - Ten Cate H. The biphasic waveform in plasma: identifying the sepsis–coagulation crossroad? A reply to a rebuttal. J.Thromb.Haemost.. 2005 ; 3(3): 605-6.
CrossRef - Shima M, Matsumoto T, Fukuda K, Kubota Y, Tanaka I, Nishiya K, Giles AR, Yoshioka A. The utility of activated partial thromboplastin time (aPTT) clot waveform analysis in the investigation of hemophilia A patients with very low levels of factor VIII activity (FVIII: C). Thromb Haemost. 2002; 87(03): 436-41.
CrossRef - Redfearn D. P, Trim G. M, Skanes A. C, Petrellis B, Krahn A. D, Yee R, Klein G. J. Esophageal temperature monitoring during radiofrequency ablation of atrial fibrillation. J. Cardiovasc. Electrophysiol 2005 ;16(6): 589-93.
CrossRef - Shima M, Matsumoto T, Ogiwara K. New assays for monitoring haemophilia treatment. Haemophilia. 2008;14: 83-92.
CrossRef - Ruberto M. F, Marongiu F, Sorbello O, Civolani A, Demelia L, Barcellona D. Are prothrombin time and clot waveform analysis useful in detecting a bleeding risk in liver cirrhosis?. Int. J. Lab. Hematol. 2019 Feb;41(1):118-23.
CrossRef - Ruberto MF, Marongiu F, Sorbello O, Civolani A, Demelia L, Barcellona D. Are prothrombin time and clot waveform analysis useful in detecting a bleeding risk in liver cirrhosis?. Int. J. Lab. Hematol. 2019;41(1):118-23.
CrossRef - Evrard J, Siriez R, Morimont L, Thémans P, Laloy J, Bouvy C, Gheldof D, Mullier F, Dogné JM, Douxfils J. Optimal wavelength for the clot waveform analysis: determination of the best resolution with minimal interference of the reagents Int. J. Lab. Hematol. 2019; 41(3): 316-24.
CrossRef - Tynngård N, Lindahl TL, Ramström S. Assays of different aspects of haemostasis–what do they measure?. Thromb.J. 2015;13(1):1-0.
CrossRef - Nair SC, Dargaud Y, Chitlur M, Srivastava A. Tests of global haemostasis and their applications in bleeding disorders. Haemophilia. 2010 ; 16: 85-92.
CrossRef - Castellone D.D. Establishing reference intervals in the coagulation laboratory. Int. J. Lab. Hematol. 2017; 39: 121-7.
CrossRef - Armstrong N. C, Ernst. E. The treatment of eczema with Chinese herbs: a systematic review of randomized clinical trials. Br. J. Clin. Pharmacol. 1999; 48(2): 262.
CrossRef - Wen T. C, Cheen M. H, Wong W. H, Wu I. Q, Chua B. L, Ahamedulla S. H, Lee L. H, Ng H. J. Elevated activated partial thromboplastin time-based clot waveform analysis markers have strong positive association with acute venous thromboembolism. Biochem Med. 2019; 29(2): 385-93.
CrossRef

