
Manuscript accepted on :27-09-2022
Published online on: 07-10-2022
Plagiarism Check: Yes
Reviewed by: Dr. Shaimaa Bebars
Second Review by: Umargani Jamal mohamed
Final Approval by: Dr. H Fai Poon
Anurag Sharma1* and Komal2
1Department of Statistics, Ram Lal Anand College, University of Delhi, Delhi, India.
2Department of Statistics, PGDAV College, University of Delhi, Delhi - 110007, India.
Corresponding Author E-mail: anuragsharma532@gmail.com
DOI : https://dx.doi.org/10.13005/bpj/2524
Abstract
In clinical practice, survival curves show the fraction of patients who experienced the outcome of interest. Survival rates are estimated using survival curves which are determined using Kaplan- Meier method. However, when in case of large number of censored observations, Kaplan- Meier method tends to provide biased estimates. This research article compares widely used Kaplan-Meier (K-M) method & Weighted Kaplan-Meier (WKM) method as a suitable substitute of KM while dealing with the issue of heavy-censoring by applying them on real life data of 900 Cervix Cancer patients diagnosed and treated during 2012-2018 at Rajiv Gandhi Cancer Institute and Research Center, Delhi are analyzed. Then, Five year survival rate of the patients is estimated by using K-M and WKM methods. It was observed that out of 900, 547 (60.78%) patients experienced the event till last follow up and rest of the patients (39.22%) patients were censored of which 187 are lost to follow up and 166 are alive. Median survival time is found to be 65.33 months. Subsequently, 1 year, 2 year, 3 year, 4 year and 5 year survival rates are found to be 81%, 66%, 47%, 33% and 21% respectively by K-M whereas they are found to be 78%, 63%, 63%, 44%, 29% and 19% by WKM. The result of this study shows that in absence of censoring assumption of Kaplan- Meier, Kaplan-Meier method gives biased survival estimations. These estimates are higher than the real estimates. In such cases, Bias can be decreased by using WKM which gives suitable weights to the observations and results in precise understanding.
Keywords
Censoring; Cervix Cancer; Kaplan Meier; Survival Rates
Download this article as:| Copy the following to cite this article: Sharma A, Komal K. Survival Rate Estimation of Cervix Cancer Patients Using K-M and W-K-M. Biomed Pharmacol J 2022;15(4). |
| Copy the following to cite this URL: Sharma A, Komal K. Survival Rate Estimation of Cervix Cancer Patients Using K-M and W-K-M. Biomed Pharmacol J 2022;15(4). Available from: https://bit.ly/3Md6Wqa |
Introduction
In oncology, longer overall survival is considered as the gold standard among efficacy end points for the treatment of cervix cancer patients. A lot of methods have been proposed for the estimation of survival rates of which Kaplan-Meier method is the oldest and non parametric method. However, one of the major drawbacks of Kaplan- Meier is that it is seriously influenced by censoring assumption which means that some observations may have incomplete information because the outcome of interest may not be experienced by patients till the completion of the study1. In these scenarios, survival time is said to be censored survival time as patient’s actual survival time will be higher than the calculated ones2.
Censoring causes serious implication to the data. For instance, a study with a large number of censored events may have to be terminated. These censored events occur due to large number of follow up cases which have been lost, alternative outcome than the event of interest and withdrawal from the study.
These censored observations may result in less patients/subjects at risk at different time-points, & the estimates of survival times produced by Kaplan Meier method wouldn’t be dependable anymore. Such high levels of censored events results in multiple problems in the analysis of the data. These problems mainly include:-
Quick end which means that most of the patients did not experience the event till completion of the study.
Censoring also returns in removal of a lot of patients from the data3.
Hence, a large number of censored observations may result in erroneous and higher survival estimations than their exact estimates. Unfortunately, no appropriate test is available to determine the viability of the censoring assumption. This is only a judgment made by scientists/statisticians. A method is also presented by Jan et al., namely Weighted Kaplan-Meier (WKM) where they use modified Kaplan- Meier to analyze the survival data4,5. They showed that in case of high number of censored observations (27% in their research study), WKM was found to give better survival estimates than KM method. Shafiq et al. and Huang also presented other methods to resolve the issues of K-M unreliable estimations4–7.
Ramadurai et al., also investigated procedures & methods proposed for estimation of survival function. They showed that WK-M is an appropriate method for estimation of survival probability8.
Therefore, this study aims to compare the Kaplan Meier and Weighted Kaplan Meier method by determining the five year survival rate of cervix cancer patients who underwent treatment at the Rajiv Gandhi Cancer Institute and Research Center in India using the Kaplan-Meier and Weighted Kaplan-Meier in case of high censored data.
Materials and Methods
900 patients diagnosed with Cervix cancer and satisfying following inclusion criteria are included: 1) patients hospitalized and diagnosed during 2012- 2019 in Rajiv Gandhi Cancer Institute and Research Center. 2) Patients with available addresses & phone numbers available for follow-ups. The survival time is defined as the duration from the date of diagnosis to the date of death/last contact and lost to follow up. Patients who are alive at the completion of study or those who were not reachable during the call were censored.
Survival Analysis
Survival is defined as the state of continuing to exist or live, customarily in spite of an ordeal, accident, or difficult circumstances9 or the act of living longer than another person or thing10. In medical science, survival is defined as the period of time that a patient lives after getting diagnosed with a specific disease11. These survival statistics help the doctors in estimating the prognosis of the patient and in evaluating treatment options. Medical data comprising patients’ survival are known as survival data. Survival Analysis a branch of biostatistics which deals with the statistical analysis when outcome of interest is the time till the occurrence of an interested event. The event may be death, disease incidence, recovery or any designated experience of interest that may happen to an individual in clinical trials12–18. It is used in a number of fields to analyze data which involves the duration between two outcomes of interest19.
Some examples of Survival analysis’ problems include “the study of leukemia patients in remission over several weeks to see how long they stay in remission” or “how long patients survive after receiving a hair transplant”. So, survival analysis deals with survival data derived from clinical, epidemiologic, laboratory studies involving animals and humans and other suitable applications, medicine, public health, social science, engineering etc. So, it may be defined as a collection of different statistical procedures for analysis for which the interested outcome variable is the “time until an event occurs”.
Many non-parametric methods have been proposed for analyzing survival data. One such method is actuarial or life table method. The life table method was proposed by Berkson and Gage to study the survival in cancer20. This method is the oldest & straight forward methods. Another such method is Kaplan Meier method. In this method, the survival function is computed using a product limit formula. Kaplan- Meier method is one of the most common used method to analyze survival data.
Survival data includes the presence of truncated & censored observations. While dealing with a data involving heavy censoring, estimates obtained by K-M (1958) estimate is not accurate and thus it over estimates the survival probabilities (Susan, 2001). Also, survival curve obtained by Kaplan-Meier doesn’t give reliable estimates21. In such cases, Weighted Kaplan-Meier method of estimation were applied as a substitute of K-M survival function6.
Censoring
Censoring is divided into two main categories: Informative censoring and non- informative censoring. In this article, we have considered informative censoring only. Some important types of censoring are Type I censoring, Type II censoring, Interval censoring and random censoring14,16. Type I and Type II are single censored data whereas Type III is random censored data22.
Kaplan-Meier (K-M) and Weighted Kaplan-Meier (WK-M) were used for the estimation of overall survival rate.
Let n =Total number of participants in the research study,
t1,t2,……,tn=Patients’ observed times.
The survival time of some of these patients may have been censored.
Let us assume that r= Number of focused outcomes where r≤n and
t(1),t(2),……,t(r)= Patients’ ordered event times.
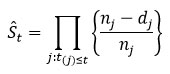
t(j)= Number of patients survived before t(j)
dj=Number of patients experiencing the outcome at t(j)
Then, S ̂t is defined as:
To calculate the Weighted Kaplan-Meier survival estimates, a method presented by Jan et al., was used4,5. They proved that in case of high number of censored observations, K-M estimation might give inaccurate and inefficient results. Let us assume that
cj = number of censored patients at t_((j)) and
wj = weights of censored observations.
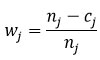
If t(j) is an event-time, w_j=1, and
if t(j) is the censored time then wj lies between 0 and 1.
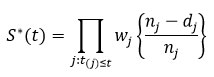
Then, the Weighted Kaplan Meier estimation method is defined as follows
This formula solves the problem of overestimation by providing proper weighing to censored observations.
Results:-
A total of 900 patients who were diagnosed with Cervix cancer during the year 2012-2019 at RGCIRC were taken in this study. The mean age of the patients was 53.92±10.58 years. Majority of the patients are found to be diagnosed with stage II (36.56%) followed by stage III and I (28.33% and 28.22%) respectively. Maximum of the patients are observed with Squamos Cell Carcinoma (84.33%). 29% of the patients are present with co-morbidities. Table 1 shows the baseline characteristics of the patients.
Table 1: Baseline characteristics of patients included in the study.
| Variables | Frequency(%) | |
| Age (Mean±S.D) | 53.92±10.58 | |
| Stage | I | 254(28.22) |
| II | 329(36.56) | |
| III | 255(28.33) | |
| IV | 62(6.89) | |
| Histology | Squamous Cell Carcinoma | 759(84.33) |
| Adenocarcinoma | 68(7.56) | |
| Others | 73(8.11) | |
| Comorbidities | Yes | 261(29.0) |
| No | 639(71.0) | |
| Chemotherapy | Yes | 107(11.89) |
| No | 793(88.11) | |
| Surgery | Yes | 445(49.44) |
| No | 455(50.56) | |
| Radiotherapy | Yes | 206(22.89) |
| No | 694(77.11) | |
Survival rates are calculated using both the methods. Table 2 presents the year wise survival rates along with the standard error and 95% confidence interval. Estimations based on Kaplan Meier method are 0.81 (0.0241), 0.66 (0.0253), 0.47 (0.0291), 0.33 (0.0288), and 0.21 (0.0274) months and the estimations determined using the WK-M are 0.78 (0.0197), 0.63 (0.0201), 0.44 (0.0215), 0.29 (0.0209), and 0.19 (0.0195) months, respectively. It is noted that WK-M presents better survival estimations (shorter confidence intervals & lower standard errors) as compared to Kaplan- Meier method. Survival probabilities are also derived using both the methods are shown in Figure 1.
As Figure 1 shows, the survival estimations obtained using discussed methods are very close with each other at the starting time points when the censoring rate was paltry. However, as censoring rate increases & time passes, Kaplan-Meier method gives higher estimations of survival rates whereas WK-M gives precise survival time estimates of patients by giving suitable weights to censored observations.
Kaplan Meier gives five year survival estimates as 21% where as weighted Kaplan Meier gives the 5 year survival estimates as 19%. These high estimates of survival rates are not unexpected as the standard method to estimate survival probabilities- Kaplan Meier gets severely affected by the high number of censored observations which causes biased estimations in the study. Therefore, Kaplan- Meier gives biased estimations in case of high number of censored observations. Sadly, no test is present for researchers to examine the assumption of censoring except the researcher’s judgment.
Table 2: Five year survival rate estimation and 95% C.I by Kaplan Meier and Weighted Kaplan Meier.
| Kaplan Meier Estimations (SE) | Weighted- Kaplan Meier Estimations (SE) | 95% CI KM | 95% CI W-KM | |
| 1 year | 0.81 (0.0241) | 0.78 (0.0197) | 0.54-0.94 | 0.59-0.85 |
| 2 year | 0.66 (0.0253) | 0.63 (0.0201) | 0.49-0.88 | 0.43-0.76 |
| 3 year | 0.47 (0.0291) | 0.44 (0.0215) | 0.41-0.73 | 0.37-0.61 |
| 4 year | 0.33 (0.0288) | 0.29 (0.0209) | 0.26-0.55 | 0.23-0.41 |
| 5 year | 0.21 (0.0274) | 0.19 (0.0195) | 0.17-0.39 | 0.15-0.33 |
However, generalizing Kaplan- Meier method using proper weights might result in better survival estimates at any time. Figure 1 show that at the start of the study when the censoring rate is low, both the methods give near identical results. However, as the time goes, and the censoring rate increases, the difference between the survivals estimates of both the methods increases. Table 1 shows the comparison of the survival estimates obtained by Kaplan- Meier and Weighted Kaplan- Meier. It is found that that estimates obtained using WK-M had shorter C.I and lower S.E. It is reported that a more precise analysis can be conducted on them. One more problem with Kaplan- Meier survival curve is that after the time for last censored observation, survival function is indefinable. Weighted Kaplan Meier survival curve reaches the horizontal axis even in case of last censored observation.
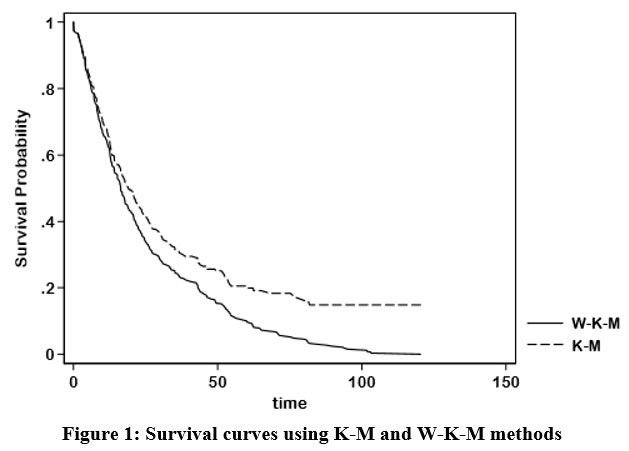 |
Figure 1: Survival curves using K-M and W-K-M methods. |
Conclusion
This article is aims at comparing Kaplan-Meier method and Weighted Kaplan-Meier method as a possible suitable technique while dealing with the issue of heavy-censoring. Data of 900 Cervix Cancer patients who underwent treatment at Rajiv Gandhi Cancer Institute and Research Center from 2012-2018 were analyzed. Survival probabilities of the patients were calculated using Kaplan- Meier and Weighted Kaplan- Meier methods. It was found that Weighted Kaplan Meier provides better survival estimates as compared to the commonly used Kaplan- Meier method. Therefore, it can be inferred that in the case of high censoring, K–M is severely affected by the censoring assumption, which causes biased estimations in the results of the study. Therefore, high censoring levels affect the accuracy and reliability of estimates obtained by K–M. In such cases, the weighted K–M method is an ideal alternative. Weighted K–M uses appropriate weights and reduces the bias in censored time points and thus resolves the issue of overestimation. In such cases, Weighted Kaplan-Meier has proved to be a better alternative of the Kaplan- Meier method. It appropriate weights to the censored observation which reduces the bias in survival estimates at censored time-points. It solves the overestimation problem. Moreover, there is a need for more research on alternative methods when the study is teemed with censored observations.
Acknowledgement
None
Conflict of Interest
The authors declare no conflict of interest.
Funding Source
This study is not funded by any funding agency.
References
- Mehta A, Sharma A. Basics of survival statistics for oncologists. J Curr Oncol. 2021;4(1):13-21. doi:10.4103/jco.jco_8_21
CrossRef - Young KD, Menegazzi JJ, Lewis RJ. Statistical methodology: IX. Survival analysis. Acad Emerg Med. 1999;6(3):244-249.
CrossRef - Damuzzo V, Agnoletto L, Leonardi L, Chiumente M, Mengato D, Messori A. Analysis of survival curves: statistical methods accounting for the presence of long-term survivors. Front Oncol. Published online 2019:453.
CrossRef - Jan B, Shah SWA, Shah S, Qadir MF. Weighted Kaplan Meier estimation of survival function in heavy censoring. PAKISTAN J Stat Ser. 2005;21(1):55.
- Jan B. Improved Inferences in the context of Survival/Failure Time [Dissertation]. Peshawar Univ, Pakistan. Published online 2004.
- Huang ML. A weighted estimation method for survival function. App Math Sci. 2008;2(16):753-762.
- Shafiq M, Shah S, Alamgir M. Modified Weighted Kaplan-Meier Estimator. Pakistan J Stat Oper Res. Published online 2007:39-44.
CrossRef - Ramadurai M, Ponnuraja C. Non-parametric estimation of the survival probability of children affected by TB meningitis. Res World. 2011;2(2):216.
- Definition of survival [online]. Accessed September 14, 2022. https://www.lexico.com/definition/wake
- Survival.2021. In Merriam-Webster.com. Accessed September 14, 2022. https://www.merriam-webster.com/dictionary/survival
- Survival.2021. In medical-dictionary.com.. Accessed September 14, 2022. https://medical-dictionary.thefreedictionary.com/survival
- Cox DR, Snell EJ. A general definition of residuals. J R Stat Soc Ser B. 1968;30(2):248-265.
CrossRef - Crowley J, Hu M. Covariance analysis of heart transplant survival data. J Am Stat Assoc. 1977;72(357):27-36.
CrossRef - Kalbfleisch JD, Prentice RL. Survival models and data analysis. Published online 1980.
- Lawless JF. Statistical Models and Methods for Lifetime Data. Vol 362. John Wiley & Sons; 2011.
- Cox DR, Oakes D. Analysis of Survival Data. Vol 21. CRC Press; 1984.
- Makridakis S, Hibon M. ARMA models and the Box–Jenkins methodology. J Forecast. 1997;16(3):147-163.
CrossRef - Hair JF, Black WC, Babin BJ, Anderson RE, Tatham RL. Multivariate data analysis 6th Edition. Pearson Prentice Hall New Jersey humans Crit Reformul J Abnorm Psychol. 2006;87:49-74.
- Hosmer Jr DW, Lemeshow S. Applied Survival Analysis: Time-to-Event. Vol 317. Wiley-Interscience; 1999.
- Berkson J, Gage RP. Survival curve for cancer patients following treatment. J Am Stat Assoc. 1952;47(259):501-515.
CrossRef - Murray S. Using Weighted Kaplan‐Meier Statistics in Nonparametric Comparisons of Paired Censored Survival Outcomes. Biometrics. 2001;57(2):361-368.
CrossRef - Cohen AC. Maximum likelihood estimation in the Weibull distribution based on complete and on censored samples. Technometrics. 1965;7(4):579-588.
CrossRef

