


Introduction
Biological molecules are structurally damaged when they are irradiated by electrons during electron microscopy. Embedding the samples in ice and imaging them at low temperatures suppresses the damage (Taylor and Glaeser, Reference Taylor and Glaeser1976; Hayward and Glaeser, Reference Hayward and Glaeser1979). Plunge-freezing thin layers of aqueous suspensions of proteins in liquid ethane embeds the proteins in vitreous ice (Adrian et al., Reference Adrian, Dubochet, Lepault and McDowall1984). This requires rapid cooling of the suspensions. Therefore, it has been recommended that the temperature should be maintained just above the melting point of liquid ethane at −183 °C (Passmore and Russo, Reference Passmore and Russo2016) to provide the highest cooling rate.
During cryo-electron microcopy (cryo-EM) imaging of proteins embedded in vitreous ice, beam-induced motion (BIM) occurs with high-energy electrons (Henderson et al., Reference Henderson, Chen, Chen, Grigorieff, Passmore, Ciccarelli, Rubinstein, Crowther, Stewart and Rosenthal2011; Brilot et al., Reference Brilot, Chen, Cheng, Pan, Harrison, Potter, Carragher, Henderson and Grigorieff2012; Campbell et al., Reference Campbell, Cheng, Brilot, Moeller, Lyumkis, Veesler, Pan, Harrison, Potter, Carragher and Grigorieff2012). BIM is characterised by an initial rapid ‘burst’ phase (first 3–5 e−/Å2), followed by a slower phase (Glaeser, Reference Glaeser2016; Ripstein and Rubinstein, Reference Ripstein and Rubinstein2016). BIM blurs the cryo-EM images, which reduces the resolution of the reconstruction. Using the movie mode of a direct detector device for imaging, a significant proportion of the BIM in the slower phase can be corrected by translational alignment of the movie frames (Campbell et al., Reference Campbell, Cheng, Brilot, Moeller, Lyumkis, Veesler, Pan, Harrison, Potter, Carragher and Grigorieff2012; Rubinstein and Brubaker, Reference Rubinstein and Brubaker2015; Zheng et al., Reference Zheng, Palovcak, Armache, Verba, Cheng and Agard2017; Zivanov et al., Reference Zivanov, Nakane and Scheres2019). However, the initial rapid burst motion cannot be effectively corrected with current software. Therefore, the initial frames remain blurred, which, unfortunately, contain the most structural information on the target proteins with the least amount of radiation damage. This is considered a key outstanding problem in cryo-EM (Vinothkumar and Henderson, Reference Vinothkumar and Henderson2016; Henderson and Russo, Reference Henderson and Russo2019), and frames that exhibit the effects of the rapid ‘burst’ phase are either excluded or down-weighted during data processing. In addition, it has been observed that electron bombardment of a cryo-EM sample caused drum-like motion (Brilot et al., Reference Brilot, Chen, Cheng, Pan, Harrison, Potter, Carragher, Henderson and Grigorieff2012). This caused both translational and rotational motion of a protein (Henderson et al., Reference Henderson, Chen, Chen, Grigorieff, Passmore, Ciccarelli, Rubinstein, Crowther, Stewart and Rosenthal2011; Brilot et al., Reference Brilot, Chen, Cheng, Pan, Harrison, Potter, Carragher, Henderson and Grigorieff2012; Naydenova et al., Reference Naydenova, Jia and Russo2020), among which the rotational motion cannot be corrected with existing motion correction software.
It has been suggested that the electron beam releases stress in the vitreous ice, which then causes the rapid burst motion. Different hypotheses exist for the origin of the stress. The beam may cause internal pressures to build up in the ice (Glaeser, Reference Glaeser2008; Glaeser, Reference Glaeser2016). The charge from the accumulation of secondary electrons on the sample surface could also blur the images (Henderson, Reference Henderson1992; Glaeser and Downing, Reference Glaeser and Downing2004; Russo and Henderson, Reference Russo and Henderson2018). Additionally, beam-induced wrinkles in the grid carbon at low temperature may be a significant source of stress (Wright et al., Reference Wright, Iancu, Tivol and Jensen2006; Brilot et al., Reference Brilot, Chen, Cheng, Pan, Harrison, Potter, Carragher, Henderson and Grigorieff2012), which has led to improved support films (Rhinow and Kühlbrandt, Reference Rhinow and Kühlbrandt2008; Yoshioka et al., Reference Yoshioka, Carragher and Potter2010; Russo and Passmore, Reference Russo and Passmore2014a, Reference Russo and Passmore2014b; Huang et al., Reference Huang, Zhang, Wen, Chen, Li, Ji, Yin and Sun2020). The stress may also be generated during vitrification and subsequent cooling (Glaeser, Reference Glaeser2016). Thorne (Reference Thorne2020) proposed that the cooling rate of the grid bars is significantly lower than that of the aqueous solution. Therefore, when the temperature of the solution approaches that of the liquid ethane, a further decrease in the temperature of grid bar causes shrinkage and stress in the ice. Recently, Naydenova et al. (Reference Naydenova, Jia and Russo2020) improved gold film fabrication by generating nanoscale arrays of 260-nm holes. BIM is prevented because the ice in these small holes cannot be bent by stress. They proposed that rapid cooling causes compressive strain in the aqueous film. Wieferig et al. (Reference Wieferig, Mills and Kühlbrandt2021) found that an extra step of ice devitrification also reduced the rapid burst motion. Because experimental data are lacking with regard to the stress origin, it is unclear how it could be reduced.
Here, reconstructions of various samples that were frozen at different cooling rates indicate that a lower rate helps to recover the quality of the initial frames. Simple modifications to existing protocols allow plunge-freezing at the lowest cooling rate required for vitrification, which enables the initial imaging frames to be recovered.
Results
Vitreous ice on a grid frozen with a cooling-rate gradient
To prevent crystalline ice from forming in the water, a high cooling rate is required to vitrify a thin aqueous film for cryo-EM sample preparation. Crystalline ice is a stable phase with the lowest energy. Therefore, when water is frozen at a low cooling rate, the molecules have more time to migrate to equilibrium positions, which may produce less stress. However, it is challenging to measure the absolute cooling rate of a thin aqueous film. Therefore, our goal was to produce a cooling-rate gradient on the grid.
Grids generally have a thick metal grating and a nanometer-thick support film. During freezing, the grid was held by tweezers and plunged into liquid ethane. The tweezers transferred heat directly to the liquid ethane, or through the metal ring (shown in orange in Fig. 1a), which lowered the cooling rate near the tweezer tips and the metal ring (Vinothkumar and Henderson, Reference Vinothkumar and Henderson2016). The cooling rate of the aqueous film was thus higher in the region farthest from the tips and the metal ring, which led to a cooling-rate gradient on the grid. To increase the gradient, we moved the tweezers approximately 0.5 mm towards the center of grid (Fig. 1a), which increased the contact between the tweezers and the grid and led to more heat transfer from the tweezers. As a result, we repeatedly found that crystalline ice formed in the mesh surrounding the position that was originally occupied by the tips of the tweezers (shown in dark blue in Fig. 1a), even in holes that had a very thin layer of ice (Fig. 1b). The ice in the mesh ~0.7 mm away from this region and the metal ring (shown in light blue in Fig. 1a) was vitrified. Both crystalline and vitreous ice formed in the mesh between these two regions (shown in pink in Fig. 1a). We attributed crystalline ice formation to the low cooling rate. The cooling rate increased with distance from the tweezer tips or the metal ring. Therefore, in the pink region in Fig. 1a, the vitreous ice near the crystalline ice was frozen at the lower cooling rate.

Fig 1. Cooling-rate gradient for cryo-electron microscopy (EM) samples. (a) Schematic of types of ice formed on grid covered by a cooling-rate gradient. The mesh in the dark blue region contained mostly crystalline ice. The pink region contained either vitreous ice or crystalline ice, and the light blue region contained mostly vitreous ice. (b) glutamate dehydrogenase (GDH) embedded in vitreous ice and crystalline ice frozen at −183 °C.
Initial frame recovery with low-cooling-rate freezing
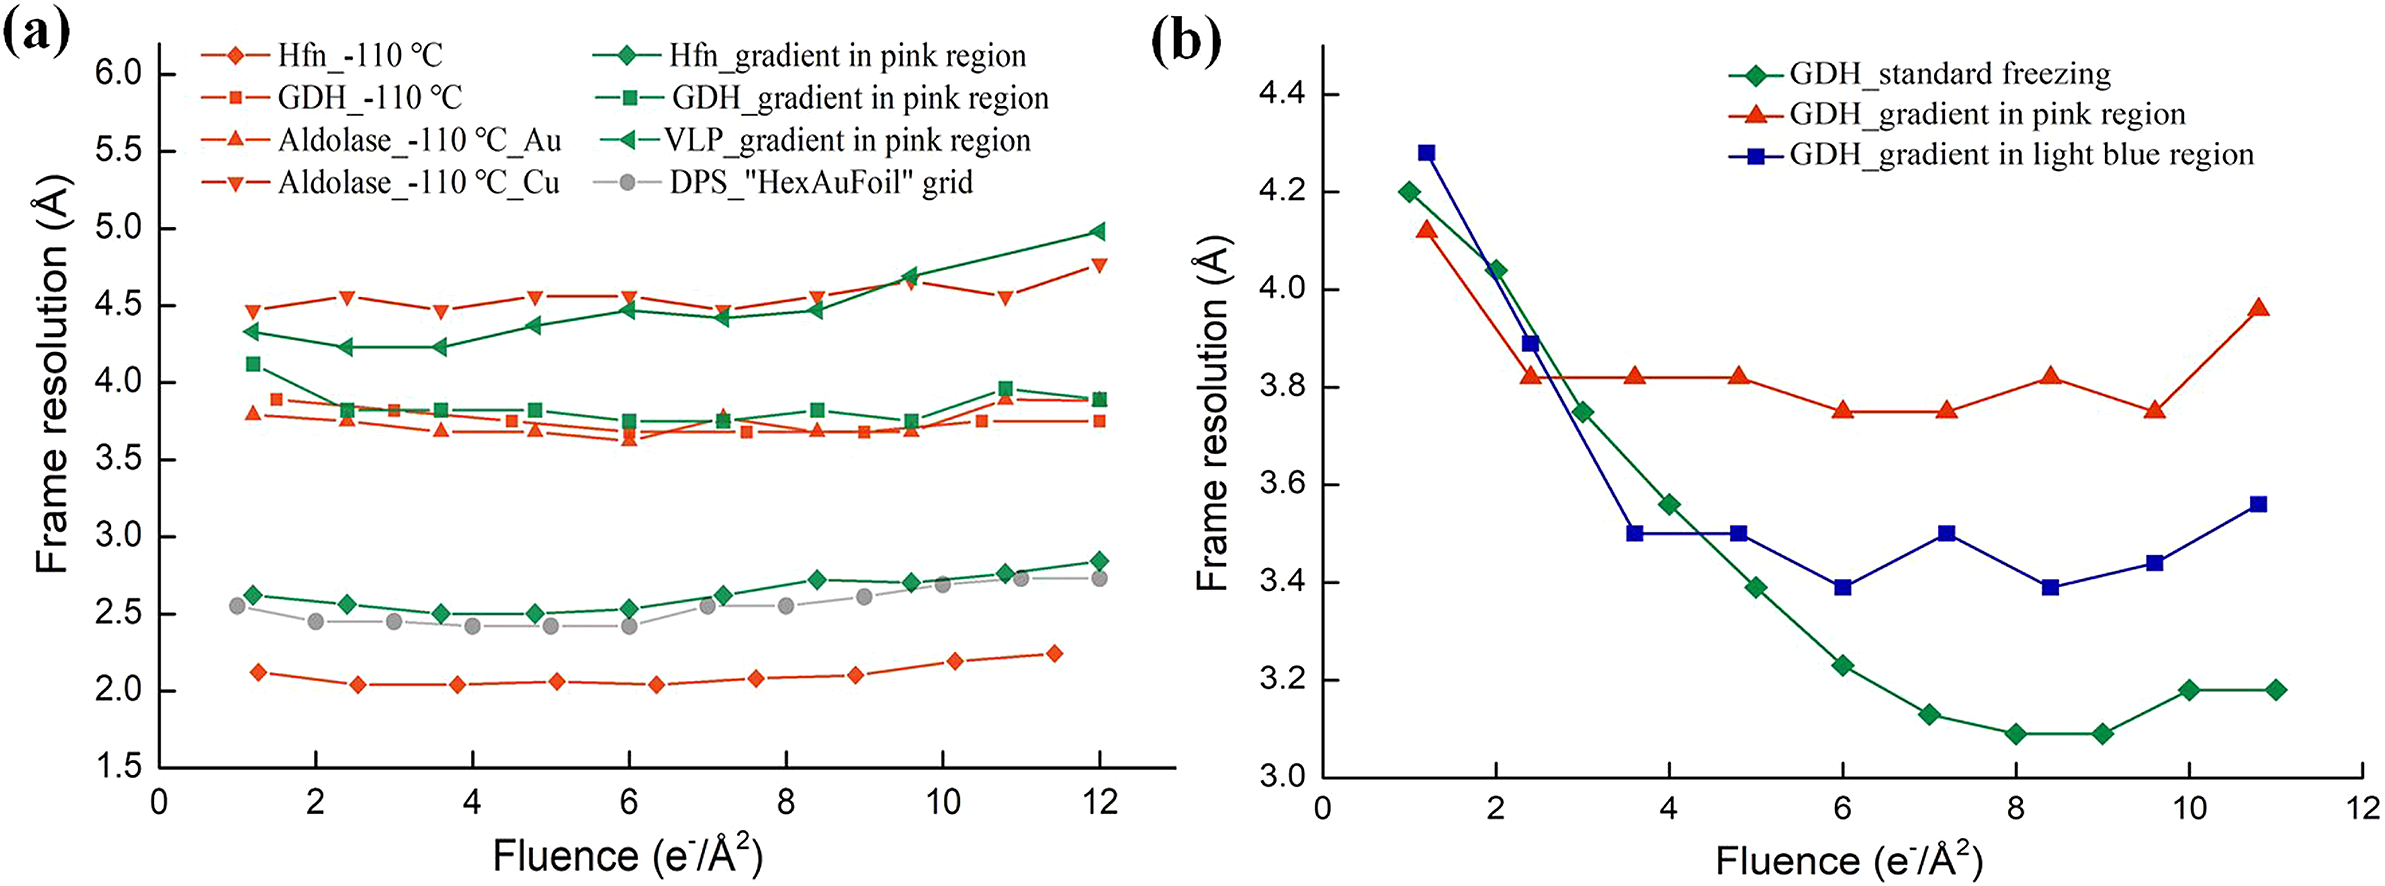
To verify whether the low cooling rate enabled recovery of the initial frames, cryo-EM datasets were acquired (Methods and Table S1) for different samples in the pink region. Samples such as apo-ferritin, glutamate dehydrogenase (GDH), and EV71 virus-like particles (VLP) were imaged with a Titan Krios electron microscope, equipped with a K2 camera for frame exposures of 1.2 e−/Å2. Micrographs of samples in vitreous and crystalline ice could be easily distinguished via Fourier transforms, because the polycrystalline ice had strong diffraction rings at approximately 1/3.6 Å−1, as shown in Fig. 1b. Micrographs of proteins in a thin layer of vitreous ice were selected for further data processing. The resolutions of the per-frame reconstructions (see Methods) were calculated for each dataset. The overall difference in resolution among these datasets was because of different numbers of particles, and was not relevant to the recovery of rapid burst motion. The effect of recovering rapid burst motion was characterised by reducing the differences in resolution between the first few frames and that of the best frame in the same dataset. As shown in Table 1, and by the green lines in Fig. 2a, the resolutions of the per-frame reconstructions from the initial frames were effectively recovered for all three samples. The first two per-frame reconstructions of VLP with 0–1.2 and 1.2–2.4 e−/Å2 exposures exhibited the best resolutions. The differences in resolution between the first and best per-frame reconstruction of apo-ferritin and GDH were 0.1 and 0.4 Å, and that between the second and best per-frame reconstruction was 0.1 and 0.1 Å, respectively (Table 1). For comparison, the resolutions of the per-frame reconstructions from the first two frames of the same samples after normal rapid freezing were ~1 Å lower than that for the best frame, as shown in Table 1 and Fig. S1a–c. Thus, the initial frames were almost fully recovered in the pink region frozen at the lower cooling rate.
Table 1. Comparisons of various samples frozen under different conditions

Abbreviations: DPS, DNA protection protein during starvation; GDH, glutamate dehydrogenase; VLP, virus-like particles.
a D is the diameter of the grid holes.
b h is the thickness of the ice.
c Au means that the aldolase was collected in holey NiTi film covered on the Au grid.
d Cu means that the aldolase was collected in holey carbon film covered on the Cu grid.
e DPS dataset was reconstructed based on the deposited maps and mask by Naydenova et al. (Reference Naydenova, Jia and Russo2020). The DPS was frozen by regular plunge-freezing at −183 °C without intentionally moving the tweezers using a grid with 260-nm-diameter holes.
f Standard means using regular freezing conditions at −183 °C, without intentionally moving the tweezers.

Fig. 2. Resolutions of per-frame reconstructions for various samples frozen at different cooling rates. (a) Resolutions of per-frame reconstructions of various samples frozen by lowering the cooling rate. The green lines are for apo-ferritin (rhombus), glutamate dehydrogenase (GDH; square) and virus-like particles (VLP; triangle) collected in the pink region marked in Fig. 1a. The red lines are for apo-ferritin (rhombus), GDH (square) and aldolase (triangle) frozen at −110 °C. Aldolase was frozen on an Au grid covered with a holey NiTi film (regular triangles), and also on a Cu grid covered with a holey carbon film (inverted triangle). The grey line shows the resolutions of downloaded per-frame reconstructions (EMD-11210) of DNA protection protein during starvation (DPS). (b) Resolutions of per-frame reconstructions of GDH datasets using a cooling-rate gradient. The green dataset was collected for a standard frozen sample formed at the highest cooling rate, the blue dataset was collected in the light-blue region in Fig. 1a, and the red dataset was collected in the pink region in Fig. 1a.
To test whether freezing at a higher cooling rate led to decreased resolution in the initial frames, we collected GDH data in the light blue region (Fig. 1a) on the same grid, with a frame exposure of 1.2 e−/Å2. Micrographs of proteins in a thin layer of vitreous ice were selected for further data processing. As shown by the blue line in Fig. 2b, the resolutions of the initial frames collected in the light blue region were not restored as well as the data collected in the pink region. However, when the data collected in the light blue region were compared with data from the sample frozen under normal freezing conditions without moving the tweezers, the differences in resolution between the initial and best per-frame reconstructions in the former were small. This indicated that the initial frames collected in the light blue region were only partially recovered.
Initial frame recovery with increased freezing temperature
In routine cryo-EM sample preparation, the freezing temperature is −183 °C to maximise the formation of vitreous ice. Higher temperatures would reduce the cooling rate (Ryan et al., Reference Ryan, Purse, Robinson and Wood1987), and may still produce vitreous ice. To determine the highest vitrification temperature for cryo-EM samples, apo-ferritin was frozen by plunging grids into liquid ethane at temperatures ranging from −90 °C to −183 °C, using automated devices (Gatan CP3). Because the tweezers were not adjusted, less heat was conducted from the tweezers to the metal ring, resulting in more homogeneous cooling rates across the grid. We used a thermocouple calibrated by measuring liquid nitrogen and the melting points of five substances at atmospheric pressure (Fig. S2) to calibrate the liquid ethane temperature in both the CP3 and EMGP plunging devices (Table S2). The experiments revealed that thin aqueous samples of apo-ferritin, GDH, aldolase and β-galactosidase were vitrified in liquid ethane at calibrated temperatures below −110 °C (Fig. S3). Most of the samples were crystalline above −110 °C.
For apo-ferritin samples frozen at −183, −150 and −110 °C, we acquired datasets with a Titan Krios microscope equipped with a K2 camera (Fig. 3a). The apo-ferritin in the three datasets was reconstructed to 2.1, 2.4 and 1.9 Å, respectively, using standard data processing via single-particle analysis (see Methods). The resolutions of the per-frame reconstructions from the three datasets are shown in Fig. 3b. At −183 °C, the resolutions of the first three per-frame reconstructions were significantly lower than those of subsequent per-frame reconstructions. This difference became smaller with increased freezing temperature. At −110 °C, the per-frame reconstruction for the second frame had the best resolution, and the resolution of the first per-frame reconstruction was slightly lower than that of the second.

Fig. 3. Effect of freezing temperature. (a) Images of apo-ferritin embedded in vitreous ice frozen at −150 and −110 °C. (b) Resolutions of per-frame reconstructions of apo-ferritin frozen at −183 °C (green), −150 °C (blue) and −110 °C (red), with exposures of 1.2, 1.2 and 1.27 e−/Å2 for each frame, respectively.
To support our observations, we collected cryo-EM datasets for GDH and aldolase on two different grids (Table 1 and Table S1) vitrified at −110 °C, with frame exposures of 1.5, 1.2 and 1.2 e−/Å2, respectively. The per-frame reconstructions are shown in Fig. 2a (red lines). As shown in Table 1, the first two frames were effectively recovered in all the datasets, which indicated that freezing at a lower cooling rate by increasing the freezing temperature restored the resolution of the initial frames. Conversely, the corresponding resolutions of per-frame reconstructions from the initial frames of samples frozen under standard freezing conditions were significantly lower than those of subsequent frames, as shown in Table 1 and Fig. S1d–f.
Benefits of recovering the initial frames
Certain protein amino-acid residues that contain carboxyl side-chain groups, solvent-exposed disulfide bonds or are part of an enzyme active site, are highly sensitive to electron damage (Weik et al., Reference Weik, Ravelli, Kryger, McSweeney, Raves, Harel, Gros, Silman, Kroon and Sussman2000; Bartesaghi et al., Reference Bartesaghi, Merk, Banerjee, Matthies, Wu, Milne and Subramaniam2015; Glaeser, Reference Glaeser2016). As shown in Fig. 4, we compared the EM map densities of site-specific amino acids in different per-frame reconstructions. Side-chain densities of damage-sensitive amino acids were well-preserved in the first two per-frame reconstructions (0–2.54 e−/Å2), but were already damaged in the fourth frame. The cumulative electron dose before acquiring the fourth frame was 3.8 e−/Å2.

Fig. 4. Maps showing the side chain densities of the initial per-frame reconstructions of apo-ferritin frozen at −110 °C.
After full frames were processed with a dose-weighting procedure in MotionCor2 (full-frames dataset), the apo-ferritin sample frozen at −110 °C had an overall resolution of 1.9 Å. To compare the quality of these reconstructions with a standard cryo-EM sample affected by rapid-burst BIM, we mimicked the data by excluding the first three frames from the dataset frozen at −110 °C during the dose-weighting procedure. For the same apo-ferritin particles, the resulting partial-frames dataset had an overall resolution of 2.0 Å. The ResLog (Stagg et al., Reference Stagg, Noble, Spilman and Chapman2014) plots from these two datasets indicated that the partial-frames dataset mimicking cryo-EM samples at −183 °C required 60% more particles to achieve the same resolution as that for the full-frames dataset acquired at −110 °C (Fig. 5). Moreover, we observed a slight improvement in the b-factor in the full-frames dataset. The full-frames dataset exhibited higher image quality than that of the partial-frames dataset because the former was averaged with three extra frames having the least amount of electron radiation damage. The higher image quality enabled a more accurate alignment in the refinement during data processing, thus improving the b-factor.

Fig. 5. ResLog plots of datasets including or excluding the first three frames. The red and blue straight lines were fit from the first five data points, and correspond to the datasets with or without the first three frames, respectively. The b-factors of the full-frames dataset and partial-frames dataset were 74.9 Å2 and 76.3 Å2, respectively. The length between the two horizontal dashed lines is 0.453, which indicates that the reconstruction of the dataset without the first three frames needed ~1.6 times particles to achieve the same resolution as that for the dataset with the first three frames.
Discussion
The −110 °C vitrification temperature differs from previous observations that cubic ice formed on microdroplets at −135 °C (Dubochet and McDowall, Reference Dubochet and McDowall1981; Dubochet et al., Reference Dubochet, Lepault, Freeman, Berriman and Homo1982). However, the 30-nm-thick aqueous layer in our experiments was much smaller than a microdroplet, which led to a much higher cooling rate that produced vitrification. It has been calculated and observed that the transition temperature from vitreous to crystalline ice for pure water is approximately −135 °C (Dowell and Rinfret, Reference Dowell and Rinfret1960; Dubochet and McDowall, Reference Dubochet and McDowall1981). However, solution components such as salts and proteins increase the glass transition temperature (Mackenzie, Reference Mackenzie1977; Gilkey and Staehelin, Reference Gilkey and Staehelin1986; Warkentin et al., Reference Warkentin, Sethna and Thorne2013; Thorne, Reference Thorne2020). Rash (Reference Rash1983) have suggested that vitrified biological samples must be kept below −100 °C to prevent changes in the physical state. Wieferig et al. (Reference Wieferig, Mills and Kühlbrandt2021) also used temperatures between −110 and −100 °C to observe a phase transition of an aqueous film from vitreous to crystalline ice.
Some of the reports on reducing BIM via freezing proteins at −110 °C have been online at BioRxiv since October 2019 (https://doi.org/10.1101/824698). Our data showed that the rapid burst motion was related with the freezing temperature, which indicates that the stress in vitreous ice caused by the rapid freezing may play important role in the rapid burst motion. Naydenova et al. (Reference Naydenova, Jia and Russo2020) proposed that rapid cooling causes compressive strain in the thin film, which agreed with our work. They showed that, using HexAuFoil grids, the quality of the first several per-frame reconstructions of a 223-kDa DNA protection protein during starvation (DPS) were recovered. We calculated the resolutions of the per-frame reconstructions based on their deposited maps and mask (EMD-11210), as shown by the grey line in Fig. 2a and in Table 1. The quality of the first frame for DPS was substantially recovered, but was still slightly worse than that of the second frame based on a 0.143 FSC criterion, as observed for other samples using our freezing methods (Fig. 2a). As shown in Table 1, the qualities of the initial frames were almost fully recovered, which indicated that both low-cooling-rate methods worked similarly to the HexAuFoil grid method.
Naydenova et al. (Reference Naydenova, Jia and Russo2020) used standard freezing conditions to vitrify the sample. To prevent bending of the ice by the stress release during imaging, they made the thickness of the ice (h), divided by the diameter (D) of the grid holes, ≥1/11. Thus, the DPS was frozen using a grid with 260-nm diameter holes. Here, where the cooling rate was lowered to reduce the stress in the ice, h/D was not limited, as shown in Table 1. Therefore, various grids with different hole sizes could be used. Using large holes during imaging prevents recording of the supporting film, which significantly improves the throughput of the data collection.
Because the cooling rates of the tweezers, grid bars and metal ring are still lower than that of aqueous film in a standard cryo-EM sample preparation, a cooling-rate gradient always occurs on the grid (Vinothkumar and Henderson, Reference Vinothkumar and Henderson2016; Thorne, Reference Thorne2020). The magnitude of the gradient depends on how much heat is transferred from the tweezers to the grid. Freezing at −183 °C with the position of the tweezers adjusted to make more contact with the grid results in a large cooling-rate gradient. Although the region with a sufficiently low cooling rate (pink region in Fig. 1a) was large enough for data collection, freezing at −110 °C enabled data collection over the whole grid. Therefore, freezing at the higher temperature is preferred. Because of errors in measuring the liquid ethane temperature when using different plunging devices, a combination of freezing at slightly lower than −110 °C, with less tweezers adjustment, may create a smaller cooling-rate gradient that enlarges the area containing rapid motion-free proteins.
Materials and methods
Protein and cryo-EM sample preparation
Human apo-ferritin was diluted to a concentration of ~2 mg/ml and purified according to previous reports (Fan et al., Reference Fan, Cao, Pan, Lu, Yang, Feng, Song, Liang and Yan2012; Jiang et al., Reference Jiang, Chen, Sun, Chen, Yin, Jin, Mi, Ma, Yang, Yan and Fan2020). The apo-ferritin proteins were expressed in Escherichia coli, where they self-assembled into a 24-subunit nanocage. They were purified via size-exclusion chromatography on a Sepharose 6 PG XK 16/70 column from GE Healthcare (Livonia, MI, USA), followed by ion-exchange chromatography on a Q-Sepharose Fast Flow from GE Healthcare (Livonia, MI, USA). The apo-ferritin concentration was determined in triplicate with a BCA protein assay kit (Pierce) form Thermo Fisher Scientific (Portage, MI, USA), using bovine serum albumin as the standard. The GDH from Sigma-Aldrich (Milwaukee, WI, USA) was dialysed in 100-mM potassium phosphate (pH 6.8) overnight prior to purification via gel filtration. The GDH concentration in the cryo-EM samples was ~3 mg/ml. Aldolase was purchased from Sigma-Aldrich (Milwaukee, WI, USA) and solubilised in 20-mM HEPES at pH 7.5 and 50-mM NaCl. It was then purified via gel filtration using a Superdex 200 increase 10/300 from GE Healthcare (Livonia, MI, USA) column equilibrated in 20 mM HEPES at pH 7.5 and 50-mM NaCl. Peak fractions were pooled and concentrated to 2 mg/ml. The VLP was a gift from Dr. Yingzhi Xu (Minhai Biotechnology Co.) and was diluted to ~4 mg/ml with 20 mM Tris.HCl pH 7.5 and 150-mM NaCl.
Approximately 3-μl sample aliquots were applied to a glow-discharged holey NiTi film covering an Au grid, or to a carbon film covering a Cu grid. The grids were blotted for 3–7 s with an automated plunging device CP3 from Gatan (Warrendale, PA, USA) or EMGP from Leica (Wetzlar, Germany), and then flash-plunged into liquid ethane at various temperatures ranging from −90 to −183 °C (details in Table S1).
Data acquisition and processing
Datasets of apo-ferritin frozen at −183 °C and aldolase frozen at −110 °C on Au grids (Table 1) were collected with a FEI Titan Krios form Thermo Fisher Scientific (Portage,MI, USA), equipped with a direct detector K2 summit from Gatan (Warrendale, PA, USA) with super-resolution mode, at a magnification of 165,000× and binned pixel sizes of 0.82 Å. The GDH datasets obtained in the pink and light-blue regions (Fig. 1a) of the Cu grid frozen at −183 °C (Table 1) were imaged similarly, with a GIF quantum energy filter (width of 20 eV) by the beam-image shift data collection method (Wu et al., Reference Wu, Huang, Cheng, Zhu and Zhang2019). All the remaining datasets were collected similarly, with details listed in Table S1.
Images of a thin-layer aqueous sample were selected manually for further data processing. In all datasets, the BIM was corrected with MotionCor2 software (Zheng et al., Reference Zheng, Palovcak, Armache, Verba, Cheng and Agard2017). Aligned stacks were saved for per-frame reconstructions. The defocus parameters were estimated with CTFFIND4 software (Rohou and Grigorieff, Reference Rohou and Grigorieff2015). About 2,000 particles were picked by e2boxer.py semiautomatic particle-picking software (Tang et al., Reference Tang, Peng, Baldwin, Mann, Jiang, Rees and Ludtke2007), or by manual picking with RELION software, and were processed by two-dimensional (2D) classification. This yielded 2D averages that were used by RELION as references for automatic particle-picking in all micrographs (Scheres, Reference Scheres2012). After the reference-free 2D and 3D classifications, particles were selected and processed via automatic refinement. An extra round of refinement was performed after a CTFFIND4 refinement in RELION-3 (Zivanov et al., Reference Zivanov, Nakane, Forsberg, Kimanius, Hagen, Lindahl and Scheres2018). The reconstruction resolution was determined via post-processing in RELION, which used a soft mask for each dataset.
For per-fame reconstruction, a single frame was split from the aligned stacks written out with MotionCor2. The particles were re-extracted in each frame image using parameters from the previous refinement iteration, and per-frame reconstructions were calculated from re-extracted particles via relion_reconstruct_mpi. The resolutions of the per-frame reconstructions were determined by post-processing in RELION, with the same soft mask used in the initial reconstruction of each sample.
Atomic model refinement
Protein data bank coordinates 1MFR served as a starting model for building the atomic structure of apo-ferritin. Amino acids were mutated in COOT software (Emsley and Cowtan, Reference Emsley and Cowtan2004), according to the apo-ferritin amino acid sequence. Manual adjustments were made in COOT. The model was refined with Phenix software (Adams et al., Reference Adams, Afonine, Bunkóczi, Chen, Davis, Echols, Headd, Hung, Kapral, Grosse-Kunstleve, McCoy, Moriarty, Oeffner, Read, Richardson, Richardson, Terwilliger and Zwart2010).
Acknowledgements
We thank Dr. Yingzhi Xu at Minhai Biotechnology Co. for supplying the VLP sample. We thank L. Kong for cryo-EM data storage and backup. Cryo-EM data collection was performed at the Center for Biological Imaging, Core Facilities for Protein Science at the Institute of Biophysics (IBP), Chinese Academy of Sciences (CAS). We thank X. J Huang, B. L. Zhu, X. J. Li, L. H. Chen, F. Sun and other staff members at the Center for Biological Imaging (IBP, CAS). The project was funded by the National Key R&D Program of China (2017YFA0504700), the National Natural Science Foundation of China (31930069) the Strategic Priority Research Programme of the Chinese Academy of Sciences (XDB37040101) and the Key Research Programme of Frontier Sciences at the Chinese Academy of Sciences (ZDBS-LY- SM003). We thank Alan Burns for editing the language of a draft of this manuscript.
Supplementary Materials
To view supplementary material for this article, please visit http://dx.doi.org/10.1017/qrd.2021.8.
Author contributions
X.Z. C.W. and H.S. designed the experiment. C.W. and H.S. performed the experiments. K.F prepared apo-ferritin sample. C.W. and H.S. prepared the cryo-EM specimen and performed data collection. C.W., H.S. and D.Z. performed data processing. C.W., H.S. and X.Z. analysed the result and wrote the manuscript. X.Z. supervised the whole experiment. All authors discussed and commented on the results and the manuscript.
Conflict of interest
The authors declare no conflict of interest.
Data availability statement
The deposit code of the frame reconstructions of apo-ferritin frozen at −110 °C is EMD-31736. The deposit code of the frame reconstructions of apo-ferritin frozen at −183 °C with cooling rate gradient is EMD-31737. All other relevant data are available from the corresponding author upon reasonable request.
Open Peer Review
To view the open peer review materials for this article, please visit http://dx.doi.org/10.1017/qrd.2021.8.


 Open access
Comments
Comments to Author: Authors of the manuscript "Freezing with low cooling rate to recover initial frames in cryo-electron microscopy" suggested an unusual technique to recover information from early frames in "movies" recorded by modern Direct Electron Detector cameras (DDD) of radiation sensitive materials, biological samples in particular. It is counterintuitive, at least for me, that reducing of cooling rate using standard cryo-EM cryogen, ethane, would lead to better recovery of information from images of vitrified samples, but they seem to be able to demonstrate the technique worked for several different samples. Their hypothesis was that the lower cooling rate during vitrification would decrease mechanical stress in vitirified samples resulting in slower motion in the early frames of the DDD movies, which would reduce overall changes during a frame exposure. To prove that hypothesis they vitrified grids with tweezers tips positioned well inside the metal mesh, which led to variable temperature gradient on the grid during vitrification depending on the distance from the tips to a particular hole with sample. The authors did also show that using higher cryogen temperatures led to better per-frame resolution in cryo-EM maps of several proteins and their complexes, especially for first few frames in the movies collected on K2 camera. They used similar conditions to vitrify specimens, except for cryogen temperature, which made the results interpretable. I am not sure if their statement about 'too fast' movement in the first frames is entirely correct; there are other factors that could affect quality of the first frames in the movies. To further prove that lateral displacement in early frames is the culprit for loss of information in them, the authors could either use a faster camera (e.g. K3), or lower the dose rate to reduce the effective amount of movement in these frames. The 'rapid burst' they mention would lead to not only side movement of the particles in vitrified water, but also to rotations and tilts of the particles, which is difficult to account for using existing motion-correction programs, at least in the first stages of image processing.
It looks like the authors either had extensive discussions or arguments with Dr. C. Russo or his group and therefore wanted to prove their point in the manuscript. They even checked the validity of Naydenova et al. 2020 statement that "HexAuFoil" grids allowed to restore information from early frames in DDD movies. I would leave that part of the manuscript; it does not prove Dr. C. Russo wrong but leaves wrong impression on readers.
Specific points:
English in general could be improved
Their statement (lines 114-119, page 4) that the data show vitrification stress being proportional to cryogen temperature used for vitrification may not be correct, it is just their observation that overall quality of early frames becomes better at higher cryogen temperatures, or at a certain distance from tweezers tips.
The phrase (line 152) that 'pink' region in Figure 1 represents "minimal cooling rate" for vitrification is imprecise since according to authors the cooling rate will vary within that region depending on distance from the rim of a grid, and from tweezers tips. It should probably say 'lower cooling rate' compared to closer to tips/rim areas.
Last paragraph (lines 176-186) on page 6: again, some quantification is required, where these 'light blue' regions were relative to tweezer tips, or how far were they from the rim of the grid; otherwise it is difficult to understand the difference between these areas and 'conventional freezing' grids.
The authors could cite A. Bartesaghi, A. Merk, S. Banerjee, D. Matthies, X. Wu, J. L. S. Milne, and S. Subramaniam 2.2 Å resolution cryo-EM structure of β-galactosidase in complex with a cell-permeant inhibitor. Science. 2015 Jun 5; 348(6239): 1147-1151.doi: 10.1126/science.aab1576 in addition to other references (line 233, page 8)
Discussion:
First phrase is inaccurate, in addition to reduced stress during vitrification (which is still not determined in the study) there could be different factors, e.g. specimen charging under the beam could depend on freezing conditions or other factorscould vary as well. Overall structure of the grids frozen with higher cryogen temperature could different.
How did authors measure ice thickness in their grids (lines 267-272; Table 1)? What was microdroplet thickness in J. Dubochet's case?
It is authors speculation that lower cooling rate freezing would cause better equilibration of "the expansion of the vitreous ice" and "produce stress-free vitreous ice". It is natural to suggest that, but they would need to prove it one way, or another
Methods:
Make terminology consistent: 'plum region and cyan region', 'pink' before (line 363)
Line 570: "porous" -> change to "holey". Although porous is technically correct term, but people usually call that "holey film" in cryo-EM.
What was the reason to use different support film types in addition to changing temperature and tweezers position? That makes it more confusing for reader, too many variables. C-film, Cu grids; Au grids, NiTi film; ANTA grids?
Figure 3: Why is panel A there? What does it have to do with temperature effect on freezing? Do exposures in the legend refer to per-frame exposures? How different "exposure" is from "fluence"?
Figure 4: Panels A and B are quite different; it is probably a good idea to make them into separate Figures. In panel B: "the red and blue straight lines were fitted from the linear sections", what does that mean? I did not see any 'dotted line' in the panel.
Table 1: What does it mean "control" in the "temperature" column? What is "D" and "h"? that was defined in the main text, but would be helpful to remind reader what they were. Why 'D' is in 'um' and 'h' is in 'nm'? How could resolution difference between a per-frame reconstruction, and the best per-frame resolution be negative number? Why in the first line (apoferritin frozen at -183C) differences are zero? What does it mean "control" temperature?
Data availability - have to specify the IDs for deposited data, none provided
VLP: which one? VLP in general means viral particles without packaged genome, many viruses could form VLPs, need to specify what was used in this particular case.
Supplementary data
Table S1: Same as in Table 1 - "control" temperature? Again, not to introduce more variables, why did authors needed to use different support films, different data collection methods, worked with- and without energy filter? What does it mean "GIF (eV)"?
Figure S1. What does it mean "without adding extra contract between tweezers and grids"?
Figure S2 has to be modified or deleted; the authors did not use any temperatures near zero °C and that error curve is confusing. Such "fitting" cannot be done from 4 measurements where three of them are close to each other at one end of the curve, and the fourth is miles away at the other end.
Table S2: I am not sure how precise their temperature measurements were, but most likely not to the second decimal point. In any case, that precision is redundant because the variation between same type of cryo-plungers would be much larger than even 1°C and would also depend on location of the plunger and local temperature/humidity/air circulation variation in the room. Plus, it would be difficult for experimentalists to setup the conditions with that precision. Moreover, is that important for this kind of experiments?
What is DPS? My understanding is that was abbreviation taken from a published paper, the authors should be responsible for explanation of all terms used in the text, so they have to introduce all abbreviations used in the manuscript.