

Introduction
The Clinical and Translational Science Award (CTSA) Program is charged with growing and improving the nation’s clinical and translational research enterprise. The CTSA Consortium is comprised of academic health care institutions with CTSA hubs that deliver research services, provide education and training, and innovate improved processes and technologies to support clinical and translational research. To further this mission, a 2013 Institute of Medicine (now the National Academy of Medicine) Report on the CTSA Consortium recommended “common metrics” across all CTSAs as a tool for assessing and continuously improving activities at each hub and of the Consortium as a whole [Reference Leshner, Terry, Schultz and Liveman1].
In response, the NIH National Center for Advancing Translational Science (NCATS), which sponsors the CTSA Program, together with the CTSA Consortium hubs implemented the Common Metrics Initiative. Between June, 2016 and December, 2017, a team from Tufts Clinical and Translational Science Institute (CTSI) led the initial implementation of standardized metrics and a shared performance improvement framework with three sequential Implementation Groups of hubs [Reference Daudelin, Peterson and Welch2]. Initial implementation focused on three metrics: duration of Institutional Review Board (IRB) review, research career outcomes of trainees, and pilot project publications and subsequent funding.
A separate team led by Tufts CTSI conducted a mixed-method evaluation of the first 19 months of Common Metrics implementation. Results detailing hubs’ progress and factors affecting that progress are reported separately [Reference Welch3]. In short, the vast majority of hubs computed metric results and made progress in understanding current performance. However, hubs also encountered barriers when developing and carrying out performance improvement plans.
Although initial reports indicated that implementation was challenging, there were signs that the effort had facilitated self-assessment and improved processes at hubs and that it had the potential to support the CTSA Consortium’s translational research mission [Reference Selker4]. Evidence about the value of shared metrics for networks of organizations is limited, but there is some information to support the early positive indicators of implementing the Common Metrics and performance improvement activities. For example, a case study of a highly integrated network of organizations showed the benefits of benchmarking each organization’s results with similar other ones in their network [Reference Pekkola and Ukko5]. This article summarizes the results of a systematic evaluation regarding CTSA hubs’ perspectives on the value of the Common Metrics Initiative in the initial 19 months, including recommendations.
Methods
A detailed description of methods for the full evaluation study is reported separately [Reference Welch3]. In brief, the full evaluation study used an intervention mixed-methods framework [Reference Fetters, Curry and Creswell6] to describe hubs’ progress and experiences implementing the Common Metrics and a shared performance improvement framework. Quantitative and qualitative data were analyzed independently, and results were merged to fully describe hub experiences and perspectives [Reference Fetters, Curry and Creswell6].
This section describes methods specific to the assessment of the overall value of implementing the Common Metrics and performance improvement framework. Both quantitative and qualitative methods were used to understand the multi-dimensional concept of overall value. The quantitative analysis assessed change in the ability to manage performance and to facilitate the mission of advancing clinical and translational science. The qualitative analysis addressed meaningfulness and perceived added value at the local and Consortium levels, including recommendations based on experiences with the initial implementation.
Quantitative Methods
Participants
Sixty CTSA hubs were invited to participate in each of three surveys, conducted at the start of the study period (baseline), about 3 months after beginning the implementation program (first follow-up), and at the end of the study period (final follow-up). For each survey, invitation and reminder emails were sent to one Principal Investigator per hub, who was asked to assign one person to complete the survey after gathering input from others at the hub. All eligible hubs (n = 60) responded to the baseline survey. The two follow-up surveys received 95% response (57 out of 60) and 98% response (59 out of 60), respectively.
Survey content
Quantitatively, the value was measured as a positive change in hubs’ self-assessed ability to manage performance and facilitate clinical and translational science. To operationalize these concepts, the baseline and final follow-up surveys each included the same eight items (Table 1). The ability to manage performance was operationalized by asking about the extent hubs were able to assess their performance (two items), engage stakeholders in discussions about operational or strategic issues (two items), identify actions to influence/improve performance (one item), and address performance issues (two items). Hubs also reported on the extent they were able to advance clinical and translational science (one item). All items were measured on a four-point Likert-type scale (not at all, a little, some, a lot).
Table 1. Survey items measuring self-assessed ability to manage performance

* Four-point Likert-type responses were “not at all, a little, some, a lot.”
In addition, surveys asked hubs to report on their performance improvement activities at two time points. As part of the baseline survey, hubs were asked to choose one local metric that best exemplified how the hub used metric data in the prior five months. For this metric, hubs reported on whether they had completed activities in five domains of metric-based performance improvement (creating the metric, understanding current performance, developing a performance improvement plan, implementing the performance improvement plan, and documenting the metric result and plan fully; Table 2). The first follow-up survey asked hubs to report progress on completing the same performance improvement activities for the Common Metric that best exemplified its use of metric data and the performance improvement framework as of that time. Data about performance improvement activities were used to sample for qualitative interviews.
Table 2. Scoring rubric used in interview sampling: completion of Common Metrics and performance improvement activities

* Activities did not have to be conducted sequentially. Each activity was assigned 1.0 point for a maximum of 10 points.
** Half credit (0.5 point) was possible.
All surveys were administered electronically using the Research Electronic Data Capture (REDCap) software [Reference Harris7].
Statistical analyses
Self-assessed ability to manage performance and advance clinical and translational science was calculated for each of the eight items individually. We converted Likert-type scale responses into a numeric scale ranging from 0 to 100, with a higher score reflecting a better self-assessment. Since each item had four response categories, “not at all” responses were converted to zero, “a little” to 33.3%, “some” to 66.6%, and “a lot” to 100%. The response of “not sure” was considered a missing value. After converting responses, a mean score was calculated for all respondents.
Differences in the responses at the two time points were tested using the chi-squared test for the distributions and the t-test for means. Differences in mean scores were tested by taking the difference at the two time points and then testing the mean difference against zero, equivalent to paired t-tests.
Qualitative Methods
Participants
Interviews were conducted with participants from a nested sub-sample of 30 out of the 57 hubs that responded to both the baseline and first follow-up surveys. The sampling plan sought to balance hubs primarily according to their experiences with metric-based performance improvement, as measured by the surveys, and secondarily by other key hub characteristics. First, each hub was assigned a score indicating the extent to which it had completed performance improvement activities at baseline (i.e., prior experience) and the first follow-up survey (i.e., early progress on a Common Metric). To ensure a sample of hubs with diverse experiences with performance improvement, a matrix of hub scores at each time point was created, dividing scores into three levels (minimal, moderate, and significant completion), yielding nine cells (Table 3).
Table 3. Semi-structured interviews: final sample of hubs (N = 30)
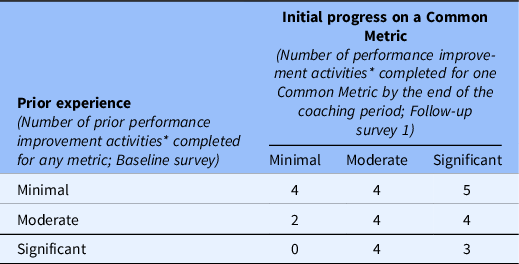
* Activities range from 0 to 10. Minimal = 0.0–4.5, moderate = 5.0–8.5, significant = 9.0–10.0.
After assigning each hub to a cell in the matrix, the assignments were reviewed to target three or four hubs per cell. For cells with more than four hubs, four hubs were randomly sampled. Then, the sample was reviewed for balance across five hub characteristics (years of funding, total funding amount, the region of the country, Implementation Group, and the number of hub implementation team members reported). Sampled hubs that declined or did not respond to invitations and reminders were replaced by randomly selecting another hub from the same cell, when available. If no additional hubs were available in the same cell, a hub from another cell that represented a change in performance improvement experience from baseline to the first follow-up survey was selected.
To recruit hubs for qualitative interviews, agreement for hub participation from a CTSA hub’s Principal Investigator or designee Administrator was sought. Once this agreement was obtained, the Principal Investigator or designee nominated faculty or staff in the other two roles addressed by the interview guide. If interviews for all three roles could not be scheduled, another hub was selected. A total of 90 interviews were conducted, with three respondents for each of 30 hubs.
Semi-structured interviews
Qualitatively, the value of implementing Common Metrics was elicited with questions about the perceived usefulness and meaningfulness of the metrics to the local hub, the perceived value-added at the local and Consortium levels, and recommendations for future implementation. A semi-structured interview guide included five open-ended questions, plus follow-up probes, related to these topics.
To elicit different perspectives at each hub, the interview guide was adapted for three roles: the hub’s Principal Investigator, the Administrator/Executive Director (or person acting as a Common Metrics “champion” at the hub), and an “implementer” knowledgeable about day-to-day operations related to the Common Metrics. Each version of the guide was piloted during mock interviews with Tufts CTSI leaders and staff members. After each mock interview, three qualitative team members debriefed and revised the interview guide as needed to clarify content and improve the flow before study interviews began. Full interview guides are available upon request.
One of two qualitative team members conducted each interview by telephone. In advance of the interview, each participant was emailed a study information sheet and provided verbal consent. Interviews lasted between 20 and 60 minutes and were audio-recorded with additional verbal consent.
Interviewer training included receiving feedback on interview techniques from the qualitative team following both mock interviews and study interviews. To ensure consistency in interviewer approaches, the two study interviewers listened to and discussed audio recordings of interviews conducted early in the data collection process and more difficult interviews conducted subsequently. Additionally, during weekly meetings, three qualitative team members discussed study participants’ responses to and questions about interview guide items and, following procedures for qualitative interviewing, identified additional language to further facilitate future interviews.
Coding and thematic analyses
Audio recordings of qualitative interviews were transcribed verbatim by a professional transcription company. To facilitate coding and analysis, transcripts were uploaded into the NVivo qualitative data analysis software [8].
A two-stage consensus-based process was used to develop the codebook. First, an initial codebook was developed using the main topics of the interview guide as pre-identified categories. Then, analysts reviewed two transcripts and all interview notes and reflections to identify emergent concepts, which were merged with the pre-identified categories into a single codebook. This codebook was reviewed by the qualitative team for clarity and consistency.
Second, to ensure definitions were clear and codes were being used consistently, analysts independently applied the initial codebook to two small batches of transcripts (one transcript and three transcripts) of interviews with participants in different roles (Principal Investigator, Administrator, and Implementer). After each batch, the qualitative team met to identify discrepancies in coding that reflected different interpretations of the meaning of a passage, discuss the reasons for the discrepancies, and resolve them. When independent coding agreed on the essence of the meaning of a passage, minor differences in the length of a quotation coded was deemed acceptable. After resolving discrepancies, the codebook was revised as needed to reflect the team’s decisions.
Once consensus on the codebook and its application were reached, one team member coded the interviews. Another team member periodically reviewed a convenience sample of coded transcripts for fidelity to the codebook. The full qualitative team discussed all potential new themes or revisions before changes were made to the codebook.
As coding progressed, themes were grouped into domains for the perceived value of implementing the Common Metrics and performance improvement framework and for recommendations. For each domain, one analyst read all relevant quotations and summarized the themes, including illustrative quotations. Each analyst also identified intersections among themes, which were discussed by the full team and incorporated into the results.
Results
Change in Self-Assessed Abilities
The quantitative analysis included the 58 hubs that responded to items assessing the ability to manage performance and to facilitate clinical and translational science in the baseline and final follow-up surveys. Comparing the two time points, hubs considered their abilities to manage performance to have improved on most measures (Fig. 1 and Table 4). This improvement was statistically significant for three measures: the ability to assess current performance, assess future performance, and identify actions to improve. Hubs also appeared to perceive an improvement in their ability to efficiently and effectively address performance issues and, to a lesser extent, engage stakeholders in operational or strategic issues, although these changes were not statistically significant. There was essentially no change in the perceived ability to advance their mission of catalyzing clinical and translational science, which was relatively high at both time points.

Fig. 1. Comparison of self-assessed ability to manage performance and facilitate clinical and translational science during the initial implementation of Common Metrics. *One hub did not respond to the second follow-up survey. A second hub was dropped from this analysis due to missing data; **p = 0.02; ***p = 0.01; ϵ = 0–100 scale; higher score reflects a better self-assessment.
Table 4. Self-assessed ability to manage performance during initial implementation of Common Metrics

* One hub did not respond to the final follow-up survey. Another hub was dropped from the analysis due to missing data on the self-assessment questions at baseline, despite completing other parts of the survey.
** 0–100 scale; higher score reflects a better self-assessment.
*** For each item, responses were compared using the chi-squared test for the distribution in two time points and the t-test for the difference of the final mean score minus the baseline mean score. Bolded P-values indicate statistical significance.
Areas of Value-Added
Participants from all hubs in the qualitative interview sample reported at least one – and typically multiple – types of perceived value of the Common Metrics Initiative. These included providing a formal structured process, enabling strategic conversations, facilitating improvements and tracking progress, providing an external impetus for improvements, and providing concrete justification for continued funding for CTSAs.
Providing a formal structured process
Participants in all roles (Principal Investigators, Administrators, and Implementers) identified the value of a formal structured process to “think through” performance improvement. In the words of one of these participants:
[T]he process of having to formally think through what is leading to the current level of performance and what you could improve I think is a useful thing… – Principal Investigator
Participants also emphasized the value of providing sets of clearly defined metrics on which hubs needed to focus. For example:
I think the process of sort of having clearly defined metrics, whether they’re the ultimate metrics or not, sort of in looking at the context behind those, I do think it adds value and just helps us maintain a focus on some of the key programs and how we can best help facilitate them… – Administrator
Similarly, some participants noted that the structured metrics and process had helped to enhance accountability for improvement and integrate evaluation into the hub’s activities more generally.
Yes, over time I have perceived the metrics as being increasingly useful to my push to integrate evaluation activity more deeply into all of [our organization’s] programs and services. – Implementer
Enabling strategic conversations
At a number of hubs, participants noted that the conversations stimulated by implementing the Common Metrics and performance improvement activities enabled strategically oriented discussions about current performance and improvement opportunities. For example, in the words of two participants:
…[I]t’s actually a good way to lead discussions among the program directors on where they want to take their metrics… – Administrator
It’s much more about the conversation around the data. …The data allow us to have these broader strategic conversations around pilots, around education, around IRB that we wouldn’t have been able to do if it was just kind of a regular routine kind of process. – Implementer
Another participant noted that implementation helped the hub to “take a step back” to reflect over all the hub’s programs, even those performing well. Others commented that implementation encouraged considerations of the “broad picture,” including the national scope of the Common Metrics Initiative.
Facilitating improvements in immediate outcomes and processes
Although improvement in metric results may not have been evident in the short term, participants from a variety of hubs pointed to improvements in processes and services. For example, in relation to the metric measuring career outcomes of trainees, a Principal Investigator noted that scholars were receiving more services to improve their funding applications, with the goal of supporting their continued engagement in clinical and translational science.
…There is zero, zero question that I’ve seen things improve. The scholars are better. They’re better prepared. They’re sending out their first grants that are a lot better. They’ve got infrastructure support for statistics that used to be…ad hoc, nonexistent or worse. – Principal Investigator
Others noted improved processes for collecting metric data and identifying gaps in hub practices. For example:
…[O]ne thing the Common Metrics has done, it’s made us think about–outside of the Common Metrics–how we collect our local metrics and what they should be. And so, I think it’s been a good thing, because that’s the only way that we can ever really change our environment. – Administrator
Providing external impetus for improvement
Participants at a few hubs noted that the external mandate and requirements of the Common Metrics, although burdensome for some, served as a useful “impetus” or rationale to justify and motivate hub stakeholders to expend effort on the topic areas addressed by the metrics. In the words of a Principal Investigator:
[E]ven though I’d hoped that we would do that anyway, …the fact that we have to report these outcomes is an impetus to do it. …[T]aking advantage of this external requirement to do it is useful… – Principal Investigator
Providing justification for funds invested
At a number of other hubs, participants emphasized the role of Common Metrics in justifying the value of CTSA activities to a variety of key stakeholders and funders within and outside their organizations, including their home institutions, the NIH, and the US Congress that appropriates funds for the CTSA Program. For example:
The way I see [the Common Metrics’] biggest value is, number one, it gives us—and that’s you and me and the whole Consortium—a way to show Congress, a way to show the public, a way to show the rest of NIH, “Look at what the…CTSA Program is doing. This is good stuff. We’re doing good stuff.” – Principal Investigator
Areas of Concern about Value
Although participants identified areas of value in implementing the Common Metrics, concerns remained about receiving, or demonstrating, sufficient value of the Common Metrics Initiative. Participants at more than two-thirds of hubs taking part in qualitative interviews expressed concerns about the usefulness of the specific chosen metrics and performance improvement framework and/or the level of value gained relative to the effort expended.
Overall usefulness
Local level
Concerns about the usefulness of the chosen Common Metrics for local improvement were cited as a reason for not completing performance improvement activities. As a Principal Investigator explained:
Certainly, the areas that were initially proposed and the new areas generally going forward make a great deal of sense. …Having said that, I have no idea exactly yet what their value added to us is because we obviously maintain many, many, many more and different kinds of metrics than these for internal purposes. So, it’s a little unclear to me…where this is going to go across the hub. – Principal Investigator
Participants indicated that the Common Metrics did not necessarily reflect local definitions of success, measured outcomes that took substantial time to achieve and made assessing current performance difficult, and did not align with local context or priorities. For example, emphasizing the publication of results from pilot studies did not always align with the local goals of Pilot Studies Programs. These concerns raised tension between the need for the CTSA Program to implement standardized metrics and the need for hubs to make performance measurement meaningful for local improvement efforts within their own institutional context. In the words of an Administrator:
[T]his is where you get into that balance of the CTSA Program as a whole versus each individual CTSA in that we do function according to the needs of our institutions. And in order for a metric to be more useful for the institution itself, it’s going to need to be tailored to the institution. So, there’s limited value in a metric that’s going to be used across all CTSAs in terms of improving a specific CTSA… – Administrator
Consortium level
From hubs’ perspectives, concerns about the value of the metrics at the Consortium level were two-fold. First, the specific foci of some Common Metrics were perceived as too narrow in scope to give a useful portrait of performance in complex processes. For example, focusing on one aspect of the research process, such as IRB review duration, would not provide a complete understanding of clinical trial performance. As a Principal Investigator explained:
…[Y]ou can’t pick everything, so…if your point is to accelerate clinical trials, then create a dashboard for yourself that can benchmark CTSAs in that function. Just having IRB review is not going to do that. …I don’t know how anyone centrally can look at that across six institutions and be able to say anything. – Principal Investigator
Second, participants expressed concern about the comparability of metric results across hubs due to the potential for lack of standardization in how hubs collected metric data and computed results. In the words of a Principal Investigator, “ ‘[I]f you’ve seen one CTSA, you’ve seen one CTSA.’ And so, everyone was collecting things a little bit differently.” Perceived lack of clarity of metric definitions was one source of variation. For example, the operational guideline for the metric measuring career outcomes of trainees allowed hubs to define “continued engagement in clinical and translational research” differently, creating variability in measurement. Similar concerns were voiced about the metric measuring IRB review duration:
… [T]here was confusion about how it was worded in the Common Metrics and what our IRB then decided to use. So we felt that maybe you couldn’t really compare it across CTSAs because it sounded like others were having some of the same issues with the terminology a little bit. – Administrator
Another source of variation was the lack of alignment between the metric’s data needs and some local data systems. For example, regarding the IRB review duration metric, the activities included in the time period being measured varied according to local workflows. At some hubs, substantial parts of the institutional review were performed prior to protocols entering the IRB system, while at others those same aspects of review occurred after protocols entered the IRB workflow. Other participants mentioned the potential for “interpreting [a metric] and kind of doing it in the ways that will be most favorable for their organization,” in the words of an Administrator.
Demonstrating sufficient value relative to effort expended
Some participants expressed concern about demonstrating sufficient value of the Common Metrics relative to the resources they required. Participants voiced concerns about the effort required to collect the needed data and expending effort on required topic areas in which their hubs are performing well. For example:
I remember even asking this, “If you have 100% across these different metrics, what is the Turn the Curve plan supposed to be about?” …And what the…person told me was, “The Turn the Curve plan should be about what your CTSA intends to do to continue that high level of success.” …The people in my CTSA…kind of found those data not really helpful. – Administrator
Some hubs questioned the value of the shared performance improvement framework. Creating performance improvement plans required substantial work, but their outcomes were perceived as not worth the effort.
Well, I can tell you my only comment about this was collecting the metrics wasn’t particularly difficult, but for our staff this concept of changing the curve actually ended up being a lot work and a lot of effort. And I’m not sure that I know in my own mind that I feel like it was worth the effort put into it. – Principal Investigator
From participants’ perspectives, the consequence of not demonstrating sufficient value given the effort expended would be to undercut hub engagement and momentum. In the words of an Administrator:
I would just say it’s not a small amount of time and effort that folks are putting towards this, and I think we are concerned as a hub of how to maintain momentum given there’s a bit of missing information with regards to return on investment. – Administrator
For several hubs, although they described less than the desired value of the Common Metrics, they were willing to give the initiative time to realize more value, either for the current metric topics or for future ones.
Hub Recommendations
Their concerns notwithstanding, hubs provided recommendations for future improvement of the Common Metrics Initiative: (1) provide useful benchmarking, (2) disseminate best practices, (3) promote peer-to-peer learning, and (4) share evaluation results throughout the CTSA Consortium (Table 5).

* Unless stated otherwise, themes manifest in more than one way; a quotation represents one manifestation.
Benchmarks were of substantial interest but also perceived with some wariness. On the one hand, a number of hubs perceived that benchmarks would help them understand their performance relative to other hubs, calibrate their progress, and identify areas still in need of improvement. On the other hand, some participants warned of potential hazards to avoid in order to ensure useful benchmarking at local and national levels. Specifically, they warned against aggregating results that were not comparable and using metric results to rank hubs. These participants advocated for a data quality process to ensure comparability of metric results across hubs and emphasized the use of the metrics for local improvement.
Of equally high interest, hubs recommended that successful strategies and best practices for implementing Common Metrics and achieving improvement be culled and disseminated. Related to this, hubs recommended the creation of more opportunities to learn from each other, particularly among hubs similar to each other. Suggested approaches included connecting hubs that had similar contexts and challenges or pairing experienced hubs with those more recently established.
Hubs also recommended expanding the use of data and research to guide Common Metrics work. Suggestions included using additional hub data to test for predictors of Common Metrics outcomes, collecting data about local hub metrics in order to identify common topics across hubs, and sharing assessments of the Common Metrics Implementation across the CTSA Consortium.
Discussion
From the perspective of CTSA Consortium hubs, the initial period of implementing Common Metrics and a shared performance improvement framework brought value but needed further development to fulfill its potential. After 19 months, hubs reported being better able to assess performance and identify specific actions for improvement. However, they perceived no change in their ability to achieve their broader mission of catalyzing clinical and translational science. They had concerns about the usefulness of the metrics chosen and, therefore, whether the effort and resources required to implement them was justified. Developing metric topics of broader scope and a higher priority, ensuring comparable benchmarking, and facilitating cross-hub learning were seen as ways to enhance the value of the initiative locally and nationally.
On the one hand, hubs recognized that the Common Metrics Initiative provided a lever for working with local institutions to improve some processes involved in clinical and translational science. Establishing a formal, structured process for data-driven performance improvement proved valuable by enabling strategic conversations with stakeholders and facilitating improvement in local processes related to metric topics. Additionally, the external requirement provided justification to local stakeholders, when needed, for devoting the resources and personnel needed for metric-based improvements.
On the other hand, hubs questioned whether the Initiative provided evidence of their impact. The initial Common Metrics did not always align with local priorities related to clinical and translational science, and they were perceived by some to be too limited in scope to demonstrate meaningful impact of the Consortium. Additionally, concerns about the comparability of results across hubs weakened trust in aggregated Consortium-wide results and thus the desire to use them to benchmark local performance, which lessened the value of the metrics.
Overall, the evaluation of the CTSA Consortium’s initial implementation of Common Metrics yielded two overarching implications for future metric-based performance improvement initiatives. As reported previously [Reference Welch3], implementing Common Metrics and performance improvement across the loosely integrated network of CTSA hubs required substantial time and resources, and heterogeneity across hubs meant the challenges were even greater for some. Taken together with results reported in this article, the first implication is that careful selection of metric topics that demonstrate high-priority impact and facilitate local improvement is important to ensure the investment required is perceived as worthwhile by participating organizations. Second, establishing mechanisms to ensure comparable results across hubs and cross-hub learning would provide the foundation for hubs to receive more robust benefits from their efforts.
Limitations
In light of the significant effort involved in initiating Common Metrics and a shared performance improvement framework across a national network, this 19-month evaluation was relatively short to assess its value. More time is needed to meaningfully assess whether the medium- and long-term outcomes justify the time and resources required. In addition, the current assessment represents the voices of individual CTSA hubs. The perspectives of other stakeholders, including CTSA Consortium leaders and funders, should be incorporated into future assessments.
Conclusion
For the national CTSA Consortium, implementing Common Metrics and a shared performance improvement framework yielded concrete benefits from the perspective of CTSA hubs. They perceived value for assessing their performance in relation to goals, identifying actions for improvement, holding valuable strategic discussions with stakeholders, and improving processes. Notwithstanding these short-term benefits, to reach its potential for supporting the CTSA Program’s mission, hubs recommended that the Common Metrics Initiative focuses on facilitating cross-hub learning and collaboration around metrics that address high-priority impact areas from the perspective of both individual hubs and the Consortium.
Acknowledgments
We are grateful for the time and effort of many people who contributed to the Tufts Common Metrics Evaluation Study. CTSA Consortium hubs across the country invested resources, personnel, and time to implement the Common Metrics and provide data for the evaluation study. Debra Lerner, MS, PhD, provided expertise in study design and survey research, and Annabel Greenhill provided valuable research assistance. Members of the Tufts CTSI Common Metrics Implementation Team, including Denise Daudelin, Laura Peterson, Mridu Pandey, Jacob Silberstein, Danisa Alejo, and Doris Hernandez, designed and carried out the implementation program that is evaluated by this study.
The project described was supported by the National Center for Advancing Translational Sciences, National Institutes of Health, Award Numbers UL1TR002544 and UL1TR001064. The content is solely the responsibility of the authors and does not necessarily represent the official views of the National Center for Advancing Translational Sciences or the National Institutes of Health.
Disclosures
The authors have no conflicts of interest to declare.


 Open access