Published online Feb 28, 2024. doi: 10.3748/wjg.v30.i8.901
Peer-review started: October 8, 2023
First decision: December 6, 2023
Revised: December 18, 2023
Accepted: January 24, 2024
Article in press: January 24, 2024
Published online: February 28, 2024
Metadherin (MTDH) is a key oncogene in most cancer types, including hepatocellular carcinoma (HCC). Notably, MTDH does not affect the stemness pheno-type or immune infiltration of HCC.
To explore the role of MTDH on stemness and immune infiltration in HCC.
MTDH expression in HCC tissues was detected using TCGA and GEO databases. Immunohistochemistry was used to analyze the tissue samples. MTDH was stably knocked down or overexpressed by lentiviral transfection in the two HCC cell lines. The invasion and migration abilities of HCC cells were evaluated using Matrigel invasion and wound healing assays. Next, we obtained liver cancer stem cells from the spheroids by culturing them in a serum-free medium. Gene expression was determined by western blotting and quantitative reverse transcri-ption PCR. Flow cytometry, immunofluorescence, and tumor sphere formation assays were used to characterize stem-like cells. The effects of MTDH inhibition on tumor growth were evaluated in vivo. The correlation of MTDH with immune cells, immunomodulators, and chemokines was analyzed using ssGSEA and TISIDB databases.
HCC tissues expressed higher levels of MTDH than normal liver tissues. High MTDH expression was associated with a poor prognosis. HCC cells overexpressing MTDH exhibited stronger invasion and migration abilities, exhibited a stem cell-like phenotype, and formed spheres; however, MTDH inhibition attenuated these effects. MTDH inhibition suppressed HCC progression and CD133 expression in vivo. MTDH was positively correlated with immature dendritic, T helper 2 cells, central memory CD8+ T, memory B, activated dendritic, natural killer (NK) T, NK, activated CD4+ T, and central memory CD4+ T cells. MTDH was negatively correlated with activated CD8+ T cells, eosinophils, activated B cells, monocytes, macrophages, and mast cells. A positive correlation was observed between the MTDH level and CXCL2 expression, whereas a negative correlation was observed between the MTDH level and CX3CL1 and CXCL12 expression.
High levels of MTDH expression in patients with HCC are associated with poor prognosis, promoting tumor stemness, immune infiltration, and HCC progression.
Core Tip: This study demonstrated that high metadherin (MTDH) expression is associated with poor prognosis in hepatocellular carcinoma (HCC). High MTDH expression increased the invasion and migration abilities of HCC cells and promoted stemness and self-renewal. Moreover, MTDH influenced immune cell infiltration and chemokine levels. These results provide additional evidence for the potential role of MTDH as a molecular marker for HCC.
- Citation: Wang YY, Shen MM, Gao J. Metadherin promotes stem cell phenotypes and correlated with immune infiltration in hepatocellular carcinoma. World J Gastroenterol 2024; 30(8): 901-918
- URL: https://www.wjgnet.com/1007-9327/full/v30/i8/901.htm
- DOI: https://dx.doi.org/10.3748/wjg.v30.i8.901
Primary liver cancer is one of the six most common cancers and the third leading cause of cancer-related deaths worldwide. About 75%-85% of primary liver cancer cases are caused by hepatocellular carcinoma (HCC)[1]. The treatment of liver tumors, is limited by its complex pathogenesis, postoperative recurrence, and drug resistance[2]. The poor prognosis of patients with this disease is attributable to metastasis and high recurrence rates. Therefore, it is crucial to understand the relevant mechanisms underlying HCC and identify new therapeutic approaches and targets.
According to several studies, a small proportion of tumor cells, including those in HCC and colorectal cancer, are capable of self-renewal, proliferation, and differentiation, and they are referred to as cancer stem cells (CSCs)[3,4]. The surface markers of CSCs in HCC include CD133, CD90, and EpCAM. High expression levels of CSC markers of CSCs increase stem cell characteristics and tumor sphere-forming capacity[5-7]. An infiltration of multiple immune cells occurs in HCC, including T lymphocytes[8], B cells[9], dendritic cells (DCs)[10] , and natural killer (NK) cells[11]. The HCC consists of these tumor-infiltrating immune cells. The type and number of immune cells have prognostic value and can influence the response to immunotherapy.
Metadherin (MTDH), also known as astrocyte elevated gene-1 or lysine-rich CEACAM1, is a key oncogenic gene in most cancer types[12]. In malignant tumors, MTDH promotes proliferation capacity[13], migration[14], cell survival, and angiogenesis[15], as well as poor prognosis, in lung, prostate, and breast cancers. The importance of MTDH in HCC has been demonstrated in numerous studies[16,17]; however, the effects of the expression of MTDH on stem cell characteristics and immune cell infiltration in HCC remain unclear.
Compared with normal liver tissues, liver cancer tissues showed higher levels of MTDH expression. Notably, MTDH expression was associated with poor prognosis. Our findings showed that MTDH was expressed at higher levels in tumor spheres than in adherent cells. MTDH expression in HCC cells positively correlated with CD133, Oct4, and Nanog expression in stem cells. Furthermore, the inhibition of MTDH expression inhibited tumor growth. Our study confirmed that MTDH is associated with immune cell infiltration, as confirmed by the analysis of the ssGSEA and TISIDB databases.
All the gene expression profile files and the clinical information were obtained from two public databases. TCGA (The Cancer Genome Atlas database, https://portal.gdc.cancer.gov/) contains information on transcriptional gene expression in human cancer and healthy tissues. After removing samples with incomplete clinical information, 369 liver tumor tissues and 50 healthy liver tissues were analyzed. In the GEO (Gene Expression Omnibus, www.ncbi.nlm.nih.gov/geo/), incompletely annotated samples were excluded from the dataset of GSE14520 (sequencing platform: GPL3921). The analysis included 210 samples, comprising both tumor samples and their corresponding non-cancer pairs. The clinical information of all the samples is presented in Table 1. Liver tumor tissue microarrays of nine paired samples (HLiv-H030PG03) were purchased from Shanghai Xinchao (Shanghai, China).
| Clinical characteristics | GSE14520 | TCGA | ||
| Total (n = 210) | % | Total (n = 369) | % | |
| Age | ||||
| < 60 | 169 | 80.48 | 168 | 45.53 |
| ≥ 60 | 41 | 19.52 | 200 | 54.20 |
| Unknown | – | – | 1 | 0.27 |
| Gender | ||||
| Female | 26 | 12.38 | 120 | 32.52 |
| Male | 184 | 87.62 | 249 | 67.48 |
| T stage | ||||
| T1 | – | – | 179 | 48.51 |
| T2 | – | – | 94 | 25.47 |
| T3 | – | – | 80 | 21.68 |
| T4 | – | – | 13 | 3.52 |
| Unknown | – | 3 | 0.81 | |
| N stage | ||||
| N0 | – | – | 250 | 67.75 |
| N1 | – | – | 4 | 1.08 |
| Nx | – | 114 | 30.89 | |
| Unknown | – | – | 1 | 0.27 |
| M stage | ||||
| M0 | – | – | 264 | 71.55 |
| M1 | – | – | 4 | 1.08 |
| Mx | – | – | 101 | 27.37 |
| Stage | ||||
| I | 90 | 42.86 | 169 | 45.80 |
| II | 75 | 35.71 | 86 | 23.31 |
| III | 43 | 20.48 | 85 | 23.04 |
| IV | 0 | 0.00 | 5 | 1.36 |
| Unknown | 2 | 0.95 | 24 | 6.50 |
| Status | ||||
| Alive | 130 | 61.90 | 241 | 65.31 |
| Dead | 80 | 38.10 | 128 | 34.69 |
| Unknown | – | – | 0 | 0.00 |
| HBV status | ||||
| AVR-CC | 52 | 24.76 | – | – |
| CC | 152 | 72.38 | – | – |
| Unknown | 6 | 2.86 | – | – |
TCGA data were converted to TPM (transcripts per million) values for subsequent analyses. For GSE14520, data normalization and log2 transformation were performed. Probe IDs were converted to gene symbols using a platform annotation file. Genes with multiple probes are represented by their maximum expression values. Data pre-processing was performed, followed by differential expression and statistical analyses using R software. A survival curve analysis was performed using the R packages "Survival" and "Survminer" with the best cut-off value for MTDH calculated for both datasets. R packages “ggstatsplot” and “corrplot” were used for data visualization.
Huh7 cells were purchased from the Chinese Academy of Sciences Cell Bank and, MHCC-97H cells were obtained from the Liver Cancer Institute at Fudan University Zhongshan Hospital. All the cells were cultured in DMEM medium [10% fetal bovine serum (FBS)], 100 U/mL penicillin, and 100 U/mL streptomycin in an incubator with 5% CO2.
Tumor spheres were cultured in serum-free medium (SFM) consisting of 20 ng/mL EGF (PeproTech), DMEM/F12 (HyClone), 20 ng/mL bFGF (PeproTech), and 20 μL/mL B27 (Gibco). Single cells (1 × 10⁴) were seeded in a 6-well ultra-low adsorption plate (Corning) containing 1.5 mL of serum-free culture medium. All the cells were incubated for 14 d in incubators with 5% CO2 at 37°C. Inverted microscopes were used to count tumor spheres larger than 50 mm.
To prepare proteins from the cells, the cells were lysed in RIPA solution (CWBIO) containing a protease inhibitor cocktail solution. The protein concentration in the solution was determined using a BCA kit (Beyotime). Proteins were separated by using sodium dodecyl sulphate-polyacrylamide gel electrophoresis (Beyotime Millipore) and transferred to polyvinylidene fluoride (PVDF) membranes (Millipore). PVDF membranes were closed with 5% skim milk at room temperature (RT) for 1 h, followed by overnight incubation with primary antibody at 4°C. The membranes were washed thrice with TBST containing 0.1% Tween-20, followed by incubation with secondary antibodies (EarthOx) (1:5000) for 1 h. After washing thrice with TBST, for 5 min, the blots were visualized with chemiluminescence reagents (Beyotime). The antibodies used were anti-MTDH (CST, 14065T), anti-CD133 (YT5192, ImmunoWay), anti-NANOG (CST, 4903T), and anti-GAPDH (YM3215, ImmunoWay).
TRIzol (Takara) was used to extract RNA from the cells, and the cDNA (complementary DNA) composition was determined using the PrimeScriptTM RT Reagent Kit (TaKaRa). Real-time quantitative reverse transcription PCR (qRT-PCR) was performed using SYBR Premix Ex Taq (TaKaRa Bio). A CFX96 Real-Time PCR Detection System (Bio-Rad) was used for qRT-PCR analysis. PCR was performed using the primers purchased from Sangon Biotechnology (Shanghai, China). The 2-ΔΔCt method was used to calculate the data. Table 2 shows primer sequences.
| Gene | Forward | Reverse |
| Metadherin | 5′-CCAGGCTCCTTCATCAACTT-3′ | 5′-AthAAGCAGCCACCAGAGATTG-3′ |
| CD133 | 5′-TGGATGCAGACCTTGACAACGT-3′ | 5′-ATACCTGCTACGACAGTCGTGGT-3′ |
| Nanog | 5′-AATACCTCAGCCTCCAGCAGATG-3′ | 5′- TGCGTCACACCATTGCTATTCTTC -3′ |
| Oct4 | 5′-CAGGAGGCATTGCTGATGAT-3′ | 5′-GAAGGCTGGGGCTCATTT-3′ |
| GAPDH | 5′-CAGGAGGCATTGCTGATGAT-3′ | 5′- GAAGGCTGGGGCTCATTT -3′ |
To establish a cell line with stable overexpression and suppression of MTDH, the cell were infected with a lentivirus. MTDH-overexpressing lentiviral vectors, MTDH-RNAi lentiviral vectors, and blank control lentiviral vectors were acquired from GeneChem (Shanghai, China). On the previous day, 3 × 10⁴ cells were grown in each well of a six-well plate. When the cells reached 30% confluence, they were transfected according to the manufacturer’s protocols at Multiplicity of Infection of 5. After 96 h, fluorescence microscopy and western blotting were used to verify the transfection efficiency. Puromycin screening was then performed for 2 wk (GeneChem).
The cells were seeded in a 24-well plate. Paraformaldehyde solution (4%) was used to fix the cells for 20 min after 24 h of incubation. For cell membrane permeabilization, the cells were treated with 0.3% TritonX-100 (Sigmautes) for 15 min. The cells were incubated overnight with anti-NANOG antibody at 4°C after 120 min incubation in 5% BSA in TBST. Next, the cells were washed thrice with PBS and incubated with DyLight 649 AffiniPure Goat Anti-Rat IgG (1:200, Abbkine) for 1 h in a dark humidified box. The final counterstaining was done using DAPI (4',6-diamino-2-phenylindole) for 10 min. Images were captured using a fluoresce microscope (Nikon).
MHCC-97H and Huh7 cells were cultured in six-well plates. Subsequent experiments were performed when the cell density in the wells reached 90%. After scratching the cells with a 200-mL pipette, 2% FBS cell culture medium was used for continued culture. All the cells were incubated with 5% carbon dioxide in an incubator at 37°C. A microscope was used to photograph the wounded areas.
The migration and invasion abilities of the cells were assessed using 24-well transwell chambers with or without Matrigel (BD Biosciences). The supplements were kept in 5% CO2 at 37°C for 12 h. Next, 2 × 10⁵ cells were re-suspended in 200 μL of SFM and placed in transwell cups with an 8-micron pore membrane (BD). Simultaneously, cell culture medium containing 10% FBS was added to the lower layer to make a total volume of 600 μL. The chambers were maintained in 5% CO2 for 24 h at 37°C. The cells that failed to pass through the pores and remained in the upper chamber were carefully wiped off with a cotton swab. Migrating cells were fixed in 4% paraformaldehyde solution for 20 min. Next, the cells remaining in the chambers were stained in 200 μL 0.1% crystal violet for 30 min, followed by counting with a microscope in five random areas.
The cells were washed with PBS after trypsin digestion. Next, they were suspended in 80 μL of PBS, followed by the addition of 2 μL PE-CD133 antibody (Miltenyi Biotec) and 20 μL of FcR Blocking Reagent (Miltenyi Biotec). Under light-proof conditions, the mixture was incubated at 4°C for 10 min. Next, all the cells were washed thrice in PBS, followed by resuspension with 500 μL of PBS. The mixture was analyzed using a FACS Calibur Flow cytometer (BD Biosciences).
BALB/c-nu mice were obtained from the Animal Experiment Center of Chongqing Medical University. The experiments were conducted in the animal facilities of the Animal Experiment Center of Chongqing Medical University (12-h light/dark cycle, 27 ± 2°C, 50% ± 10% humidity). Nude mice were randomly divided into two groups of three mice each. MHCC-MTDH-LV cells (2 × 10⁶ cells) were re-suspended in a complete culture medium. Next, 100 μL of cell suspension were subcutaneously injected into nude mouse (female, 4–6 wk old). The tumors were detached after 4 wk. Next, the tumor volume was calculated using the following formula: Length × width2/2. Tumor tissues were subjected to immunohistochemical staining (IHC) analysis. This study was approved by the Ethics Committee of the Second Hospital of Chongqing Medical University.
All the slides were dewaxed and gradually hydrated. Antigen extraction was performed using citrate buffer under high pressure and temperature conditions. All the slides were rinsed with PBS and incubated with goat serum for 10 min at RT. Next, the slides were exposed to anti-MTDH and anti-CD133 at 4°C overnight. Subsequently, horseradish peroxidase-labeled streptavidin was added, followed by the addition of DAB reagent. Tap water was dehydrated using an ethanol gradient. The slides were then washed twice with xylene and wrapped in neutral balsam. Protein expression levels were assessed using the ImageJ software. The average optical density was calculated by measuring the integrated optical density and the area of each image, which reflected the concentration per unit area of the target protein.
The infiltration abundances of 28 immune cell species in TCGA samples were quantified using ssGSEA. The gene set data for the immune cells were downloaded from the website (https://www.cell.com/cms/10.1016/j.celrep.2016.12.019/). Box plots were constructed to compare immune cell differences between the groups. The R package used was “GSVA”[18], “ggplot2.”
TISIDB is an online analysis site for the analysis of tumor-immune interactions (http://cis.hku.hk/TISIDB/)[19]. To further investigate the immunological impact of MTDH in cancer, we analyzed and evaluated the TISIDB database through the "Immunomodulators" and “chemokine modules”.
All the experiments were conducted at least thrice. Data were analyzed using R 4.1.2 and GraphPad Prism software. Student's t-test was used to compare two groups of continuous variables. The Kruskal-Wallis and Wilcox tests were used for non-parametric tests. A P value < 0.05 indicated statistical significance.
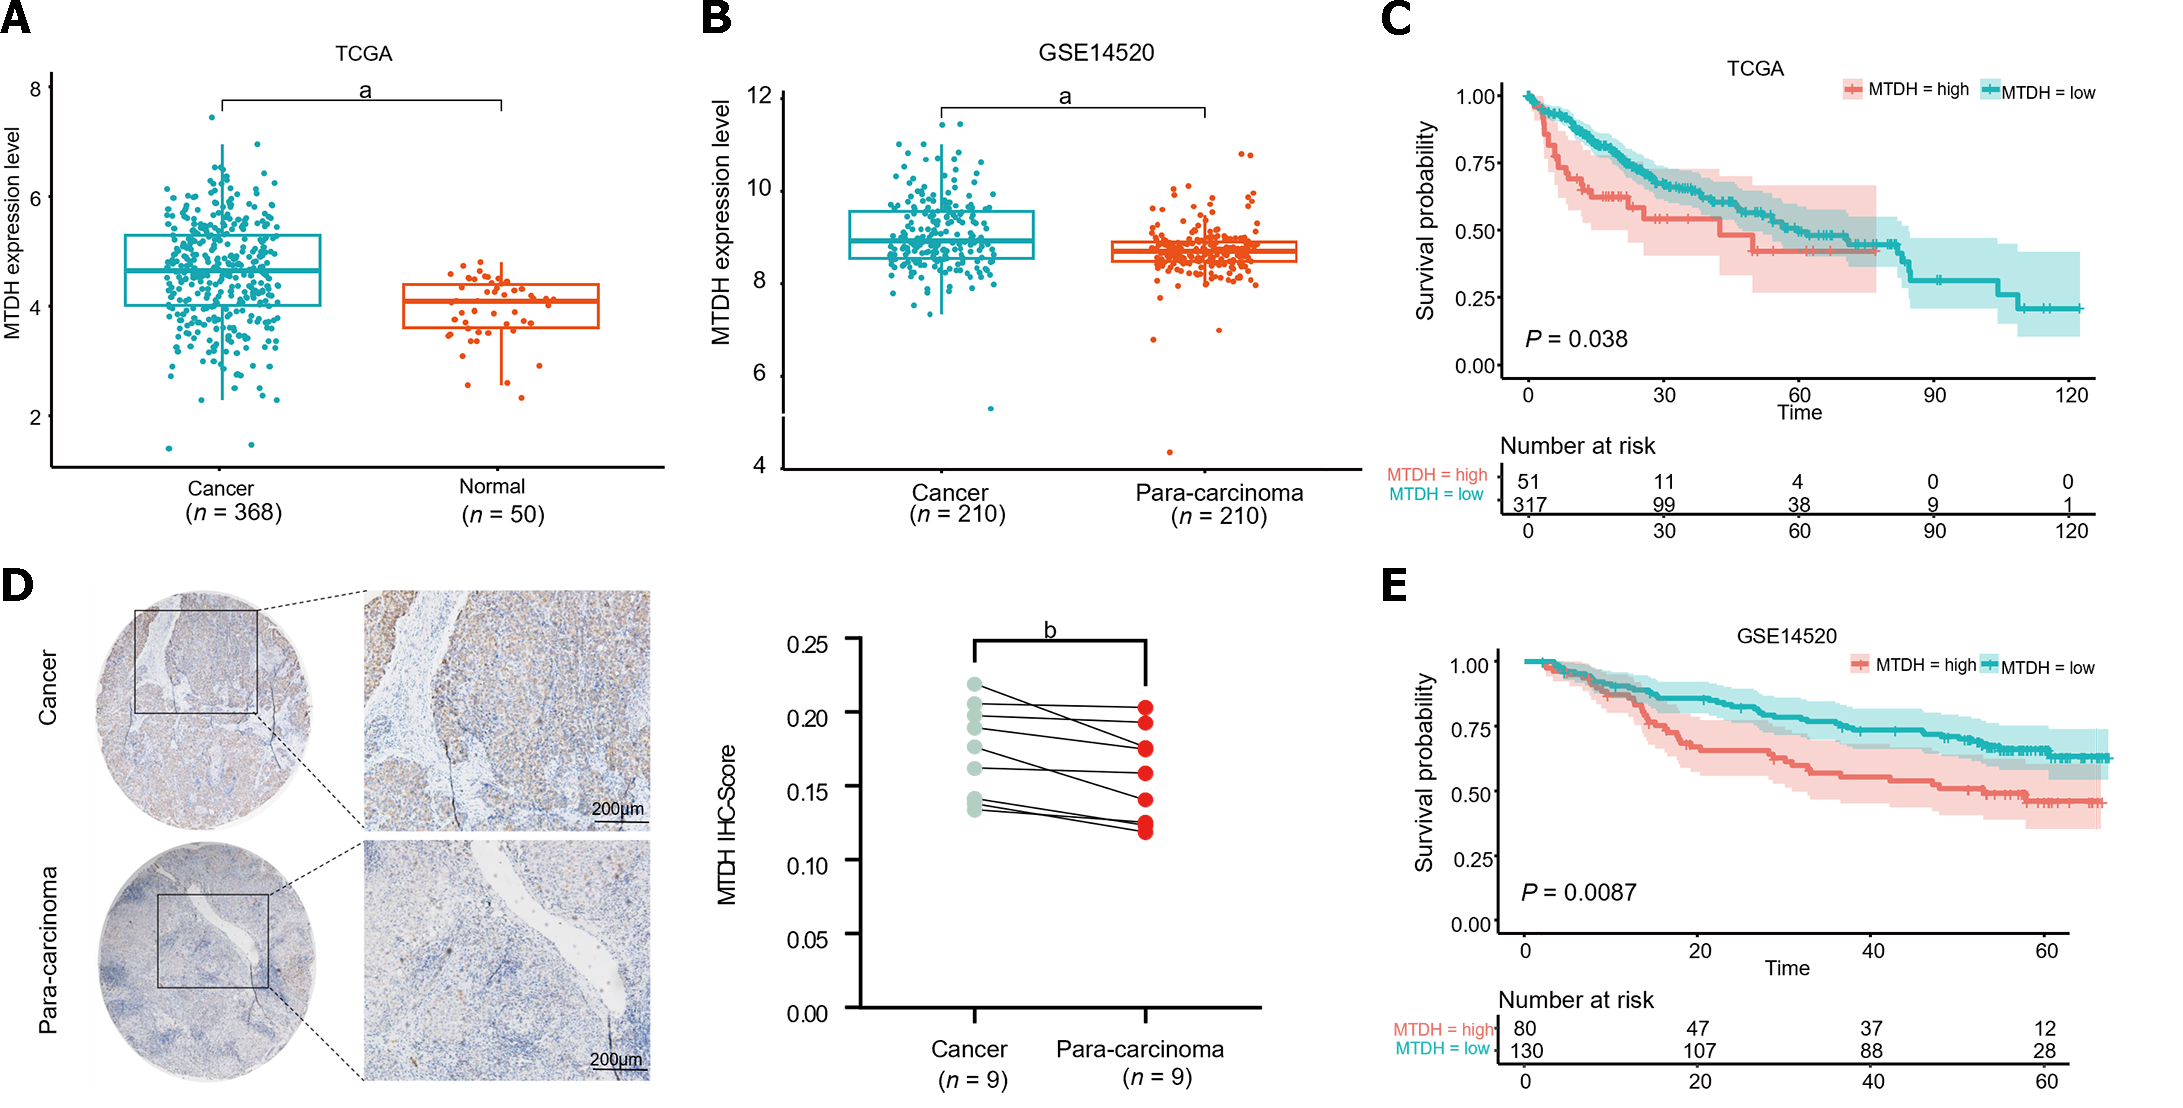
To identify aberrant MTDH expression in HCC, we downloaded microarray gene profiling data from GEO (GSE14520/GPL3921) and TCGA. In 50 normal liver tissues and 369 Liver cancer tissues from TCGA, MTDH mRNA expression was upregulated in liver tumor tissues. Similarly, MTDH expression was increased in the tumor in GSE14520 (n = 420; Figure 1A and B). MTDH expression was examined in human HCC (n = 9) and paracancerous tissues (n = 9) using IHC. According to these results, HCC tissues overexpressed MTDH, compared with the para-cancerous tissues (Figure 1C). Furthermore, we constructed the Kaplan-Meier curve of HCC using “Survival” and “Survminer” R packages. Shorter survival times were associated with higher MTDH (Figure 1D and E). A higher expression of MTDH was observed in liver cancer tissues than in normal liver tissues or para-cancerous tissues, which had impact on the prognosis of patients with liver cancer.
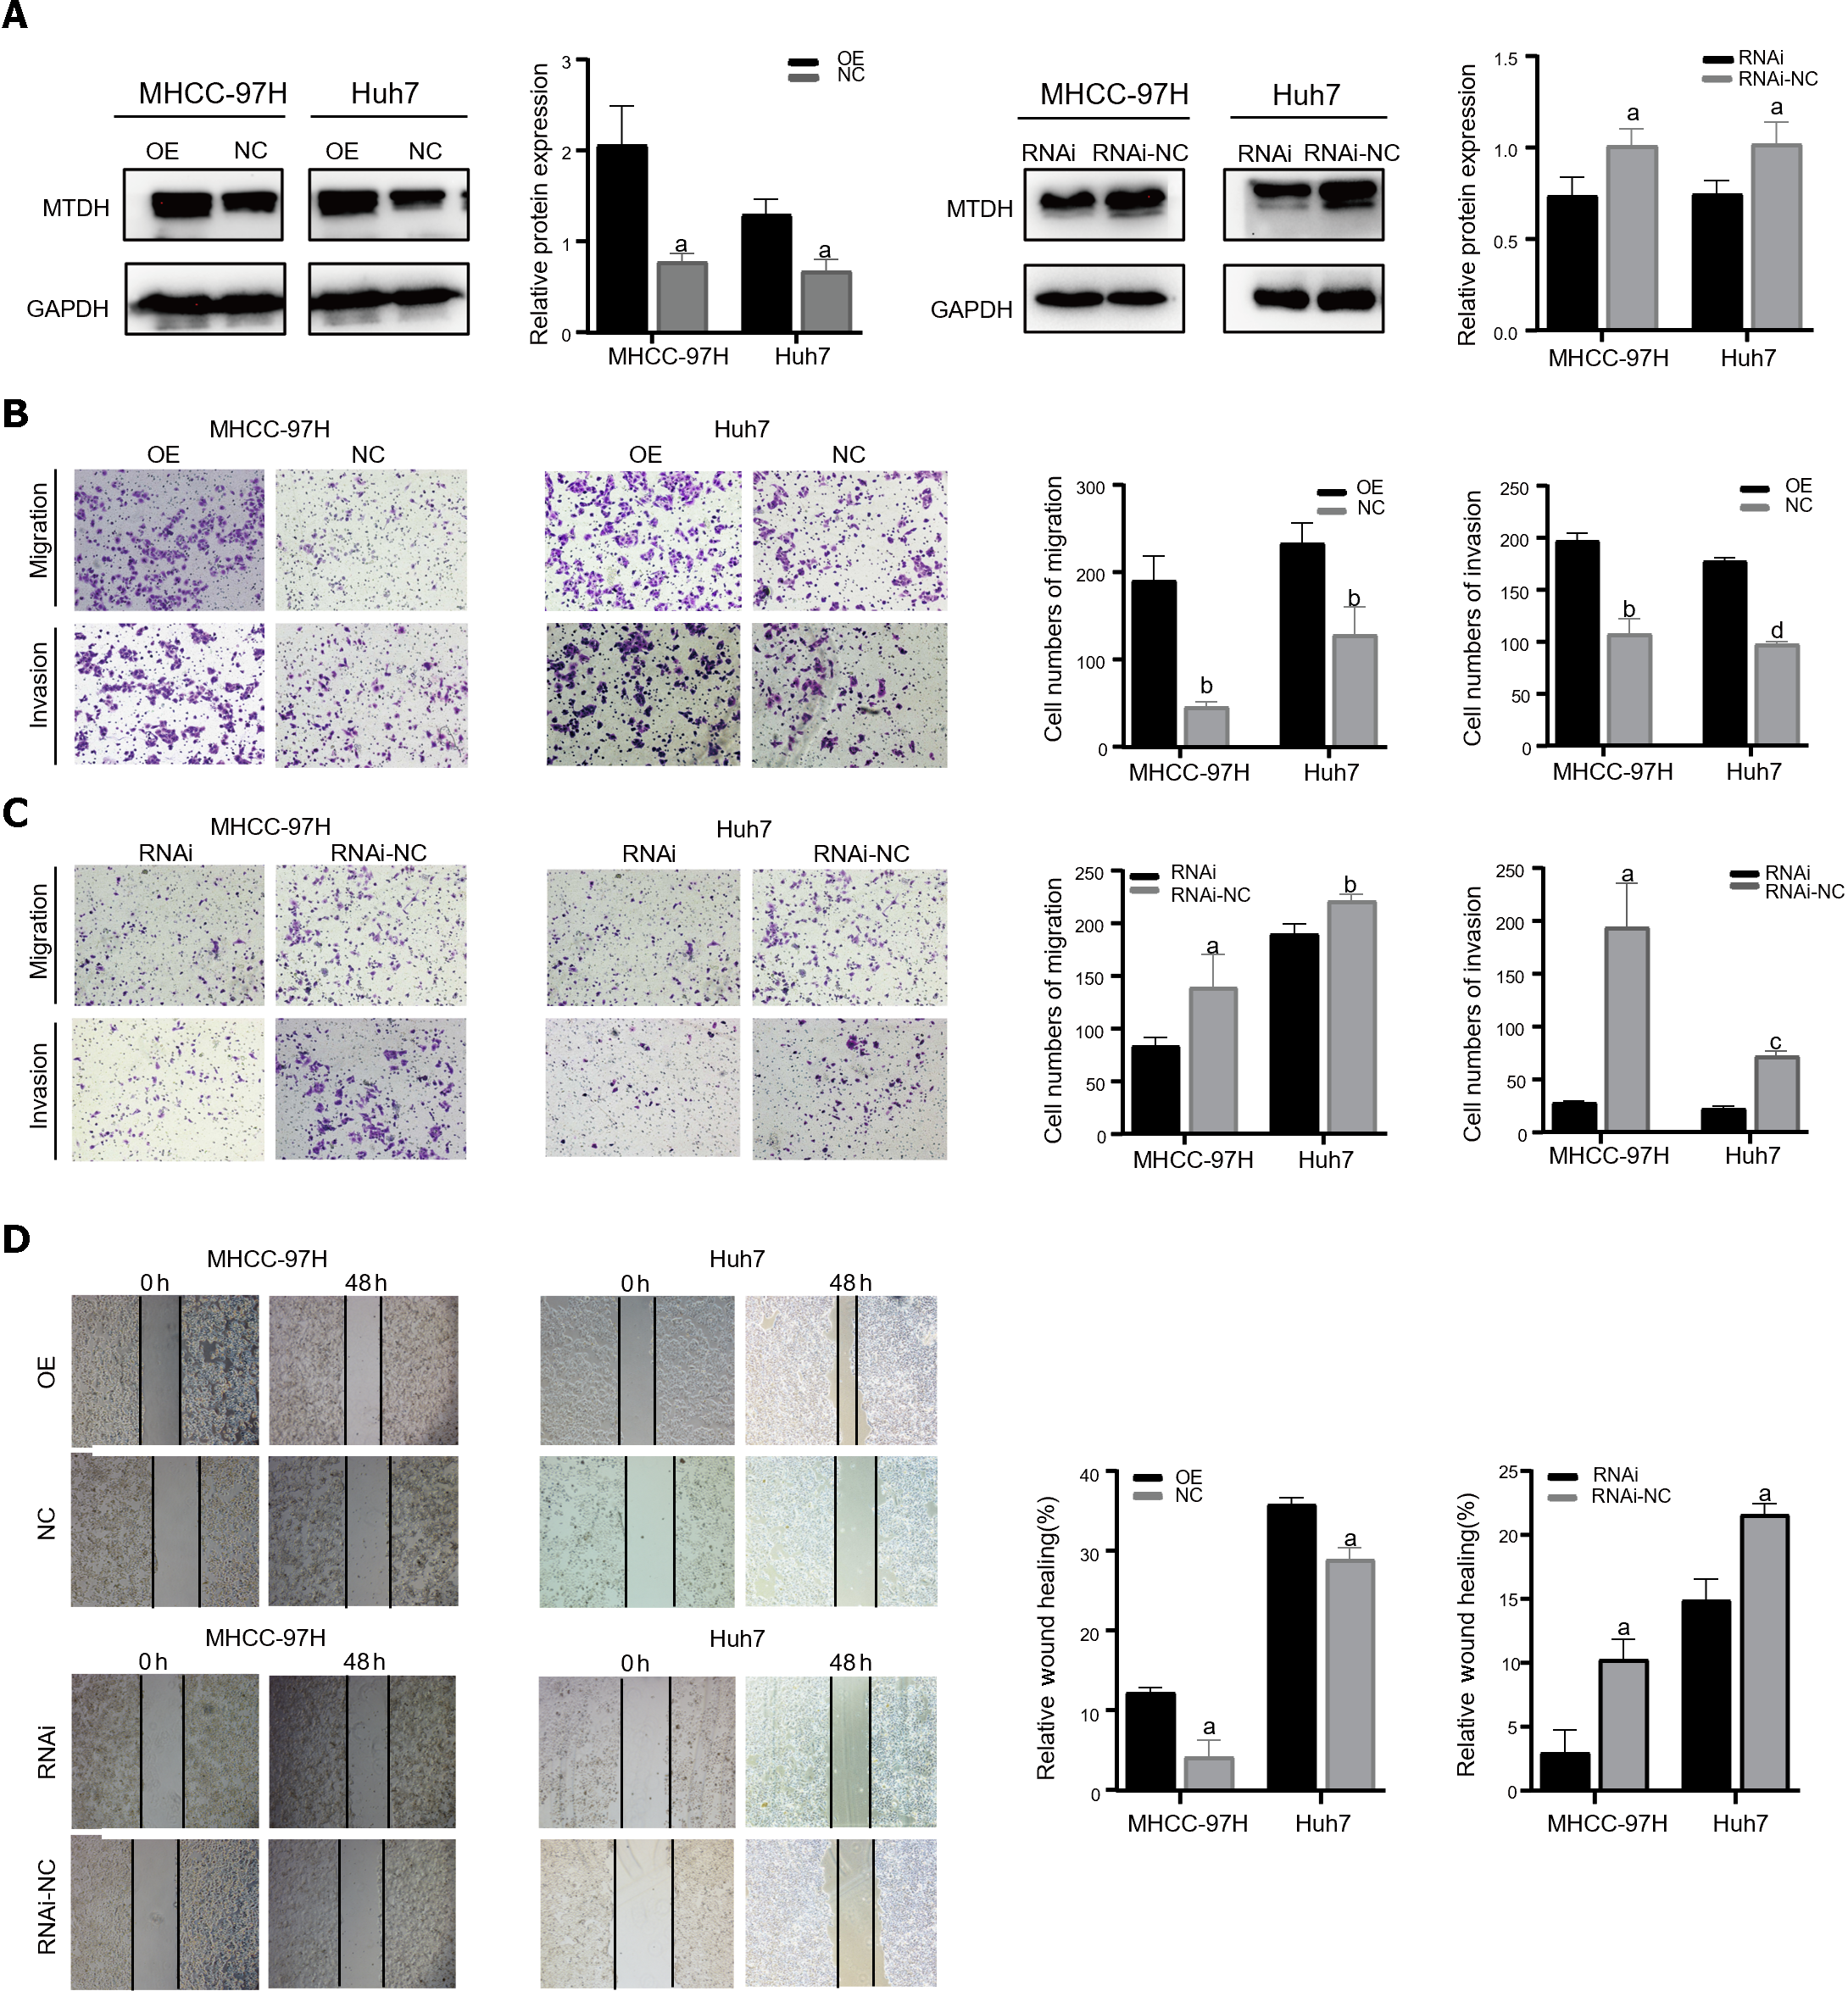
Two cell lines, Huh7 and MHCC-97H, were transfected with the related lentiviruses. Specifically, we used a blank control (LV-NC) vs overexpression (LV-OE) and a blank control (LV-NC) vs knockdown (LV-RNAi), to obtain stable overexpression and suppression of MTDH. Western blotting was performed to verify MTDH protein expression after transfection (Figure 2A). The migration and invasion assays showed that MTDH overexpression significantly accelerated the migration and invasion of MHCC-97H and Huh7 cells (Figure 2B). Conversely, MTDH knockdown cells exhibited lower potential for migration and invasion (Figure 2C). The wound healing assay confirmed that MTDH overexpression significantly promoted wound healing, whereas MTDH knockdown suppressed scratch wound healing in HCC cells (Figure 2D). These results indicate that high MTDH expression correlates positively with the migration and invasive abilities of HCC cells.
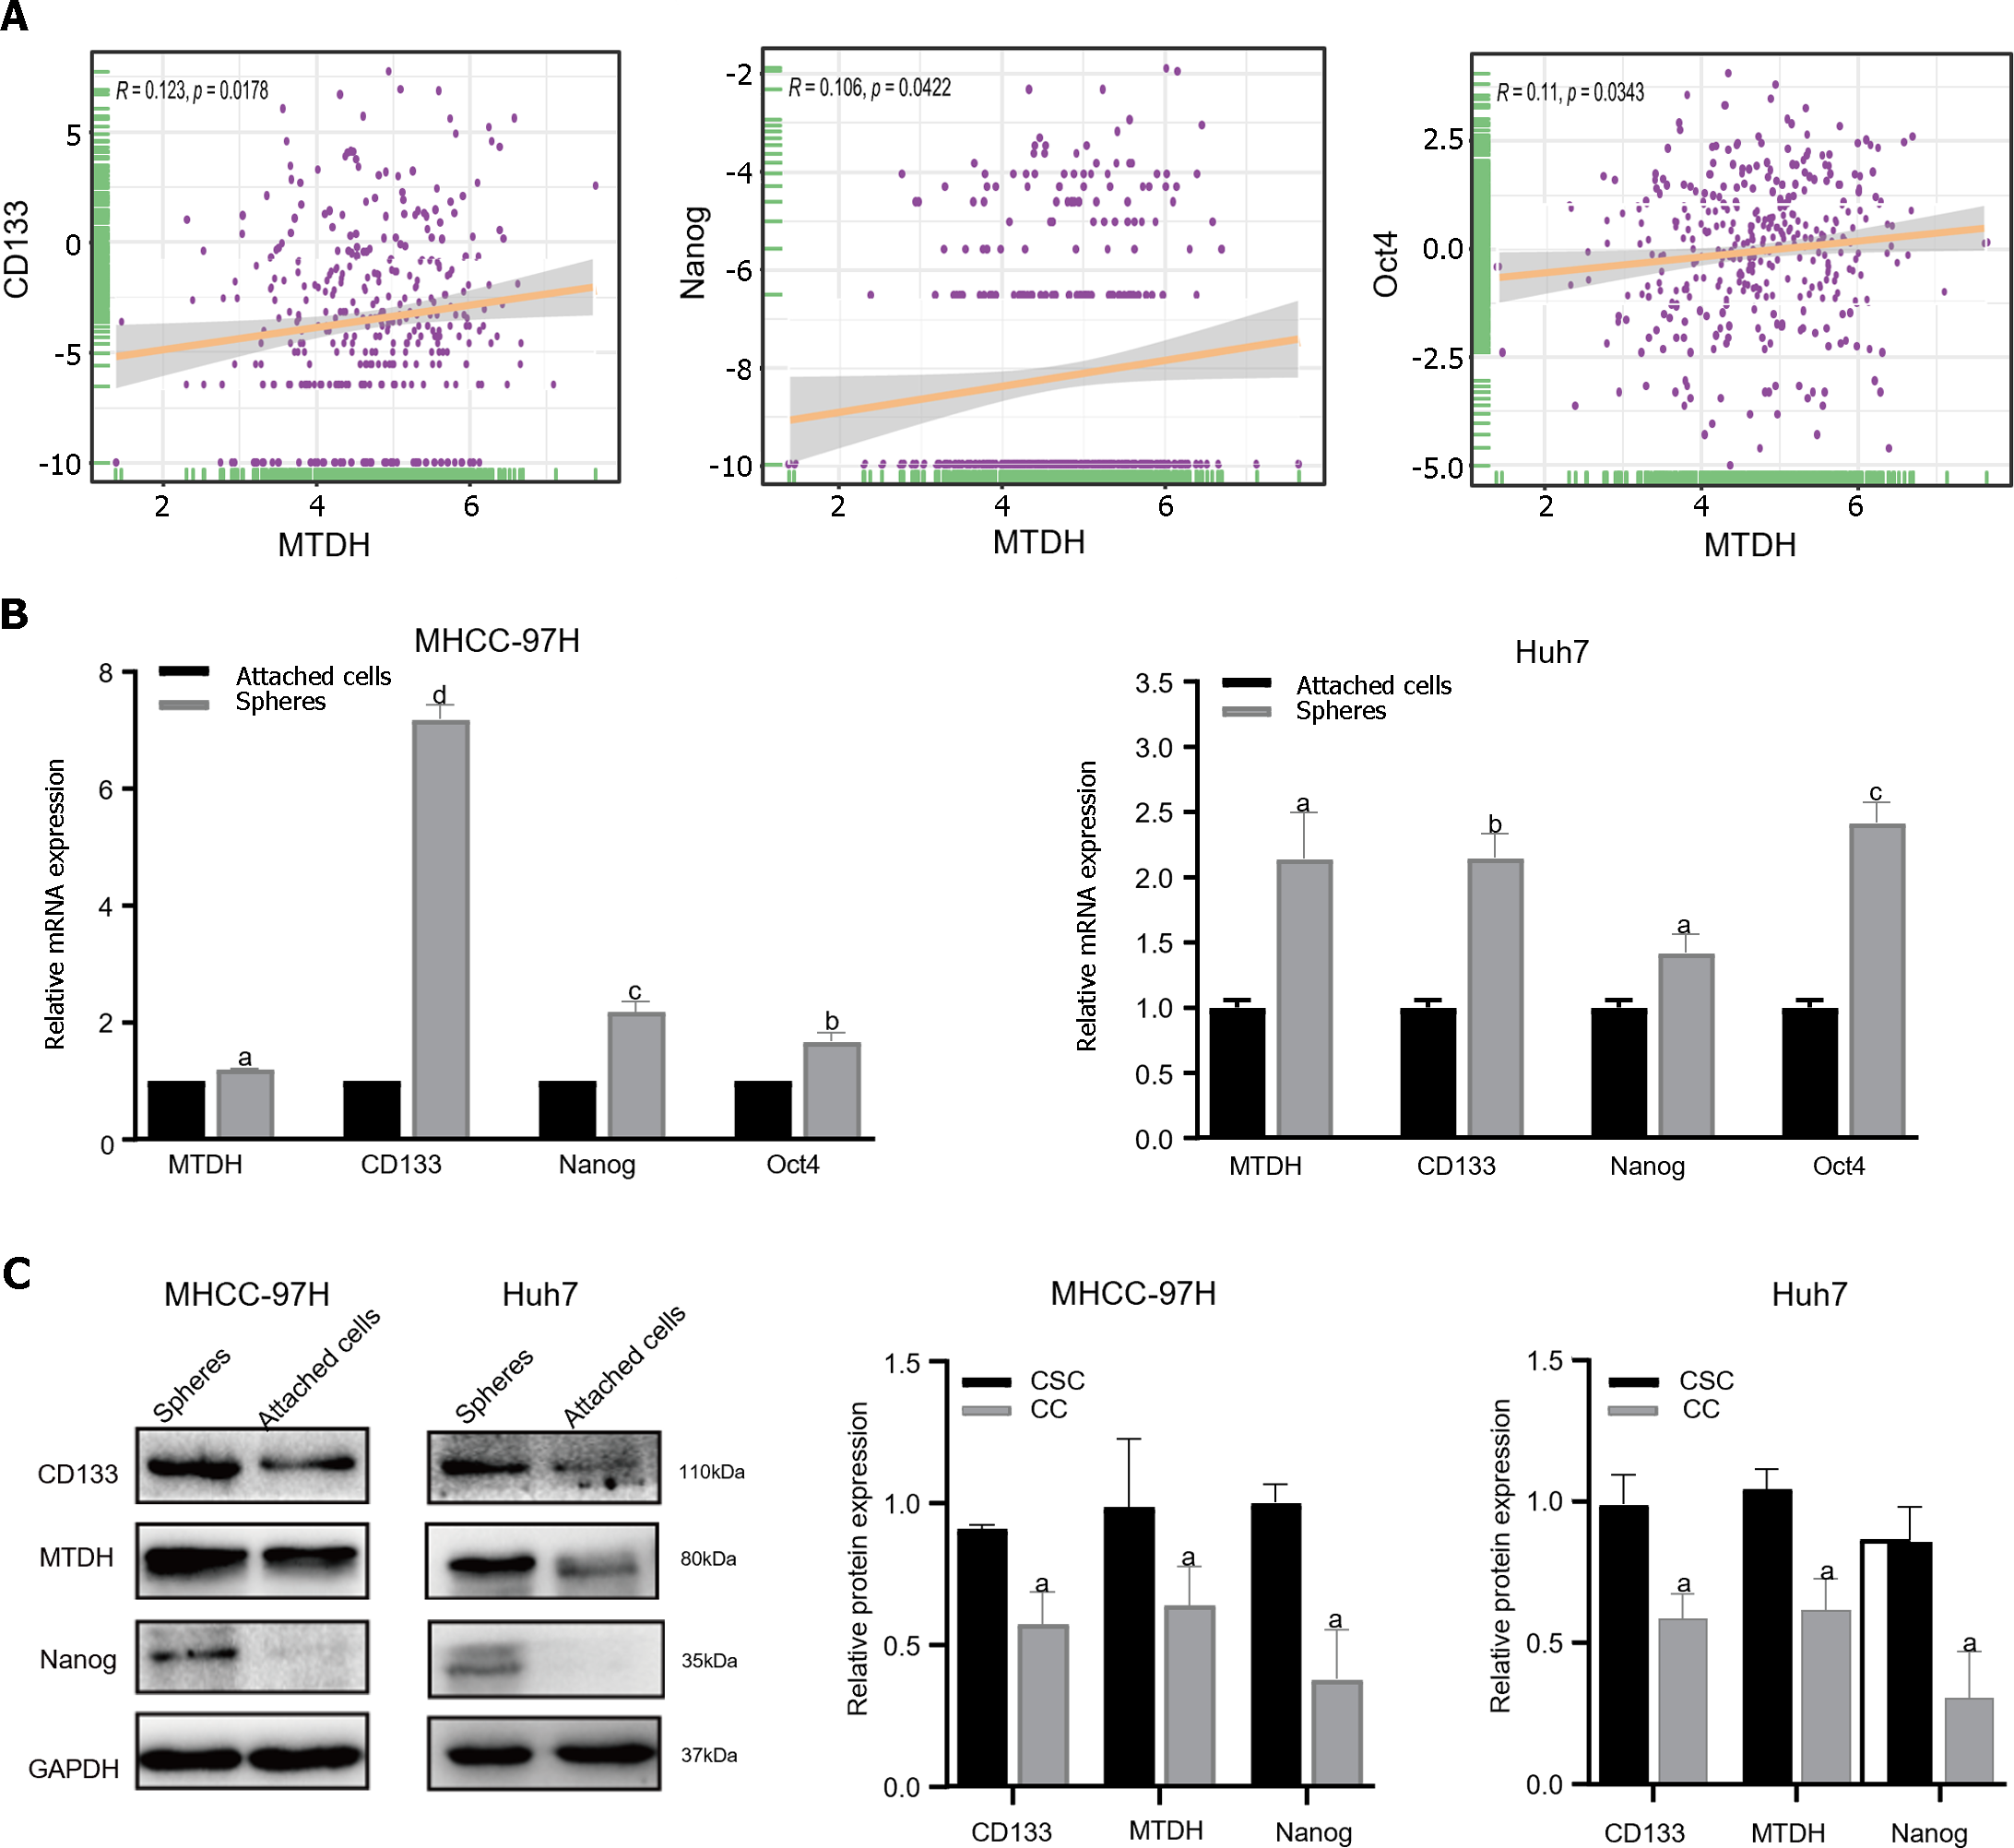
To determine whether MTDH is related to the stem cell phenotype, we examined MTDH and HCC stemness using TCGA database. TCGA data showed a significant positive correlation between MTDH expression in HCC tissues and CD133, NANOG, and Oct4 expression (n = 369; Figure 3A). Our previous research confirmed that liver CSCs (LCSCs) can be enriched using a serum-free stem cell medium to promote tumor sphere formation. Next, we performed SFM on MHCC-97H and Huh7 cells, followed by western blotting and qRT-PCR to determine MTDH expression in stem cell spheres and attached cells. Compared with liver cancer-adherent cells, LCSCs expressed increased mRNA levels of MTDH and the stem cell markers (CD133, Oct4, and Nanog; Figure 3B). The results showed that the protein expression levels of MTDH, CD133, and NANOG were higher than those in liver cancer adherent cells (Figure 3C). These results showed that MTDH was highly expressed in LCSCs.
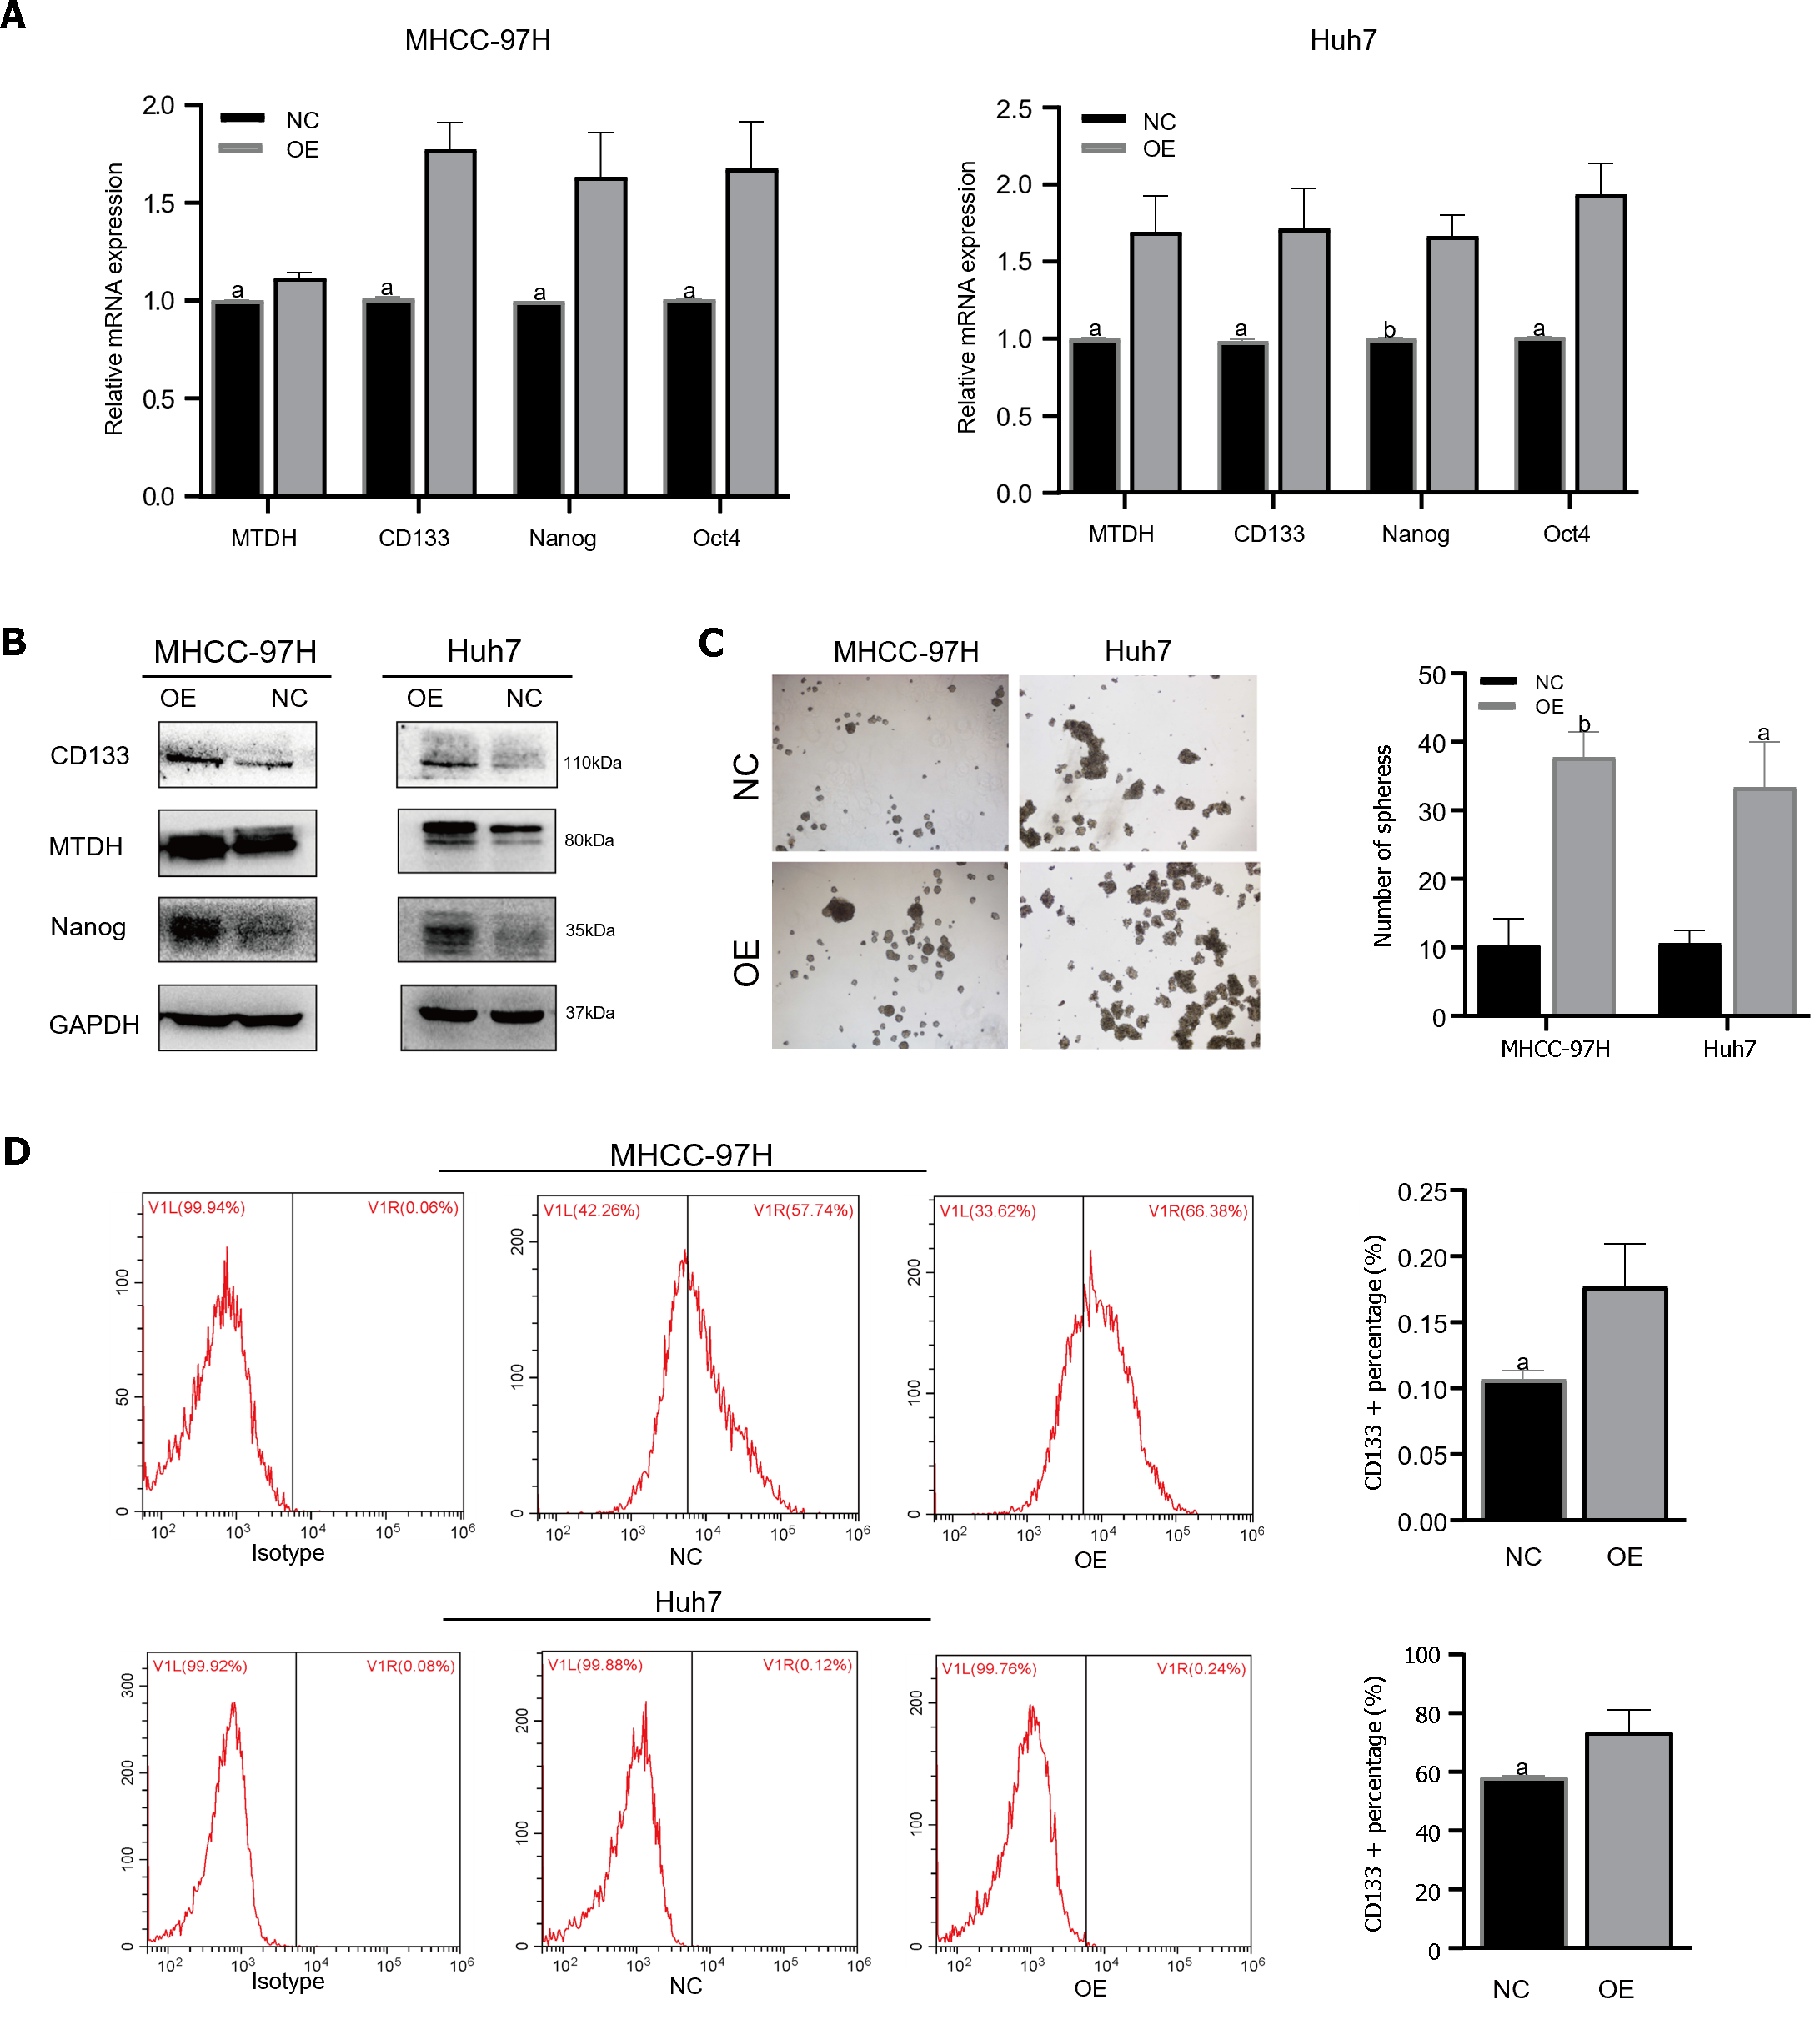
TTo confirm that MTDH maintained stem-like phenotypes in HCC cells, stem cell markers were detected in MHCC-97H and Huh7 cell lines overexpressing MTDH (CD133, Oct4, Nanog). Through PCR experiments, we demonstrated that the markers of CSCs markers were higher in MTDH-overexpressing cells than in the NC groups (Figure 4A). MTDH-overexpressing Huh7 and MHCC-97H cells also expressed high levels of CD133 and Nanog protein (Figure 4B). A The sphere culture assay showed the formation of more spheres in MTDH-overexpressing Huh7 and MHCC-97H cells than in control cells (Figure 4C). Flow cytometry revealed that MTDH overexpression effectively increased the number of CD133+ HCC cells (Figure 4D). In addition, MTDH overexpression effectively enhanced CSCs phenotypes in HCC cells.
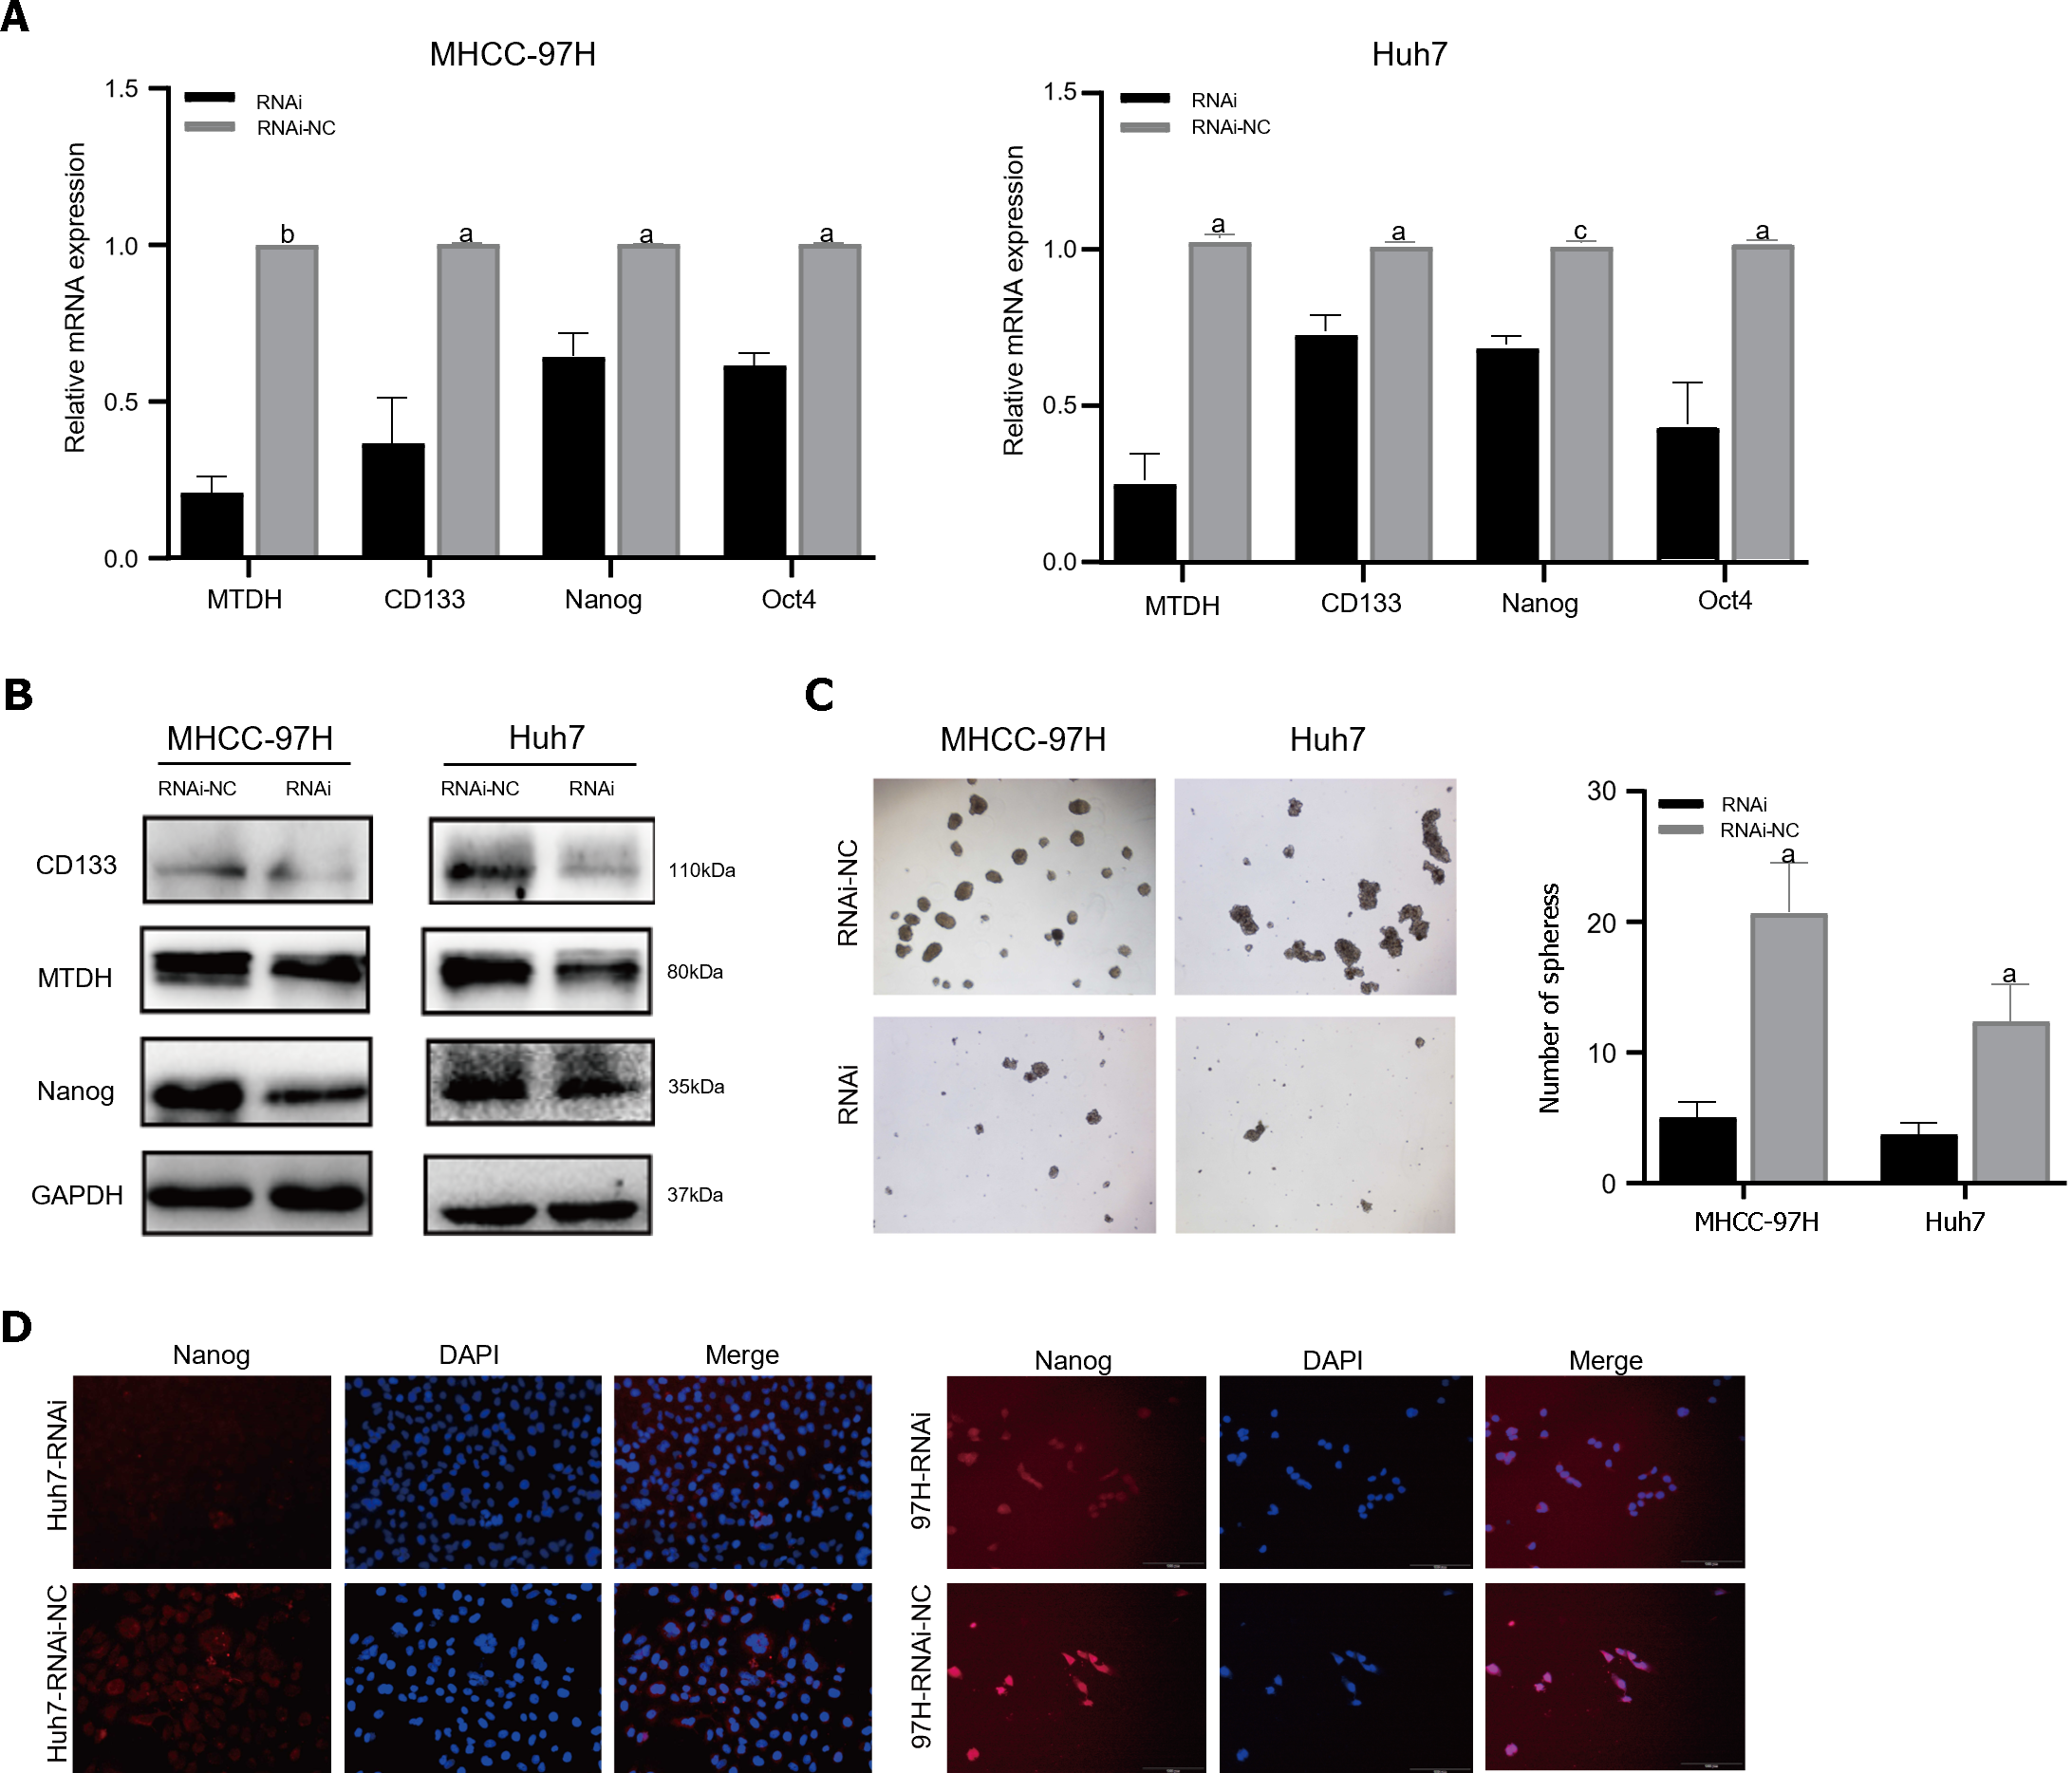
The PCR results demonstrated that the mRNA expression of stem cell markers in MTDH-RNAi cells was lower than that in the NC group (Figure 5A). In contrast to the NC group, MTDH-RNAi cells showed lower expression of CD133 and Nanog (Figure 5B). The downregulation of MTDH reduced the numbers of both MHCC-97H and Huh7 cell spheres, compared with those in the control LV-NC group, as indicated by the results of the sphere culture assay (Figure 5C). The results of the immunofluorescence showed that Nanog fluorescence intensity was greater in the NC group than in the MTDH-RNAi group (Figure 5D). Taken together, these results confirm that the inhibition of MTDH expression attenuates the acquisition of the HCC stem cell phenotype.
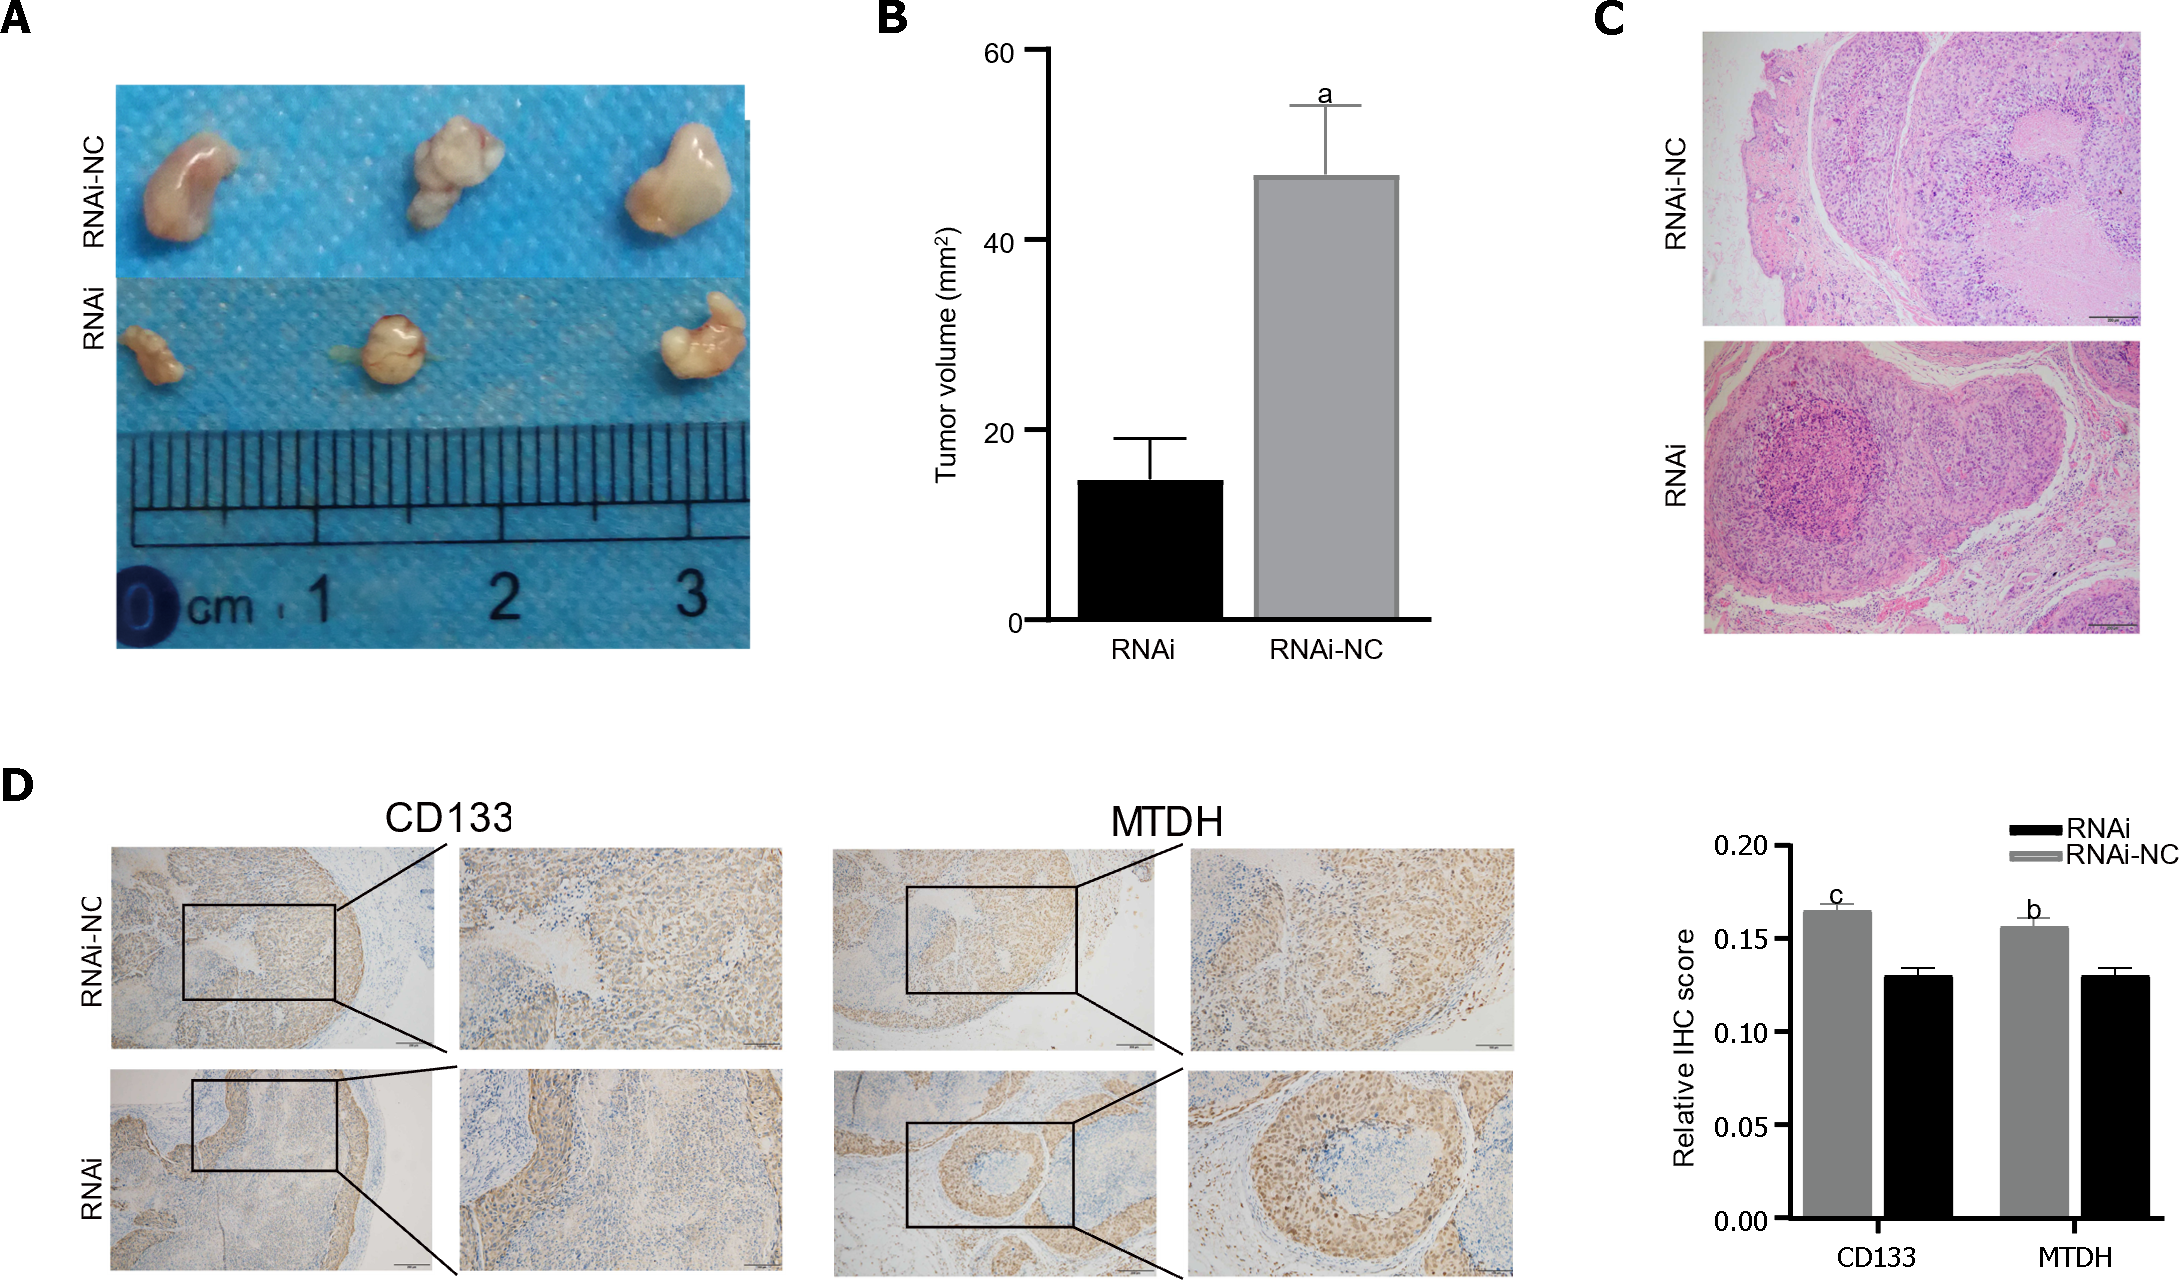
Male BALB/c nude mice were injected with LV-NC or LV-MTDH-RNAi MHCC-97H cells to evaluate the effect of MTDH on tumor growth. The MTDH-RNAi group exhibited a smaller tumor volume than the 97H-NC group, confirming that MTDH promotes tumor growth (Figure 6A and B). Images of hematoxylin and eosin-stained tumor tissues of nude mice are shown in Figure 6C. To further clarify the role of MTDH in the tumor stem cell phenotype, CD133 and MTDH proteins were detected by IHC in the tumor tissues of nude mice. We found that CD133 expression decreased with reduced MTDH expression (Figure 6D). Therefore, these results further suggest that MTDH overexpression promotes liver tumor growth and the CSCs phenotype.
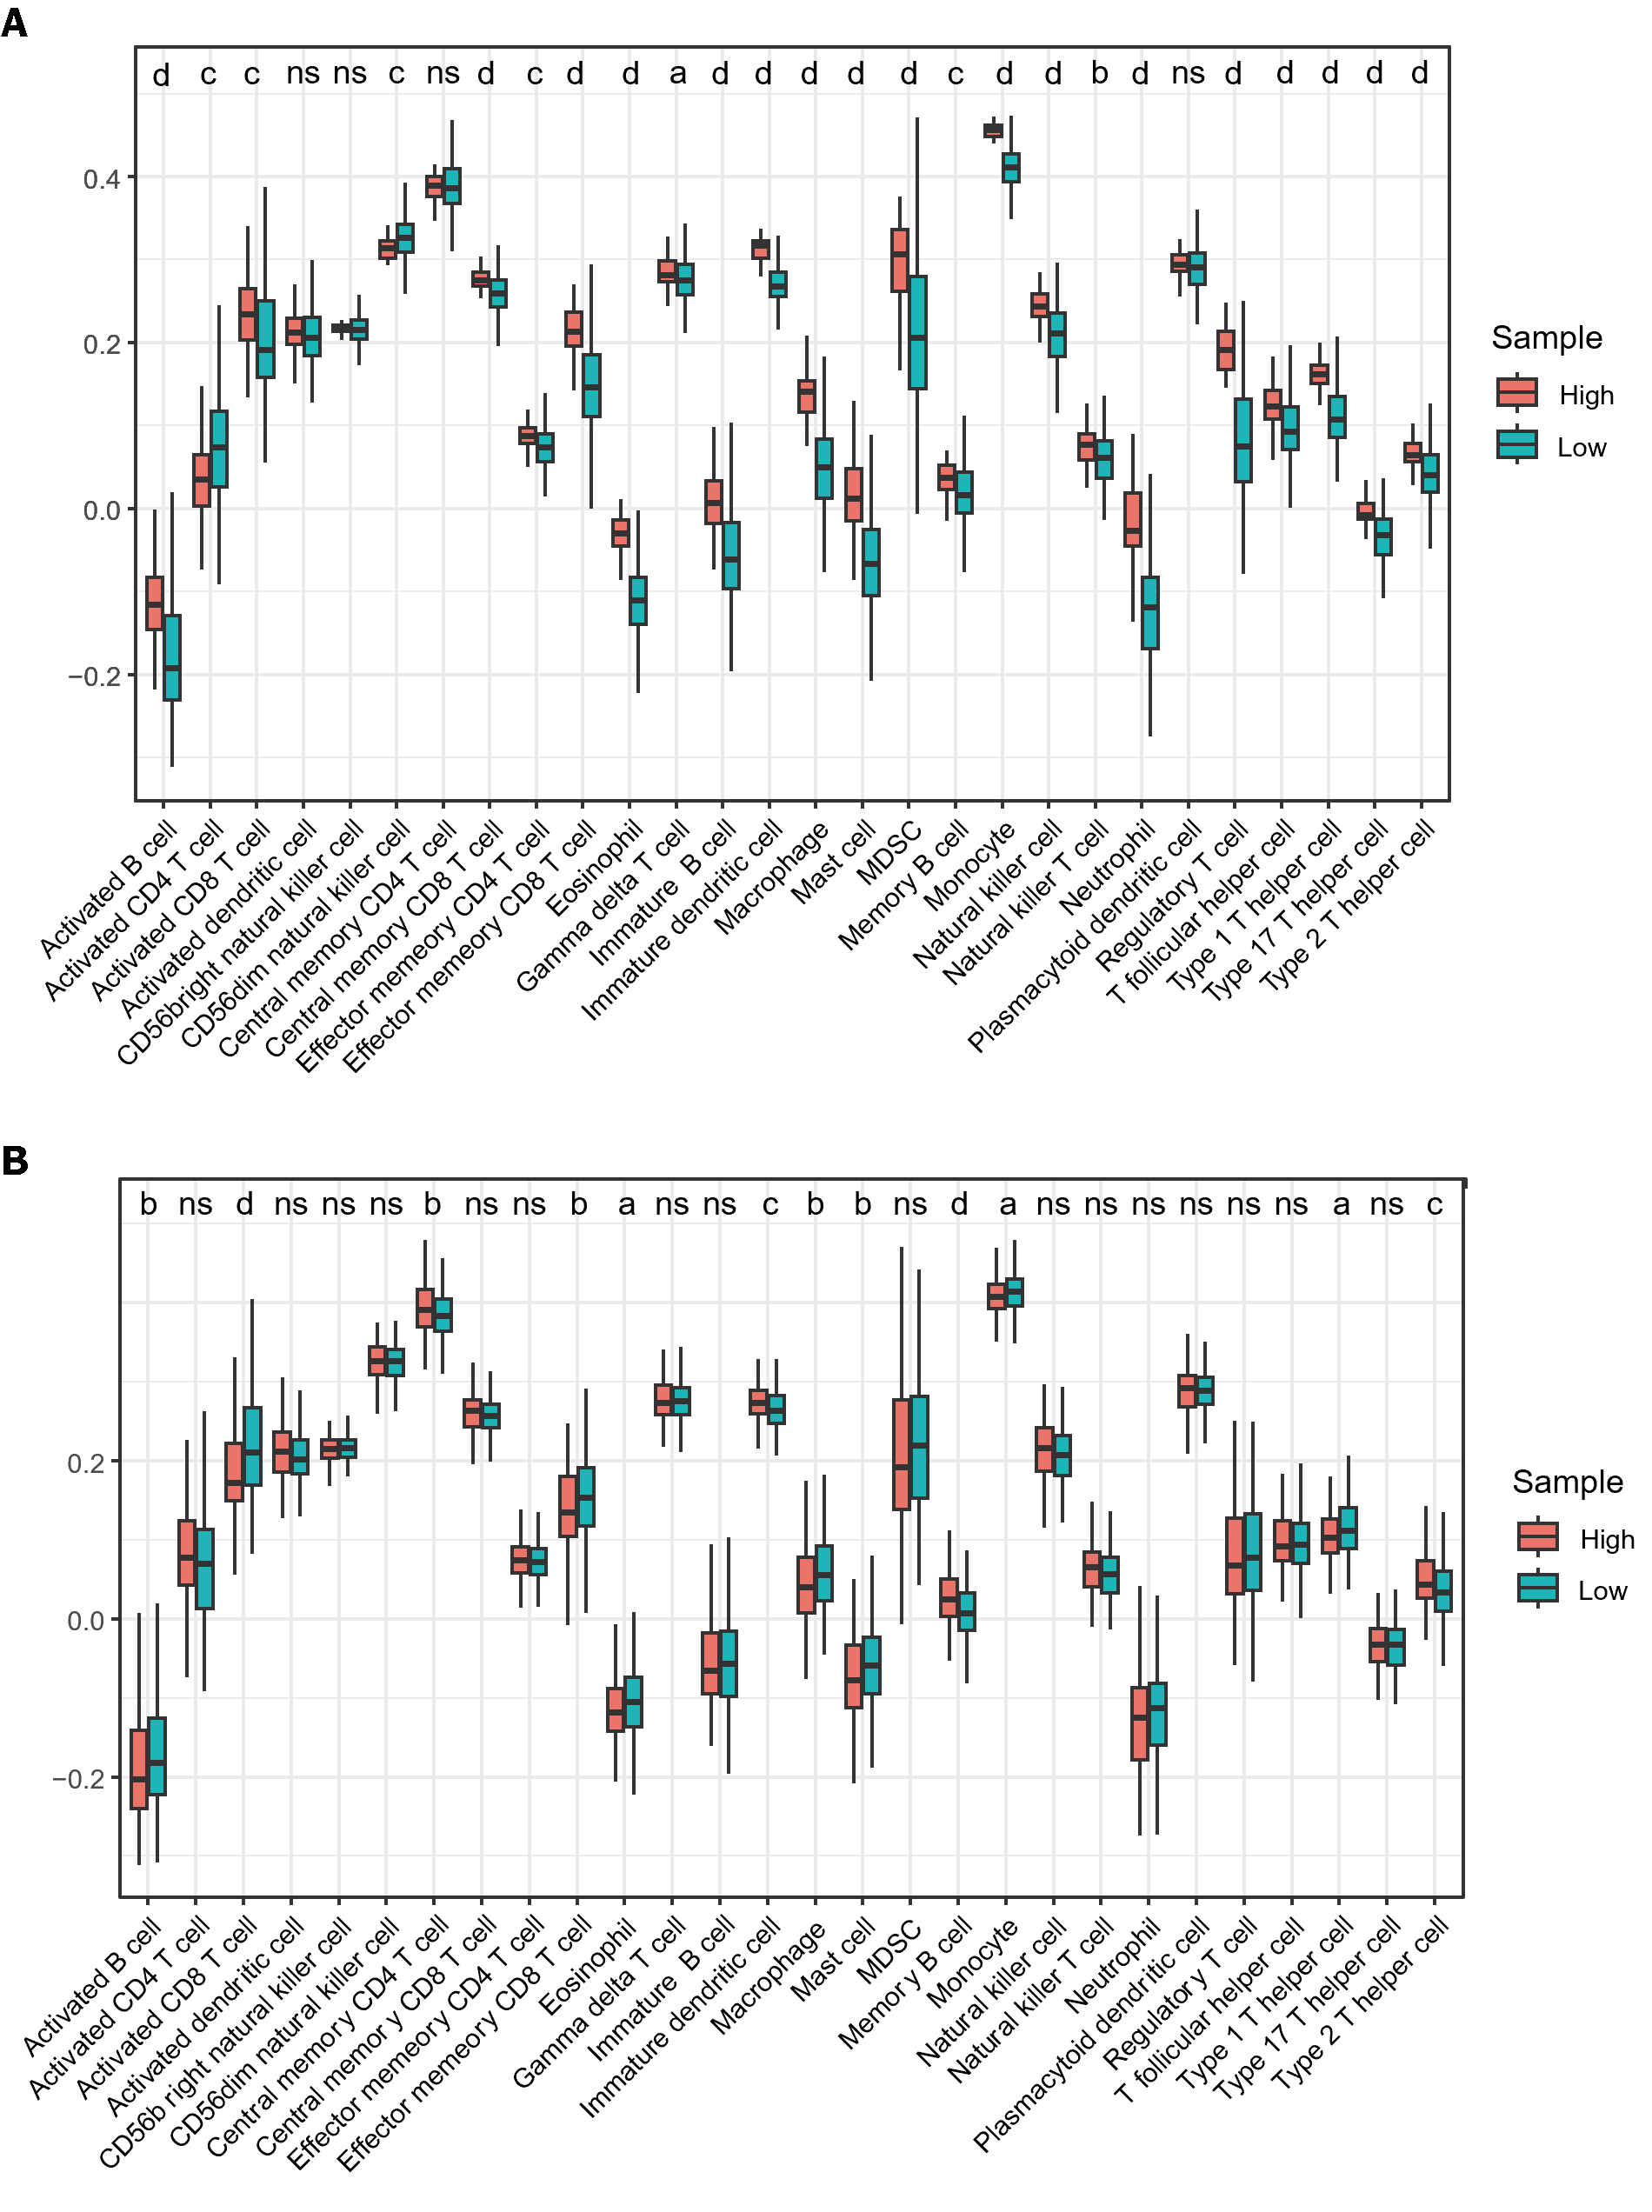
A significant association was observed between immune cell infiltration and survival in patients with HCC. Using ssGSEA, we quantified immune cell infiltration scores in HCC samples from TCGA to understand the relationship between MTDH and infiltration. Firstly, the results demonstrated a significantly higher infiltration of activated B cell, immature B, memory B, activated CD8 T, gamma delta T, effector memory CD8 T, central memory CD8 T, and effector memory CD4 T cells in healthy tissue than in HCC. Similarly, higher infiltration of eosinophils, immature DCs, myeloid-derived suppressor cells, monocytes, macrophages, mast cells, monocytes, neutrophils, NK cells, NK T cells, and T helper (Th) cells were observed in healthy tissue than in HCC (Figure 7A). These findings suggest that immune cells are essential in the progression of HCC. Based on the median MTDH expression, we divided the liver cancer samples in TCGA into high and low MTDH expression groups and assessed immune cell infiltration in both groups. Notably, the levels of memory B (P < 0.0001), immature dendritic (P < 0.001), Th2 (P < 0.001), and central memory CD4+ T (P < 0.01) cells were higher in the high MTDH expression group than that in the low group. In the low MTDH expression group, activated CD8 T cells (P < 0.0001), macrophages (P < 0.01), activated B cells (P < 0.01), effector memory CD8 T cells (P < 0.01), mast cells (P < 0.01), eosinophils (P < 0.05), monocytes (P < 0.05), and Th1 cells (P < 0.05) were significantly increased (Figure 7B).
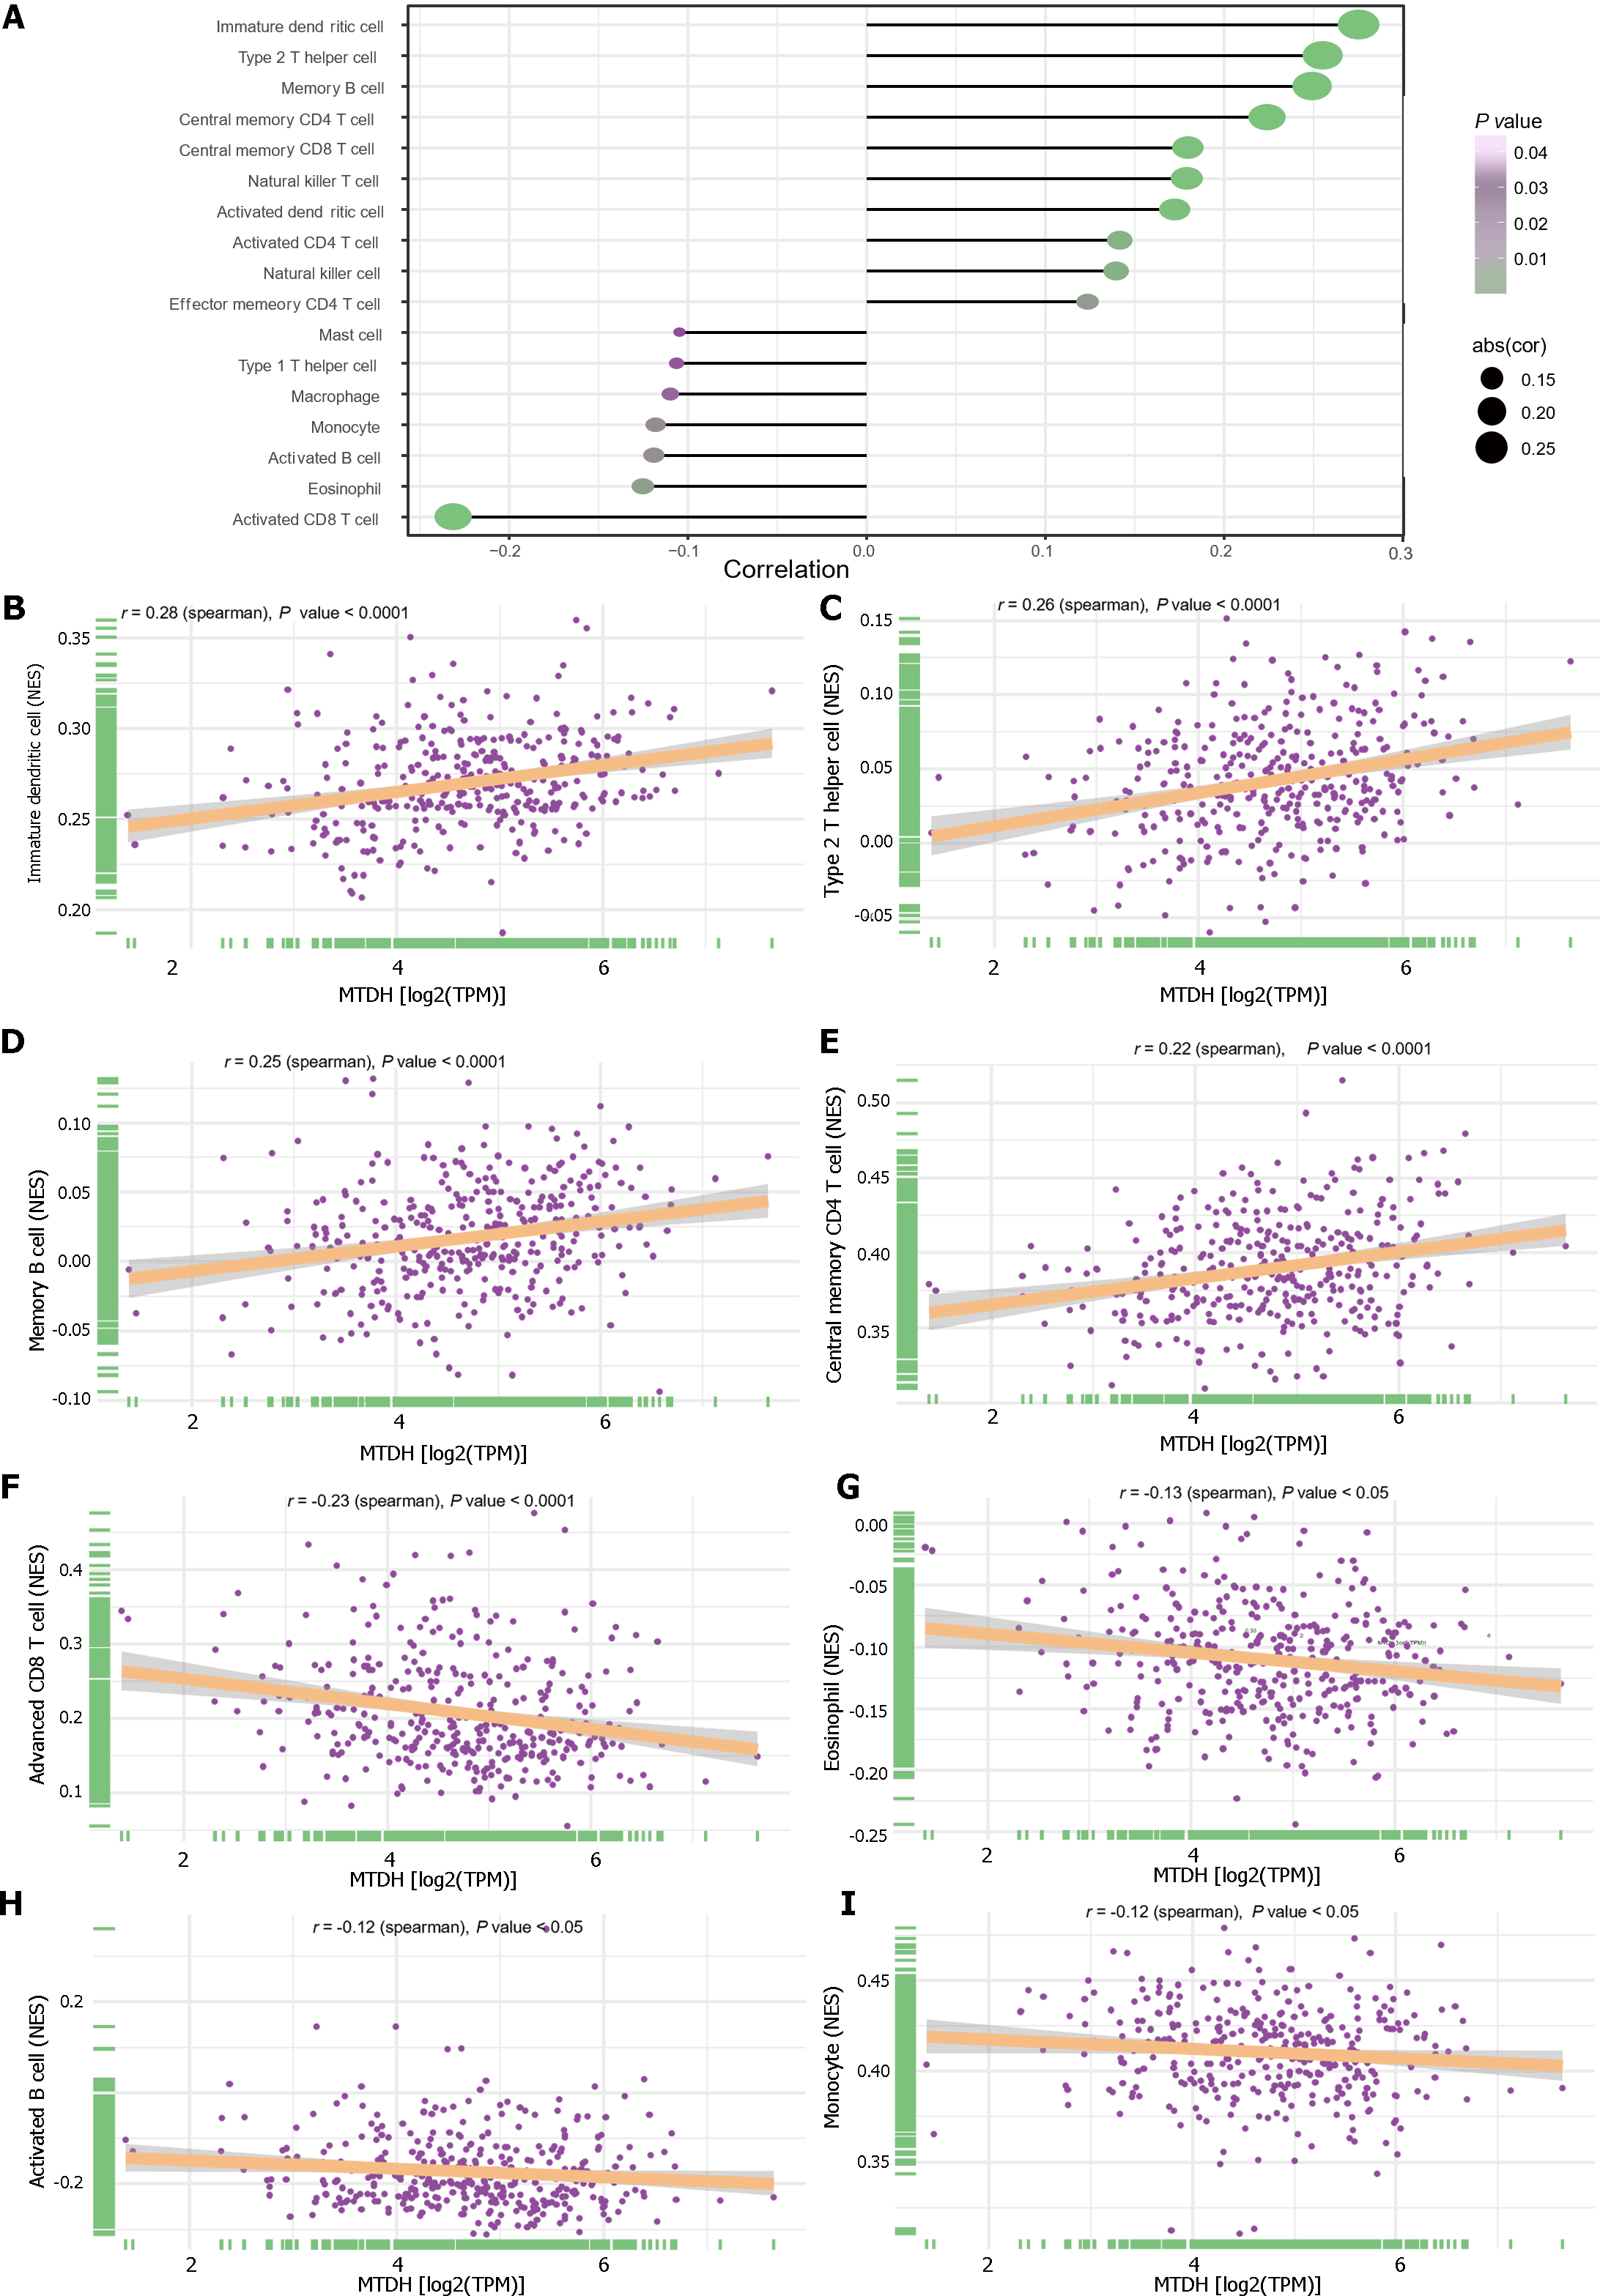
We examined the relationship between immune cells and MTDH expression (Figure 8A). Immature dendritic (r = 0.28, P < 0.0001; Figure 8B), Th2 (r = 0.26, P < 0.0001; Figure 8C), memory B (r = 0.25, P < 0.0001; Figure 8D), central memory CD4 T (r = 0.22, P < 0.0001; Figure 8E), central memory CD8 T, NK T, activated dendritic, activated CD4 T, and NK cells also showed a positive relationship with MTDH. Activated CD8 T cells (r = -0.23, P < 0.0001; Figure 8F), eosinophils (r = -0.13, P < 0.05; Figure 8G), activated B cells (r =-0.12, P < 0.05; Figure 8H), monocytes (r = -0.12, P < 0.05; Figure 8I), macrophages, and mast cells showed a negative correlation with MTDH.
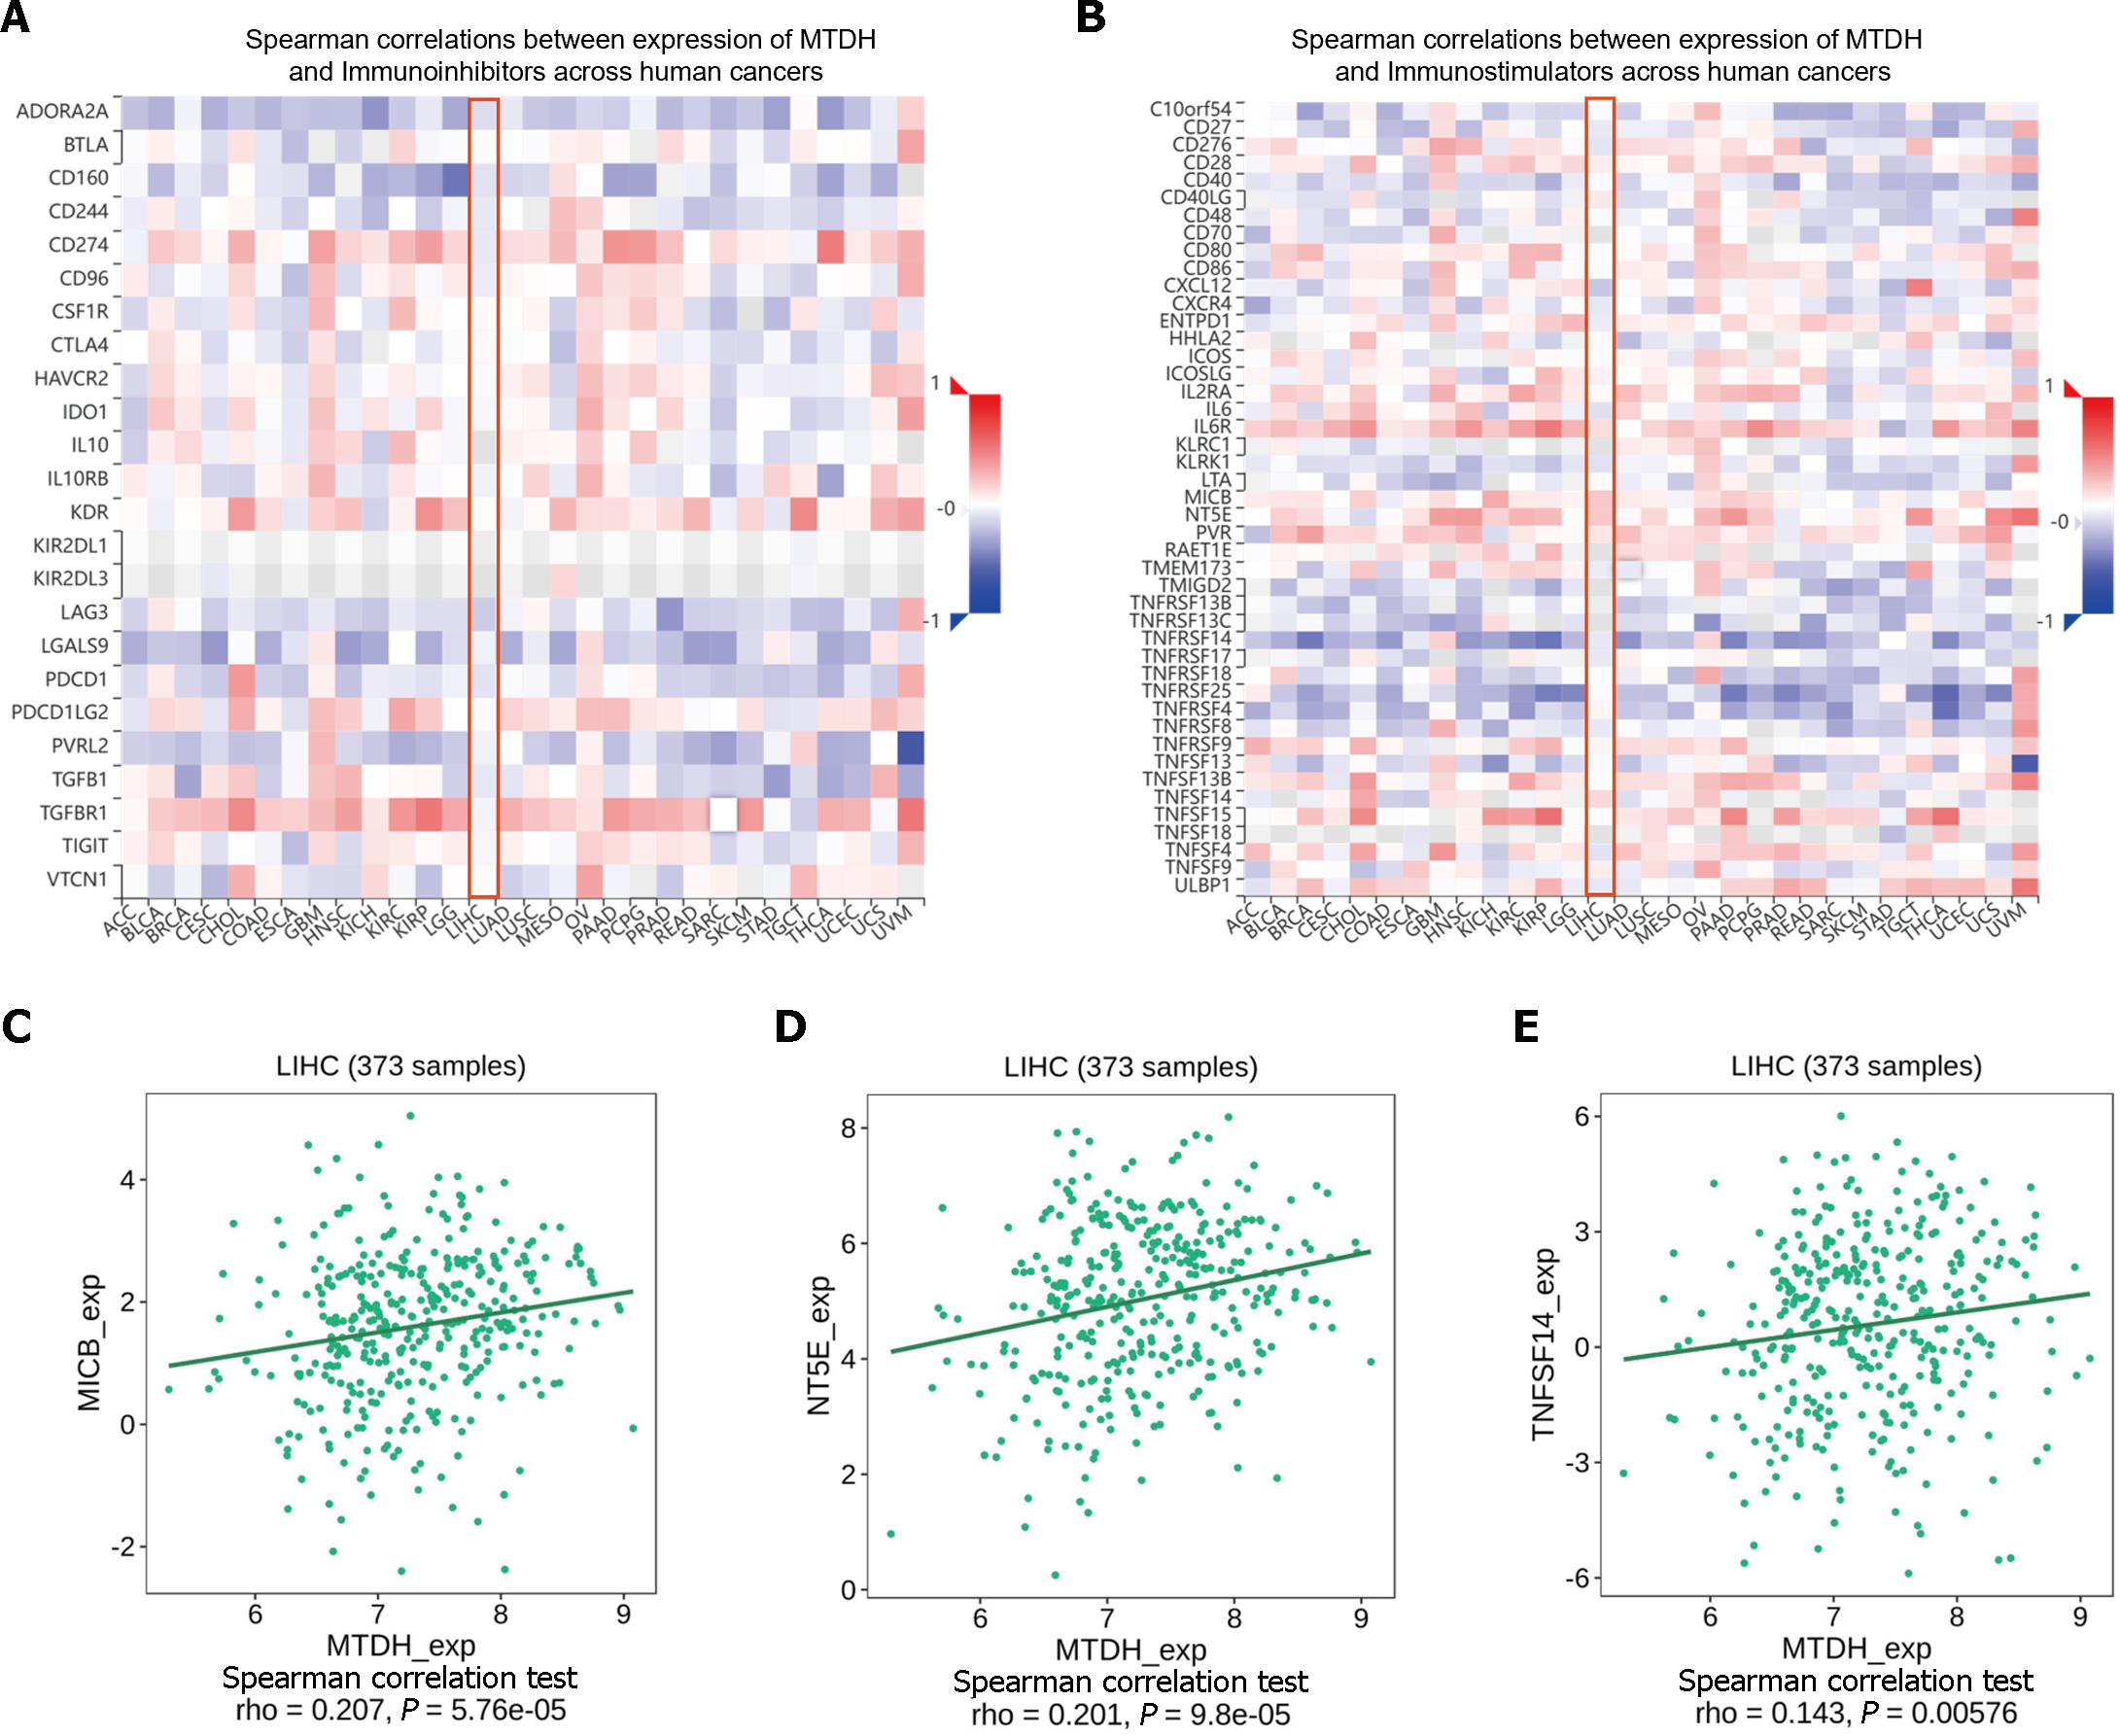
ICIs (immune checkpoint inhibitors) are gaining increasing attention as tumor immunotherapy strategies for different types of cancers, facilitating improved prognosis in some patients. MTDH and the various immunosuppressive agents in the TISIDB database did not show significant correlation, as indicated by our online analysis (Figure 9A). However, in the analysis of correlation with immunostimulants (Figure 9B), a positive correlation was found between MTDH and MICB (r = 0.207, P = 5.76 × 10⁻⁵; Figure 9C), NT5E (r = 0.201, P = 9.8 × 10⁻⁵; Figure 9D), and TNFSF14 (r = 0.143, P = 0.00576; Figure 9E). Based on these results, MTDH may be involved in the regulation of tumor immunity.
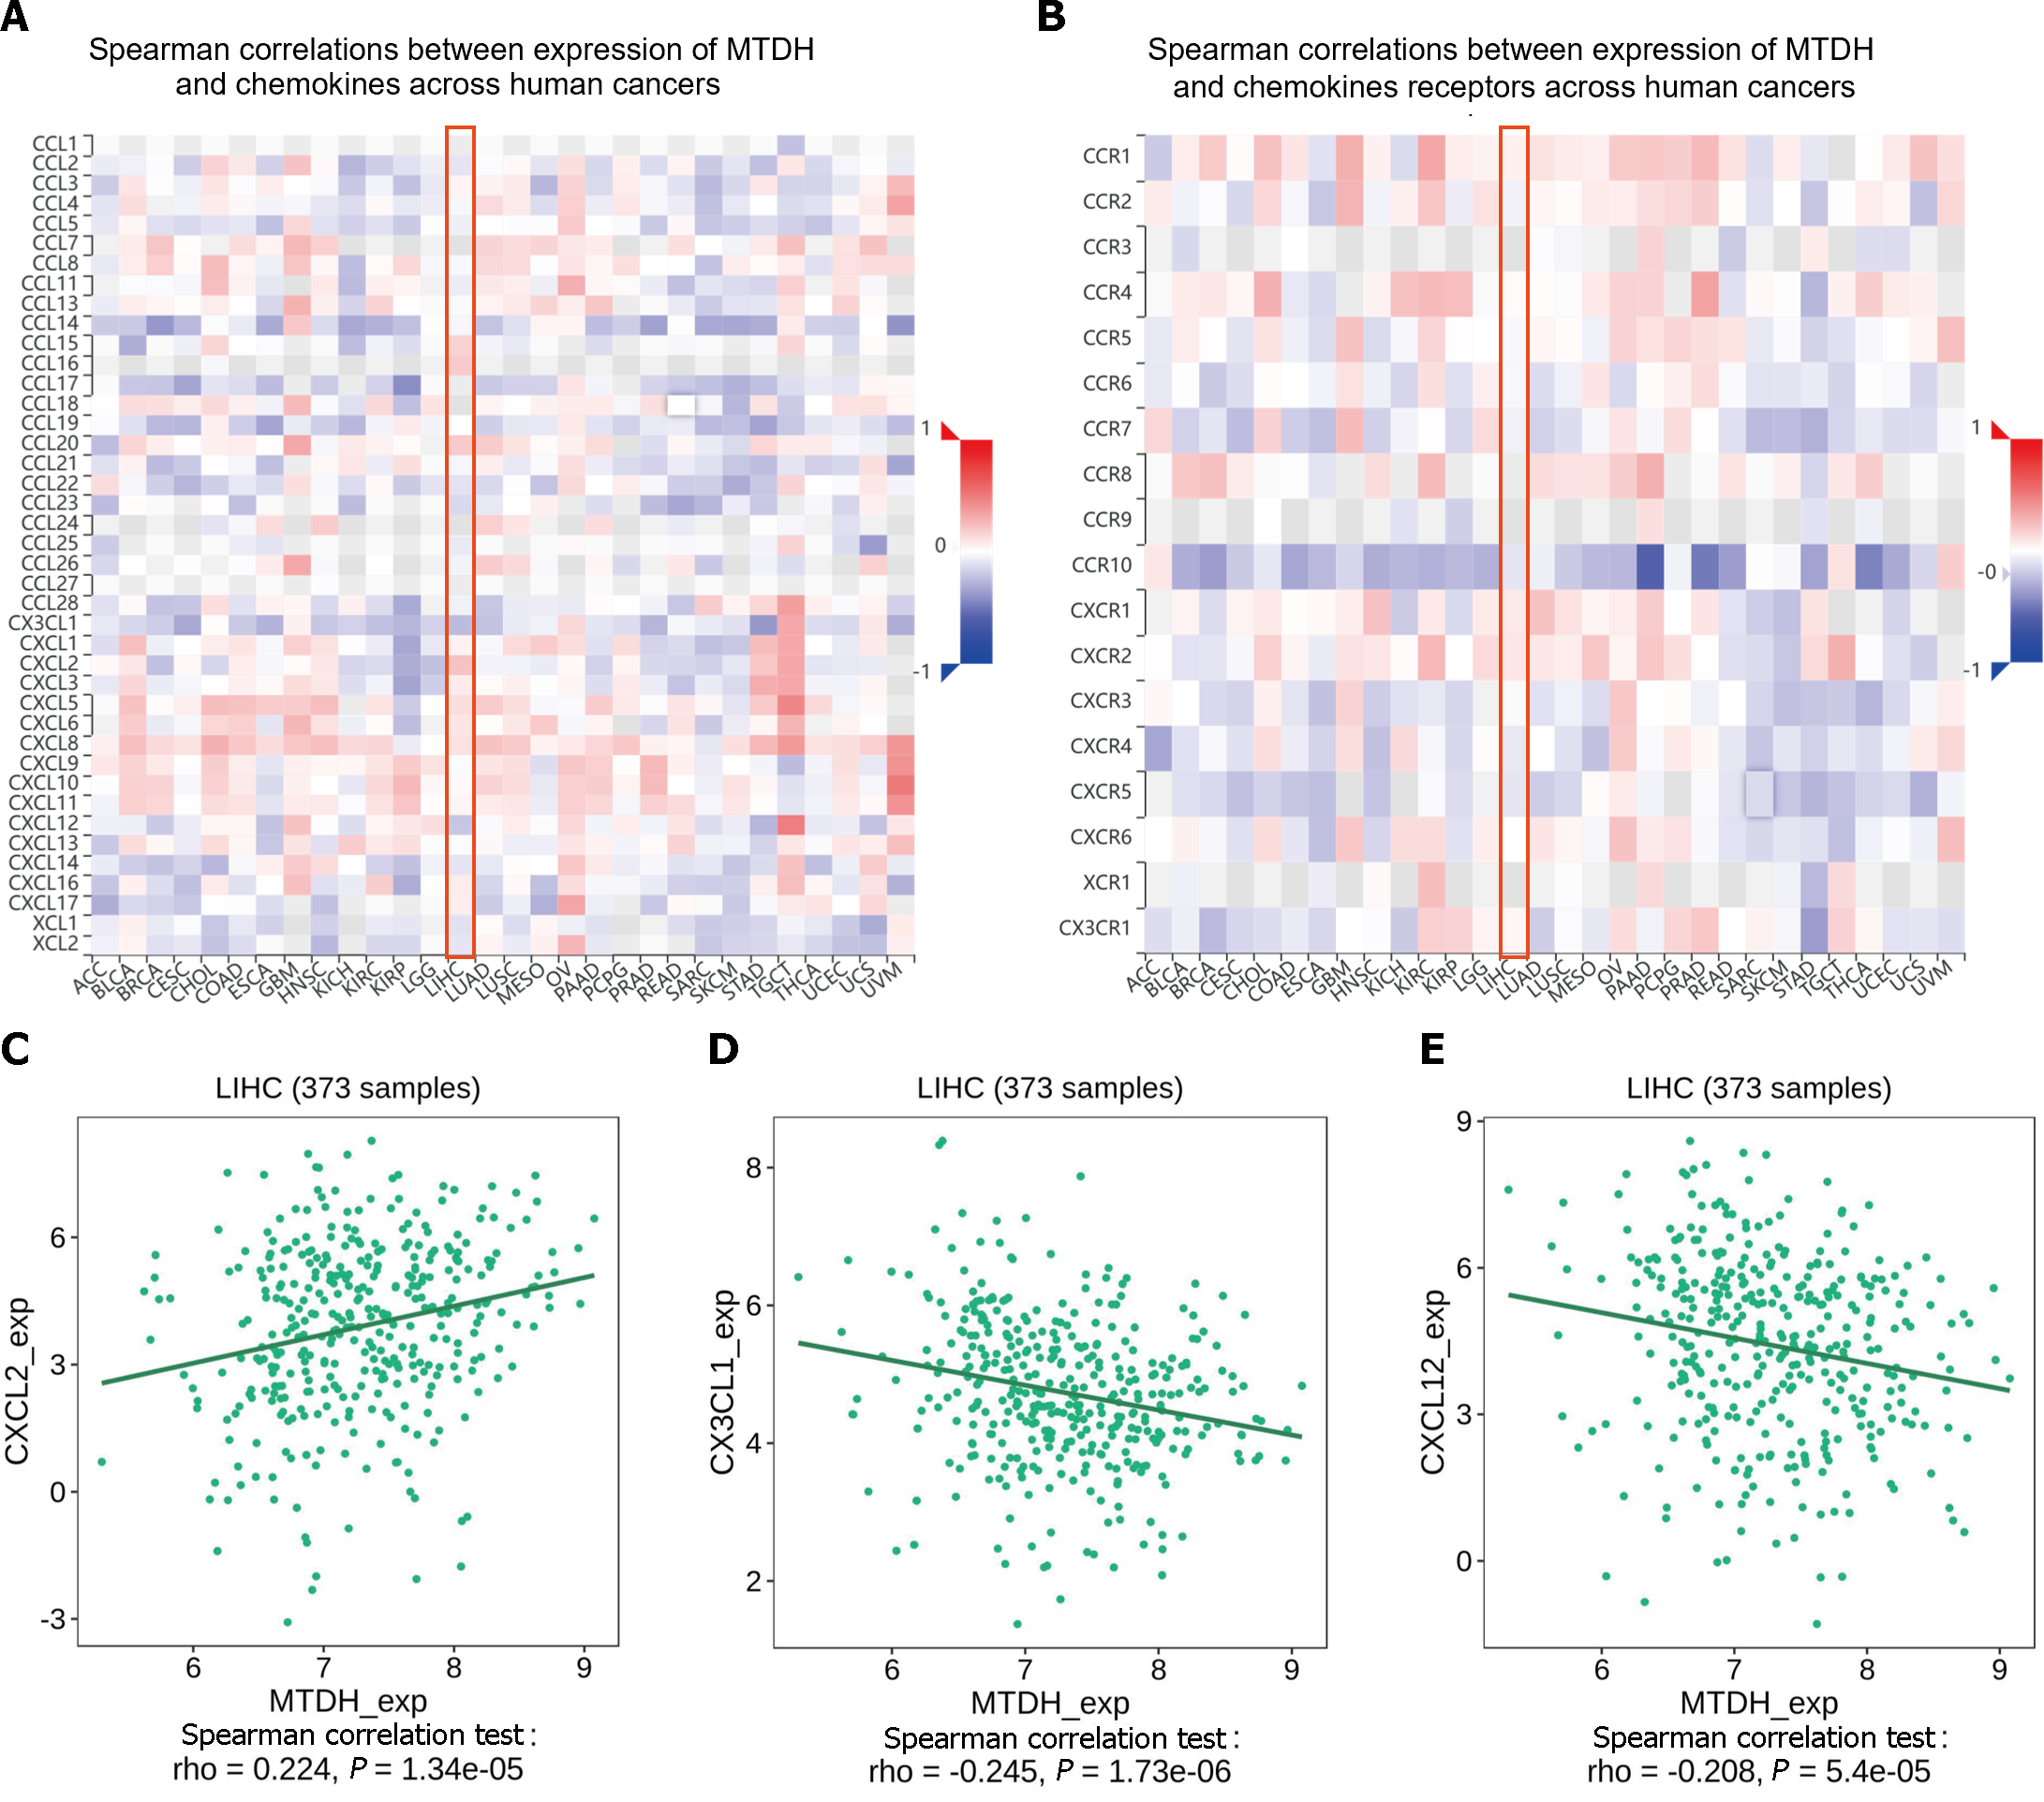
Chemokines and their receptors induce cell migration. The expression of MTDH correlated with that of chemokines and receptors in immune cells, based on the data from the TISIDB database (Figure 10A and B). In HCC, MTDH expression positively correlated with CXCL2 (r = 0.224, P = 1.34 × 10⁻⁵; Figure 10C) and negatively correlated with CX3CL1 (r = 0.245, P = 1.73 × 10⁻⁶; Figure 10D) and CXCL12 (r = 0.208, P = 5.4 × 10⁻⁵; Figure 10E). However, MTDH expression was not significantly correlated with chemokine receptor expression.
This study demonstrated that MTDH expression was higher in HCC tissues than in normal liver tissues and was associated with shorter survival time, stronger migration, and invasive ability. This study also focused on the effects of MTDH on stemness acquisition and immune infiltration of HCC cells. MTDH promotes stemness in HCC cells and high MTDH expression may impede the effectiveness of cancer immunotherapy. The findings of this study will provide additional information that can enhance the understanding of the prognosis and treatment of HCC patients.
It has been reported that the expression level of MTDH correlates with serum alpha-fetoprotein level[20], microvascular infiltration, tumor differentiation, and TNM stage[21]. In addition, the 1-year, 3-year and 5-year overall survival (OS) rates of the high-expression group were significantly lower than those of the low-expression group, and the cumulative recurrence rate was significantly higher than that of the low-expression group[21]. Univariate and multivariate analyses identified AEG-1 as an independent prognostic factor for OS and recurrence[22]. The findings of Yoo et al[22] showed that MTDH expression gradually increased in phases I-IV and from high differentiation to low differentiation. Differential expression, immunohistochemistry, and survival analysis showed similar results. The findings indicate that MTDH is closely associated with poor clinical prognosis of HCC. Additional studies have revealed that MTDH participates in proliferation, tumor progression, invasiveness[23], and metastasis[13]. We performed invasion, migration, and scratch assays on HCC cell lines with overexpressed and under-expressed MTDH. The results suggest that MTDH plays a role in HCC progression, which is consistent with the report of Yoo et al[22].
CSCs are capable of promoting metastasis and enhancing resistance to tumor therapies, including liver cancer therapy[24]. CD133, NANOG, Oct4, and several other molecular markers related to stemness maintenance in human CSCs have been reported[25,26]. Notably, CD133 is a surface marker for LCSCs. The co-expression of Nanog and OCT4 is associated with aggressive tumor behavior and worse clinical outcomes in HCC cells. A study by Hu et al[27] found strong correlations among MTDH, CD133, and SOX2 Levels in gliomas. However, the contribution of MTDH to the tumor stem cell phenotype in HCC remains unclear. We explored the correlation between MTDH and stem cell markers in HCC using correlation analysis and experimental studies. The three stemness markers in the TCGA LIHC dataset exhibited positive correlation with MTDH expression. Additionally, MTDH expression increased in HCC spheres. The overexpression of MTDH in HCC cells enhanced their self-renewal ability, increased the proportion of CD133+ cells, and promoted the expression of tumor stemness markers. However, after MTDH knockdown, stem cell markers were less expressed, and self-renewal was suppressed. The tumorigenic experiments were performed using nude mice. The primary tumor size was reduced in the MTDH-suppressed group, with decreased CD133 protein expression. These results confirm that MTDH plays a regulatory role in HCC stem cells Therefore, in this study, we demonstrated that MTDH promoted an increase in tumor stem cells in HCC cells, which could lead to a worse prognosis.
MTDH can influence the Wnt/β-catenin, Ha-ras, and PI3K/Akt pathways. The Wnt/β-catenin pathway maintains the CSCs phenotype[28]. In gastric cancer, MTDH forms a complex with β-Catenin and LEF1, facilitating the promotion of β-catenin protein translocation and activation of genes downstream of Wnt signaling[29]. CD133 glioma cells overexpressing MTDH maintain stemness and drug resistance through Wnt/β-catenin protein signaling[27]. The precise mechanism through which MTDH regulates CSCs in HCC should be further elucidated in the future.
MTDH increases the expression of PD-L1 and up-regulates the transcriptional activity of PD-L1 through the β-catenin/lev-1 signaling pathway. Patients with HCC and high MTDH and PD-L1 expression may benefit more from PD-1 monoclonal therapy. This suggests that MTDH is associated with immunity against HCC[30]. Immunotherapy resistance in tumor cells is related to components outside the tumor cells in the tumor microenvironment. Mature DCs can induce specific immune responses in the body, acting as anti-infection and anti-tumor agents. Conversely, immature DCs can inhibit the function of antigen-specific effector T cells in the body to further induce immune tolerance. There are different subpopulations of CD4+ Th cells, which include Th1, Th2, and Th17 cells. It has been shown that Th2 cytokines (IL-4 and IL-10) promote tumor growth and metastasis, while Th1 cytokines (IL-2 and TNF-α) are associated with a good prognosis in HCC[31,32]. We found that a high level of MTDH expression positively correlated with an increase in Th2 cells and immature DCs. We speculated that MTDH may increase immune tolerance and metastasis of tumor cells by regulating the infiltration level of immature DC or Th2 cells, which in turn leads to poor prognosis in patients. In contrast, MTDH exhibited negative correlation with the infiltration levels of activated CD8+ T cells, eosinophils, activated B cells, and monocytes. These findings suggest that MTDH plays a critical role in regulating tumor immune infiltration in HCC.
MTDH significantly correlated with the immunostimulants (MICB, NT5E, and TNFSF14). Chemokines initiate lymphocyte infiltration early in the development of malignancies to enhance the activities of antitumor agents. Chemokines reduce apoptosis, promote proliferation, enrich CSCs in tumors, and increase the resistance of tumor cells to therapy[33]. Analyzing the TISIB database revealed a positive correlation between MTDH and CXCL2 expression levels and a negative correlation between MTDH, CXCL12, and CX3CL1 expression levels. CXCL2 promotes the invasion and migration of HCC cells[34]. The recurrence rate of intrahepatic or extrahepatic metastases is lower in patients with HCC expressing high levels of CX3CL1 and its receptor, CX3CR1[35]. HPMEC (human lung microvascular endothelial cells) exhibit an MTDH-mediated attraction towards suspension-cultured cells through the CXCR4/CXCL12 axis, suggesting that MTDH promotes HCC cell metastasis through the CXCR4/CXCL12 pathway[36]. Our analysis showed that MTDH expression negatively correlated with CCXCL12 and CXCR4, but not significantly with CXCR4. This finding was inconsistent with our anticipated results. Exploring the interactions and the associated mechanisms between CCXCL12 and MTDH will further elucidate the role of MTDH in HCC.
This study had some limitations. The exact mechanism through which MTDH influences HCC stem cells needs further investigation both in vivo and in vitro. Additionally, although we found that MTDH expression was closely associated with immune infiltration and prognosis, a more in-depth investigation is essential to elucidate the exact mechanism of MTDH-mediated immune infiltration.
High MTDH expression is associated with poor prognosis in HCC. MTDH may influence HCC progression through the regulation of tumor stemness and immune infiltration, providing additional evidence for the possible role of MTDH as a potential molecular marker of HCC.
Metadherin (MTDH) is a key oncogene in most cancer types, including hepatocellular carcinoma (HCC). Tumor stem cells are associated with tumorigenesis, metastasis, cell proliferation, and postoperative recurrence. The type and number of immune cells in the HCC microenvironment have prognostic value and can influence the response to immunotherapy. The impacts of MTDH expression on stem cell characteristics and immune cell infiltration in HCC remain unclear.
MTDH is a key oncogene in most cancers. It is important to explore the impact of MTDH on the prognosis of HCC patients and determine whether it affects tumor progression by influencing stem cell phenotype and immune infiltration.
This study aimed to investigate the effects of MTDH on tumor stemness and immunity in HCC.
Differential expression of MTDH in tissues was detected using TCGA and GEO databases, and immunohistochemistry was performed on HCC and para-cancerous tissue samples. MTDH was stably downregulated or overexpressed by lentiviral transfection in both HCC cell types. Invasiveness and migration were assessed using stromal infiltration and wound healing assays. HCC stem cells were obtained by culturing spheroids in a serum-free medium. Flow cytometry, immunofluorescence, and sphere formation assays were used to identify stem-like cells. Relevant gene expression was detected through western blotting and real-time quantitative reverse transcription-PCR. The effect of MTDH inhibition on tumor growth was investigated using in vivo tumor formation assays. Correlations between MTDH and immune cells, immunomodulators, and chemokines were analyzed using ssGSEA and the TISIDB database.
This study confirmed that the expression of MTDH in HCC tissues was higher than that in normal liver tissues and that the high expression of MTDH resulted in poor prognosis of patients with HCC. HCC cells overexpressing MTDH exhibited stronger invasion and migration abilities, exhibited a stem cell-like phenotype, and formed spheres, whereas MTDH inhibition attenuated these effects. MTDH inhibition suppressed tumor growth and CD133 expression in vivo. Correlation analysis showed that MTDH exhibited positive correlation with immature dendritic cells (DCs), T helper (Th)2 cells, central memory CD8+ T cells, memory B cells, activated DCs, natural killer (NK) T cells, NK cells, activated CD4+ T cells, and central memory CD4+ T cells. The results also showed that MTDH exhibited negative correlation with activated CD8+ T cells, eosinophils, activated B cells, monocytes, macrophages, and mast cells. Correlation analysis of MTDH expression with immunomodulators and chemokines showed that MTDH levels positively correlated with CXCL2 expression and negatively correlated with CX3CL1 and CXCL12 expression.
In HCC, MTDH expression is increased, leading to poor prognosis. MTDH promotes the acquisition of tumor cell stemness and tumor growth in HCC, influencing immune infiltration and immunotherapy.
Through database analysis, as well as in vivo and in vitro experiments, we confirmed that MTDH leads to poor prognosis in patients with HCC, promotes the acquisition of the tumor stem cell phenotype, and influences immune infiltration. The exact mechanism through which MTDH influences HCC stem cell and immune cell infiltration requires further exploration. This may provide a scientific basis for further understanding of the prognosis and treatment of patients with HCC.
We would like to thank Institute of Life Sciences, Chongqing Medical University for technical support.
Provenance and peer review: Invited article; Externally peer reviewed.
Peer-review model: Single blind
Specialty type: Gastroenterology and hepatology
Country/Territory of origin: China
Peer-review report’s scientific quality classification
Grade A (Excellent): A
Grade B (Very good): 0
Grade C (Good): 0
Grade D (Fair): 0
Grade E (Poor): 0
P-Reviewer: Reshkin SJ, Italy S-Editor: Lin C L-Editor: A P-Editor: Chen YX
| 1. | Sung H, Ferlay J, Siegel RL, Laversanne M, Soerjomataram I, Jemal A, Bray F. Global Cancer Statistics 2020: GLOBOCAN Estimates of Incidence and Mortality Worldwide for 36 Cancers in 185 Countries. CA Cancer J Clin. 2021;71:209-249. [PubMed] [DOI] [Cited in This Article: ] [Cited by in Crossref: 50630] [Cited by in F6Publishing: 43329] [Article Influence: 14443.0] [Reference Citation Analysis (47)] |
| 2. | Kim M, Lee SJ, Shin S, Park KS, Park SY, Lee CH. Novel natural killer cell-mediated cancer immunotherapeutic activity of anisomycin against hepatocellular carcinoma cells. Sci Rep. 2018;8:10668. [PubMed] [DOI] [Cited in This Article: ] [Cited by in Crossref: 16] [Cited by in F6Publishing: 17] [Article Influence: 2.8] [Reference Citation Analysis (0)] |
| 3. | Wang T, Wu H, Liu S, Lei Z, Qin Z, Wen L, Liu K, Wang X, Guo Y, Liu Q, Liu L, Wang J, Lin L, Mao C, Zhu X, Xiao H, Bian X, Chen D, Xu C, Wang B. SMYD3 controls a Wnt-responsive epigenetic switch for ASCL2 activation and cancer stem cell maintenance. Cancer Lett. 2018;430:11-24. [PubMed] [DOI] [Cited in This Article: ] [Cited by in Crossref: 31] [Cited by in F6Publishing: 34] [Article Influence: 5.7] [Reference Citation Analysis (0)] |
| 4. | Rhee H, Chung T, Yoo JE, Nahm JH, Woo HY, Choi GH, Han DH, Park YN. Gross type of hepatocellular carcinoma reflects the tumor hypoxia, fibrosis, and stemness-related marker expression. Hepatol Int. 2020;14:239-248. [PubMed] [DOI] [Cited in This Article: ] [Cited by in Crossref: 13] [Cited by in F6Publishing: 26] [Article Influence: 6.5] [Reference Citation Analysis (0)] |
| 5. | Cao J, Zhao M, Liu J, Zhang X, Pei Y, Wang J, Yang X, Shen B, Zhang J. RACK1 Promotes Self-Renewal and Chemoresistance of Cancer Stem Cells in Human Hepatocellular Carcinoma through Stabilizing Nanog. Theranostics. 2019;9:811-828. [PubMed] [DOI] [Cited in This Article: ] [Cited by in Crossref: 24] [Cited by in F6Publishing: 49] [Article Influence: 9.8] [Reference Citation Analysis (0)] |
| 6. | Liu F, Kong X, Lv L, Gao J. TGF-β1 acts through miR-155 to down-regulate TP53INP1 in promoting epithelial-mesenchymal transition and cancer stem cell phenotypes. Cancer Lett. 2015;359:288-298. [PubMed] [DOI] [Cited in This Article: ] [Cited by in Crossref: 64] [Cited by in F6Publishing: 76] [Article Influence: 8.4] [Reference Citation Analysis (0)] |
| 7. | Xu N, Li X, Watanabe M, Ueki H, Hu H, Li N, Araki M, Wada K, Xu A, Liu C, Nasu Y, Huang P. Induction of cells with prostate cancer stem-like properties from mouse induced pluripotent stem cells via conditioned medium. Am J Cancer Res. 2018;8:1624-1632. [PubMed] [Cited in This Article: ] |
| 8. | Barsch M, Salié H, Schlaak AE, Zhang Z, Hess M, Mayer LS, Tauber C, Otto-Mora P, Ohtani T, Nilsson T, Wischer L, Winkler F, Manne S, Rech A, Schmitt-Graeff A, Bronsert P, Hofmann M, Neumann-Haefelin C, Boettler T, Fichtner-Feigl S, van Boemmel F, Berg T, Rimassa L, Di Tommaso L, Saeed A, D'Alessio A, Pinato DJ, Bettinger D, Binder H, John Wherry E, Schultheiss M, Thimme R, Bengsch B. T-cell exhaustion and residency dynamics inform clinical outcomes in hepatocellular carcinoma. J Hepatol. 2022;77:397-409. [PubMed] [DOI] [Cited in This Article: ] [Cited by in Crossref: 11] [Cited by in F6Publishing: 54] [Article Influence: 27.0] [Reference Citation Analysis (0)] |
| 9. | Garnelo M, Tan A, Her Z, Yeong J, Lim CJ, Chen J, Lim KH, Weber A, Chow P, Chung A, Ooi LL, Toh HC, Heikenwalder M, Ng IO, Nardin A, Chen Q, Abastado JP, Chew V. Interaction between tumour-infiltrating B cells and T cells controls the progression of hepatocellular carcinoma. Gut. 2017;66:342-351. [PubMed] [DOI] [Cited in This Article: ] [Cited by in Crossref: 247] [Cited by in F6Publishing: 305] [Article Influence: 43.6] [Reference Citation Analysis (0)] |
| 10. | Suthen S, Lim CJ, Nguyen PHD, Dutertre CA, Lai HLH, Wasser M, Chua C, Lim TKH, Leow WQ, Loh TJ, Wan WK, Pang YH, Soon G, Cheow PC, Kam JH, Iyer S, Kow A, Tam WL, Shuen TWH, Toh HC, Dan YY, Bonney GK, Chan CY, Chung A, Goh BKP, Zhai W, Ginhoux F, Chow PKH, Albani S, Chew V. Hypoxia-driven immunosuppression by Treg and type-2 conventional dendritic cells in HCC. Hepatology. 2022;76:1329-1344. [PubMed] [DOI] [Cited in This Article: ] [Cited by in Crossref: 16] [Cited by in F6Publishing: 63] [Article Influence: 31.5] [Reference Citation Analysis (0)] |
| 11. | Ducimetière L, Lucchiari G, Litscher G, Nater M, Heeb L, Nuñez NG, Wyss L, Burri D, Vermeer M, Gschwend J, Moor AE, Becher B, van den Broek M, Tugues S. Conventional NK cells and tissue-resident ILC1s join forces to control liver metastasis. Proc Natl Acad Sci U S A. 2021;118. [PubMed] [DOI] [Cited in This Article: ] [Cited by in Crossref: 22] [Cited by in F6Publishing: 54] [Article Influence: 18.0] [Reference Citation Analysis (0)] |
| 12. | Sarkar D, Fisher PB. AEG-1/MTDH/LYRIC: clinical significance. Adv Cancer Res. 2013;120:39-74. [PubMed] [DOI] [Cited in This Article: ] [Cited by in Crossref: 67] [Cited by in F6Publishing: 40] [Article Influence: 4.0] [Reference Citation Analysis (0)] |
| 13. | Chen J, Jia Y, Jia ZH, Zhu Y, Jin YM. Silencing the expression of MTDH increases the radiation sensitivity of SKOV3 ovarian cancer cells and reduces their proliferation and metastasis. Int J Oncol. 2018;53:2180-2190. [PubMed] [DOI] [Cited in This Article: ] [Cited by in Crossref: 1] [Cited by in F6Publishing: 4] [Article Influence: 0.7] [Reference Citation Analysis (0)] |
| 14. | Zhu K, Dai Z, Pan Q, Wang Z, Yang GH, Yu L, Ding ZB, Shi GM, Ke AW, Yang XR, Tao ZH, Zhao YM, Qin Y, Zeng HY, Tang ZY, Fan J, Zhou J. Metadherin promotes hepatocellular carcinoma metastasis through induction of epithelial-mesenchymal transition. Clin Cancer Res. 2011;17:7294-7302. [PubMed] [DOI] [Cited in This Article: ] [Cited by in Crossref: 107] [Cited by in F6Publishing: 113] [Article Influence: 8.7] [Reference Citation Analysis (0)] |
| 15. | Emdad L, Lee SG, Su ZZ, Jeon HY, Boukerche H, Sarkar D, Fisher PB. Astrocyte elevated gene-1 (AEG-1) functions as an oncogene and regulates angiogenesis. Proc Natl Acad Sci U S A. 2009;106:21300-21305. [PubMed] [DOI] [Cited in This Article: ] [Cited by in Crossref: 151] [Cited by in F6Publishing: 161] [Article Influence: 10.7] [Reference Citation Analysis (0)] |
| 16. | Zhang W, Zhangyuan G, Wang F, Jin K, Shen H, Zhang L, Yuan X, Wang J, Zhang H, Yu W, Huang R, Xu X, Yin Y, Zhong G, Lin A, Sun B. The zinc finger protein Miz1 suppresses liver tumorigenesis by restricting hepatocyte-driven macrophage activation and inflammation. Immunity. 2021;54:1168-1185.e8. [PubMed] [DOI] [Cited in This Article: ] [Cited by in Crossref: 8] [Cited by in F6Publishing: 31] [Article Influence: 10.3] [Reference Citation Analysis (0)] |
| 17. | Jin C, Han-Hua D, Qiu-Meng L, Deng N, Peng-Chen D, Jie M, Lei X, Xue-Wu Z, Hui-Fang L, Yan C, Xiao-Ping C, Bi-Xiang Z. MTDH-stabilized DDX17 promotes tumor initiation and progression through interacting with YB1 to induce EGFR transcription in Hepatocellular Carcinoma. Oncogene. 2023;42:169-183. [PubMed] [DOI] [Cited in This Article: ] [Reference Citation Analysis (0)] |
| 18. | Hänzelmann S, Castelo R, Guinney J. GSVA: gene set variation analysis for microarray and RNA-seq data. BMC Bioinformatics. 2013;14:7. [PubMed] [DOI] [Cited in This Article: ] [Cited by in Crossref: 7222] [Cited by in F6Publishing: 6592] [Article Influence: 599.3] [Reference Citation Analysis (0)] |
| 19. | Yu G, Wang LG, Han Y, He QY. clusterProfiler: an R package for comparing biological themes among gene clusters. OMICS. 2012;16:284-287. [PubMed] [DOI] [Cited in This Article: ] [Cited by in Crossref: 11591] [Cited by in F6Publishing: 16541] [Article Influence: 1378.4] [Reference Citation Analysis (0)] |
| 20. | Al-sheikh NM, El-Hefnway SM, Abuamer AM, Dala AG. Metadherin mRNA expression in hepatocellular carcinoma. Egypt J Medical Hum Genet. 2018;19:391-397. [DOI] [Cited in This Article: ] [Cited by in Crossref: 3] [Cited by in F6Publishing: 3] [Article Influence: 0.5] [Reference Citation Analysis (0)] |
| 21. | Jung HI, Ahn T, Bae SH, Chung JC, Kim H, Chin S, Jeong D, Cho HD, Lee MS, Kim HC, Kim CH, Baek MJ. Astrocyte elevated gene-1 overexpression in hepatocellular carcinoma: an independent prognostic factor. Ann Surg Treat Res. 2015;88:77-85. [PubMed] [DOI] [Cited in This Article: ] [Cited by in Crossref: 11] [Cited by in F6Publishing: 11] [Article Influence: 1.2] [Reference Citation Analysis (0)] |
| 22. | Yoo BK, Emdad L, Su ZZ, Villanueva A, Chiang DY, Mukhopadhyay ND, Mills AS, Waxman S, Fisher RA, Llovet JM, Fisher PB, Sarkar D. Astrocyte elevated gene-1 regulates hepatocellular carcinoma development and progression. J Clin Invest. 2009;119:465-477. [PubMed] [DOI] [Cited in This Article: ] [Cited by in Crossref: 258] [Cited by in F6Publishing: 274] [Article Influence: 18.3] [Reference Citation Analysis (0)] |
| 23. | Tokunaga E, Nakashima Y, Yamashita N, Hisamatsu Y, Okada S, Akiyoshi S, Aishima S, Kitao H, Morita M, Maehara Y. Overexpression of metadherin/MTDH is associated with an aggressive phenotype and a poor prognosis in invasive breast cancer. Breast Cancer. 2014;21:341-349. [PubMed] [DOI] [Cited in This Article: ] [Cited by in Crossref: 35] [Cited by in F6Publishing: 44] [Article Influence: 3.7] [Reference Citation Analysis (0)] |
| 24. | Chen P, Hsu WH, Han J, Xia Y, DePinho RA. Cancer Stemness Meets Immunity: From Mechanism to Therapy. Cell Rep. 2021;34:108597. [PubMed] [DOI] [Cited in This Article: ] [Cited by in Crossref: 119] [Cited by in F6Publishing: 106] [Article Influence: 35.3] [Reference Citation Analysis (0)] |
| 25. | Vlashi E, Pajonk F. Cancer stem cells, cancer cell plasticity and radiation therapy. Semin Cancer Biol. 2015;31:28-35. [PubMed] [DOI] [Cited in This Article: ] [Cited by in Crossref: 169] [Cited by in F6Publishing: 199] [Article Influence: 19.9] [Reference Citation Analysis (0)] |
| 26. | Liu F, Kong X, Lv L, Gao J. MiR-155 targets TP53INP1 to regulate liver cancer stem cell acquisition and self-renewal. FEBS Lett. 2015;589:500-506. [PubMed] [DOI] [Cited in This Article: ] [Cited by in Crossref: 34] [Cited by in F6Publishing: 38] [Article Influence: 4.2] [Reference Citation Analysis (0)] |
| 27. | Hu B, Emdad L, Kegelman TP, Shen XN, Das SK, Sarkar D, Fisher PB. Astrocyte Elevated Gene-1 Regulates β-Catenin Signaling to Maintain Glioma Stem-like Stemness and Self-Renewal. Mol Cancer Res. 2017;15:225-233. [PubMed] [DOI] [Cited in This Article: ] [Cited by in Crossref: 18] [Cited by in F6Publishing: 19] [Article Influence: 2.4] [Reference Citation Analysis (0)] |
| 28. | Mao J, Fan S, Ma W, Fan P, Wang B, Zhang J, Wang H, Tang B, Zhang Q, Yu X, Wang L, Song B, Li L. Roles of Wnt/β-catenin signaling in the gastric cancer stem cells proliferation and salinomycin treatment. Cell Death Dis. 2014;5:e1039. [PubMed] [DOI] [Cited in This Article: ] [Cited by in Crossref: 167] [Cited by in F6Publishing: 197] [Article Influence: 19.7] [Reference Citation Analysis (0)] |
| 29. | Pandit H, Li Y, Li X, Zhang W, Li S, Martin RCG. Enrichment of cancer stem cells via β-catenin contributing to the tumorigenesis of hepatocellular carcinoma. BMC Cancer. 2018;18:783. [PubMed] [DOI] [Cited in This Article: ] [Cited by in Crossref: 29] [Cited by in F6Publishing: 33] [Article Influence: 5.5] [Reference Citation Analysis (0)] |
| 30. | Wan JL, Wang B, Wu ML, Li J, Gong RM, Song LN, Zhang HS, Zhu GQ, Chen SP, Cai JL, Xing XX, Wang YD, Yang Y, Cai CZ, Huang R, Liu H, Dai Z. MTDH antisense oligonucleotides reshape the immunosuppressive tumor microenvironment to sensitize Hepatocellular Carcinoma to immune checkpoint blockade therapy. Cancer Lett. 2022;541:215750. [PubMed] [DOI] [Cited in This Article: ] [Cited by in Crossref: 2] [Cited by in F6Publishing: 2] [Article Influence: 1.0] [Reference Citation Analysis (0)] |
| 31. | Zhou L, Chong MM, Littman DR. Plasticity of CD4+ T cell lineage differentiation. Immunity. 2009;30:646-655. [PubMed] [DOI] [Cited in This Article: ] [Cited by in Crossref: 1078] [Cited by in F6Publishing: 1107] [Article Influence: 73.8] [Reference Citation Analysis (0)] |
| 32. | Mantovani A, Allavena P, Sica A, Balkwill F. Cancer-related inflammation. Nature. 2008;454:436-444. [PubMed] [DOI] [Cited in This Article: ] [Cited by in Crossref: 6912] [Cited by in F6Publishing: 7713] [Article Influence: 482.1] [Reference Citation Analysis (0)] |
| 33. | Morein D, Erlichman N, Ben-Baruch A. Beyond Cell Motility: The Expanding Roles of Chemokines and Their Receptors in Malignancy. Front Immunol. 2020;11:952. [PubMed] [DOI] [Cited in This Article: ] [Cited by in Crossref: 44] [Cited by in F6Publishing: 76] [Article Influence: 19.0] [Reference Citation Analysis (0)] |
| 34. | Lu Y, Li S, Ma L, Li Y, Zhang X, Peng Q, Mo C, Huang L, Qin X, Liu Y. Type conversion of secretomes in a 3D TAM2 and HCC cell co-culture system and functional importance of CXCL2 in HCC. Sci Rep. 2016;6:24558. [PubMed] [DOI] [Cited in This Article: ] [Cited by in Crossref: 15] [Cited by in F6Publishing: 20] [Article Influence: 2.5] [Reference Citation Analysis (0)] |
| 35. | Matsubara T, Ono T, Yamanoi A, Tachibana M, Nagasue N. Fractalkine-CX3CR1 axis regulates tumor cell cycle and deteriorates prognosis after radical resection for hepatocellular carcinoma. J Surg Oncol. 2007;95:241-249. [PubMed] [DOI] [Cited in This Article: ] [Cited by in Crossref: 44] [Cited by in F6Publishing: 48] [Article Influence: 2.8] [Reference Citation Analysis (0)] |
| 36. | Zhou Z, Deng H, Yan W, Luo M, Tu W, Xia Y, He J, Han P, Fu Y, Tian D. AEG-1 promotes anoikis resistance and orientation chemotaxis in hepatocellular carcinoma cells. PLoS One. 2014;9:e100372. [PubMed] [DOI] [Cited in This Article: ] [Cited by in Crossref: 20] [Cited by in F6Publishing: 23] [Article Influence: 2.3] [Reference Citation Analysis (0)] |


