Communications in Plant Sciences, vol 9, p. 20-28, 2019 (2019004)
DOI: http://dx.doi.org/10.26814/cps2019004
The hidden half of Brazilian rice: putting roots on the table to better evidence the genetic variability available for breeding
Camila dos Santos Alves, Henrique Pasquetti Carbonari, Cristiano Stülp, Victoria Freitas de Oliveira, Maicon Nardino, Viviane Kopp da Luz, Eduardo Venske, Ariano Martins de Magalhães Jr. and Antonio Costa de Oliveira*
*Correspondence to: antonio.oliveira@pq.cnpq.br
Abstract: Assessing genetic variability is essential to crop breeding and represents the basis for a successful crop selection, including rice (Oryza sativa L.). Root system shows a large range of roles that could be improved genetically. However, it has been virtually neglected by most breeders. The objective was to characterize a selected sample of the Brazilian rice germplasm, regarding on root growth and development, and to combine this data to shoot traits, aiming to depict the genetic variability within this germplasm. Sixteen Brazilian accessions of rice were analyzed with basis on root and shoot traits in two distinct experiments, mainly cultivars launched in the past four decades and presenting unique characteristics. The first experiment was carried out at hydroponic conditions to evaluate the performance of rice accessions during the seedling stage. The second was carried out in long PVC tubes to assay the rice accessions at the reproductive period. Traits were treated individually as well as analyzed jointly by different multivariate methods of genetic variability assessment. Most of the rice accessions showed similar results for a part of the studied traits, however differences were observed for some traits. The clustering methods agreed to group a large number of rice accessions into a single group, distinguishing only the best performing genotypes.
Highlighted Conclusions
1) The genetic variability within a group of Brazilian rice accessions is narrow when based on both root and shoot traits.
2) The accessions BRS Pampeira, at seedling period, and BRS Pampa, at reproductive stage, show prominent root performance, being promising parents for breeding programs focused on root system improvements.
Keywords: Genetic distance, Soil-free phenotyping, Trait-based breeding.

INTRODUCTION
Rice is one of the most important crops because it is the staple food for more than half the human population. Furthermore, the cereal plays a key role for the food security today and in the near future, as the population is expected to reach 9 billion by 2050 (FAO 2016). Brazil is the 9th largest rice producer worldwide, reaching above 12 million tons, annually; the Southern Brazil is the main producing region, especially Rio Grande do Sul and Santa Catarina states, accounting for almost 80% of the national rice production (CONAB 2017).
Given the importance of rice, breeding programs have to continuously allocate efforts to improve the crop for diverse traits. The root system has received much less attention than shoot parts in breeding programs, although it is undeniably recognized for its wide range of functions for the plant (Wu and Cheng 2014). However, several studies have shown an important genetic variability for root traits in rice (Uga et al. 2009, Gowda et al. 2011, Henry et al. 2011, Vejchasarn et al. 2016), which means that the cereal can be expressively improved for root performance with impacts on yield and other agronomic and economic traits.
The improvement in the root system can bring benefits for rice plants as a better water acquisition (Gowda et al. 2011, Henry et al. 2012) and an improved nutrient uptake (Vejchasarn et al. 2016), which represent an economy of resources and an increase in yield potential. Improvements in water uptake could, in the long term, even drive a change in the rice crop system in Southern Brazil from predominantly irrigated (flooded) to rainfed, with minor losses in yield. In addition, breeding crops for improved root system has been proven to improve the soil quality, in physical, chemical and biological terms (Kell 2011).
The characterization of the available germplasm regarding on genetic variability is essential for plant breeding programs, since variability is the basis for the breeding process. Recently, important studies have been carried out to characterize the genetic variability of rice germplasm (including the genetic progress) in Southern Brazilian, however none of these studies included any root trait in the analysis (Streck et al. 2017, 2018a,b, 2019). Our hypothesis is the joint analysis of shoot and root characteristics may allow a better understanding of the genetic diversity available for breeding.
The objective of this research was to characterize a selected sample of the Brazilian rice germplasm, regarding on root growth and development, and to combine this data to shoot traits, aiming to depict the genetic variability within this germplasm.
MATERIAL AND METHODS
Overview. Two experiments were carried out to study root growth and development of rice plants. In the first one, we used small pots at hydroponic conditions aiming to assess root growth at seedling stage. In the second one, PVC tubes were used at greenhouse conditions aiming to evaluate root development at the reproductive period. In the Figure 1, it is presented an overview of the soil-free conditions in which the plants were assayed. Although the experiments aimed mainly to evaluate root growth and development, shoot traits were also evaluated with the objective of elucidating the association between traits and of computing genetic distances based simultaneously on both root and shoot phenotypes.

Figure 1. Soil-free conditions applied in this study for rice phenotypic evaluation with emphasis on root growth. A) Hydroponic experiment: seedlings are potted-out on a grid which is kept on the top of a pot containing nutrition solution, being each pot an experimental unit. B) PVC tube experiment for entire cycle evaluation: each 1.2 m high PVC tube is filled with sand and nutrition solution.
Plant material. Sixteen rice accessions (most Brazilian) were assayed in this studied. All of them grown in hydroponic conditions and ten accessions grown in the PCV tube assay. These genotypes were selected to cover important levels of genetic variability among elite rice cultivars developed mainly by Embrapa Clima Temperado for Southern Brazil conditions over the years and improved for different purposes. Traditional varieties and cultivars developed by other breeding programs were also included. In Table 1 is provided a description of these accessions.
Table 1. Brazilian rice accessions assayed at PVC tubes and hydroponic conditions for morphological traits, with emphasis on roots.

¹ The features described in this table were collected from a large list of bibliography, including cultivars portfolios; ² Introduced into Brazil by Instituto de Pesquisa e Experimentação Agropecuária do Sul, today Embrapa Clima Temperado.
Hydroponic experiment. Seeds of all genotypes were disinfested with sodium hypochlorite at 10% and germinated on wet paper in plastic germination boxes (PGB), following protocols of the Brazilian Rules for Seed Testing (Brasil 2009). Three days after sowing, seven uniform seedlings, per replication, were selected and potted-out to a grid kept on the top of a 5-L pot filled with complete nutrition solution (according to Singh et al. 2010) (Figure 1A). The pots were kept in an acclimatized room at 25 °C and photoperiod of 14/10-h (day/night). Distilled water was added according to evapotranspiration demand and the whole nutrition solution was replaced once a week. The number of roots (NR), the root length (RL), the root dry mass (RDM), the coleoptile length (CL), the shoot length (SL) and the shoot dry mass (SDM) were evaluated at 14 and 28 days after potting (DAP). The experimental design was completely randomized with three replications.
PVC tube experiment. Seeds of ten selected rice genotypes were disinfested with sodium hypochlorite at 10% and germinated on wet paper in PGB (Brasil 2009). Fourteen days after sowing, uniform seedlings were potted-out in PVC tubes (20-cm diameter and 120-cm height), being a replication composed by each tube with three plants. Tubes were filled with washed sand and nutrition solution (Singh et al. 2010) and maintained in a greenhouse. In general, this experiment followed the method described by Shashidhar et al (2012). During the experiment, a water blade of ~3 cm was kept, simulating the irrigated (flooded) condition at field. Thus, water was replaced every day and nutrition solution every two weeks. The experimental design was completely randomized with three replications.
Evaluation occurred at pre-flowering phase, starting of the R4 stage (Counce et al. 2000), when the emergence of the main stem panicle occurs, with the anthesis of one or more spikelets. This stage represents a decisive point for rice yield, when the root and shoot system should be already well developed. When each genotype reached this stage, the plants were removed from the tubes and washed out. Then, we measured the number of roots (NR), the root length (CR), the root dry mass (RDM), the shoot length (SL), the number of fertile tillers (NFT), the number of leaves (NL) and the shoot dry mass (SDM).
Statistical analysis. Data of both experiments were subjected to analysis of variance (p ≤ 0.05) and to Scott-Knott grouping test (p ≤ 0.05). Based on the means of the traits, it was estimated the generalized distance of Mahalanobis (D2) and the genetic dissimilarity of the genotypes by Tocher grouping method, according to Mahalanobis distances and the scattering plot of calculated canonical variables. Based on the genetic matrix generated, the dendrograms were constructed by the UPGMA grouping method. The relative contribution of each evaluated trait was obtained by the method proposed by Singh (1981). The statistical software Genes (Cruz 2013) was used for all analysis
RESULTS
Hydroponic experiment. Number of roots, root length, coleoptile length and shoot length varied with groups of rice accessions (Table 2). Regarding number of roots, the genotypes distributed almost evenly in two classes, with means ranging from 4.29 to 8.33. For root length, two classes of means were also found, however, only three genotypes grouped in the inferior class. As for root length, for coleoptile length only three genotypes differed statistically from all others, presenting lower means. Finally, regarding shoot length, Hybrid H4 presented the highest mean, differing from all other genotypes, which grouped in two other classes of means.
Table 2. Means for number of roots (NR), root length (RL), coleoptile length (CL) and shoot length (SL) in a selected set of Brazilian rice accessions grown for 14 days at hydroponic conditions.
| Accessions | NR | RL (cm) | CL (cm) | SL (cm) |
| Arroz de Sequeiro 0335 | 5.67b* | 5.44a | 0.42a | 17.95c |
| BRS AG | 5.02b | 5.31a | 0.23b | 16.96c |
| BRS Atalanta | 7.05a | 5.89a | 0.46a | 18.34c |
| BRS Colosso | 6.29a | 4.32b | 0.24b | 15.61c |
| BRS Firmeza | 7.29a | 5.66a | 0.54a | 16.66c |
| BR-IRGA 409 | 5.89b | 4.48b | 0.54a | 24.66b |
| BRS Ligeirinho | 4.54b | 5.41a | 0.40a | 17.80c |
| BRS Pampa | 8.33a | 5.51a | 0.52a | 18.71c |
| BRS Pampeira | 6.48a | 5.53a | 0.20b | 15.17c |
| BRS Querência | 6.95a | 4.01b | 0.57a | 14.53c |
| BRS Sinuelo CL | 7.38a | 6.23a | 0.49a | 19.92c |
| BRS Vencedora | 4.29b | 5.26a | 0.40a | 18.21c |
| Farroupilha | 6.86a | 5.53a | 0.37a | 21.70b |
| Hybrid H4 | 6.10b | 6.26a | 0.43a | 27.83a |
| IAS 12-9 Formosa | 8.00a | 6.20a | 0.51a | 19.75c |
| SCS 112 | 7.29a | 5.18a | 0.42a | 19.11c |
*Means followed by same letter in the column do not differ significantly (p ≤ 0.05) according to Scott-Knott test.
In general, genotypes with better performance for number of roots were not the best genotypes for shoot length. Regarding genotype clustering, Tocher optimization method (Table 3) and the canonical variables (Table 4 and Figure 2) agreed indicating four groups, on the other hand the UPGMA dendrogram analysis indicated only two groups (Figure 3).
Table 3. Representation of the Tocher optimization clustering based on the Mahalanobis mean distance, estimated from root and shoot traits measured from 16 rice genotypes grown in hydroponic system for 14 days after potting.
| Groups | Genotypes |
| 1 | Arroz de Sequeiro 0335, BRS AG, BRS Atalanta, BRS Colosso, BRS Firmeza, BRS Ligeirinho, BRS Pampa, BRS Sinuelo CL, BRS Vencedora, Farroupilha, IAS 12-9 Formosa, SCS 112. |
| 2 | BR IRGA 409, Hybrid H4, |
| 3 | BRS Querência |
| 4 | BRS Pampeira |
Table 4. Cumulative variance of the canonical variables obtained for four traits that presented significant differences evaluated in 16 rice genotypes grown in hydroponic system for 14 days.
| Canonical variable | Estimate of Eigenvalues | ||
| Variances | Variances (%) | Accumulated (%) | |
| 1 | 3.29 | 42.67 | 42.67 |
| 2 | 2.55 | 33.05 | 75.73 |
| 3 | 1.23 | 16.04 | 91.77 |
| 4 | 0.63 | 8.22 | 100 |
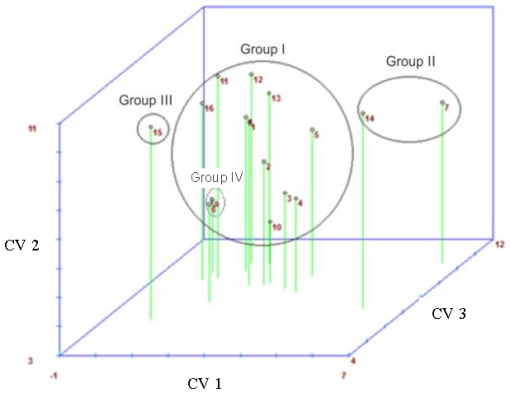
Figure 2. Graphic dispersion of the scores of first (CV 1), second (CV 2) and third (CV 3) canonical variables calculated from rice genotypes evaluated at 14 days in hydroponic system. Group I: 3- BRS Ligeirinho, 4- BRS Vencedora, 2- Arroz de Sequeiro, 10- BRS AG, 5- Farroupilha, 8- BRS Atalanta, 1- SCS 112, 13- BRS Sinuelo CL, 6- BRS Colosso, 16- BRS Firmeza, 12- IAS 12-9 Formosa, 11- BRS Pampa; Group II: 7- Hybrid H4, 14- BR IRGA 409; Group III: 15- BRS Querência; Group IV: 9- BRS Pampeira.

Figure 3. Dendrogram obtained from the phenotypic data analysis of root and shoot traits measured in 16 rice genotypes evaluated at 14 days, by Mahalanobis distance and UPGMA clustering. The cophenetic correlation coefficient (r) was of 0.80. The names of the genotypes were simplified due to space limitations.
At 28 days, number of roots, coleoptile length and shoot length varied with groups of rice accessions (Table 5). BRS Pampeira presented the largest number of roots, differing from all other genotypes which was grouped in two other classes of means. Three classes of means were also obtained for coleoptile and shoot length.
Table 5. Means for number of roots (NR), coleoptile length (CL) and shoot length (SL) in a selected set of Brazilian rice accessions grown for 28 days at hydroponic conditions.
| Accessions | NR | CL (cm) | SL (cm) |
| Arroz de Sequeiro 0335 | 8.90c* | 0.54c | 31.66a |
| BRS AG | 7.49c | 0.63b | 33.54a |
| BRS Atalanta | 10.24c | 0.19c | 23.12c |
| BRS Colosso | 10.48c | 0.27c | 30.02a |
| BRS Firmeza | 10.58c | 0.25c | 25.93b |
| BR-IRGA 409 | 10.93c | 0.27c | 25.43b |
| BRS Ligeirinho | 8.81c | 0.97a | 27.55b |
| BRS Pampa | 8.52c | 1.21a | 28.03b |
| BRS Pampeira | 18.29a | 0.37c | 26.05b |
| BRS Sinuelo CL | 9.00c | 0.24c | 27.50b |
| BRS Querência | 9.52c | 0.89a | 26.83b |
| BRS Vencedora | 7.67c | 0.59b | 26.34b |
| Farroupilha | 10.05c | 0.18c | 34.07a |
| Hybrid H4 | 10.48c | 0.86a | 28.55b |
| IAS 12-9 Formosa | 11.05c | 0.66b | 29.08a |
| SCS 112 | 13.60b | 0.38c | 20.77c |
*Means followed by same letter in the column do not differ significantly (p ≤ 0.05) according to Scott-Knott test.
Just like the evaluation at 14 days, Tocher optimization method (Table 6) and the canonical variables (Table 7 and Figure 4) agreed indicating four groups, and UPGMA dendrogram (Figure 5), again indicated only two groups. It does not mean, however, that the same genotypes were grouped together when comparing the evaluations at 14 and 28 days.
Table 6. Representation of cluster generated by the Tocher Optimization method based on the Mahalanobis mean distance, estimated from root and shoot traits from 16 rice genotypes assayed in hydroponic system at 28 days after potting.
| Group | Accessions |
| 1 | Arroz de Sequeiro 0335, BRS Atalanta, BRS Colosso, BRS Firmeza, BR IRGA 409, BRS Ligeirinho, BRS Querência, BRS Sinuelo CL, BRS Vencedora, Hybrid H4, IAS 12-9 Formosa. |
| 2 | BRS AG, Farroupilha. |
| 3 | BRS Pampeira, SCS 112. |
| 4 | BRS Pampa. |
Table 7. Cumulative variance of the canonical variables obtained of three traits that presented significant differences evaluated in rice genotypes in hydroponic system at 28 days.
| Canonical Variable | Estimate of Eigenvalues | ||
| Variances | Variances (%) | Accumulated (%) | |
| 1 | 4.09 | 61.56 | 61.56 |
| 2 | 1.68 | 25.4 | 86.96 |
| 3 | 0.86 | 13.03 | 100 |

Figure 4. Graphic dispersion of the scores of first (CV 1) and second (CV 2) canonical variables of the rice genotypes evaluated at 28 days in hydroponic system. Group I: 14- BR IRGA 409, 16- BRS Firmeza, 8- BRS Atalanta, 13- BRS Sinuelo CL, 6- BRS Colosso, 4- BRS Vencedora, 12- IAS 12-9 Formosa, 15- BRS Querência, 7- Hybrid H4, 3- BRS Ligeirinho, 2- Arroz de Sequeiro; Group II: 5- Farroupilha, 10- BRS AG; Group III: 1- SCS 112, 9- BRS Pampeira; Group IV: 11- BRS Pampa.

Figure 5. Dendrogram obtained by Mahalanobis distance and UPGMA clustering from root and shoot traits measured in 16 rice accessions assayed in hydroponic conditions. The coefficient of cophenetic correlation (r) was of 0.76. The names of the genotypes were simplified due to space limitations.
PVC tube experiment. Ten rice accessions were assayed at the R4 stage (rice developmental scale of Counce et al. 2000). Root dry mass, shoot length, number of fertile tillers and shoot dry mass varied with groups of rice accessions (Table 8). For root dry mass, an expressive variation was found among the genotypes, being the means ranging from 5.16 to 84.26 g. BRS Pampa showed the best performance with root mass ~16-times higher than BRS Atalanta, the lowest-performing genotype. For the eight remaining genotypes, three presented intermediate means and other five showed the lowest means for the variable.
Table 8. Means for root dry mass (RDM), shoot length (SL), number of fertile tillers (NFT) and shoot dry mass (SDM) in a selected set of Brazilian rice accessions grown in PVC tubes and assayed at R4 stage.
| Accessions | RDM (g) | SL (cm) | NFT | SDM (g) |
| Arroz de Sequeiro | 6.25c* | 87.00b | 3.83c | 22.84b |
| BRS Atalanta | 5.16c | 77.33c | 4.50c | 17.06c |
| BRS Colosso | 8.07c | 80.17c | 4.83c | 22.74b |
| BRS Ligeirinho | 5.40c | 71.33d | 4.67c | 19.81c |
| BRS Pampa | 84.26a | 68.33d | 13.83a | 71.55a |
| BRS Querência | 8.76c | 77.50c | 4.67c | 24.48b |
| BRS Vencedora | 26.41c | 91.33b | 4.67c | 58.82a |
| Farroupilha | 53.12b | 102.33a | 5.33c | 45.29a |
| Hybrid H4 | 46.63b | 67.67d | 5.00c | 52.8a |
| SCS112 | 37.30b | 89.50b | 9.83b | 39.97a |
*Means followed by same letter in the column does not differ significantly (p ≤ 0.05) by Scott-Knott test.
For the shoot traits (shoot length, number of fertile tillers and shoot dry mass), the amplitudes among genotype means were smaller. BRS Pampa was the most expressive genotype for root dry mass. It was situated in the last class of means for shoot length, but once more in the top class for number of tillers and shoot dry mass. This singular performance allowed this genotype was grouped in a distinct group, whereas all other genotypes were clustered in a single group, according to all grouping methods applied for these data, viz., Tocher optimization method based on the Mahalanobis mean distance (Table 9), UPGMA clustering (Figure 6) and graphical dispersion of the first two canonical variables (Table 10, Figure 7), denoting the agreement between the clustering methods applied.
Table 9. Cluster generated by Tocher Optimization method based on the Mahalanobis average distance, estimated from 10 rice genotypes grown in PVC tubes at greenhouse in the pre-flowering phase (R4).
| Group | Accessions | |
| 1 | Arroz de Sequeiro 0335, BRS Atalanta, BRS Colosso, BRS Ligeirinho, BRS Querência, BRS Vencedora, Farroupilha, Hybrid H4 and SCS 112. | |
| 2 | BRS Pampa |

Figure 6. Dendrogram obtained by Mahalanobis distance and the UPGMA clustering method from root and shoot traits of ten rice genotypes grown in PVC tubes. The cophenetic correlation coefficient was 0.90. The names of the genotypes were simplified due to space limitations.
Table 10. Cumulative variance of the canonical variables obtained for four traits that presented significant differences evaluated in 10 rice genotypes grown in PVC tubes in the pre-flowering phase.
| Canonical Variable | Estimate of Eigenvalues | ||
| Variances | Variances (%) | Accumulated (%) | |
| 1 | 103.11 | 79.28 | 79.28 |
| 2 | 16.33 | 12.55 | 91.84 |
| 3 | 9.83 | 7.55 | 99.4 |
| 4 | 0.77 | 0.59 | 100 |

Figure 7. Graphical dispersion of the scores of the first (CV 1) and second (CV 2) canonical variables of 10 rice genotypes grown in PVC tubes at a greenhouse, evaluated at pre-flowering phase. Group I: 1- BRS Ligeirinho, 7- BRS Vencedora, 6- Farroupilha, 5- Arroz de Sequeiro, 9- SCS 112, 8- Hybrid H4, 2- BRS Atalanta, 3- BRS Querência, 4- BRS Colosso; Group II: 10- BRS Pampa.
DISCUSSION
The root system presents a wide range of roles for plant growth and development, being the key role the root anchorage and the water and nutrient uptake from soil solution, in addition to the biosynthesis of amino acids and phytohormones, and others (Wu and Cheng 2014). Several studies have shown genetic variability in rice pool gene for root morphology with impacts on yield, then motivating breeding programs to bring more attention to root improvement (Uga et al. 2009, Gowda et al. 2011, Henry et al. 2012, Vejchasarn et al. 2016). However, no study has been published in recent years characterizing the root growth of Southern Brazilian rice genotypes.
A potential reason for the reduced number of studies focusing on root traits can be the difficulty of working with root measurements, which requires special methods and tools, such as already reported in previous studies (Uga et al. 2009, Coudert et al. 2010). This is the reason why we used two different methods in this study: the hydroponic system to evaluate seedlings and the PVC tubes to evaluate adult plants, which have to be useful for this purpose, although both are very simple methods. Gradually, automated growing systems integrated to imaging equipment and special software are taking place in the field, allowing improvements in root phenotyping (Clark et al. 2011, Atkinson et al. 2019). However, the cost of such equipment is still a barrier to their broad use.
When analyzing the genotypes focusing on root growth, in both experiments, some general observations can be made. Firstly, a certain level of genetic variability for root growth could be verified within the group assayed, however it has to be considered as moderate. Only part of the measured traits presented statistical significance, i.e., only one or two traits per experiment were significant, and, among the statistically significant variables, not many groups of means were observed (only from two to three groups), especially for the seedling period. Despite of that, some genotypes showed prominent performance for root growth, as BRS Pampeira during the seedling stage (especially at 28 days) and BRS Pampa for the reproductive period. These two cultivars are among the most recent ones included in this study, suggesting that the breeding efforts which has been carried out to select high yielding cultivars (Streck et al. 2018a) could also be selecting for improved root traits. In other words, this improved root system may be contributing for the high yield, the reason why these cultivars were launched.
In this study, all genetic variability analyses carried out have taken together root and shoot traits in order to collect a more comprehensive and even useful result. In general, the genetic variability within this group can be considered narrow, given that most clustering methods have grouped the majority of the accessions in a main group, and few remaining genotypes in other one to three clusters. In fact, in a recent study where 92 rice accessions were characterized, in two years for 35 traits (not including roots), authors concluded the genetic base of the cultivars grown in Southern Brazil is narrow (Streck et al. 2017). Another study, which evaluated part of the germplasm studied here, in distinct conditions, including greenhouse, authors have agreed with this restrict variability (Streck et al. 2018b). Despite of these results, another work has shown that the rice genetic progress in Southern Brazil has been advancing in a linear raise, for the last 45 years (Streck et al. 2018a). Thus, the observed narrowing of the rice genetic variability has not been such a barrier, at least not yet, for the rice breeding progress or has been overcome through the introduction or generation of punctual and useful new genetic variability.
As a final consideration, more studies on root assessment must be carried out on the Southern Brazilian rice germplasm. Although there are difficulties on this kind of experiment, a larger number of genotypes should be assayed, as well as for more traits, including anatomical, biochemical and molecular ones, as carried out by other research groups (Uga et al. 2009, Henry et al. 2012), to get a more comprehensive understanding of the available genetic variability regarding root growth in the Brazilian rice. In addition, these further studies should aim to associate variations in rice growth to improvements in yield or other agronomic traits, as such that new breeding strategies could be drawn in the aim of constantly developing improved rice cultivars.
In conclusion, the genetic variability within the group of rice accessions assayed is narrow, based jointly on root and shoot traits, however BRS Pampeira, for seedling stage, and BRS Pampa, for reproductive stage, show prominent performance for root morphology.
Acknowledgements
We acknowledge CNPq, CAPES and FAPERGS which provided scholarships for the students and fellowships for the researchers.
References
- Atkinson JA et al. 2019. Uncovering the hidden half of plants using new advances in root phenotyping. Current Opinion in Biotechnology 55:1-8.
- BRASIL. 2009. Ministério da Agricultura e da Reforma Agrária. Regras para análise de sementes. Brasília, DF: SNDA/DNDV/CLAV.
- Clark RT et al. 2011. 3-Dimensional root phenotyping with a novel imaging and software platform. Plant physiology 156:455-465.
- CONAB – Companhia Nacional de Abastecimento. 2017. Acompanhamento da Safra Brasileira de Grãos 2016/2017 – Sétimo levantamento – Accessed on May 24, 2017. Available at: www.conab.gov.br.
- Coudert Y et al. 2010. Genetic control of root development in rice, the model cereal. Trends in Plant Science 15:219-226.
- Counce PA et al. 2000. A uniform, objective, and adaptive system for expressing rice development. Crop Science 40:436-443.
- Cruz CD 2013. GENES – a software package for analysis in experimental statistics and quantitative genetics. Acta Scientiarum. Agronomy 35:271-276.
- FAO – Food and Agriculture Organization of the United Nations. 2016. Save and grow in practice: maize, rice, wheat. A Guide to Sustainable Cereal Production. 110 p.
- Gowda VRP et al. 2011. Root biology and genetic improvement for drought avoidance in rice. Field Crops Research 122:1-13.
- Henry A et al. 2011. Variation in root system architecture and drought response in rice (Oryza sativa): phenotyping of the OryzaSNP panel in rainfed lowland fields. Field Crops Research 120:205-214.
- Henry A et al. 2012. Root attributes affecting water uptake of rice (Oryza sativa) under drought. Journal of experimental botany 63:4751-4763.
- Kell DB. 2011. Breeding crop plants with deep roots: their role in sustainable carbon, nutrient and water sequestration. Annals of Botany 108:407-418.
- Shashidhar HE et al. 2012. PCV Tubes to characterize roots and shoots to complement field plant productivity studies. In: Shashidhar HE et al. (Eds). Methodologies for root drought studies in rice. Philippines: International Rice Research Institute. pp.15-21.
- Singh D. 1981. The relative importance of characters affecting genetic divergence. The Indian Journal of Genetic Plant Breeding 41:237-245.
- Singh RK et al. 2010. Varietal improvement for abiotic stress tolerance in crop plants: special reference to salinity in rice. In: Pareek A et al. (Eds). Stress adaptation in plants: physiological, molecular and genomic foundation. New York: Springer. pp.387-415.
- Streck EA et al. 2017. Variabilidade fenotípica de genótipos de arroz irrigado via análise multivariada. Revista Ciência Agronômica 48:101-109.
- Streck EA et al. 2018a. Genetic Progress in 45 Years of Irrigated Rice Breeding in Southern Brazil. Crop Science 58:1094-1105.
- Streck EA et al. 2018b. Distância genética entre cultivares de arroz irrigado em experimentos conduzidos a campo e em casa de vegetação. Revista de Ciências Agroveterinárias 17:505-514.
- Streck EA et al. 2019. Genotypic performance, adaptability and stability in special types of irrigated rice using mixed models. Revista Ciência Agronômica 50:66-75.
- Uga Y et al. 2009. Variation in root morphology and anatomy among accessions of cultivated rice (Oryza sativa L.) with different genetic backgrounds. Breeding Science 59:87-93.
- Vejchasarn P et al. 2016. Genetic variability in phosphorus responses of rice root phenotypes. Rice 9:29.
- Wu W and Cheng S. 2014. Root genetic research, an opportunity and challenge to rice improvement. Field Crops Research 165:111-124.
