Identification and Validation of Genotoxic Impurity in Ezetimibe by Reverse Phase High-Performance Liquid Chromatography
Boddu Veeraswami* and Rayala Ramarao
Central Research Laboratories, GITAM School of Science, GITAM Deemed to be University, Vishakhapatnam-530045, India.
Corresponding Author E-mail: veeraswamiboddu@gmail.com
DOI : http://dx.doi.org/10.13005/ojc/390410
Article Received on : 28 Mar 2023
Article Accepted on : 08 Jul 2023
Article Published : 10 Jul 2023
Reviewed by: Dr. R. K. Lal
Second Review by: Dr. Guna Shekar
Final Approval by: Dr. B. K Sharma
The method emphasizes identification and validation of potential Genotoxic impurity in pharmaceutical drug substances of Ezetimibe by Reverse Phase High-Performance Liquid Chromatography (HPLC). The impurity was separated by using the Zorbax Rx Octylsilane (C8) HPLC column with 250 cm length and internal diameter of 4.6 mm with pore size 5 μm. The partition of impurity was operated at a significant pH 3.0 was maintained by buffer of 10% potassium dihydrogen phosphate and Acetonitrile with 80:20 ratio and the mobile phase is Acetonitrile with a gradient inflow of 1.5 mL/min. The UV absorption maximum were observed at 258 nm. The proposed approach shows the results of linear boundaries in between 0.16 μg/g to 7.5 μg/g with correlation coefficient is lower than 0.999. The method was further evident by accuracy results are in the region of 98.82% to101.04% for Genotoxic impurity of (5R, 6S)-1-(4-fluorophenyl)-5-((S)-3-(4-fluorophenyl)-3-hydroxypropyl)-3-(2-hydroxy-1-phenylethyl)-6-(4hydroxyphenyl)di-hydropyrimidine-2,4(1H,3H)-dione. The approach was shown acceptable results as per International Council of Harmonisation (ICH) guidelines and the method was operated even at lower concentrations.
KEYWORDS:Cholesterol related disorders; Ezetimibe; Genotoxic impurity; HPLC; ICH guidelines
Download this article as:| Copy the following to cite this article: Veeraswami B, Ramarao R. Identification and Validation of Genotoxic Impurity in Ezetimibe by Reverse Phase High-Performance Liquid Chromatography. Orient J Chem 2023;39(4). |
| Copy the following to cite this URL: Veeraswami B, Ramarao R. Identification and Validation of Genotoxic Impurity in Ezetimibe by Reverse Phase High-Performance Liquid Chromatography. Orient J Chem 2023;39(4). Available from: https://bit.ly/3PPc3Rb |
Introduction
Ezetimibe is an active pharmaceutical ingredient was used as a cholesterol penetration blockage and then it was segregated a new classification of its kind. Its chemical name is (3R,4S)-1-(4-fluorophenyl)-3-[(3S)-3-(4-fluorophenyl)-3-hydroxypropyl]-4-(4-hydroxyphenyl)-2-azetidinone and its structure was shown in Figure 1. The most significant function is dietary and biliary cholesterol absorption potentially inhibits by Ezetimibe1 from human intestine without affecting vitamins present in the fat2. The intake of cholesterol leads to malfunctions of intestinal lumen cholesterol evacuation and lower the absorption of small intestinal enterocyte3. The supported clinical trial results evident for the treatment for several cholesterol related disorders like hypercholesterolemia, homozygous familial and homozygous sitosterolemia4,5. This drug was commercially available in different forms of either individual or combinations other biological ingredients at various concentrations manufactured by different pharma companies.
 |
Figure 1: Ezetimibe structure with IUPAC name |
As per the recent release guidelines of ICH M7 emphasizes the risk assessment of Genotoxic impurities in drug substances and drug products makes more caution towards their usage in several treatment. The word Genotoxicity is very familiar to pharma industries and regulatory authorities because of toxic nature when it was reacted with cells in the body it may leads to several change in biological reactions including mutations does not lead to heritability modifications. The significant importance was given to mutagenicity testing of any drug sample of API enlightened information on various genetic changes in cells, this information further useful to regulatory authorities for their approvals. In the Present investigation describes the presence of one Genotoxic impurity in Ezetimibe drug substance usually formed during their synthetic process.
There were various analytical methods6-12 were available for the estimation of assay and related compounds of Ezetimibe in both active pharmaceutical ingredient and drug substances by using Liquid Chromatography connected with Mass Spectrometry13, High-Performance Thin Layer Chromatography14, High-Performance Liquid Chromatography, Ultra Performance Liquid Chromatography15 and Ultra-Performance Liquid Chromatography Mass Spectrometer16 (UPLC-MS/MS) & Liquid Chromatography tandem Mass spectrometric17 (LC-MS/MS) techniques. The pharmacopeia18 directed researchers for the identification and quantification for the various impurities found in the drugs and the process related impurities including degradation impurities. Some of the literature studies related impurities by HPLC and LCMS19-21 reported in Ezetimibe drug substance. There was no reported analytical method for identified Genotoxic impurity in Ezetimibe Active Pharma Ingredient (API) by using High Performance Liquid Chromatographic technique.
Material and Methods
Materials
The chemicals used in this method are acetonitrile (HPLC grade, Purity-99.9 %) and Ortho phosphoric acid (GR grade, Purity-85.0 %) purchased from Merck Ltd., India. Ultra-pure water is used for this method from Milli-Q water purification system (Millipore USA). The samples of standard of Impurity-A and Ezetimibe were purchased from Toronto research chemicals, Canada were used for this entire study. All dilutions were performed in the standard volumetric flask.
Conditions of chromatographic method
For determination of Ezetimibe Genotoxic impurity from the experimental study on Agilent manufactured high performance liquid chromatograph equipped with Sample manager, Quaternary solvent manager, column heating compartment & variable wavelength detector (VWD), with a Empower control software. The chromatographic requirements are Zorbax Rx C8 HPLC column is used with dimensions; 0.25 m X4.6 mm X 5μm. All quantitative samples are weighted on Sartorius semi micro analytical balance along with Bandelin sonicator and Thermo pH meter, were used for dissolving the standard sample & buffer pH adjustments and finally, Hermle centrifuge machine was used for centrifuging of turbidity components.
Mobile phase standard and sample solutions preparations
Preparation of Buffer
2.7 g of Monopotassium phosphate (KH2PO4) dissolved (weigh to accuracy of 0.001 g) into half-filled with water of 1000 ml beaker and then completely dissolved with remaining portion with water; adjust the volume to pH 3.0 ± 0.05 with diluted 10% phosphoric acid. Filter the solution through cartridge filter for removal of undissolved particles and degas the solution for 10 minutes in sonicator instrument.
Mobile phase preparation
Mobile phase Preparation -A
Mix Acetonitrile and Buffer in composition of 20:80(v/v) respectively.
Mobile phase Preparation -B
Pure Acetonitrile as used.
Preparation of diluent
All solutions have been prepared by acetonitrile as a diluent.
Standard stock solutions preparation
Weighed and transferred about 10.0 mg of Imp-A standard into a 100 mL flask and dissolved in 50mL of diluent by sonication, then diluted volume with diluent. Took 2.5 mL of this solution fed in to 50 mL of volumetric flask and further make up to the mark with diluent whose concentration is 5 µg/mL of Imp-A.
Solution of system checks standard preparation
Pipetted out 5mL of above aliquots (standard stock solution) and transferred into 50mL flask. Diluted and makeup with diluent up to the mark. The resulted system checks solution concentration was 0.5µg/mL.
Sample solution preparation
Accurately weighted 0.1mg of Ezetimibe sample and transferred into 5 micro litter flask and added 2.5 micro litter of diluent and dissolved the components for 10 min by sonication. Later, this solution makeup with diluent up to mark.
Results and Discussions
Method Development
Based on the route of synthesis of Ezetimibe drug substance and analysed the purity by using agencies published monograph HPLC method but there are no additional peaks were observed. As part of internal development works, a short run time HPLC method has been developed and which gave the clue for peaks in chromatogram. A new peak has been observed and it was well-separated from main peak, labelled as impurity-A. During sample analysis the missing assay was observed. For impurity-A structure confirmation (Figure 2) and LC-MS analysis has been performed and the base peak of m/z 572 showed in mass spectra with positive mode of ESI-MS (Electro Spray Ionization Mass Spectrometry) technique are shown in Figure 3 and Figure 4 shows the possible way of fragmentation for the formation of various ions.
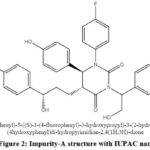 |
Figure 2: Impurity-A structure with IUPAC name |
 |
Figure 3: Mass spectra and MS-MS spectra of Impurity-A |
 |
Figure 4: Mass fragmentation pathway of Impurity-A |
The analytical method was optimized (Table 1) to estimate the Genotoxic impurity of Impurity-A in the Ezetimibe drug substance by using HPLC equipment. The key parameters like injection volume, column oven temperature, selection of wave length, diluent, HPLC column, flow rate and mobile phase.
Table 1: Optimized Chromatographic Conditions
|
Chromatographic Conditions |
|
|
Column |
Zorbax Rx C8 HPLC column |
|
Column oven temperature |
37 °C |
|
Flow rate for instrument |
1.5 mL/min |
|
Injection volume |
30 µL |
|
Wavelength |
258 nm |
|
Run time |
50 min |
|
Buffer solution |
For pH = 3 optimized by combination of Potassium dihydrogen phosphate with water & 10% phosphoric acid |
|
Mobile-phase A |
Buffer 80 % : Acetonitrile 20 % |
|
Mobile-phase B |
Acetonitrile |
|
Diluent |
Acetonitrile |
Wavelength selection
Impurity-A standard solution was prepared by using diluent and the obtained solution concentration was ~ 0.5µg/mL. This solution was injected by using High-performance liquid chromatographic instrument with variable detector of Photo Diode Array detector and absorption maxima of impurity-A was shown about 258.88 nm. Hence, we quantified this impurity at 258 nm in Ezetimibe drug substance. The obtained spectrum of impurity-A was presented in Figure-5.
 |
Figure 5: Absorption spectrum of Impurity-A |
Column selection
Based on the packing material, internal diameter, length and particle size of the column, various experimental trails were made for column selection. Finally, good peak separation was achieved in Zorbax Rx C8 HPLC column.
Selection of mobile phase
Initial trials, we have started with combination of water and methanol as a mobile phase in the different ratio, in all trails the interested component of impurity-A peak was not eluted. Later modified the organic phase in different proportions with acetonitrile. The experiment was continued and it was observed that impurity-A peak has more tailing factor and peak shape was broad. For improving of impurity-A peak shape, milli-Q water was substituted with buffer of phosphate and experiment was continued with different portions of acetonitrile. Mixture of mobile phase composition was finalized after various experiments and as the gradient programme contain mobile phase A mixture of acetonitrile and buffer pH3.0 ± 0.05(2.7g of Potassium monophosphate in 1000mL water, adjust pH3.0 with 10% phosphoric acid) of 20:80(v/v) respectively and mobile phase B acetonitrile.
Selection of column oven temperature
After several trials with different column oven temperatures, we found that the optimum temperature to attain accuracy results at 37±1 °C column temperature and also suite for the well separated and the reproducible results.
Selection of flow rate
For efficient separation with good resolution of chromatograms the optimized the mobile phase inoculation rate is in between 0.5 mL/min to 2.0 mL/min. The correct rate of inflow was set at 1.5 mL/min was gave separation chromatogram.
Selection of injection volume
For good chromatogram, optimized the injection volume from 5-50µL. finally, we found that 30µL was gave separation chromatogram.
Selection of diluent
The Ezetimibe drug substance and Imp-A solubility were checked in different solvents like methanol, deionized water, buffer solution of mobile phase-A, acetonitrile and the aquas combinations of all above said solvents in different proportions. Good solubility was observed in acetonitrile. So, Acetonitrile was selected as diluent for the optimization of analytical method.
Analytical methodology and validation
A High-performance liquid chromatographic with Reverse phase approach was established and the method was validated for the quantification of Imp-A in Ezetimibe API was validated based on ICH and USP guidelines. Specific validation parameters were experimentally evaluated by Ezetimibe sample solution injected along with imp-A standard solution.
System suitability
The standard solutions of impurity-A was prepared at a strength of 0.5 µg/mL and took 30 µL of this solution was inoculated in to the HPLC system for about six times repetitions to check the correctness the approach by studying their results are tailing factor, theoretical plate counts and % RSD are in acceptance with ICH guidelines and these are tabulated in Table 2 and their chromatogram is shown in Figure 6.
Specificity
The developed method for specificity was established by injecting blank, impurity standard solution, Ezetimibe drug substance, and impurity spiked solution. The observed chromatograms are no interference peak for blank, an elution was observed at 15.621 min for impurity, at below 10 min elution for Ezetimibe sample and elution at 15.520 min for spiked samples. Specificity parameter executed chromatograms were presented in Figures 7 to 10.
 |
Figure 6: Overlay Chromatograms of six replicate standard injections |
Table 2: System Suitability of six replicate standard injections
|
Injection S.No. |
Retention time in minutes |
Area |
|
1 |
15.524 |
43872 |
|
2 |
15.554 |
43541 |
|
3 |
15.532 |
42986 |
|
4 |
15.492 |
43128 |
|
5 |
15.497 |
44301 |
|
6 |
15.544 |
43674 |
|
Mean |
43584 |
|
|
Standard deviation |
484.2564 |
|
|
% RSD |
1.1111 |
|
|
Tailing factor |
1.06 |
|
 |
Figure 7: Blank chromatogram |
 |
Figure 8: Impurity-A chromatogram |
 |
Figure 9: Ezetimibe 100% sample chromatogram |
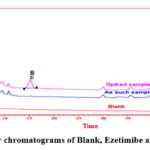 |
Figure 10: Overlay chromatograms of Blank, Ezetimibe and Spiked samples |
Limit of impurity Detection & Quantification (LOD & LOQ):
For impurity-A, LOD and LOQ was performed by S/N ratio method and preparing various concentrations of impurity-A solution and evaluated with HPLC instrument. The LOD concentration of the impurity (0.167 µg/g) was determined by observing that the s/n (signal-to-noise) ratio was approximately 3:1 shows 3.15. The LOQ concentration of the impurity-A (0.506 µg/g) was determined by observing an S/N ratio of approximately 10:1 shows 10.63 and their respective chromatograms are Figure11 and 12.
 |
Figure 11: Chromatogram of Limit of detection |
 |
Figure 12: Chromatogram of Limit of Quantitation |
Precision at LOQ level
Impurity-A solution was prepared at LOQ concentration level for determination impurity precision and six replicates were injected into developed method conditions. The calculated % RSD for area of six injections and calculated values were summarized in Table 3.
Table 3: Limit of Quantitation results (LOQ)
|
Injection serial No. |
Retention time in minutes |
Area |
|
LOQ injection-1 |
15.778 |
4865 |
|
LOQ injection-2 |
15.789 |
4689 |
|
LOQ injection-3 |
15.795 |
4763 |
|
LOQ injection-4 |
15.769 |
4986 |
|
LOQ injection-5 |
15.785 |
4892 |
|
LOQ injection-6 |
15.772 |
4941 |
|
Mean |
4856 |
|
|
Standard deviation |
111.3912 |
|
|
Relative Standard Deviation in % |
2.2939 |
|
Linearity and Range
Established the linearity validation parameter by preparing the standard solutions through quantitative dilutions of the impurity standard stock solution to 150%, 120%, 100%, 80%, 50% and LOQ.
Analyzed each diluted concentration and have been recorded area responses at 250 nm. Draw the linearity plot between peak vs concentration and calculated the correlation coefficient of the regression line, slope, intercept and sum of squares. By injecting the impurity-A solution at the range of upper (150%) and lower (LOQ) level of target concentration linearity was evaluated. The obtained linearity results tabulated in Table 4 and linearity curve represented in Figure-13 for impurity. Experimental Linearity and range analytical chromatograms were showed in Figure-14.
Table 4: Linearity Parameter Results
|
Concentration Level |
Concentration in µg/g |
Area |
|
Solution at LOQ |
0.5035 |
4596 |
|
Solution at 50 % |
2.5175 |
21678 |
|
Solution at 80 % |
4.0280 |
35289 |
|
Solution at 100 % |
5.0350 |
44632 |
|
Solution at 120 % |
6.0420 |
52369 |
|
Solution at 150 % |
7.5525 |
66043 |
|
Slope |
8728.2489 |
|
|
Y-Intercept |
79.7769 |
|
|
Correlation Coefficient |
0.9999 |
|
|
Residual Sum Square |
0.9997 |
|
Study of precision
Repeatability and intermediate precision studies were performed on the precision of the developed analytical method.
Repeatability
Six sample solutions of Ezetimibe were prepared with spiking the Imp-A analyzed in the proposed instrument conditions and examine the precision of the analytical method. The mean of impurity-A, standard deviation and the %RSD of outcomes were found to be within the limits.
 |
Figure 13: Linearity graph of Impurity-A |
 |
Figure 14: Overlay chromatogram Linearity of Impurity-A (LOQ to 150%) |
Intermediate Precision
By performing the intermediate precision analysis by different operators on two days by using different system. The average area of impurity-A, standard deviation and the relative standard deviation of outcomes were reveals to be meet the criteria. Table 5 & Table 6 represent the repeatability and intermediate precision data.
Table 5: Repeatability Results.
|
Preparation |
Weight (mg) |
Area |
Impurity (%) |
Impurity (µg/g) |
|
Sample solution-1 |
500.42 |
47053 |
0.0005104 |
5.104 |
|
Sample solution-2 |
500.98 |
46592 |
0.0005219 |
5.219 |
|
Sample solution-3 |
499.81 |
46359 |
0.0005148 |
5.148 |
|
Sample solution-4 |
500.14 |
47287 |
0.0005242 |
5.242 |
|
Sample solution-5 |
500.42 |
47693 |
0.0005229 |
5.229 |
|
Sample solution-6 |
500.95 |
46894 |
0.0005340 |
5.340 |
|
Mean |
5.214 |
|||
|
SD |
0.0817 |
|||
|
%RSD |
1.5668 |
|||
Table 6: Reported Results of Precision at Intermediate Level
|
Preparation |
Weight (mg) |
Area |
Impurity (%) |
Impurity (µg/g) |
|
Sample solution-1 |
501.25 |
46872 |
0.0005187 |
5.187 |
|
Sample solution-2 |
500.37 |
46269 |
0.0005208 |
5.208 |
|
Sample solution-3 |
500.94 |
47013 |
0.0005234 |
5.234 |
|
Sample solution-4 |
500.72 |
46980 |
0.0005368 |
5.368 |
|
Sample solution-5 |
500.43 |
47630 |
0.0005236 |
5.236 |
|
Sample solution-6 |
499.86 |
46183 |
0.0005385 |
5.385 |
|
Mean |
5.270 |
|||
|
SD |
0.0849 |
|||
|
%RSD |
1.6105 |
|||
|
Combined %RSD of Repeatability and Intermediate Precision |
1.6146 |
|||
Accuracy
By spiking the impurity-A into the sample at upper and lower concentrations and analyzed in the method conditions. The spiked and recovered amount of impurity-A was calculated the percentage of recovery was tabulated in Table 7. The obtained recovery values are in between 98% to 102% and which provides the recovery nature of method.
Table 7: Accuracy Parameter Results
|
Strength |
weight of the compound (mg) |
Amount added (µg/g) |
Response |
Amount found (µg/g) |
Recovery (%) |
Average recovery (%) |
% of RSD |
|
At LOQ |
500.61 |
0.527 |
4763 |
0.521 |
98.86 |
98.82 |
1.40 |
|
500.46 |
0.532 |
4896 |
0.530 |
97.42 |
|||
|
499.89 |
0.544 |
4968 |
0.545 |
100.18 |
|||
|
50 % |
500.04 |
2.601 |
24698 |
2.543 |
97.77 |
99.04 |
1.44 |
|
501.08 |
2.582 |
24796 |
2.597 |
100.58 |
|||
|
500.53 |
2.608 |
25731 |
2.576 |
98.77 |
|||
|
100% |
501.84 |
5.214 |
48468 |
5.302 |
101.69 |
100.52 |
1.12 |
|
500.63 |
5.328 |
47638 |
5.298 |
99.44 |
|||
|
500.24 |
5.293 |
47196 |
5.316 |
100.43 |
|||
|
150% |
499.91 |
7.635 |
67642 |
7.845 |
102.75 |
101.04 |
1.64 |
|
500.27 |
7.721 |
68432 |
7.792 |
100.92 |
|||
|
500.86 |
7.694 |
69367 |
7.690 |
99.45 |
Solution stability
Impurity-A stability was established by using the precision sample and it was kept in RT for a period of 24 hours and analyzed in an interval of 4 hours increment up to four hours and then analyzed with an interval of 4 hrs up to 24 hrs. The chromatograms were evaluated and the absolute variation was calculated with impurity content initial with each time point. The complete results are summarized in below Table 8.
Table 8: Solution Stability Results
|
Interval |
Area |
Content (µg/g) |
Absolute variation |
|
Initial |
45628 |
5.268 |
— |
|
4 Hours |
45123 |
5.263 |
0.005 |
|
8 Hours |
46798 |
5.259 |
0.009 |
|
12 Hours |
47014 |
5.256 |
0.012 |
|
16 Hours |
44989 |
5.258 |
0.010 |
|
20 Hours |
45289 |
5.261 |
0.007 |
|
24 Hours |
45916 |
5.254 |
0.014 |
Conclusions
The proposed method was used for the identification of genotoxic impurity (3R,4S)-1-(4-fluorophenyl)-3-[(3S)-3-(4-fluorophenyl)-3-hydroxypropyl]-4-(4-hydroxyphenyl)-2-azetidinone in Ezetimibe active pharmaceutical ingredient by RP-HPLC, UV method was advised and validated. This method was developed to be simple, precise, linear, accurate, and low-cost approach. As a result, this technology can be utilised in the quality control department to analyse low-level of impurity-A in pharmaceutical compound of Ezetimibe on a regular basis.
Acknowledgment
The authors are acknowledged to GITAM University, Visakhapatnam for proving necessary facilities to do this research work.
Conflict of Interest
All the authors are declared to publish this work. There was no conflicts of interest.
References
- Van Heek, M., France, C. F., Compton, D. S., McLeod, R. L., Yumibe, N. P., Alton, K. B., Sybertz, E. J., Davis, H. R., J Pharmacol Exp Ther. 1997, 283, 157-63 PMID: 9336320
- Knoop, R.H., Bays, H., Manion, C.V., Lipka, L.J., Melani, L., LeBeaut, A.P., Suresh, R. and Veltri, E.P. Proceedings of the 72nd EAS Congress, P175, 90
- Davis, H.R. International Congress Series 2004, 1262, 243 – 246
- Dujovne, C.A., Ettinger, M.P., McNeer, J.F., Lipka, L.J., LeBeaut, A.P., Suresh, R., Yang, B., Veltri, E.P. Am. J. Cardiol. 2002, 90, 1092-7 DOI: 10.1016/s0002-9149(02)02798-4
- Ballantyne, C.M., Houri, J., Notarbartolo, A., Melani, L., Lipka, L.J., Suresh, R., Sun, S., LeBeaut, A.P., Sager, P.T., Veltri, E.P. Circulation. 2003, 107, 2409-15 DOI: 10.1161/01.CIR.0000068312.21969.C8.
- Luo, Z., Deng, Z., Liu, Y., Wang, G., Yang, W., Hou, C., Tang, M., Yang, R., Zhou, H. Talanta. 2015, 139, 67-74
- Balasubramanian, H., Suresh Kumar, R., Jaya Shree, A., Dama., V.R. J. Chromatogr. Sci. 2019, 57, 71-80 https://doi.org/10.1093/chromsci/bmy084
- Baokar, S.B., Erande, R.S., Shaikh., S.G. Inter. J. Pharm. Biomed. Sci. 2021, 2, 833-841
- Kumar, S A., Debnath M.,Seshagiri Rao J.V.L.N., Gowri Sankar D. Adv Pharm Bull. 2015, 5, 385-91
- Xue-Ping, Z.H.U. Chin. Pharm. J. 2017, 24, 140-146
- Beludari, M.I., Karanam, V.P., Ghanta, K.M., Int. J. Chem. Anal. Sci. 2013, 4, 205-209
- Saranjit, S., Baljinder, S., Rakesh, B., Lalit, W., Rahul, S.; J. Pharm. Biomed. Anal. 2006, 41, 1037-1040 DOI: 10.1016/j.jpba.2006.01.030
- Kancherla, P., Velpuri, V., Alegete, P., Saeed, S., Albaseer, M. K., Das, P. J. Taibah Univ. Sci, 2016, 10, 148-160 https://doi.org/10.1016/j.jtusci.2015.08.001
- Chaudhari, B. G., Patel, N. M., Shah, P. B., Modi, K. P. Indian J. Pharm. Sci. 2006, 68, 793-796
- Yarra, U.S.T., Gummadi, S. Futur. J. Pharm. Sci. 2021, 7,209https:// doi.org/10.1186/s43094-021-00363-8
- Vejendla, A., Talari, S., Ramu, G., Rajani, C.H., Futur. J. Pharm. Sci. 2021, 7, 234
- El-Bagary, R.I., Elkady, E. F., Abdelaziz El-Sherif, Z., Kadry, A.M. J. Chromatogr. Sci. 2014, 52, 773-780 https://doi.org/10.1093/chromsci/bmt109
- United States Pharmacopeia, 38th ed. Ezetimibe Monograph, United States Pharmacopeial Convention, Rockville, MD, USA, 2014, 8082-8083
- Dong, S., Yang, H., Ye, D., J. Chromatogr. Sci. 2018, 56, 724-730 https://doi.org/10.1093/chromsci/bmy048
- Esen, B. A., Bekir, Karlığa. J. Pharm. Anal. 2015, 5, 356-370 doi: 10.1016/j.jpha.2015.04.002
- Saroj kumar, R., Atna Bhaskar, A., Jhansi, D. Asian J Pharm Clin Res. 2015, 8(2), 178-181

This work is licensed under a Creative Commons Attribution 4.0 International License.
About The Author
![]()
A New Edition of Web of Science
Journal Impact Factor
2022: 0.5
Five Year: 0.8
Journal is Indexed in

Cabells Whitelist
![]()


