A Validated Stability Indicating RP-HPLC Method for Quantification of Cilnidipine in Bulk and in Tablet Dosage Form
Rameshwar Gholve* and Sanjay Pekamwar
School of Pharmacy, Swami Ramanand Teerth Marathwada University, Nanded – 431606, Maharashtra – India.
Corresponding Author E-mail: Rameshwar.Gholve@hotmail.com
DOI : http://dx.doi.org/10.13005/ojc/370522
Article Received on : 14-Jul-2021
Article Accepted on : 13-Oct-2021
Article Published : 18 Oct 2021
Reviewed by: Dr. W Simanjuntak
Second Review by: Dr. Ajay Jain
Final Approval by: Dr. Pounraj Thanasekaran
A stability indicating RP-HPLC method has been developed for quantification of Cilnidipine in bulk and in tablet dosage form. The chromatographic analysis was accomplished at ambient temperature on Xttera RP18 (100 x 4.6 mm, 3.5 µm) column and 1 mL/min flow rate by using Eluent composed of 10 mM phosphate buffer pH 2.6 with Acetonitrile (300:700, v/v). The UV detection at the wavelength of 240 nm was carried out using 20 µL injection volume. The Cilnidipine retention time was found to be 3.029 min. The method in the range of 40.0573 – 120.1719 µg/mL was found to be linear (R2 = 0.999) with a detection limit and quantitation limit of 1.2038 and 3.6478 μg/mL, respectively. The mean recovery % over the three tested levels of 50, 100, and 150% were found to be 98.74, 99.60, and 98.23%, respectively. The mean % assay of 99.29 for method repeatability and 98.82 for intermediate precision were found with % RSD of 0.68 and 0.31, respectively. Cilnidipine drug substance and their product exposed to acid, alkali, oxidative, thermal, photolytic, and humidity stress conditions. The acid, alkali, and photolytic induced stress studies signifying the formation of a variety of degradants and their peaks were well resolved from that of active analyte peak. Hence, it is recommended that the Cilnidipine drug substance, as well as drug product, should be store in a tightly closed container protected from light. The method as per ICH guidelines was validated for specificity, linearity, detection limit, quantitation limit, precision, accuracy, robustness, solution stability, and can be effectively used for routine analysis.
KEYWORDS:, Cilnidipine; Forced Degradation; RP-HPLC; Solution stability; Validation
Download this article as:| Copy the following to cite this article: Gholve R, Pekamwar S. A Validated Stability Indicating RP-HPLC Method for Quantification of Cilnidipine in Bulk and in Tablet Dosage Form. Orient J Chem 2021;37(5). |
| Copy the following to cite this URL: Gholve R, Pekamwar S. A Validated Stability Indicating RP-HPLC Method for Quantification of Cilnidipine in Bulk and in Tablet Dosage Form. Orient J Chem 2021;37(5). Available from: https://bit.ly/3pcJnEp |
Introduction
Chemically, Cilnidipine is 1,4-Dihydro-2,6-dimethyl-4-(3-nitrophenyl)-3,5-Pyridine dicarboxylic acid 2-methoxyethyl (2E)-3-phenyl-2-propenyl ester (Figure 1). It is a light yellow, crystalline powder and official in Indian Pharmacopoeia.
Cilnidipine is a dihydropyridine derivative of 4th generation Ca++ channel blocker developed by Fuji Viscera Pharmaceutical Company and Ajinomoto, Japan and used for the treatment of hypertension. It is approved in Japan, India, China, Korea and some of the European countries.1-3
 |
Figure 1: Structure of Cilnidipine |
Literature review shows that few methods are reported for the determination of Cilnidipine by HPLC4-7 technique. The reported HPLC methods have certain limitations such as difficult solution preparation procedures and long run time. Among the reported methods, some method reports about forced degradation study, that too with only mild stress condition on the drug substance only but not on drug product. Also, solution stability of standard, sample, and mobile phase along with few robustness parameters are needed to be performed. Hence, present work endeavours to perform forced degradation study at more harsh stress condition on drug substance as well as drug product for the development of validated stability indicating RP-HPLC method for the Cilnidipine estimation which will be more simple, sensitive, rapid, precise, accurate and robust enough.
Stress testing used to illustrated the inherent stability features of the active component.8 Related substances are generated as degradants from improper handling or storage and/ or as impurities from manufacturing process or as metabolites that may be inactive, active or sometime toxic and affecting the results of quality, safety and efficacy. The method capable to resolves degradation products or impurities from the active component has considered as good stability indicating approach.9-12
Materials and Methods
Materials
Alkem Laboratories Ltd., Mumbai – Maharashtra (India) provided a free sample of pure drug Cilnidipine (Batch no.: JR/CLN/FP/17006, Assay: 99.25%). The chemicals like Ultrapure Water, Ortho-Phosphoric Acid (OPA), Potassium Dihydrogen Phosphate (PDP), Acetonitrile (ACN), Sodium Hydroxide (NaOH), 6 % v/v Hydrogen Peroxide (6 % v/v H2O2), Hydrochloric Acid (HCl), Methanol (MeOH), etc of HPLC grade or equivalent were utilized for the study. CILACAR® 10 – each film-coated tablets contain Cilnidipine 10 mg was procured from the local market (Batch no.: KC919095, Make: J. B. Chemicals and Pharmaceuticals Ltd., Daman – India).
Instrument
Materials weighed by using an analytical weighing balance (Model: CY204, Make: Citizon). Ultrasonic Bath (Model: LMUC-3, Manufacturer: Labman Scientific Instruments) was employed for the sonication. The estimation of solution pH was done by using Digital pH meter (Model: LT-49, Make: Labtronic Laboratory Instruments). Refrigerator (Model: GL-A282SPZL, Make: LG) was also utilized for solution stability study. The Photostability Chamber (Model: SRL-PHSC-11-A, Make: SR Lab Instruments India Pvt. Ltd.), Hot Air Oven (Model: BTI-29, Make: Bio-Technics India), and Stability Chamber (Model: GMP, Make: Labline Stock Centre) were used during the forced degradation study. Ultrapure Water was collected from Water Purification System during experimental work (Model: WPS211; Make: Analytical Technologies Limited). The method was developed by using Shimadzu HPLC (SCL-10Avp) having 20 μL rheodyne sample injector and UV detector. Cilnidipine elution was performed using Xttera RP18 (100 x 4.6 mm, 3.5 µm) column having P/N: 186000438 (Make: Waters) as stationary phase. LCsolution version 1.25 software was employed to control the chromatographic system and also for the data collection and data processing.
Chromatographic conditions
Chromatographic conditions used for Cilnidipine analysis are mentioned in Table 1.
Table 1: Chromatographic conditions
|
Parameters |
Description |
|
|
Instrument Name |
: |
HPLC |
|
Detector |
: |
UV |
|
Eluent (Mobile Phase) |
: |
10 mM phosphate buffer pH 2.6 and Acetonitrile (300:700, v/v) |
|
Column |
: |
Xttera RP18 (100 x 4.6 mm, 3.5 µm) column (P/N: 186000438, Make: Waters) |
|
Pump mode |
: |
Isocratic |
|
Detection Wavelength |
: |
240 nm |
|
Column temperature |
: |
Ambient (about 25°C) |
|
Volume of Injection |
: |
20 µL |
|
Flow rate |
: |
1.0 mL/ min |
|
Run time |
: |
6 min |
|
Diluent/ Solvent (Blank) |
: |
Mobile Phase |
Preparation of 10 mM phosphate buffer pH 2.6
Weighed and transferred 1.36 g of PDP into 1000 mL of water. Sonicated for 10 min to dissolve and pH 2.6 adjusted with 5% OPA and further filtered by utilizing 0.45 µm Nylon membrane filter (Manufacturer: Advanced Microdevices Pvt. Ltd.) under vacuum filtration.
Mobile phase preparation
Mixed pH 2.6 phosphate buffer (10 mM) and ACN (300:700, v/v) and sonicated for 10 min to degas.
Standard solution preparation
Weighed Cilnidipine standard (20 mg) and subsequently added into a 50 mL volumetric flask. To this, 35 mL of diluent was added and sonicated the solution for 5 min by intermittent shaking to dissolve the content. Kept this prepared solution on bench top to reach room temperature (RT) and up to the mark, filled with diluent, and mixed well (Cilnidipine concentration = 400 μg/mL).
Transferred exactly 5 mL of this produced stock solution of the standard into a 25 mL volumetric flask and with diluent, made up to mark. Mixed well and used this solution as a working standard solution (Cilnidipine concentration = 80 μg/mL).
The suitability of standard was confirmed with duplicate standard preparations.
Sample solution preparation
Weighed 20 Cilnidipine Tablets 10 mg (CILACAR® 10) to determine the average weight, and subsequently transferred 248.6 mg powdered tablets (equivalent to 20 mg of Cilnidipine) into a 50 mL volumetric flask. To this, 35 mL of diluent was added and sonicated the solution for 15 min by intermittent shaking to dissolve the content. Kept this prepared solution on bench top to reach room temperature and up to the mark, filled with diluent, and mixed well. Whatman filter paper (Manufacturer: GE Healthcare UK Ltd.) was utilized to filter this solution by discarding 5 mL of the earliest filtrate.
Transferred exactly 5 mL of this produced stock solution of sample into a 25 mL volumetric flask and with diluent, made up to mark. Mixed well and used this solution as the working sample solution.
Method validation
According to ICH guidelines Q2 (R1), the proposed chromatographic method was validated.13
Specificity
For this, interference was checked at the retention time of the Cilnidipine peak from the blank solution. In addition to this, specificity was studied in a forced degradation study with isocratic elution mode by doubling the run time to check any late eluting degradant peak. In this study, forced degradation was carried out by subjecting known concentration of Cilnidipine drug substance (API) as well as drug product sample (CILACAR® 10) to various stress conditions like acid (2N HCl, 3 hrs at RT), alkali (2N NaOH, 3 hrs at RT), oxidative (6 % v/v, H2O2, 3 hrs at RT), thermal (700C in a hot air oven for 24 hrs), photolytic (UV light in Photostability Chamber for 24 hrs) and humidity (75% RH in Stability Chamber for 48 hrs) degradations.
Similarly, blank solutions (without active components) were prepared for acid, alkali, and oxidative stress conditions to verify no interference at Cilnidipine retention time. However, the proposed RP-HPLC method was used to analyze all stressed samples, and results for % assay and % degradant (mass balance) were determined against the standard and judged with the unstressed sample.
System Repeatability and System Suitability
The parameters of system suitability were checked from 1st injection of standard solution. To check system reproducibility, % RSD was determined from five replicates injection of standard solution 1. Also, injected the one replicate of standard solution 2 and % relative difference between two standard solutions was calculated to confirm the suitability of standard.
Linearity
Linearity solutions for Cilnidipine in the range of 40.0573 – 120.1719 µg/mL were prepared from standard stock (concentration = 2002.8650 μg/mL) solution and established with different five concentrations from 50 to 150 % levels to nominal working concentration. The squared correlation coefficient (R2) was determined from the linearity plot recorded for concentration vs. peak area response.
Detection Limit (DL) and Quantitation Limit (QL)
The DL and QL of Cilnidipine were derived based on the standard deviation of the response (residual value) and the slope method. It was calculated as per ICH guidelines from the calibration curve of Cilnidipine by using the below equations.
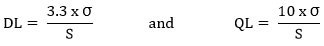
Where, σ = the standard deviation of the response; S = the slope of the calibration curve.
Accuracy
Accuracy was evaluated by analyses of triplicate samples at three concentrations levels 50, 100, and 150 % of nominal working concentration which containing a placebo mixture with Cilnidipine. Recovery results were calculated by injecting each sample once into the chromatographic system, and the mean recovery % at each level for triplicate samples was reported.
Precision
Precision should be studied using a homogeneous sample of Cilnidipine for assay determination.
Method Repeatability
It was performed by injecting 6 sample solutions prepared independently for Cilnidipine Tablets 10 mg using batch no. KC919095 (Make: J. B. Chemicals and Pharmaceuticals Ltd., Daman – India) as per the developed method. Also, results of system repeatability and system suitability were determined. Results were calculated for Assay percentage, %RSD, and 95% confidence interval.
Intermediate Precision
It was performed on 6 sample solutions prepared independently of the same sample of Cilnidipine Tablets 10 mg analyzed in Method Repeatability on a different day by the different analyst. Also, results of system repeatability and system suitability were determined. Results were calculated for Assay percentage, %RSD, and 95% confidence interval. In addition to this, % relative difference was determined between results of Method Repeatability (MR) and Intermediate Precision (IP).
Robustness
The filter compatibility for Cilnidipine Tablets 10 mg was established on triplicate sample preparations and divided all sample preparation into 3 parts. As per method, Whatman filter (Manufacturer: GE Healthcare UK Ltd.) was used to filter one part by discarding first 5 mL filtrate. The 0.45 µm Nylon Syringe filter (Manufacturer: Advanced Microdevices Pvt. Ltd.) was used to filter second part by discarding the first 5 mL filtrate and the 0.45 µm PVDF Syringe filter (Manufacturer: Advanced Microdevices Pvt. Ltd.) was used to filter third part by discarding first 5 mL filtrate. At last, results were calculated for % assay and % relative difference.
The changes in sonication time from 10 min to 20 min were performed to check the extraction efficiency of the method for sample preparation. This was demonstrated by using 3 replicate sample preparations of CILACAR® 10 for every changed condition. At last, the results were calculated for % assay and % relative difference.
Robustness was performed by making a little variation in chromatographic parameters like flow rate (± 0.1 mL/min); composition of mobile phase buffer (± 10%); mobile phase buffer pH (± 0.2); PDP quantity changed in mobile phase buffer (± 10%) and assessed the impact of every altered condition on the method. The results of system repeatability and system suitability were verified for all robustness parameters.
Stability of Solution
The solution stability of standard was checked after day 1 and day 2 storage in the refrigerator (2 – 8 °C) and at room temperature on duplicate preparations. The percentage relative difference was calculated among the peak area observed from freshly prepared and stored standard solution.
The sample solution stability was checked after day 1 and day 2 storage at the refrigerator (2 – 8 °C) and at room temperature on triplicate sample preparations. The % relative difference between stored and initial sample solutions (% assay) was calculated.
The mobile phase stored at bench top (room temperature) was evaluated after day 1 and day 2 for their stability. The appearance, system repeatability, and system suitability parameters were observed at the time of evaluation.
Range
The range of method is established based on precision, accuracy, and linearity data. Linearity, as well as accuracy for Cilnidipine was verified from 50 to 150 % of the nominal working concentration.
Result and Discussion
Chromatographic Method Development and Optimization
The parameters like specificity, linearity, accuracy, range, precision, and robustness were considered during RP-HPLC method development and validation for Cilnidipine in bulk and in tablet dosage form. The several different mobile phase (Eluent) compositions were undertaken to select the appropriate mobile phase, and subsequently flow rate and working wavelength optimization were performed. Also, method optimization was made by using changed columns, ODS Hypersil, 250 x 4.0 mm, 5 µm (Make: Thermo Scientific, P/N: 30105-254030), Xttera RP18, 100 x 4.6 mm, 3.5 µm (Make: Waters; P/N: 186000438) and Oyster ODS3, 150 x 4.6 mm, 5 µm (Make: Merck, P/N: S670153). The ACN and MeOH were utilized as organic modifiers with Acetate buffer (10 mM) pH 4.5 and phosphate buffer (10 mM) at pH 3.0, 2.6 to get the best peak shape.
At last, the mobile phase (Eluent) comprised by phosphate buffer (10 mM) pH 2.6 ± 0.05 (adjusted with 5% OPA) and ACN in the ratio of 300:700, v/v was selected for Cilnidipine because it retained the peak of Cilnidipine in a short period with satisfactory number of theoretical plates and tailing factor. UV detection at 240 nm was used to record response with flow rate 1.0 mL/min at ambient condition (about 25°C) and 20 µL of injection volume. All calculations for quantitative assay of Cilnidipine were made on the basis of peak area.
Method Validation
Specificity
Interference was not observed from the blank at the retention time of Cilnidipine peak indicating the method specificity. The representative chromatograms of blank, Cilnidipine standard and sample are given in Figure 2.
 |
Figure 2: Representative chromatograms of (a) Blank, (b) Standard, and (c) Sample |
The forced degradation results shows that interference was not found at the retention time of Cilnidipine peak from the degradant peaks. Cilnidipine drug substance solution mass balance data was clearly demonstrated that the response is decreased in acid and alkali stressed solution with increase in the response of peaks of degradant, and major degradant found at 1.756 and 1.741 min respectively.
Cilnidipine drug product mass balance data clearly demonstrated that the response is decreased in acid, alkali, and photolytic stressed sample with increase in the degradant peaks response, and major degradant found at 1.418, 1.423 and 2.785 min respectively. This shows that Cilnidipine was stable to humidity, thermal and oxidative stressed conditions while unstable to acid, alkali, photolytic stress conditions (Table 2). Hence, it is recommended that the Cilnidipine drug substance as well as drug product should be store in a tightly closed container protected from light.
Table 2: Forced degradation results
|
Sample name |
Condition |
% Assay |
% Total degradation |
% Mass Balance |
|||
|
DS |
DP |
DS |
DP |
DS |
DP |
||
|
Unstressed |
As per test method |
99.29 |
100.97 |
NTD |
NTD |
99.29 |
100.97 |
|
Acid stressed |
2N HCl at RT for 3 hrs |
97.77 |
99.39 |
1.15 |
0.29 |
98.92 |
99.68 |
|
Alkali stressed |
2N NaOH at RT for 3 hrs |
98.49 |
57.96 |
0.90 |
26.25 |
99.39 |
84.21 |
|
Oxidative stressed |
6% H2O2 at RT for 3 hrs |
100.96 |
99.76 |
NTD |
NTD |
100.96 |
99.76 |
|
Photolytic stressed |
UV light for 24 hrs |
98.52 |
97.22 |
NTD |
1.21 |
98.52 |
98.43 |
|
Thermal stressed |
70°C for 24 hrs in oven |
99.93 |
100.31 |
NTD |
NTD |
99.93 |
100.31 |
|
Humidity stressed |
75 % RH for 48 hrs |
100.55 |
101.29 |
NTD |
NTD |
100.55 |
101.29 |
NTD = not detected; RH = relative humidity; RT = room temperature; DS = drug substance; DP = drug product
The chromatograms of degradation samples (Figure 3 – Figure 5) were demonstrating that degradant peak separated from the drug peak, shows method is specific.
 |
Figure 3: Chromatograms of acid stressed (a) Blank; (b) Cilnidipine API; (c) Sample |
 |
Figure 4: Chromatograms of alkali stressed (a) Blank; (b) Cilnidipine API; (c) Sample |
 |
Figure 5: Chromatograms of photolytic stressed (a) Cilnidipine API; (b) Sample |
System Repeatability and System Suitability
Chromatographic system reproducibility features were established by system repeatability and system suitability parameters (Table 3).
Table 3: Results of system repeatability and system suitability
|
Parameters |
Results |
Acceptance criteria |
|
Retention time (min) |
3.029 |
NA |
|
USP plate counts |
4185 |
≥ 2000 |
|
USP tailing |
1.22 |
0.8 – 2.0 |
|
% RSD found from injections of standard 1 (5 replicate) |
0.40 |
≤ 2.0 % |
|
The % relative difference between 2 different standard |
0.77 |
≤ 2.0 % |
Linearity
The method was linear for Cilnidipine from 40.0573 – 120.1719 µg/mL (R2 = 0.999) over 50 to 150% level of nominal working concentration (Table 4). A result of linearity for Cilnidipine shows a good linear relationship in this studied range, representing the method fitness for analysis. Linearity graph of Cilnidipine is given in Figure 6.
Table 4: Results for Linearity
|
Level of Linearity (%) |
Concentration (µg/mL) |
Peak area |
|
50 |
40.0573 |
196600 |
|
75 |
60.0860 |
299653 |
|
100 |
80.1146 |
396599 |
|
125 |
100.1433 |
499922 |
|
150 |
120.1719 |
603745 |
|
Squared correlation coefficient (R2); ≥ 0.995 |
0.999 |
|
|
(Y-intercept/ peak area at 100% standard concentration) x 100; ≤ 3.0 |
1.64 |
|
 |
Figure 6: Linearity graph of Cilnidipine |
Detection Limit and Quantitation Limit
The Cilnidipine DL was 1.2038 µg/mL, shows that even little amount of the drug can be detected. The Cilnidipine QL was 3.6478 µg/mL, shows that even little amount of the drug can be quantified.
Accuracy
The results of average % recovery for Cilnidipine were found to be 98.74, 99.60, and 98.23 % at 50, 100, and 150 % levels respectively of nominal working concentration (Table 5). This shows the accuracy of the method and the excipients have no interference in the determination.
Table 5: Accuracy results
|
Accuracy level (%) |
Concentration (µg/mL) |
Average % Recovery* |
% RSD |
|
50 |
40 |
98.74 |
0.43 |
|
100 |
80 |
99.60 |
0.62 |
|
150 |
120 |
98.23 |
0.33 |
*Average of three replicate
Precision
Results of MR and IP study illustrated that the % RSD values for Cilnidipine were less than 2.0 (Table 6), indicating that the method is reproducible as well as precise.
Table 6: Precision results
|
Sample No. |
Weight of sample (mg) |
Peak area |
% Assay |
|||
|
MR |
IP |
MR |
IP |
MR |
IP |
|
|
1 |
247.1 |
248.1 |
401601 |
397420 |
99.43 |
98.38 |
|
2 |
248.8 |
247.9 |
400605 |
399312 |
98.50 |
98.93 |
|
3 |
246.7 |
249.6 |
398761 |
402495 |
98.88 |
99.04 |
|
4 |
248.2 |
248.4 |
405543 |
401324 |
99.96 |
99.23 |
|
5 |
249.6 |
249.2 |
403134 |
400572 |
98.81 |
98.72 |
|
6 |
245.9 |
247.5 |
402636 |
397528 |
100.17 |
98.65 |
|
Average |
– |
– |
– |
– |
99.29 |
98.82 |
|
% RSD |
– |
– |
– |
– |
0.68 |
0.31 |
|
% Relative Difference |
– |
– |
– |
– |
– |
0.47 |
|
95 % CI |
– |
– |
– |
– |
98.75 – 99.83 |
98.58 – 99.06 |
95 % CI = 95 % Confidence Interval
Robustness
Results of sample filtered through 0.45 µm Nylon Syringe filter and 0.45 µm PVDF Syringe filter were met the % relative difference criteria (≤ 3.0 %) with results obtained with Whatman filter paper (Table 7). Hence, apart from Whatman filter paper, the 0.45 µm Nylon Syringe filter and 0.45 µm PVDF Syringe filter are also suitable for the assay samples filtration.
Table 7: Results for changed filter
|
Name of Filter |
Sample |
Assay (%) |
% RD |
|
Whatman filter (as per method) |
1 |
99.96 |
NA |
|
2 |
98.81 |
NA |
|
|
3 |
100.17 |
NA |
|
|
0.45 µm Nylon Syringe filter |
1 |
99.23 |
0.74 |
|
2 |
98.30 |
0.52 |
|
|
3 |
99.74 |
0.43 |
|
|
0.45 µm PVDF Syringe filter |
1 |
98.56 |
1.41 |
|
2 |
98.20 |
0.62 |
|
|
3 |
100.52 |
0.34 |
RD = Relative Difference; NA = Not applicable
The results obtained by varying time of sonication for preparation of sample from 10 min to 20 min were not affected for Cilnidipine Tablets 10 mg (Table 8) and met the acceptance criteria for % relative difference (≤ 3.0 %).
Table 8: Robustness results for changed sonication time
|
Sample sonication (min) |
Change in time (min) |
Sample |
Assay (%) |
Average |
% Relative Difference |
|
15 (As per method) |
0 |
1 |
99.43 |
98.94 |
NA |
|
2 |
98.50 |
||||
|
3 |
98.88 |
||||
|
10 |
– 5 |
1 |
98.76 |
99.13 |
0.20 |
|
2 |
100.22 |
||||
|
3 |
98.42 |
||||
|
20 |
+ 5 |
1 |
100.06 |
99.41 |
0.48 |
|
2 |
99.74 |
||||
|
3 |
98.43 |
The results were met the acceptance criteria for system repeatability, system suitability, and retention time variation (Table 9) for each changed parameter, indicating its robustness.
Table 9: Robustness results for changed chromatographic conditions
|
Chromatographic conditions variation |
Retention time (min) |
Tailing factor |
Plate count |
% RSD |
Retention time in min from sample |
|
As per method |
3.206 |
1.23 |
4396 |
0.51 |
3.022 |
|
Flow rate – 0.1 mL/min |
3.339 |
1.24 |
4535 |
0.33 |
3.434 |
|
Flow rate + 0.1 mL/min |
2.815 |
1.21 |
4152 |
0.66 |
2.824 |
|
Buffer phase – 10 % |
2.825 |
1.28 |
4072 |
0.92 |
2.785 |
|
Buffer phase + 10 % |
3.436 |
1.24 |
4512 |
1.50 |
3.392 |
|
Buffer pH – 0.2 |
3.045 |
1.23 |
4248 |
1.74 |
3.195 |
|
Buffer pH + 0.2 |
3.126 |
1.20 |
4263 |
0.48 |
3.086 |
|
Quantity of PDP – 10 % |
3.357 |
1.25 |
4267 |
0.54 |
3.197 |
|
Quantity of PDP + 10 % |
3.210 |
1.21 |
4161 |
0.22 |
3.197 |
|
Acceptance criteria |
NA |
0.8–2.0 |
≥ 2000 |
≤ 2.0 |
Similar to standard |
Solution stability
The standard solution was found to be stable up to 2 days (Table 10) in the refrigerator (2 – 8 °C) and at room temperature and the % relative difference (% RD) met the acceptance criteria (≤ 2.0 %).
Table 10: Stability of standard solution
|
Time in Days |
First standard solution |
Second standard solution |
||||
|
Response/mg |
% Relative Difference |
Response/mg |
% Relative Difference |
|||
|
Fresh standard |
Stored standard |
Fresh standard |
Stored standard |
|||
|
Room temperature |
||||||
|
Initial |
20165.2970 |
NA |
NA |
20011.0784 |
NA |
NA |
|
1 |
20022.0906 |
20256.9802 |
1.16 |
20022.0906 |
20151.7157 |
0.64 |
|
2 |
19941.5975 |
20253.2673 |
1.54 |
19941.5975 |
19926.8137 |
0.07 |
|
Refrigerator (2 – 8 °C) |
||||||
|
Initial |
20165.2970 |
NA |
NA |
20011.0784 |
NA |
NA |
|
1 |
20022.0906 |
20120.3465 |
0.49 |
20022.0906 |
19917.9902 |
0.52 |
|
2 |
19941.5975 |
19860.3465 |
0.41 |
19941.5975 |
19697.1078 |
1.24 |
The sample preparation was found to be stable for 2 days (Table 11) in the refrigerator (2 – 8 °C) and at room temperature as the % relative difference (≤ 3.0 %) met the acceptance criteria.
|
Time |
Sample No. |
Refrigerator |
Room Temperature |
||
|
Assay (%) |
% RD |
Assay (%) |
% RD |
||
|
Initial |
1 |
99.43 |
NA |
99.43 |
NA |
|
2 |
98.50 |
NA |
98.50 |
NA |
|
|
3 |
98.88 |
NA |
98.88 |
NA |
|
|
Day 1 |
1 |
100.45 |
1.02 |
99.83 |
0.40 |
|
2 |
99.81 |
1.32 |
100.22 |
1.74 |
|
|
3 |
101.07 |
2.19 |
99.75 |
0.88 |
|
|
Day 2 |
1 |
99.70 |
0.27 |
99.20 |
0.24 |
|
2 |
99.48 |
0.99 |
99.27 |
0.77 |
|
|
3 |
99.59 |
0.71 |
99.36 |
0.48 |
|
The mobile phase preparation was found to be stable for day 2 at room temperature as its clear appearance was found and met the acceptance criteria of system repeatability and system suitability during the evaluation of stability (Table 12).
Table 12: Results for mobile phase stability
|
Time |
Working standard solution |
Retention time in min from sample |
|||
|
Retention time (min) |
Tailing factor |
Plate count |
% RSD |
||
|
Initial |
3.029 |
1.22 |
4185 |
0.40 |
3.082 |
|
Day 1 |
3.128 |
1.27 |
4500 |
0.50 |
3.150 |
|
Day 2 |
3.106 |
1.28 |
4393 |
0.14 |
3.084 |
|
Acceptance criteria |
NA |
0.8 – 2.0 |
≥ 2000 |
≤ 2.0 |
Similar to standard |
Range
The method range for Cilnidipine was found from 50 to 150% level of nominal working concentration derived from suitable precision, accuracy, and linearity results.
Comparison with reported methods for Cilnidipine estimation
The proposed research work is offering a variety of advantages like short run time of the component with simple solution preparations in comparison with earlier reported work. Hence, this method is more cost-effective as it needs less analysis time. Two standard preparations are used to prove the system repeatability and system suitability of the method during the analysis. Robustness for change in filter
and change in sonication time are performed. Also, solution stability is reported for standard, sample and mobile phase preparations. In addition to this, forced degradation study was carried out at more harsh stress conditions on drug product and drug substance. The obtained validation results suggests that the proposed RP-HPLC method is found to be more simple, specific, rapid, linear, accurate, precise and robust enough in comparison with reported methods (Table 13).
Table 13: Comparison with reported methods for Cilnidipine estimation
|
Parameters |
Safhi and Nagaraj, 2013 7 |
Kadam et al., 2015 6 |
Ravi Shankar et al., 2019 5 |
Tiwari et al., 2020 4 |
Proposed Method |
|
Type of system |
HPLC with UV detector |
HPLC with PDA detector |
HPLC with UV detector |
HPLC with UV detector |
HPLC with UV detector |
|
Mobile Phase (Eluent) |
MeOH : Phosphate buffer (0.05 M) pH 3 (80:20, v/v) |
MeOH, Sodium Dihydrogen Orthophosphate buffer (pH=3) and ACN (75:18:7 v/v/v) |
ACN : MeOH (50:50, v/v) |
MeOH : PDP buffer (50:50, v/v) |
Phosphate buffer (10 mM) pH 2.6 and ACN (300:700, v/v) |
|
Column |
Grace C18 (4.6 x 250 mm)* |
Kromasil C18 (4.6 x 250 mm, 5 μm) |
Thermo Scientific C18 (4.6 x 250 mm, 5 μm) |
Cosmosil (4.6 x 250 mm, 5 μm) |
Waters Xterra RP18 column (4.6 x 100 mm, 3.5 µm) |
|
Flow Rate |
1.0 mL/ min |
1.0 mL/ min |
1.0 mL/ min |
1.0 mL/ min |
1.0 mL/ min |
|
Temperature of Column |
Room temperature |
Ambient |
25°C |
Ambient |
Ambient (about 25 °C) |
|
Detection Wavelength |
254 nm |
240 nm |
242 nm |
241 nm |
240 nm |
|
Pump Mode |
Isocratic |
Isocratic |
Isocratic |
Isocratic |
Isocratic |
|
Run Time |
10 min |
20 min |
10 min |
15 min |
6 min |
|
Advantage |
1. Considered as stability indicating method 2. Standard solution stability established
|
Considered as stability indicating method |
— |
—
|
1. Short run time 2. Easy solution preparations 3. Standard, sample and mobile phase preparation stability established 4. Robustness for change in filter and change in sonication time is performed 5. FD performed on DS and DP, hence considered as stability indicating Method |
|
Shortcoming |
1. FD performed only on DS not on DP as well as for thermal stressed condition 2. Long run time |
1. FD performed only on DS not on DP 2. Long run time
|
1. FD not performed 2. Long run time |
1. FD not performed 2. Long run time |
Separation as well as degradation products structural depiction were not done |
|
Applications |
1. Estimation of Cilnidipine in bulk and in Tablets 2. Stability sample analysis |
1. Estimation of Cilnidipine in bulk and in Tablets 2. Stability sample analysis |
Estimation of Cilnidipine in bulk and in Tablets |
Estimation of Cilnidipine
|
1. Estimation of Cilnidipine in bulk and in Tablets 2. Stability sample analysis |
*Particle size not reported by Author; FD = Forced Degradation; DS = Drug Substance; DP = Drug Product; NA = Not applicable
Conclusion
Stability indicating method for quantification of Cilnidipine in bulk and in tablet formulation was developed and validated by using RP-HPLC technique as per ICH guidelines. The RP-HPLC method results are linear in the proposed working concentration range as well as robust, accurate, precise, and specific. The results of forced degradation shows that the developed method is specific as well as stability indicating as peaks observed due to the degradants were distinguishable from the active analyte peaks. The solution stability results proved that preparations of standard, sample, and mobile phase can be used up to 2 days. Also, the easy solution preparations and simple isocratic elution offered cost–effective and rapid analysis of the drug. This method can be utilized in the quality control for regular analysis as well as stability studies of Cilnidipine in bulk and in their dosage form.
Acknowledgment
Authors are thankful to RUSA Centre for Herbo Medicinal Studies and School of Pharmacy, S. R. T. M. University, Nanded – Maharashtra (India) for providing chemicals, laboratory, instrumental and other necessary facilities for research work. Authors are also thankful to Alkem Research Laboratories Pvt. Ltd., Mumbai – Maharashtra (India) for providing gift sample of Cilnidipine.
Conflicts of interest
The authors report no conflict of interest.
References
- Indian Pharmacopoeia, Government of India, Ministry of Health and Family Welfare, Indian Pharmacopoeia Commission, Gaziabad, 2018, Vol. II, 1616–1617.
- Cilnidipine. https://go.drugbank.com/drugs/DB09232
- Chandra, K. S.; Ramesh, G. Indian Heart J. 2013, 65(6), 691–695.
CrossRef - Tiwari, B.; Shirsat, M. K.; Kulkarni, A. J Drug Deliv Ther. 2020, 10(1), 97-100.
CrossRef - Sankar, P. R.; Swathi, V.; Babu, P. S. Int J Pharm Sci & Res. 2019. 10(4), 1886–1894.
- Kadam, A.; Hamrapurkar, P.; Patil, S.; Manoharan, M.; Suryagandha, A. Int J Pharm Sci Rev Res. 2015, 30(1), 177–181.
- Safhi, M. M.; Nagaraj, M. Y.; Res J Pharm Technol. 2013, 6(3), 296–299.
- ICH guideline, Q1A (R2): Stability Testing of New Drug Substances and Products, International Conference on Harmonization, Geneva. (https://www.ich.org/page/quality-guidelines), 2003.
- Thakur, A.; Mishra, B.; Mahata, P. P. Int. J. Pharm. Chem. 2015, 5, 232–239.
- Blessy, M.; Patel, R. D.; Prajapati, P. N.; Agrawal, Y. K. J Pharm Anal. 2014, 4(3), 159–165.
CrossRef - Alsante, K. M.; Baertschi, S. W.; Coutant, M.; Marquez, B. L.; Sharp, T. R.; Zelesky, T. C. Degradation and Impurity Analysis for Pharmaceutical Drug Candidates. In: Ahuja, S.; Scypinski, S. (eds.) Handbook of Modern Pharmaceutical Analysis. Elsevier Science Publishing Co Inc., San Diego, CA, USA, 2011, 10, 59–169.
CrossRef - Aubry, A. F.; Tattersall, P.; Ruan, J. Development of Stability Indicating Methods. In: Huynh-Ba, K. (ed.) Handbook of Stability Testing in Pharmaceutical Development. Springer, New York, 2009, 139–161.
CrossRef - ICH guideline, Q2 (R1): Validation of Analytical Procedures: Text and Methodology, International Conference on Harmonization, Geneva. (https://www.ich.org/page/quality-guidelines), 2005.

This work is licensed under a Creative Commons Attribution 4.0 International License.
About The Author
![]()
A New Edition of Web of Science
Journal Impact Factor
2022: 0.5
Five Year: 0.8
Journal is Indexed in

Cabells Whitelist
![]()


