A New Frontier Drug Development in Nanomedicine and Itsanti-Urolithiatic Activity of Kalanchoe Pinnata
F. Janeeta Priya1* , A. Leema Rose1, S. Vidhya1, A Arputharaj2, S. Akshana1 and U. F. Rameez Fathima1
1Department of Chemistry, Holy Cross College, Affiliated to Bharathidasan University,Tiruchirappalli 620002,TamilNadu, India.
2Department of Electronics, St. Joseph’s College,Affiliated to Bharathidasan University, Tiruchirappalli 620002, Tamil Nadu, India.
Corresponding Author E-mail: janeetapriya@gmail.com
DOI : http://dx.doi.org/10.13005/ojc/370226
Article Received on : 16-02-2021
Article Accepted on :
Article Published : 01 Apr 2021
Latterly, the green synthesis of metallic nanoparticles has stock pile and terminal interest over the last decade due to their idiosyncratic properties that make them felicitous in various fields of science and technology. In this study the silver nanoparticles can be manufacture by using the leaf extract of Kalanchoe pinnata plant using microwave radiation method. The nanoparticles that are synthesized by plants are non-toxic and eco-friendly and it is characterized by using UV-Visible, FT-IR , X-ray diffraction (XRD) and TEM.The crystalline natures of the synthesized silver nanoparticles were identified by XRD and its shape was confirmed by TEM analysis. Anti-urolithiatic activity of synthesized silver nanoparticles was accomplished which reduces the growth of kidney stone which was appraisal by using the In-Vitro growth of urinary calculi.
KEYWORDS:Anti-Urolithiatic Activity; FTIR; Kalanchoe pinnata; TEM; UV-Vis; XRD
Download this article as:| Copy the following to cite this article: Priya F. J, Rose A. L, Vidhya S, Arputharaj A, Akshana S, Fathima U. F. R. A New Frontier Drug Development in Nanomedicine and Itsanti-Urolithiatic Activity of Kalanchoe Pinnata. Orient J Chem 2021;37(2). |
| Copy the following to cite this URL: Priya F. J, Rose A. L, Vidhya S, Arputharaj A, Akshana S, Fathima U. F. R. A New Frontier Drug Development in Nanomedicine and Itsanti-Urolithiatic Activity of Kalanchoe Pinnata. Orient J Chem 2021;37(2). Available from: https://bit.ly/3mnvHTD |
Introduction
Kidney stone is a most common disease for urinary tract infections. It is the type of disorder which affects the 12% of the population in the world 1-3. At the end stage it leads to the renal failure. The contraption of the stone formation involves the complex process such as nucleation, super saturation, growth, aggregation and retention process which are associated with the physiochemical events. Contemporarily, there is no adequate drug to cure the prevention of reoccurrences of kidney stone. Recent studies investigated the work on the silver nanoparticles which are incorporated with the plant extract shows the medicinal applications and especially the anti-urolithiatic activity. The leaves of the Kalanchoe pinnata plant naturally containing the various anti-oxidant properties. The leaf powder of this plant was taken for curing the burning in urination, blocked urination and leprosy4. The compounds present in the plants can acts as anticancer agents. Kalanchoe pinnata is far better than aspirin; the aqueous extract of this plant shows the antinoceptive effect and produces the hormone such as prostaglandin, histamine. Currently, organic and inorganic nanoparticles can attractively to the field for diagnosis of kidney stones5-7. The silver nanoparticles were synthesized from the aqueous solution of silver nitrate by using the leaf extract of Kalanchoe pinnata plant 8.
Experimental methods
Collection of plant materials
The healing plant used in this study is the leaves of Kalanchoe pinnata plant which was collected from the Gandhi market area of Tiruchirappalli district, Tamil Nadu. The collected leaves were thoroughly washed with running water and shade dried for 10-15 days after that with the help of mortar and pestle the leaves were grinded; the powdered plant sample is utilized for the synthesis of silver nano particles.
Preparation of the extract
The Kalanchoe pinnata plant leaf extract was prepared by using water as a solvent. By using solvent extraction process the plant extract was prepared. Then hot percolation method was carried out and the filtrate can be collected and it might be used for further studies 9.
Quantitative analysis
Test for flavanoid
To determine the quantitative analysis of flavonoid 10 g of plant sample is extracted with 100ml of aqueous methanol at room temperature. Then the solution is filter and the filtrate is transferred into water bath and the solution is evaporated to dryness finally sample weighed
Test for tannin
Spectrophotometer is used to determine the quantity of tannin.0.5g of plant sample is weighed and then 50 ml of distilled water is added and stirred for 1hr.The sample is filtered into a 50 ml volumetric flask and made upto mark then 5ml of filtered sample is mixed with 2ml of 0.1M HCl and 0.008M K4Fe(CN)6 3H2O .The absorbance of the sample is measured using a spectrophotometer at 395 nm wavelength within 10 min.
Test for saponin
To determine the quantitative analysis of saponin 20g of grounded plant sample is put into a conical flask and 100ml of 20%C2H5OH is added. The sample is heated for 4hrs continuously at 55ºc the mixture is then filtered and the residue is extracted with another 200 ml of 20% ethyl alcohol the combine extracts are reduced to 40 ml at about 90ºc.the concentrated solution is then transferred into 250ml separating funnel and shaken vigorously by adding 20 ml (CH3CH2)2O.
Test for alkaloid
To determine the quantitative analysis of alkaloids 200ml of 10% CH3CO2H in C2H5OH is added to 5g of plant sample then the mixture is covered and allowed to stand for 4hrs.The mixture is filtered and the extract is allowed to become concentrated in a water bath till ¼ of original volume is reached after that concentrated NH4OH is added till the precipitation is complete. Then the precipitate collected and washed with dilute NH4OH and filtered. Finally the residue alkaloid is dried and washed.
Test for phenol
The quantity of phenols is determined by spectrophotometer method. The plant sample is boiled with 50ml of(CH3CH2)O for 15mins. Then 10ml of distilled water is added to the 5ml of the boiled sample in a 50ml flask. After that 2ml of NH4OH solution and 5ml of concentrated CH3(CH2)3CH2OH is added to the mixture. The sample is made upto the mark and left for 30mins to react for color development and wavelength is measured using a spectrophotometer.
Test for terpenoids
To determine the quantitative analysis of terpenoid.0.5g of sample is soaked in 50 ml alcohol for 2hrs.The filtrate extracted with 40ml petroleum ether is heated for 2hrs.Then the filtrate was transferred into a crucible and it was evaporated to dry and weighed.
Synthesis of silver nanoparticle
First an aqueous solution 5Mm of silver nitrate (AgNO3) is prepared using water as solvent and it is taken in a beaker and then 1ml of leaf extract was added to 20ml of 5mM AgNO3solution. After 30 minutes, the color of the solution changes from colorless to dark brown, which indicates the formation of AgNPs. The colloidal solution was taken for further analysis.
Characterization of silver nano particles
UV-visible analysis
The synthesized silver nano particles were carried out with the UV-Visible spectrophotometer from the range of 300-800nm. The band can be obtained in the colloidal silver nano particles is 400-450nm due to the excitation of surface plasma vibration.
FT-IR analysis
FT-IR measurements are used to identify the functional groups present in the plant extract and also used to find out the stability of the silver nano particles. The specific functional groups present in their corresponding frequency were observed.
XRD
This measurement is used to affirm the crystalline nature of silver nanoparticles [11]. From this also measure the purity of the substance. According to (JCPDS, File n04-0783) the swatch shows the face centered cubic structure for silver.
TEM
This analysis is used to measure the dimensions, structure and exterior morphology were identified with the help of this technique. In this technique, image can be formed with the help of interaction of electrons transmitted through the specimen.
In-vitro growth of urinary calculi
Growth of CHPD crystals
About 1M solution of H3PO4 was mixed with Na₂SiO₃ solution of density 1.04g/cm3 at pH 9.4 and it was left aside for 2-3 days so that the pH of the solutions was maintained. After gelatin formation process, the liquid shows above a solid residue of 1M solution of CaCl2 was poured onto the set gel in different glass test tubes, and then it was stopper with airtight stopples. The experiments were maintained at room temperature (37oC).
To examine the hypothetical activity of the extract as inhibitors of CHPD crystal development in gel technology . To find out the efficiency of leaf of Kalanchoepinnataon the growth of CHPD Crystals, various concentrations of synthesized silver nano particles are added. After thirty days the development of crystals are analyzed and calculated.[12-15].
Results and discussion
Quantitative Analysis
This analysis revealed the amount of phytochemical constituents present in the aqueous extract of Kalanchoe pinnata leaves. The various quantities of phytochemical present in the extract were shown in Table 1.
Table 1: Quantitative analysis of Kalanchoe pinnata leaves.
|
S.no |
Phytochemical constituents |
Kalanchoe pinnata(mg/g) |
|
1. |
Alkaloids |
0.007 |
|
2. |
Saponin |
0.006 |
|
3. |
Flavanoid |
0.012 |
|
4. |
Phenol |
0.01 |
|
5. |
Tannin |
0.005 |
|
6. |
Terpenoids |
0.005 |
Federico used HPLC-ESI/MS method to derive the phenolic compounds from the leaves of Kalanchoe pinnata. And then leaves of Kalanchoe pinnata contain high level of flavonoids. Flavonoids used to prevent the oxidative cell damage, have strong anti-cancer activity. It contains high concentration of flavonoids followed by alkaloids, glycosides and steroids have been reported to be present in the aqueous leaf extracts (Fig. 1).
 |
Figure 1: Visual observation of phytochemical constituent present in Kalanchoe pinnata. |
Visual observation
In this experimental method, the addition of 50µl aqueous extract of Kalanchoe pinnata is taken in a glass vial to that 1 ml of 5mM AgNO3 solution is added drop by drop after 2 hours the colour of the solution slightly changes from colorless to brown as shown in Fig. 2. The solution is centrifuged using cooling centrifuge at 15000 rpm then it is stored in the refrigerator for further analysis.
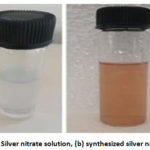 |
Figure 2: (a) Silver nitrate solution, (b) synthesized silver nano particles. |
Characterization techniques
UV-visible spectroscopy
To determine the optical properties of a solution, absorbance spectroscopy is used. The broad absorption peak of synthesized silver nano paricles was observed at 439nm was shown in Fig. 3. The phytochemical constituent present in Kalanchoe pinnata leaves extract was responsible for the reduction of silver nitrate to silver nano particles.
 |
Figure 3: UV-Vis spectrum of synthesized silver nano particles. |
FT-IR analysis
FT-IR measurements are taken to identify the functional group involved in this process. The FT- IR Spectra of synthesized silver nano particles were shown in Fig. 4. The corresponding peaks observed in the synthesized silver Nano particles are shown in the Table 2.
 |
Figure 4: FT-IR spectral data of synthesized AgNPs. |
Table 2: FT-IR spectral data of synthesized silver nano particles
|
Functional group |
Band |
Frequency,cm-1 |
|
Primary amine |
medium band |
3435cm-1 corresponds to N-H stretching vibrations |
|
Isothiocyanate |
strong band |
2075cm-1 corresponds to N=C=S stretching vibrations |
|
Alkene |
medium band |
1636cm-1 corresponds to C=C stretching vibrations |
|
Amine |
medium band |
1108cm-1 corresponds to C-N stretching vibrations |
|
Halo compound |
strong band |
669cm-1 corresponds to C-Br stretching vibrations |
Transmission electron microscope
This study is used to identify dimensions, structure and exterior morphology of the synthesized nano particles. From this analysis, the synthesized AgNPs are well scattered and mostly spherical and some are having the structures of irregular in shape as shown in Fig. 5.The synthesized nano particles are homogeneous and spherical having 200nm and 100nm range.
 |
Figure 5: TEM image of synthesized silver nano particle using Kalanchoe pinnata. |
XRD spectrum of silver nano particles
X-Ray Diffraction analysis used to find out the crystalline character of AgNPs. The analysis and XRD data are given in Table 3.Figure 6 represents XRD analysis of synthesized silver nano particle using Kalanchoe pinnata. The peak corresponds at 38.4024, 44.8685 following diffraction faces are (111), (200) respectively. Unassigned peaks are as present in the graph this may due to extract contains some phytochemicals which may be capping the surface of nano particles.
 |
Figure 6: XRD analysis of synthesized silver nano particle using Kalanchoe pinnata. |
Table 3: XRD analysis of synthesized silver nano particle using Kalanchoe pinnata.
|
Position [°2Th.] |
Heights[cts] |
FWHM degree o2Theta |
d-spacing[Å] |
Rel. Int. [%] |
|
17.1629 |
28.03 |
0.1476 |
5.16660 |
8.20 |
|
27.9614 |
170.73 |
0.2460 |
3.19103 |
49.92 |
|
32.3356 |
341.99 |
0.2460 |
2.76866 |
100.00 |
|
38.4024 |
28.41 |
0.5904 |
2.34408 |
8.31 |
|
44.8685 |
126.28 |
0.1968 |
2.02015 |
36.92 |
|
46.3896 |
143.71 |
0.2460 |
1.95740 |
42.02 |
|
54.9414 |
35.31 |
0.2952 |
1.67125 |
10.33 |
|
57.6203 |
44.36 |
0.1476 |
1.59976 |
12.97 |
|
65.1721 |
176.29 |
0.1476 |
1.43146 |
51.55 |
|
76.8331 |
23.92 |
0.2952 |
1.24070 |
6.99 |
|
78.2896 |
273.67 |
0.1800 |
1.22021 |
80.02 |
|
78.5638 |
126.02 |
0.1200 |
1.21966 |
36.85 |
Effect of Kalanchoe pinnataon CHPD crystals
The analysis ofKalanchoe pinnata extracton nucleation and crystallization of CHPD crystals is determined by finding out the quantity of crystals formed.The generations of Liesegang (5-10 rings) rings which have induce crystals growth (Fig. 7). In this technique,CHPD crystals development was reduced and framework of the crystals converted from hydroxyapatite in brushite crystals because of its inhibitory ability of nano particles at in vitro actions.The formation of the control CHPD and combined with Kalanchoe pinnata CHPD crystals was shown below in figure 8 .The amount of inhibition are shown in the Table 4.
 |
Figure 7: The effect of leaves of Kalanchoe pinnata on Growth of CHPD crystals in the gel method. Click here to View figure |
(a) Pure Control, (b) with distilled water, (c) with 1% aqueous extract of synthesized silver nano particle (d) with 2% aqueous extract of synthesized silver nano particle, (e) with 3% aqueous extract of synthesized silver nano particle, (f) with 4% aqueous extract of synthesized silver nano particle, (g) with5% aqueous extract of synthesized silver nano particle, (e) with 3% aqueous extract of synthesized silver nano particle (f) with 4% aqueous extract of synthesized silver nano particle (g) with 5% aqueous extract of synthesized silver nano particle.
Table 4: Inhibition of crystal growth.
|
Crystals |
Supernatant solution(groups and treatments) |
Weight of crystal |
Percentage inhibition of crystal |
|
CHPD |
I |
132 |
0% |
|
II |
72.6 |
45% |
|
|
III |
51.6 |
60.9% |
|
|
IV |
44.5 |
66.2% |
|
|
V |
34 |
74.2% |
|
|
VI |
26 |
80.3% |
|
|
VII |
20 |
84.8% |
 |
Figure 8: Measurement of harvested CHPD crystals obtained from the leaves of Kalanchoe pinnatain the gel method. Click here to View figure |
Characterization of CHPD crystals
The FTIR spectra of CHPD crystals obtained in the presence and absence of the methanol extract of sample. The absorptions at 3016 cm-1 are due to intermolecular and weakly H bonded OH because of water of crystallization. The weak absorption at 2029 cm-1 is due to HPO42-. The H-O-H bending gives rise to absorption at 1673 cm-1. The absorption at 1410 cm-1are due to P=O associated stretching vibrations. Whereas, the absorption at 1114 cm-1 is due to P=O stretching vibrations. The P-O-P asymmetric stretching vibrations give rise to absorption at 988, 874 cm-1. The absorption at 615 cm-1 is due to (H-O-) P=O.The absorptions at 3012 cm-1 are due to intermolecular and weakly H bonded OH because of water of crystallization. The week absorption at 2023 cm-1 is due to HPO42-. The H-O-H bending gives rise to absorption at 1677 cm-1. The absorption at 1407 cm-1 is due to P=O associated stretching vibrations. Whereas, the absorption at 1117 cm-1 is due to P=O stretching vibrations. The P-O-P asymmetric stretching vibrations give rise to absorption at 874 cm-1. The absorption at 788 cm-1 is due to (H-O-)P=O. However, the strong absorption peak at 578 cm-1are again due to acid phosphate. The absorption at 3013 cm-1 is due to OH ions. The absorption at 2026 cm-1 is due to PO4 stretching vibrations. Whereas, the absorption at 989, 875 and 784 cm-1 are due to P-O-P asymmetric stretching vibrations. The absorption at 615,570 cm-1are again obtained due to acid phosphate. The absorption at 3012 cm-1 is due to OH ions. The absorption at 2023 cm-1 is due to PO4 stretching vibrations. Whereas, the absorption at 989, 873 and 769 cm-1 are due to P-O-P asymmetric stretching vibrations. The absorption at 603,551cm-1are again obtained due to acid phosphate.
 |
Figure 9: The FTIR spectra of CHPD in the gel method. |
(a) without any additive (b) with the distilled water (c) with the 1% of Aqueous extract of synthesized silver nanoparticle (d) with the 2% of Aqueous extract of synthesized silver nanoparticle (e) with the 3% of Aqueous extract of synthesized silver nanoparticle (f) with the 4% of Aqueous extract of synthesized silver nanoparticle (g) with the 5% of Aqueous extract of synthesized silver nanoparticle
The absorption at 3008 cm-1 is due to OH ions. The absorption at 2033 cm-1 is due to PO4 stretching vibrations. Whereas, the absorption at 990, 773 cm-1 are due to P-O-P asymmetric stretching vibrations. The absorption at 608,549cm-1are again obtained due to acid phosphate. The absorption at 3008 cm-1 is due to OH ions. The absorption at 2023 cm-1 is due to PO4 stretching vibrations. Whereas, the absorption at 989, 875 and 789 cm-1 are due to P-O-P asymmetric stretching vibrations. The absorption at 611,568cm-1are again obtained due to acid phosphate. The absorption at 3008 cm-1 is due to OH ions. The absorption at 2026 cm-1 is due to PO4 stretching vibrations. Whereas, the absorption at 875 and 784 cm-1 are obtained due to P-O-P asymmetric stretching vibrations. The absorption at 615 and 571 cm-1 are again due to acid phosphate.
Table 5: The FTIR spectral analysis of CHPD in the gel technique.
|
Frequencies |
Band |
|
3016 cm-1 |
intermolecular H bonded OH |
|
2029 cm-1 |
the peak is due to HPO42 |
|
1673 cm-1 |
H-O-H bending |
|
1410 cm-1 |
P=O combined with stretching vibrations |
|
1114 cm-1 |
P=O stretching vibrations |
|
988, 874 cm-1 |
P-O-P asymmetric stretching vibrations |
|
615 cm-1 |
owing to (H-O-) P=O |
|
3012 cm-1 |
intermolecular and weakly H bonded OH |
|
1677 cm-1 |
H-O-H bending |
|
2023 cm-1 |
week absorption of HPO42- |
|
1407 cm-1 |
P=O associated stretching vibrations |
|
1117 cm-1 |
P=O stretching vibrations. |
|
874 cm-1 |
P-O-P asymmetric stretching vibrations |
|
788 cm-1 |
due to (H-O-)P=O |
|
578 cm-1 |
strong absorption peak at acid phosphate |
|
3013 cm-1 |
absorption of OH ions |
|
2026 cm-1 |
PO4 stretching vibrations |
|
989, 875 and 784 cm-1 |
P-O-P asymmetric stretching vibrations |
|
615,570 cm-1 |
acid phosphate |
|
2023 cm-1 |
owing to PO4 stretching vibrations |
|
989, 873 and 769 cm-1 |
P-O-P asymmetric stretching vibrations |
|
603,551cm-1 |
Owing to acid phosphate. |
Conclusion
By using the green method, synthesis of therapeutically used nano particles should be produced which is more effective and manufactured at larger scale. There may be a lot of upgrade treatments are available to treat the kidney stone. It is one among the study to medicaments the kidney stone by using naturally available plants with the help of nano particles synthesis and it is proved by carrying out certain studies are discuss above. This study concluded that the synthesis of silver nano particles using plant extract is energy efficient and bio-hazardous chemical synthesis. Our present study is to contribute for green chemistry particularly and also the green synthesis metal of nano particles and analyze it’s therapeutic applications.
References
- Phanjom, P.; Ahmed, G. Nanosci. Nanotechnol.2015,5(1), 14–21.https://doi.org/10.5923/j.nn.20150501.03
- Dixon, R.A.; Xie, D.-Y.; Sharma, S.B. NewPhytol.2005, 165,928.https://doi.org/10.1111/j.1469-8137.2004.01217.x
CrossRef - Verkoelen, C. F.J. Am. Soc. Nephrol.2006, 17(6), 1673–1687. https://doi.org /10.1681/ASN.2006010088
CrossRef - Seema,V. P.Int.J.Phytopharm.2012, 2(1).https://www.researchgate. net/deref/http%3A%2F%2Fdx
- Benn,T. M.; Westerhoff, P.Environ.Sci. Technol.2008,42, 4133–4139. https://doi.org/10.1021/es7032718
CrossRef - Kumar, S.B.N.; Kumar, K.G.; Srinivasa, V.; Bilal, S. Int. J. Univ. Pharm. Life Sci.2012,2(2), 269280. https://doi.org/10.1155/2018/3068365
CrossRef - Orisakeye, O. T.; Oladoye, S. O.; Peters, O. A. GSC Biol. Pharm. Sci.2015. https://doi.org/10.30574/gscbps.2019.9.2.0184
CrossRef - Vinod, V.T.P.; Saravanan, P.; Sreedhar, B.; Devi, D.K.; Sashidhar, R.B. Colloids Surf. Biointerfaces. 2011, 83(2). https://doi.org/10.1515/eces-2016-0038
CrossRef - Crozier, A.; Jaganath, I.B.; Clifford, M.N. Nat. Prod. Rep.2009, 26, 1001–1043.https://doi.org/10.1039/b802662a
CrossRef - Rajasekharreddy, P.; Rani, P.U.; Sreedhar, B. J. Nanopart. Res.2010, 12(5),1711–1721.https://doi.org/10.1155/2013/278925
CrossRef - Mahamadi, C.; Wunganayi, T. Med. Chem. 2018. https://doi.org/10. 1080/23312009.2018.1538547
CrossRef - Huang, Y.; Chen, S.; Bing, X.; Gao, C.;Wang, T.; Yuan, R.Technol. Sci.2011, 24,291–297.https://doi.org/10.1002/pts.938
CrossRef - Parez, A. C.; Correa,M. F.; Borges, S. R.Arch.Vet.Sci.1999,4(1), 111–112.https://dx.doi.org/10.5380/avs.v4i1.3792
CrossRef - Agarwal, H.; Venkatkumar, S.;Rajeshkumar,S.J.Microbiol. Biotechnol.Food Sci.2018, 7(4),371–376.https://doi.org /10.15414 /jmbfs.2018.7.4.371-376
CrossRef - Sohgaura,A. K.; Bigoniya, P.; Shrivastava, B. J. Pharm. Bioallied Sci.2018,10,83–89.https://doi.org/10.4103/JPBS.JPBS_18_18
CrossRef

This work is licensed under a Creative Commons Attribution 4.0 International License.
About The Author
![]()
A New Edition of Web of Science
Journal Impact Factor
2022: 0.5
Five Year: 0.8
Journal is Indexed in

Cabells Whitelist
![]()


