pH Dependence of Size Control in Gold Nanoparticles Synthesized at Room Temperature
Shohifah Annur1,2 , Sri Juari Santosa2 and Nurul Hidayat Aprilita2
1Department of Chemical Engineering, Faculty of Engineering, Universitas Serang Raya, Jl. Raya Serang-Cilegon Km. 5, Taman Drangong, Serang 42116, Indonesia.
2Department of Chemistry, Faculty of Mathematics and Natural Sciences, Universitas Gadjah Mada, Sekip Utara, PO BOX BLS 21 Yogyakarta 55281, Indonesia.
Corresponding Author E-mail: annur@mail.ugm.ac.id
DOI : http://dx.doi.org/10.13005/ojc/340510
Article Received on : 01-08-2018
Article Accepted on : 30-08-2018
Article Published : 13 Oct 2018
We have developed the spherical gold nanoparticles (AuNPs) with different size at room temperature using L-ascorbic acid as a reducing agent. Controlling pH of L-ascorbic acid from 2.0 to 10.0 caused the decreasing of AuNPs size when measured using particle size analyzer. The alkaline condition leads to increase the reactivity of L-ascorbic acid even at room temperature. The homogeneous AuNPs were achieved even the synthesis was conducted at different pH of L-ascorbic acid (pH 2.0 to 12.0). The investigation using Transmission Electron Microscopy (TEM) confirmed that AuNPs performed a spherical shape. SEM-EDX measurement performed a strong characteristic peak of Au appeared at 2.0 keV. This research could be used to control of AuNPs size when synthesized at room temperature. The AuNPs obtained at optimum condition was stable up to 3 months.
KEYWORDS:Gold Nanoparticles; Particle Size; Reactivity; Reducing Agent; Synthesis
Download this article as:| Copy the following to cite this article: Annur S, Santosa S.J, Aprilita N.H. pH Dependence of Size Control in Gold Nanoparticles Synthesized at Room Temperature. Orient J Chem 2018;34(5). |
| Copy the following to cite this URL: Annur S, Santosa S.J, Aprilita N.H. pH Dependence of Size Control in Gold Nanoparticles Synthesized at Room Temperature. Orient J Chem 2018;34(5). Available from: http://www.orientjchem.org/?p=50749 |
Introduction
Research on nanoparticles has been significantly increased during the past decade because their unique physical and chemical properties. Metal nanoparticles have a wide range of application, such as biotechnology, microelectronics, catalysis, and also it could be applied as a chemical and biological sensor.1,2 Among metal nanoparticles, gold nanoparticles (AuNPs) are the most frequently studied one due to its easy to synthesize and have a wide range of applications.3 It is known that AuNPs have different properties than their bulk metal. Colloidal AuNPs have a color range from red-pink to purple based on the increasing size from 1.0 to 100 nm. AuNPs perform surface plasmon resonance (SPR) peak at 500-550 nm when measured using UV visible spectrophotometer. The SPR caused by electrons oscillation in the conduction band when interacting with light. It will not appear in their bulk metal.4
Synthesis of AuNPs commonly involves chemical reduction of gold salt as a precursor using a certain reducing agent and stabilization of the formed AuNPs using a capping agent.3 Some researchers applied reducing agent and capping agent directly at the same time. A various reducing agent was performed to synthesize AuNPs such as trisodium citrate5 which was known as Turkevich method, NaBH4,6 glutamic acid,7 and other amino acids.8
Size-controlled in the synthesis of AuNPs has been developed by several researchers. Qin et al.9 reported that the nucleation and growth stages of AuNPs with different size can be achieved by changing the molar ratio or pH of reaction. Jang et al.10 designing AuNPs which were covered by a mixed monolayer of hydrophobic and hydrophilic ligands to control the size of AuNPs formed. Their research applied 1-octadecanethiol and 1-tetradecanethiol as hydrophobic ligands and 11-mercaptoundecanoic acid as a hydrophilic ligand. They reported that the aggregation size of AuNPs can be monitored by varying the molar ratio between the hydrophobic and hydrophilic ligands.
Qiu et al.11 applied C6-carboxylated curdlan, one of a high molecular weight polymer of glucose, as reducing and capping agent to synthesize AuNPs under high temperature. They found different particle size of AuNPs when applying different pH of reducing agent.
Ascorbic acid as a reducing agent was chosen in this experiment since this compound is biodegradable, environment friendly and highly soluble in water.3 Hurtado and his co-worker[12] developed AuNPs synthesized at room temperature by applying ascorbic acid and sucrose as a reducing agent. Annur et al.13 performed AuNPs obtained without heating process using one reducing agent, L-ascorbic acid, but the correlation between the synthesis parameters and the size of AuNPs have not determined. In this research, we successfully in synthesis AuNPs at room temperature and determining the correlation between pH of reducing agent and the size of the formed AuNPs. We proved that the pH of L-ascorbic acid influenced their activity which gave an effect to the size of AuNPs achieved.
Materials and Methods
Materials
HAuCl4 solution was made from 1.0 g certified gold metals 99.99% (PT. Aneka Tambang, Indonesia), dissolved in 40 mL aqua regia and followed by dilution to 100 mL by using distilled water. L-ascorbic acid (Merck, Germany) was used as a reducing agent. HCl and NaOH (Merck, Germany) solution were prepared to adjust the pH of reducing agent respectively.
Synthesis of AuNPs
Synthesis of AuNPs was conducted by adding 2.5 mL of L-ascorbic acid 0.01 M to the 5.0 mL HAuCl4 0.20 x10⁻³ M at room temperature without using stirrer, microwave or ultrasonic bath. The colour change from yellow to pink indicated the formation of AuNPs.
The Effect pH of L-ascorbic Acid to the AuNPs
The influence pH of reducing agent was observed by varied pH of L-ascorbic acid from pH 2.0 to 12.0 using HCl and NaOH solution. The HAuCl4 solution was reduced by L-ascorbic acid after adjust its pH. The AuNPs obtained was observed with UV Vis spectrophotometer and the size of this AuNPs was monitored using particle size analyzer.
UV Vis Spectroscopy Measurement
The SPR band of AuNPs was directly measured using UV-Visible Spectrophotometer (Shimadzu UV-1700 PharmaSpec) after synthesis by scanning in the wavelength range 200-800 nm.
Particle Size Analyzer
The effect of reducing agent pH to the size of AuNPs was monitored using particle size analyzer (Horiba SZ-100). The colloidal AuNPs was placed on the cuvette then the particle size distribution was investigated to the further evaluation.
TEM Study
To study the morphology of AuNPs obtained, the colloidal AuNPs were observed under transmission electron microscope/TEM (JEOL JEM-1400). Preparation of sample for TEM analysis was conducted by immersing the copper grid in to colloidal AuNPs, the drying at room temperature. The accelerating voltage of 120 kV was applied in capturing image.14
FTIR Measurement
The interaction between the AuNPs surface and the reducing agent was analyzed by Fourier Transform Infrared (FTIR), Shimadzu FTIR Prestige-21. The FTIR measurement was performed by scanning the KBr plate of AuNPs in the range 4000-400 cm-1.
Zeta Potential Analysis
The zeta potential of the synthesized AuNPs was determined by zeta potential analyzer (Horiba SZ-100). Colloidal AuNPs was diluted with double distilled water then 1 ml of the solution was taken to the zeta potential vessel to be analyzed.
SEM-EDX Measurement
The presence of elemental gold of AuNPs was performed by scanning electron microscopy-energy dispersive x-ray analysis (SEM-EDX). Dry powder of AuNPs sample after centrifuge was placed on a sample holder and coated with conducting carbon layer for analysis.
Results and Discussion
Synthesis of AuNPs
The formation of AuNPs in this research was performed by mixing of HAuCl4 with L-ascorbic acid at room temperature. The appearance of pink color in the solution showed the formation of AuNPs. This changed color from yellow to pink (Fig.1) was due to the SPR which measured by UV-Visible spectrophotometer.15
Ascorbic acid, the major component of vitamin C could reduce various metal ions.16. As a reducing agent, L-ascorbic acid could donate the electron to reduce Au3+ to Au0 with the following equation.17
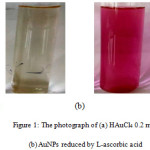 |
Figure 1: The photograph of (a) HAuCl4 0.2 mM (b) AuNPs reduced by L-ascorbic acid. |
2HAuCl4 + 3C6H8O6 → 2Au0 + 3C6H6O6 + 8HCl
This reaction occurred in the first minute after L-ascorbic acid added to HAuCl4 at room temperature. Ascorbic acid has two electrons reducing properties. It could interact directly by changing one of Cl– ions in HAuCl4 by OH functional groups. Afterwards, the other hydroxyl groups was deprotonated and formed an intermediate complex. AuNPs was reduced in the two step, Au(III) was reduced to Au(I) then reduced to Au(0). The last step of reaction produced Au(0), dehydroxyascorbic acid (DHA) and HCl.15,16 Regarding to the previous report, the author summarized the reaction mechanism of the AuNPs synthesis using L-ascorbic acid as a reducing agent which is shown at Fig. 2.
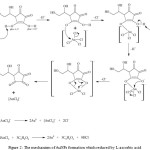 |
Figure 2: The mechanism of AuNPs formation which reduced by L-ascorbic acid |
The SPR band at 500-550 nm which is the characteristic wavelength for AuNPs formation was observed in the first minute after reaction as shown in Fig.3. This absorption band is different when a gold atom in the HAuCl4 solution and after AuNPs arrangement.
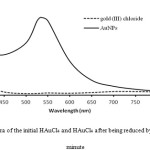 |
Figure 3: The UV-Vis spectra of the initial HAuCl4 and HAuCl4 after being reduced by L-ascorbic acid in the first minute |
pH Dependence on Control Size of AuNPs
The effect of reducing agent pH to the size of AuNPs was investigated by varying of the pH of L-ascorbic acid from pH 1.0 to 12.0. The increasing pH from 2.0 to 12.0 caused the blue shift (Fig.4). In the very acidic condition (pH 2.0), the λmax is 533 nm. Expanding the pH of L-ascorbic to 4.0 caused the λmax shifted from 533 nm to 530 nm. AuNPs reduced by L-ascorbic acid at pH 6.0 and 8.0 were red shift to 525 and 524 nm. Converting the pH of reducing agent to alkaline condition (pH 10.0) resulting in the sharper and lower wavelength which achieved in 524 nm. The shifting of λmax in the SPR peak relate to the size of AuNPs formed.19
The correlation between the SPR peak (λmax) and the size of AuNPs, was carried out using particle size analyzer. The results in Fig.4 showed the relationship between the λmax of AuNPs and their size. Expanding pH to alkaline induced the size of AuNPs to become smaller than in acidic condition. In a very acidic solution (pH 2.0), the size distribution of AuNPs was dominated by AuNPs with the size range from 200-300 nm (26.4%). It is because in an acidic condition, the hydroxyl groups in the reducing agent were protonated through the addition of H+ caused the decrease of L-ascorbic acid reactivity.11
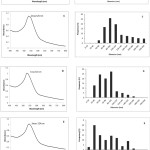 |
Figure 4: UV Vis spectrophotometry and size distribution of AuNPs synthesized with different pH of L-ascorbic acid (A) pH 2, (B) pH 4, (C) pH 6, (D) pH 8, (E) pH 10, (F) pH 12 |
The size of AuNPs was smaller with increasing the pH. At the pH 10.0, the size of AuNPs was the smallest, dominated with the size 20-40 nm (24.9%). We could say that at this condition, the optimum pH of L-ascorbic acid was achieved. A similar phenomenon was also observed in the previous report.11 AuNPs synthesized using C6-carboxylated curdlan obtained a more well-dispersed spherical morphology with smaller particle sizes under alkaline conditions.
Setting pH of L-ascorbic acid at 12.0 caused the aggregation of AuNPs. Hence, the size of AuNPs was getting bigger (the dominant size 40-60 nm). The color of AuNPs formed at this condition changed from pink to blue. The measurement using UV-Vis spectrophotometry showed the λmax shifted to longer wavelength (535 nm).
Qin et al.9reported that the difference in the rate of the reactions conducted at different pH might be attributed to the different reactivity of ascorbic acid at different pH. In the alkaline pH, –OH functional groups in the L-ascorbic acid is more easily to deprotonate to reduce Au3+ become Au0, cause the increasing reactivity of L-ascorbic acid.
Characterization of AuNPs
TEM Analysis
The particle size of AuNPs was measured by particle size analyzer as explained before. Particle size analyzer results confirmed that all of AuNPs formed with different pH of L-ascorbic acid were monodisperse. It means that AuNPs in this experiment are homogenous. TEM analysis was performed to confirm the result of particle size analyzer and investigate the morphology of colloidal AuNPs. TEM image (Fig. 5) showed that AuNPs formed have certain shapes, it was spherical, well separated, no aggregated mass each other, and clearly indicates the stabilization likes the previous research20
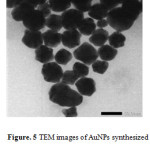 |
Figure 5: TEM images of AuNPs synthesized using L-ascorbic acid as reducing agent. |
FTIR Study
FTIR spectroscopy was conducted to observe the surface modification of AuNPs. The solid of AuNPs sample for FTIR measurement was prepared by centrifugation of colloidal AuNPs at 12000 rpm at room temperature. The extract was also dried at the room temperature to apply in the further analysis. The result given in Fig. 6 showed the presence of O-H stretching characteristic band at 3448 cm-1 and O-H bending at 1635 cm-1. C-O vibration band was observed at 1381 cm-1 and C=O band was found at 1118 cm-1. These characteristic bands correspond to the functional groups at dehydroxyascorbic acid around Au0 after reaction occurred.
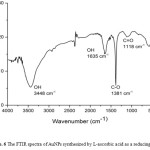 |
Figure 6: The FTIR spectra of AuNPs synthesized by L-ascorbic acid as a reducing agent |
Zeta Potential Analysis
The analysis of zeta potential is based on the direction and velocity of particles under the effect of known electric field. Zeta potential was performed to predict the nature of the electrostatic potential near the surface of the particles.21 Smaller sized nanoparticles possibly had higher surface charge density compare to larger nanoparticles.22 The zeta potential for AuNPs reduced by L-ascorbic acid at pH 10.0 was -4 mV (Fig. 7). It means that the surface charge of AuNPs is negative, hence this AuNPs are very potential as a chemical sensor, like a sensor for heavy metals in environment.
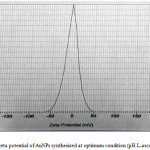 |
Figure 7: The zeta potential of AuNPs synthesized at optimum condition (pH L-ascorbic acid is 10.0). |
SEM-EDX Measurement
In the scanning electron microscopy (SEM), the electron interact with the atoms contain in the sample, producing signals that provide the information about surface topography and composition of the sample [20]. Energy Dispersive Xray (EDX) based on the element which has characteristic atomic structure produce the specific X-ray emission spectrum. Fig. 8 showed the topography and EDX spectrum of the AuNPs. It could be clearly seen that a strong characteristic peak appeared at 2.0 keV in the EDX spectrum was the characteristic signal of gold corresponding to the SPR of AuNPs as reported in the research before.11 The EDX spectrum performed the elemental gold peak (87.24%), oxygen peak (3.51%), and carbon peak (9.25%) confirming the use of L-ascorbic acid as a reducing agent in the AuNPs synthesis.
The optimum AuNPs synthesized using L-ascorbic acid at room temperature in this research was stable for three months. The pink color still appeared for three months. After three months, AuNPs tend to aggregate and the color change from pink to purple. Fig. 9 performed the SPR peak of AuNPs after aging for three months.
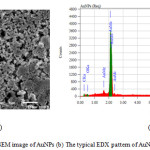 |
Figure 8: (a) The SEM image of AuNPs (b) The typical EDX pattern of AuNPs reduced by L-ascorbic acid. |
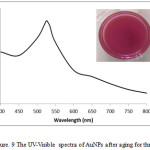 |
Figure 9: The UV-Visible spectra of AuNPs after aging for three months. |
Conclusions
Controlling of AuNPs size is very important in the research due to the stability of AuNPs. Setting the pH of L-ascorbic acid, as a reducing agent from acid to alkaline condition increased the reactivity of L-ascorbic acid because the hydroxyl groups are easily to deprotonated at alkaline condition. The optimum pH of reducing agent was achieved at pH 10.0. The size distribution of AuNPs at optimum pH were dominated by AuNPs which has size range 20-40 nm (24.9%). AuNPs formed were monodisperse and have a spherical shape. The surface charge of these AuNPs were negative (-4.0mV), the future experiment should be conducted to investigate the response of these AuNPs with the other metals ions or molecules to develop it as a biological or chemical sensor.
Acknowledgements
This research was supported by BPPDN Scholarship and Doctoral Dissertation Grant 2017 by Directorate General of Higher Education, Ministry of Research, Technology, and Higher Education, The Republic of Indonesia.
References
- Paul, B.; Bhuyan, B.; Purkayastha, D.D.; Vadivel, S.; Dhar, S.S. Mater. Lett. 2016, 185, 143–147.
CrossRef - Jongjinakool, S.; Palasak, K; Bousod, N.; Teepoo, S. Energy Procedia. 2014, 56, 10–18.
CrossRef - Tyagi, H.; Kushwaha, A.; Kumar, A. Int. J. Nanosci. 2011, 10, 857-860.
CrossRef - Shrivas, K.; Shankar, R.; Dewangan, K. Sensors Actuators B. Chem. 2015, 220, 1376–1383.
CrossRef - Giannoulis, K. M.; Giokas, D. L.; Tsogas, G. Z.; Vlessidis, A. G. Talanta. 2014, 119, 276–283.
CrossRef - Sun, Z.; Cui, Z.; Li, H. Sensors Actuators B. Chem. 2013, 183, 297–302.
CrossRef - Wangoo, N.; Bhasin, K. K.; Mehta, S. K.; Suri, C. R. J. Colloid Interface Sci. 2008, 323 (2), 247–254.
CrossRef - Maruyama, T.; Fujimoto, Y.; Maekawa, T. J. Colloid Interface Sci. 2015, 447, 254–257.
CrossRef - Qin, Y.; Ji, X.; Jing, J.; Liu, H.; Wu, H.; Yang, W. Colloids Surfaces A Physicochem. Eng. Asp. 2010, 372 (1-3), 172–176.
CrossRef - Jang, H. J.; Lee, H. Y. Colloids Surfaces A Physicochem. Eng. Asp. 2018, 538, 574–582.
CrossRef - Qiu, W. Y.; Wang, K.; Wang, Y.Y.; Ding, Z.C.; Wu, L.X.; Cai, W.D.; Yan, J.K. Int. J. Biol. Macromol. 2018, 106, 498–506.
CrossRef - Hurtado, B.R.; Cortez-Valadez, M.; Ramírez-Rodríguez, L. P.; Larios-Rodriguez, E.; Alvarez, R. A. B.; Rocha-Rocha, O.; Flores-Acosta, M.. Phys.Lett. A. 2016, 380(34), 2658–2663.
CrossRef - Annur, S.; Santosa, S.J.; Aprilita, N. H. ; Phuong, N.T.; Phuoc, N.V. Asian J.Chem. 2018, 30 (11).
CrossRef - Gusrizal, G.; Santosa, S.J.; Kunarti, E.S. Asian J. Chem. 2017, 29 (7), 1417–1422.
CrossRef - Golshaei, R.; Guler, Z.; Unsal, C.; Sarac, A. S. Eur. Polym. J. 2015, 66, 502–512.
CrossRef - Lin, C.; Tao, K.; Hua, D.; Ma, Z.; Zhou, S. Molecules. 2013, 18, 12609–12620.
CrossRef - Sun, K.; Qiu, J.; Liu, J.; Miao, Y. J. Mater. Sci. 2009, 44 (3), 754–758.
CrossRef - Karan, B.Z. J. Nanoparticle Res.2009, 11, 1099–1105.
CrossRef - Lee, C.; Kim. S.; Yoon, C.; Gong, M.; Choi, B. K.; Kim, K. ; Joo, S.W. J. Colloid Interface Sci. 2004, 271, 41–46.
CrossRef - Vidhya, S.; Rose. A.L. Asian J. Chem. 2017, 29 (8), 1757–1760.
CrossRef - Ravindran, A.; Elavarasi, M.; Prathna, T. C.; Raichur, A. M.; Chandrasekaran ,N.; Mukherjee, A. Sensors Actuators, B Chem. 2012, 166–167, 365–371.
CrossRef - Esfahani, M. R.; Pallem, V. L.; Stretz, H. A.; Wells, M. J. M. Environ. Nanotechnology, Monit. Manag. 2016, 6, 54–63.

This work is licensed under a Creative Commons Attribution 4.0 International License.
![]()
A New Edition of Web of Science
Journal Impact Factor
2022: 0.5
Five Year: 0.8
Journal is Indexed in

Cabells Whitelist
![]()


