Anticancer Activity of Cu(II), Pd(II) and Zn(II) Complexes of Phosphonate with Glutamine Amino Acid
Ahmed Imam Hanafy1,2 , Zeinhom Mohamad El-Bahy1,2, Marwa Sayed El-Gendy3,4 and Omar Makram Ali3,5
1Chemistry Department, Faculty of Science, Taif University, Taif, Saudi Arabia.
2Chemistry Department Faculty of Science Al-Azhar University, Cairo Egypt.
3Medical Laboratory Department, Faculty of Applied Medical Sciences, Turabah, Taif University, Saudi Arabia.
4Chemistry Department Faculty of Science "Girls" Al-Azhar University, Cairo Egypt.
5Chemistry Department , Faculty of Science, Menoufia University, Shebin El-Koam, Egypt.
Corresponding Author E-mail: ahmedih@yahoo.com
DOI : http://dx.doi.org/10.13005/ojc/340231
Article Received on : December 18, 2017
Article Accepted on : March 25, 2018
Copper (II), palladium(II) and zinc(II) complexes of phosphonate derivative (S)-2-((phenoxyphosphono)(2-hydroxyphenyl) methyl-amino)-4-carbamoylbutanoic acid (PHCB) have been prepared and fully characterized by IR, elemental analysis, Uv/vis, 1H-NMR, thermal analysis and Transmission Electron Microscope (TEM). The IR spectral data showed that the metal is coordinated to PHCB through carboxylic and NH groups. Carboxylic group behaves as a bidentate ligand with displacement of the proton, at the same time the metal coordinate with nitrogen atom of NH with the proton displacement. The complexes structure was supported by 1H-NMR which shows the disappearance of both carboxylic and NH protons. The metal complexes stability was studied by thermal analysis. The activity of the organic ligands and their metal complexes as anticancer agents towards Hepatocellular carcinoma have been investigated. Zinc complex Zn(II)PHCB showed the highest activity with IC50 = 9.58 µg/ml suggesting a promising anticancer drug in the future.
KEYWORDS:Phosphonate; Glutamine, Anticancer; Hepatocellular Carcinoma; Viability
Download this article as:| Copy the following to cite this article: Hanafy A. I, El-Bahy Z. M, El-Gendy M. S, Ali O. M. Anticancer Activity of Cu(II), Pd(II) and Zn(II) Complexes of Phosphonate with Glutamine Amino Acid. Orient J Chem 2018;34(2). |
| Copy the following to cite this URL: Hanafy A. I, El-Bahy Z. M, El-Gendy M. S, Ali O. M. Anticancer Activity of Cu(II), Pd(II) and Zn(II) Complexes of Phosphonate with Glutamine Amino Acid. Orient J Chem 2018;34(2). Available from: http://www.orientjchem.org/?p=44564 |
Introduction
Hepatocellular carcinoma (HCC), a primary liver cancer, is considered as the fifth most frequent type of cancer and the third the most causes of death among the cancer types [1,2]. Liver transplant, surgical resection, arterial embolization and percutaneous intervention are considered as the main approaches to HCC curing [3-5]. It is noteworthy to find out other effective synthetic drugs for that type of cancer such as a platform for drug delivery to enhance the number of survived patients especially with advanced, inoperable or post-operative persistent HCC [6-9]. Platinum containing compounds were used widely as chemotherapeutic drugs for HCC treatment over long time before [10].
The phosphonate compounds were incorporated into a range of clinically useful drugs for many diseases. Acyclic nucleoside phosphonates showed great importance as therapeutics for pathogenic species [11]. At the same time, phosphonate moieties are found in HIV protease inhibitors and they show a great resistance profile more than that in the case of phosphate-free parent [12]. Additionally, phosphonate containing protease inhibitors showed significant effect for the treatment of Hepatitis C virus [13]. In addition to the antibiotic and antiviral therapies made possible by phosphonates, some have shown potential as cancer therapies [14] and anti-parasitic agents [15,16]. Phosphonates are used as chelating agents in many industrial applications such as medicine, where phosphonates are used to chelate radionuclides for bone cancer treatments [17].
Platinum (II) complexes derived from phosphonate compounds mono and diethyl 2-quinolylmethylphosphonates were prepared and studied [18]. The activity of the prepared compounds as effective drugs for cancer cells was evaluated in-vitro on epidermoid KB of human and the cell lines of leukemia L1210. Ruthenium and platinum ions are the most widely investigated metal ions (containing coordination centers) as anticancer agents [19,20]. Synthesis of low priced transition metal complexes gained an interest as effective DNA binders [21-26]. Because of high anti-pro-liferative activity of transition metal ions such as Ni2+, Cu2+ and Zn2+ complexes towards the lines of cancer cell [27–31], it is logical to assume that the complexes may interact covalently with the DNA through N and/or O atoms in such cases.
In the present study, complexes of phosphonate derivative containing Cu2+, Pd2+ and Zn2+ were prepared and fully characterized by different tools. The phosphonate ligand and its complexes were investigated as anticancer agents towards hepatocellualr carcinoma.
Experimental
Synthesis of (S)-2-((phenoxyphosphono)(2-hydroxyphenyl) methyl-amino)-4-carbamoylbutanoic acid (PHCB).
The organic ligand PHCB has been synthesized using the Birumoleksyszyn reaction. Briefly, 2×10⁻⁵ mol of perchloric acid was added to a solution of (2×10⁻³ mol) salicyaldehyde and 2.2×10⁻³ mol of glutamine amino acids in dry acetonitrile. The mixture was kept over magnetic stirrer heated under reflux for two hours and finally 2.2×10⁻³ mol of triphenylphosphite was then added. At the end of reaction, the mixture was quenched with aqueous saturated solution of sodium bicarbonate followed by brine solution. The complex was then extracted with desired solution before being purified to obtain pure product.
Synthesis of metal complexes
0.01 mole of CuCl2, ZnSO4 and Pd(NO3)2.2H2O were dissolved in about 50 ml ethyl alcohol. Also, 0.01 mole of the organic ligand (S)-2-((phenoxyphosphono)(2-hydroxyphenyl)methylamino)-4-carbamoyl-butanoic acid (PHCB) was dissolved in 50 ml ethanol with few drops of diethyl ammine. The metal ion solution was added to the ligand solution while continuous stirring and gradual addition of one gram of solid sodium acetate before heating the solution under reflux for 2 h. After formation of the precipitate, the solution was filtered, washed many times with hot ethanol and finally it was dried in an open air.
Physical Methods
The elemental analysis CHN contents were estimated at the microanalytical unit. Metal concentrations (expressed in wt.%) were estimated by complexometry with EDTA and xylenol orange as indicator. The FTIR spectra of the prepared complex and the parent ligand were measured by (Mattson 5000 FTIR spectrometer). The UV absorption spectra were recorded with (Varian Cary 4 Bio UV/VIS spectrophotometer). 1H-NMR of the organic ligand was measured on Joel-90Q Fourier Transform (200 MHz) spectrometers in CDCl3. Thermal properties were studied by Shimadzu thermo-gravimetric analyzer model TGA-50 H using N2 gas flow rate of 20 ml/min, 0.02 g sample and 10°C/min as heating rate. Magnetic susceptibility of copper (II) complexes were determined at room temperature by the Gouy balance using Hg[Co(NCS)4] as a calibrating agent. TEM images were recorded using JEOL JEM–1010 Transmission Electron Microscope with 60 kV as an accelerating voltage.
Antitumor Activity Evaluation Using Viability Assay
Lines of tumor cells were seeded in 96-well plate and 100µL growth medium using 1×10⁴ cells/well as cell concentration. The monolayers were washed with 0.01 M of sterile phosphate buffered saline at pH 7.2 after 24 h of seeding. Moreover, the cells were then treated with various diluted solutions of the test sample with a volume 100 µL after incubation at 37ºC and in its fresh maintenance medium. Two-fold solution series of the prepared tested complex with concentrations of 50, 25, 12.5, 6.25, 3.125 and 1.56 µg/ml were added to the gathered cell monolayers dispensed into 96-well, flat-bottomed shaped microtiter plates (Falcon, NJ, USA). These plates were kept in 5%CO2-humidified incubator at 37ºC for twenty-four hours using the untreated cells as controls. Three experiments were carried out independently, each one contains 6 replicates for each tested concentration of the employed solutions.
The toxic influence of the complex compounds under study were determined using staining capability assay with crystal violet. Shortly, after being treated for twenty-four hours, the tested medium was removed and 100 μL of 0.5 % of crystal violet in 50% methyl alcohol was added separately to every well after which it was kept in incubator for 20 min. at room temperature. The extra dye was removed by washing with double distilled water. The flat-bottomed plates were dried, and the feasible stained cells with crystal violet were lysed using glacial acetic acid (33%). The samples were subjected to spectrophotometric measurements at 570 nm using SunRise,TECAN, Inc, USA, microplate reader.
The positive control which was used in this study is vinblastine sulfate. The peak intensity is directly proportional to the intensity or the number of surviving cells under study in each plate. The compounds under study in the medium cell lysis and the cytotoxic effect of vinblastine were estimated and compared to the viability of the cells without treatment. DMSO was used as a control in parallel for each concentration.
The cell viability percentage was estimated by [Cell viability = [1- (ODt/ODc)]×100%; where ODt is the mean optical density of the tested compounds-treated wells and ODc is the mean optical density of the untreated cells. The cell concentration of an individual compound values (IC50), which leads to the death of 50% of the tested cells, were calculated from the plots of the number of surviving cells Vs compound concentration [32].
Results And Discussion
Spectral Data for the Ligand
The IR spectrum of the organic ligand (S)-2-((phenoxyphosphono)(2-hydroxyphenyl)methylamino)-4-carbamoyl-butanoic acid in KBr disc (Figure 1) shows two bands at 3400 and 3294 cm-1attributed to νNH2. The band at 2984 cm-1 is corresponding to ν NH overlapped with νOH phenolic. The carboxylic with the amide carbonyl groups appears at 1724 and 1648 cm-1, respectively. Also, the bands attributed to P=O and P-O groups appears at 1236 and 1098 cm-1, respectively. The 1H-NMR of (S)-2-((phenoxyphosphono)(2-hydroxyphenyl)methylamino)-4-carbamoylbutanoic acid (PHCB) in CDCl3shows different bands at d = 2.0 and 5.66 ppm are corresponding to (s, 1H, NH) and (s, 1H, Ar-OH),respectively. The bands atd = 6.62-7.32 is related to (m, 14H, Ar-H). The spectrum also shows bands at d = 7.80 and 9.80 ppm are attributed to (m, 2H, NH2) and (s, 1H, COOH), respectively. The 1H-NMR spectrum of PHCB in D2O shows disappearance of carboxylic acid and NH protons (not shown).
The electronic spectral data (not shown) for the organic ligand PHCB in DMSO show two bands at 280 and 325 nm corresponding to the electronic transition π → π* within the benzene ring and n→ π* transitions of the NH and NH2. The elemental analysis for C24H25N2O7P (Table 1), IR ,1H-NMR, and electronic spectra for the ligand PHCB suggest the chemical structure (structure 1).
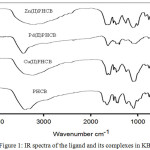 |
Figure 1: IR spectra of the ligand and its complexes in KBr. |
Table 1: Elemental analysis of the prepared compounds.
|
compound |
C% |
H% |
N% |
M |
| PHCB | 59.21/59.47 | 5.20/5.16 | 3.10/2.89 | |
| CuL-2H.1.5H2O | 50.0/50.28 | 4.60/4.53 | 5.01/4.89 | 11.30/11.09 |
| PdL-2H.2H2O | 46.40/46.29 | 4.20/4.33 | 4.51/4.49 | 16.90/17.08 |
| ZnL-2H.2H2O | 49.11/49.22 | 4.56/4.61 | 4.90/4.78 | 11.30/11.17 |
 |
Scheme 1: (S)-2-((phenoxyphosphono)(2-hydroxyphenyl)methylamino)-4-carbamoylbutanoic acid Click here to View Scheme |
IR Spectra
The Copper (II), palladium (II) and zinc (II) complexes of PHCB have been characterized by different physicochemical methods. The IR spectral data of the copper (II), palladium (II) and zinc (II) complexes (Figure 1) show disappearance of the band corresponding to C=O in the ligand. The band at 1647cm-1 in the ligand was splited to two bands at 1618- 1665 and 1506- 1597 cm-1 for copper (II), palladium (II) and zinc (II) complexes, indicating that the carboxyl group is behaving as a bidentate ligand in binding to the metal through two oxygen atoms with displacement of its proton. The band corresponding to P=O at 1236 cm-1in the ligand was changed to 1242- 1252 cm-1for all complexes, suggesting the participation of p=O group in the binding. At the same time, the bands appear at 510-530 cm-1are attributed to νM-N. The νM-O bands for copper, palladium and zinc complexes are appearing at 450- 470 cm-1. The proposed structure was supported by 1H-NMR spectral data for zinc (II) complex, which reveals that the carboxylic and NH protons were disappeared.
Electronic Spectra
The Uv/Vis spectral data (not shown) of the prepared complexes show that the band at 325 nm in the ligand which is corresponding to n→ π* is changed to higher wavelength in Cu(II)PHCB, Pd(II)PHCB and Zn(II)PHCB indicating to combination of O→Mand N→M LMCT transition. The µeff. value of the prepared copper complex Cu(II)PHCB at room temperature was found to be 1.8 BM. This value is corresponding to one unpaired electron [33]. The Uv/Vis spectral data of the copper complex Cu(II)PHCB in DMSO shows a band at 460 nm, corresponding to d–d transition (2B1g→2A1g). The appearance of this band is supporting square-planar geometry for the copper ion in the complex [34]. The absorption bands at 278 and 350 nm can be attributed to a charge transfer band from filled orbitals Cu(II) to the anti-bonding π* orbitals of the organic ligand (S)-2-((phenoxyphosphono)(2-hydroxyphenyl)methylamino)-4-carbamoyl-butanoic [35]. The band observed at 425 nm for palladium complex Pd(II)PHCB in DMSO at room temperature suggesting square planar geometry for the palladium (II) in the complex. The electronic spectral data (not shown) of Zn (II) complex shows three bands at 365, 455 and 516 nm. The first two bands are observed to be shifted towards the red by 85-130 nm upon complexation with Zn metal ion. The geometry around the Zn ion is suggested to be tetrahedral geometry.
Thermogravimetric Studies
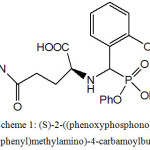
The thermal gravimetric analysis TGA is a method of thermal analysis to confirm the solvent amount (water and/or organic solvent) inside and/or outside of the coordination sphere in the compound. A lot of valuable information about the complexes stability can be achieved from TGA and DTG. The thermogram of Cu(II)PHCB (Figure 2) shows four inflection stages at temperature range 25- 1000oC. The first inflection stage within the temperature range 50-109oC with Wight loss (found4.65% calc. 4.66%) corresponding to losing 1.5 H2O molecules. The second stage from 158oC to 286oC with weight loss (found 11.01%, calc. 10.65%) corresponding to CO2 and NH3 molecules. The third stage in the temperature range 304-421oC with weight loss (found 32.2%, calc. 32.8%) corresponding to losing of two phenol molecules. The total weight loss = 59.71% till 600oC and the remaining weight is equal to 40.29 %. The DTA thermograme of the copper complex Cu(II)PHCB (Figure 2) shows five endothermic peaks at 75, 241, 327, 370 and 566oC and one exothermic peak at 264oC. The thermograme TGA and DTA of the palladium complex Pd(II)PHCB (Figures 3) show the degradation stages for the complex as well as its stability. The TGA thermograme shows three inflection stages in the temperature range 25-1000oC. The first inflection stage in the temperature rage 56-118oC with weight loss (found 2.9%, calc. 2.9%) corresponding to losing of one molecule of H2O. The second stage in the temperature range 162-370oC with weight loss (found 28.5%, calc. 29.2%) corresponding to losing of 2CO2 and PhOH molecules. The remaining weight after 800oC = 60% which is reflecting the stability of the palladium complex until this temperature. The DTA thermograme shows four endothermic peaks at 78, 220, 294 and 842oC with only one exothermic peak at 384oC. At the same time the TGA thermograme for Zn(II)PHCB (Figure 4) shows five inflection stages in the temperature range 25-1000oC. The first inflection stage within the temperature range 54-120 oC with Wight loss (found4.02% calc. 4.02%) corresponding to losing 2 H2O molecules. The second stage in the temperature range 160-241oC with weight loss (found 9.7%, calc. 10.4%) corresponding to CO2 and NH3 molecules. The third stage in the temperature range 274-403oC with weight loss (found 12.7%, calc. 12.4%) corresponding to losing of CH3CH2CONH2 molecule. The total weight loss = 62.92% and the remaining weight is equal to 37.18 %. The DTA thermograme of the zinc complex Zn(II)PHCB (Figure 4) shows five endothermic peaks at 61, 184, 308, 359 and 780oC.
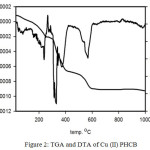 |
Figure 2; TGA and DTA of Cu(II)PHCB |
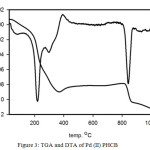 |
Figure 3: TGA and DTA of Pd(II)PHCB |
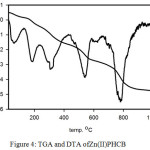 |
Figure 4: TGA and DTA of Zn(II)PHCB |
Thermal Kinetics
The kinetic parameters calculated for all decomposition process for the prepared metal complexes were estimated by using Coats –Redfern equation [36]. Some additional information about the degree of order of the system under investigation has been obtained by the entropy ∆S. At the same time. the enthalpy ∆H gives information about the total thermal motion and Gibbs or free energy gives information about the stability of the system. The parameters E, ∆H, ∆S and ∆G for all inflection points of Cu (II)PHCB, Pd (II)PHCB and Zn (II)PHCB were calculated and given in Table 2. The values of the activation energies of all decomposition process were found to be in the range of 2.80‐40.66 kJ/mol for all inflection stages. The significant result among these data is a considerable stability of the palladium complex Pd (II)PHCB reflected from its high activation energy [37]. Some information about the degree of disorder of the system was given by the entropy ΔS. The negative sign of the entropy of activation value were found to be negative in the complexes under investigation. These negative values indicate that the decomposition reactions proceed with rate less than that in case of the normal ones. Moreover, it indicates that the complexes are formed spontaneously [37,38].
Table 2: Thermodynamic parameters for Cu(II),Pd(II) and Zn(II) complexes
|
Decomposition temperature oC |
E (kJ mo-1) |
∆H (kJ mo-1) |
∆S (J K-1 mo-1) |
∆G (kJ mo-1) |
|
|
Cu(II)PHCB |
60-93 |
26.92 |
24 |
-27.01 |
33.48 |
|
194-257 |
14.63 |
10.4 |
-22.02 |
21.61 |
|
|
302-342 |
40.19 |
35.18 |
-29.87 |
53.19 |
|
|
344-408 |
10.45 |
5.05 |
-22.47 |
19.64 |
|
|
518-590 |
6.26 |
-0.72 |
-22.89 |
18.49 |
|
|
Pd(II)PHCB |
52-118 |
25.55 |
22.69 |
-28.38 |
32.45 |
|
177-232 |
40.66 |
36.56 |
-27.54 |
50.11 |
|
|
251-365 |
2.8 |
-1.95 |
-22.51 |
10.91 |
|
|
816-867 |
60.94 |
51.67 |
-33.53 |
89.07 |
|
|
Zn(II)PHCB |
46-120 |
5.99 |
3.22 |
-19.79 |
9.81 |
|
164-224 |
16.29 |
12.53 |
-21.81 |
22.41 |
|
|
279-403 |
8.4 |
3.55 |
-22.44 |
16.64 |
|
|
488-588 |
7.4 |
0.65 |
-22.87 |
19.22 |
|
|
732-876 |
15.63 |
6.88 |
-39.21 |
48.17 |
Transmission electron microscope (TEM)
The Cu(II), Pd(II) and Zn(II) complexes of PHCB have been examined using TEM. Figures (5,6) show that the average particle size for Pd(II)HPCB and Zn(II)PHCB is found to be in the range of 50-150and 30-100 nm diameter, respectively. These data give a great importance for these complexes to be used in the field of biological and industrial applications.
The elemental analysis of the prepared complexes listed in table 1 with the physicochemical studies such as IR, Uv/Vis, and thermal analysis suggest the chemical structure of the three prepared complexes as shown in structure 2.
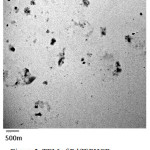 |
Figure 5: TEM of Pd(II)PHCB. |
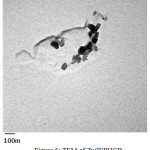 |
Figure 6: TEM of Zn(II)PHCB Click here to View figure |
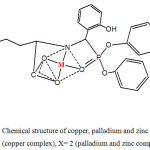 |
Scheme 2: Chemical structure of copper, palladium and zinc complexes X= 1.5 (copper complex), X= 2 (palladium and zinc complexes). |
Evaluation of cytotoxicity against HepG-2 cell line
As a new trail to overcome the side effects of using cisplatine, (S)-2-((phenoxyphosphono)(2-hydroxyphenyl) methyl-amino)-4-carbamoyl-butanoic acid (PHCB)together with its copper (II), palladium (II) and zinc (II) complexes were prepared. All these prepared compounds have been used to investigate their anti-proliferative activity against hepatocarcinoma cells using viability test.
Cell viability test (Figure 7) showed that approximately 76% of the cancer cells have been killed after treatment with the organic ligand. In case of palladium complex, the cell viability showed that approximately 29% of the cancer cells were killed. On the other hand, the activity was increased in case of copper and zinc complexes, and reached about 90% with zinc complex after 24 h of incubation.
To have more information about the activity of the prepared compounds against Hepatocellular carcinoma cells, the inhibition percentage was plotted against concentrations of the organic ligand (PHCB) and its metal complexes. The figure (8) showed that the organic ligand, copper complex and zinc complex show higher activity as anticancer. The inhibition effect of these three compounds increased in the first area (small concentration) until about 25 ug/ml (inhibition = 80%, 75% and 85% in case of PHCB, Cu(II)PHCB and Zn(II)PHCB, respectively) then reaching platue, indicating saturation pattern. On the other hand, the pattern is linear in case of palladium complex Pd(II)PHCB with low activity in the beginning stage.
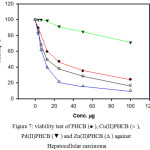 |
Figure 7: viability test of PHCB (● ), Cu(II)PHCB (○), Pd(II) PHCB (▼) and Zn(II)PHCB (Δ ) against Hepatocellular carcinoma |
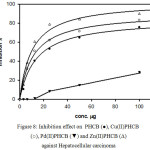 |
Figure 8: Inhibition effect on PHCB (●), Cu(II)PHCB (○), Pd (II) PHCB (▼) and Zn(II) PHCB (Δ) against Hepatocellular carcinoma |
All half-inhibiting concentrations (IC50,) values were confirmed by means of repeating the experiments three times. The inhibitory effect of the prepared compounds against Hepatocarcinoma cells showed that the IC50 of Zn(II)PHCB (Figure9) is the lowest one. Therefore, it can be considered as a good candidate as an anticancer for Hepatocarcinoma.
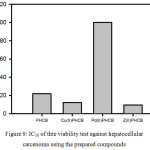 |
Figure 9: IC50 of thte viability test against hepato cellular carcenoma using the prepared compounds |
Conclusion
Four compounds PHCB, Cu(II)PHCB, Pd(II)PHCB and Z(II)PHCB were synthesized and fully characterized by different physicochemical tools. The IR spectral data for complexes show that the metal is coordinated to PHCB through carboxylic and NH groups. Carboxylic group behaves as a bidentate ligand with displacement of the proton. The complexes structures were supported by 1H-NMR which shows the disappearance of carboxylic and NH protons. The kinetic parameters and stability of the metal complexes were studied by thermal analysis. Transmission Electron Microscope shows that the prepared complexes are in nano scale. The activity of PHCB and its Cu(II), Pd(II) and Zn(II) complexes against Hepatocellular carcinoma has been investigated. The zinc complex, Zn(II)PHCB showed the highest activity with IC50 = 9.58 µg/ml suggesting a promising compound as anticancer drug in the future.
Acknowledgment
The authors acknowledge the scientific research deanship at Taif university for supporting this work by research program (1-437-4914).
References
- Siegel, R.L.; Miller, K.D.; Jemal, A. Ca Cancer J. Clin. 2015, 65, 5-29.
CrossRef - Tsochatzis, E.A.; Meyer, T.; Burroughs, A.K.; N. Engl. J. Med. 2012, 366, 92-93.
CrossRef - Mlynarsky L.; Menachem, Y.; Shibolet, O. World J. Hepatol. 2015, 7, 566-574.
CrossRef - El-Serag, H.B.; Marrero, J.A.; Rudolph, L.; Reddy, K.R. Gastroenterology. 2008, 134, 1752-1763.
CrossRef - Olsen, S.K.; Brown, R.S.; Siegel, A.B. Ther. Adv. Gastroenterol. 2010, 3, 55-66.
CrossRef - Cao, H.; Phan, H.; Yang, L.X. Anticancer Res. 2012, 32, 1379-1386.
- Zheng, Z.; Liang, W.; Wang, D.; Schroder, P.M.; Ju, W.; Wu, L. et al. Int. J. Cancer 2015, 136, 751-759.
CrossRef - Yoon, E.L.; Yeon, J.E.; Lee, H.J.; Suh, S.J.; Lee, S.J.; Kang, S.H. et al. J. Clin. Gastroenterol. 2014, 48, 22-29.
CrossRef - Singh, S.; Singh, P.P.; Roberts, L.R.; Sanchez, W. Nat. Rev. Gastroenterol. Hepatol. 2014, 11, 45-54.
CrossRef - Brown, K.S. Semin. Interv. Radiol. 2006, 23, 99-108.
CrossRef - Bigsterbosch, M.L.; Smeijsters, L.J.J.W.; van Berkel, T.J.C. Antimicrob. Agents Chemother. 1998, 42, 1146–1150.
- Gulnik, S.V.; Eissenstat, M. Curr. Opin. HIV AIDS. 2008, 3, 633–641.
CrossRef - Sheng, X.C.; Pyun, H.; Chaudhary, K.; Wang, J.; Doerffler, E.; Fleury, M.; McMurtie, D.; Chem, X.; Delaney, W.E.; Kim, C.U. Biorg. Med. Chem. Lett. 2009, 19, 3453–3457.
CrossRef - Guise, T.A. Cancer Treat. Rev. 2008, 34, (Supp 1), S19–S24.
CrossRef - Martin, M.B.; Grimley, J.S.; Lewis, J.C.; Heath, H.T.; Bailey, B.N.; Kendrick, H.; Yardley, V.; Caldera, A.; Lira, R.; Urbina, J.A.; Moreno, S.N.; Docampo, R.; Croft, S.L.; Oldfield, E. J. Med. Chem. 2001, 44, 909–916.
CrossRef - Yardley, V.; Khan, A.A.; Martin, M.B.; Slifer, T.R.; Aruajo, F.G.; Moreno, S.N.; Docampo, R.; Croft, S.L.; Oldfield E. Agents Chemother. 2002, 46, 929–931.
CrossRef - De Klerk, J.M.H.; Van Dijk, A.; Van het Schip, A.D.; Zonnenberg, B.A.; Van Rijk P.P. J Nucl Med. 1992, 33, 646–51.
- Bozic, L.T.; Frausin, F.; Scarcia, V.; Furlani, A. J. Inorg. Biochem. 2003, 95, 259-269.
CrossRef - Han Ang, W.; Dyson, P.J. Eur. J. Inorg. Chem. 2006, 4003-4018.
- Busto, N.; Valladolid, J.; Aliende, C.; Jalon, F.A.; Manzano, B.R.; Rodriguez, A.M.; Gaspar, J.F.; Martins, C.; Biver, T.; Espino, G.; Leal, J.M.; Garcia, B. Chem.-Asian J. 2012,7, 788-801.
CrossRef - Hannon, M.J.; Pure Appl. Chem. 2007, 79, 2243-2261.
CrossRef - Marzano, C.; Pellei, M.; Tisato, F.; Santini, C. Anticancer Agents Med. Chem. 2009, 9, 185-211.
CrossRef - del, M.; Mejia Vazquez, C.; Navarro, S.; New Approaches in the Treatment of Cancer, Nova Science Publishers, New York. 2010.
- Ramadan, A.E.-M.M.; J. Mol. Struct. 2012, 1015, 56–66
CrossRef - Pothiraj, K.; Baskaran, T.; Raman, N.; J. Coord. Chem. 2012, 65, 2110-1203.
CrossRef - Rajendiran, V.; Karthik, R.; Palaniandavar, M.; Periasamy, V.S.; Akbarsha, M.A.; Srinag, B.S.; Krishnamurthy, H. Inorg. Chem. 2007, 46, 8208-8221.
CrossRef - Terenzi, A.; Tomasello, L.; Spinello, A.; Bruno, G.; Giordano, C.; Barone, G. J. Inorg. Biochem. 2012, 117, 103-110.
CrossRef - Terenzi, A.; Fanelli, M.; Ambrosi, G.; Amatori, S.; Fusi, V.; Giorgi, L.; TurcoLiveri, V.; Barone, G. Dalton Trans. 2012, 41, 4389-4395.
CrossRef - Terenzi, A.; Barone, G.; Piccionello, A.P.; Giorgi, G.; Guarcello, A.; Portanova, P.; Calvaruso, G.; Buscemi, S.; Vivona, N.; Pace, A. Dalton Trans, 2010, 39, 9140-9145.
CrossRef - Zhong, X.; Wei, H.-L.; Liu, W.-S.; Wang, D.-Q.; Wang, X. Bioorg. Med. Chem. Lett. 2007, 17, 3774-3777.
CrossRef - Zhong, X.Yi.J.; Sun, J.; Wei, H.-L.; Liu, W.-S.; Yu, K.-B. Eur. J. Med. Chem. 2006, 41, 1090-1092
CrossRef - Mosmann, T. J. Immunol. Methods 1983, 65, 55-63.
CrossRef - Ahamad, T.; Nishat, N. J. Appl. Polym. Sci. 2008, 107, 2280-2288.
CrossRef - Ribas, J.; Diaz, C.; Costa, R.; Journauv, Y.; Mathoniere, C.; Kahn, O.; Gleizes, A. Inorg. Chem. 1990, 29, 2042-2047.
CrossRef - Fraser, C.; Bosnich, B. Inorg. Chem. 1994, 33, 338-346.
CrossRef - Coats, A.W.; Redfern, J.P. Nature 1964, 201, 68-69.
CrossRef - Mohamed, G.G.; Sharaby, C.M. Spectrochim Acta Part A 2007, 66 (4-5), 949-958.
CrossRef - Singh, B.K.; Mishra, P.; Garg, B.S. Spectrochim. Acta Part A, 2007, 69 (2), 361-370.
CrossRef

This work is licensed under a Creative Commons Attribution 4.0 International License.
![]()
A New Edition of Web of Science
Journal Impact Factor
2022: 0.5
Five Year: 0.8
Journal is Indexed in

Cabells Whitelist
![]()


