Article Publishing History Article Received on : 21-Jul-2021 Article Accepted on : 12-Nov-2021 Article Published : 20 Nov 2021 Plagiarism Check: Yes Reviewed by: Dr. Sachin Shinde Second Review by: Dr. Milica Vasić-milica Final Approval by: Dr. Ajay Mishra
Article Metrics
ABSTRACT:
Hardness in drinking water is a major problem in domestic usage. It is important to use drinking water within the tolerance limits of hardness. Clay samples obtained from two different areas in Sri Lanka were analysed, modified, and optimized with a view to suppress the hardness in drinking water. Characterization of clay was carried out using XRD (X-ray diffraction spectroscopy), FTIR (Fourier transformed infrared spectroscopy), and SEM (Scanning electron microscope). Variation of the adsorption capacity of clay was analysed at different firing temperatures of the clay samples. XRD analysis revealed that both clay types are consisting of Kaolinite as the main constituent. The hardness adsorption efficiency and the retention of hardness adsorption in prolonged cycles has been observed when the clay is heated at different temperatures. In addition, the water hardness adsorption efficiency was enhanced by the cationic modification using sodium chloride. The results further reveals that the Freundlich isotherm is best fit for Ca2+ adsorption on both Biyagama and Deniyaya clay whereas that for the Mg2+ adsorption is Langmuir isotherm. The present study is useful to develop low-cost clay-based materials to minimize water hardness.
KEYWORDS:
Adsorption; Clay Minerals; Kaolinite; Water hardness
Copy the following to cite this article:
Wickramasuriya A. I. R, Arachchige R. C. W, Kottegoda I. R. M. Characterization and Modification of Clay for Removal of Drinking Water Hardness. Mat. Sci. Res. India;18(3).
Copy the following to cite this URL:
Wickramasuriya A. I. R, Arachchige R. C. W, Kottegoda I. R. M. Characterization and Modification of Clay for Removal of Drinking Water Hardness. Mat. Sci. Res. India;18(3). Available from: https://bit.ly/30JVIFV
Introduction
Water is a biological necessity of humans, plants, and animals on the earth. Less than 1% of freshwater is accessible from the ground water level for human consumption. In some cases, the resource does not satisfy the desirable levels regarding their chemical composition such as hardness, nitrate contamination, heavy metals, soluble iron, etc. Among these factors, water hardness is predominant in most ground water resources1. According to the anions found in the salts, natural water hardness can be divided into two parts as carbonate and non-carbonate water hardness. Total hardness includes both carbonate and non-carbonate hardness. Water hardness is measured in milligrams of calcium per litre, or parts per million2. Water with total hardness between 0 to 60 mg/L is considered as soft, 61 to 120 mg/L as moderate, 121 to 180 mg/L as hard, and more than 180 mg/L as very hard3. During the past few decades, it has been identified that water hardness has influenced cardiovascular mortality, growth retardations, reproductive failures, and other health problems. At the same time, the acidity of water affects the reabsorption of calcium and magnesium in the renal tube. Both calcium and magnesium are essential for the human body. But excess nutrients can impair health. Therefore standards have been established at local and international levels to limit the intake of such nutrients at their tolerance levels4. Although it has been reported that there is an inverse relationship between water hardness and cardiovascular diseases, it has not been concluded with certainty5. One of the important findings regarding the relationship between water hardness and cancer was from Taiwan6. They have shown an inverse relationship between water hardness and rectal cancer. And from eastern Europe, it has been evidenced as the first strong ecological relation between water Magnesium and hepatic cancer 7. Urinary stone or urolithiasis is one of the most widely recognized distresses of current society. People and most researchers believe that there is a major relationship between urinary stones and drinking water hardness. That is because the major cause for both urinary stones, and water hardness major cause is calcium8. Various researches have been conducted all around the world on this topic. The majority of the researchers have concluded that there is no considerable relationship between the quality of drinking water and urinary stone formation while some researches have shown intake of soft water may reduce renal stones9. The surface process in which transferring a molecule from a fluid bulk named “adsorbate” to a solid surface named “adsorbent” is called adsorption. Normally this process is reversible and the reverse process is called desorption10.
By contemplating the equilibrium facts and the adsorption characteristics of both the adsorbent and the adsorbate, adsorption isotherm models can describe the interplay mechanisms among the adsorbent and the adsorbate at a consistent temperature11.
Cationic modification for clay has also been done. Reactive barriers have been set up by methods of modified montmorillonite, kaolinite, and palygorskite mud minerals, and a clayey soil with the cationic surfactant octadecyltrimethylammonium bromide12. And the efficiency of those barriers in the immobilization of organic pesticides in sandy soil has been studied revealing that greater than 85% of the total pesticides added to the soil have been retained within the soil than the untreated soil 13.
Considering the advantages of using low cost abundant clay types for remediation of hardness in water, the present study focused on investigation of two clay types in Sri lanka in raw form as well as modified form.
Materials and Methods
Raw clay samples were collected from randomly selected deposits which are located in Biyagama and Deniyaya areas in Sri Lanka. The raw hard water sample was collected from a groundwater resource located in Amunugama, Mahawa area of Sri Lanka. All chemicals were obtained from commercial sources as an analytical reagent. The chemicals were purchased from the corresponding companies: CaCl2, CaCO3, MgCl2, NaCl, NH4OH, EDTA, Eriochrome Black T (EBT), HCl.
Firing temperature optimization for hardness adsorption
The raw clay samples were dried in air and crushed before using. Powdered clay samples were fired in a furnace at different temperatures ranging from 350 °C, 650 °C, 700 °C, 750 °C, and 850 °C.
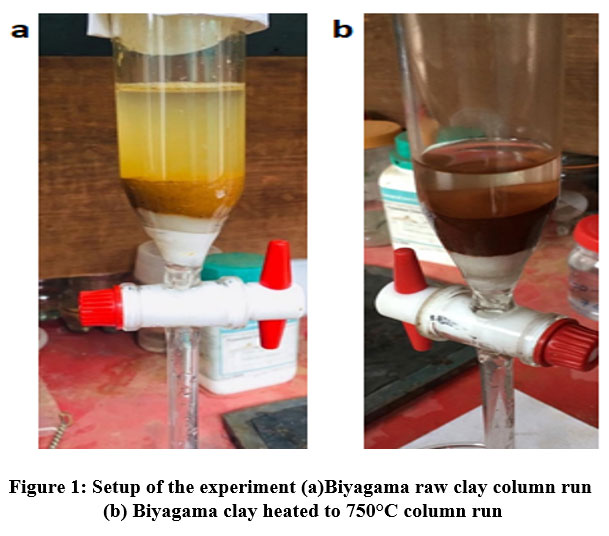
A glass column was packed using 10.00 g of clay and 100.00 ml of hard water sample was run through the column at a time up to 6 times (600.00 ml total) one after the other (consequently) with a flow rate of 100 ml/0.5 hr. The above whole procedure was repeated for all the clay samples heated at 350 °C, 650 °C, 700 °C, 750 °C, and 850 °C. The amount of hardness that remained in the eluted water samples was analysed by the titrimetric method using EDTA according to the APHA method12.
Figure 1: Setup of the experiment (a)Biyagama raw clay column run (b) Biyagama clay heated to 750°C column run
The clay samples were analysed by using an automated XRD (RigakuUltima IV) with a Cu-Kα radiation λ = 1.5405 Å source operating at a voltage of 40kV, current of 40mA in the scan rate of 2q range from 50 to 1200 in steps of 0.05 at a rate of 2.00 per minute. Changes of 2q angles were identified by comparing the values of the basal space of samples with literature. The morphological observations of clay minerals were imaged by using SEM (LEO 1420vp). Metal sputter coater – (Emitech-K550x) was used to sputter the gold atoms on the clay surface. Conditions of accelerating voltage at between 10-20kV, magnifications as 2.00 kX, working distance as 26 mm to 30 mm, and scan speed from 4 to 9 were used. Surface characterization of original and heated clay samples was performed using FTIR (BRUKER TENSOR 27). Transmission mode ATR method under the range of 4000-500 cm-1 wavelength was used.
Cationic modification
After doing random trials by changing NaCl concentrations and changing the time of bed stocking the column, it was found that the most appropriate NaCl concentration is (1 M) and the bed stock time is 24 hrs for a clay sample of 10.00 g. Hard water was run through a column that was bed stock with NaCl (1 M) for 24 hours and the eluted water fractions were titrated according to the APHA method.
Development of
adsorption isotherms
The adsorption isotherms at 30 °C were obtained by introducing 100 mL of the solution of different Ca2+ concentrations onto clay in well-closed flasks. Then, all of the solutions were shaken for 2 h. After shaking, the suspension was centrifuged, and the final concentration of metal ion was analysed by the titrimetric method using EDTA according to the APHA method. The procedure repeated for Mg2+.
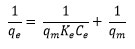
The Langmuir equation can be written in the following linear form;
Where, Ke: Langmuir constant (Lmg-1),qm: maximum adsorption capacity (mg g-1), Ce: Equilibrium adsorbate concentration in solution (mg L-1), qe: Equilibrium adsorbent capacity (mg g-1). The slope and the intercept values can be calculated from the plot of
To predict the adsorption efficiency of the process, the dimensionless equilibrium parameter (RL) Separation factor is expressed by =
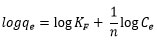
The linear form of the Freundlich isotherm is as follows;
Where, KF : adsorption capacity (L/mg), 1/n : adsorption intensity. The slope and the intercept values can be calculated from the plot of log qe vs log Ce . Moreover, if the n value is less than 1 it indicates poor adsorption characteristics and when n lies above 1 adsorption is favourable and a physical process.
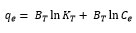
The linear form of the Temkin model is written as;
Where,
: Temkin constant related to the heat of adsorption (J mol-1), KT: Temkin isotherm equilibrium binding constant (L g-1). The slope and the intercept values can be calculated from the plot of qe vs ce .If b is a positive value it indicates that the adsorption reaction is exothermic. And also, if it is a negative value that represents the adsorption process is endothermic. At the same time if the b value is high it shows fast sorption of adsorbate at the initial stage (14).
Results and Discussion
XRD and FTIR analysis were conducted to identify the mineral type as well as changes after modification of clay obtained from Biyagama and Deniyaya regions in Sri Lanka.
FTIR Analysis
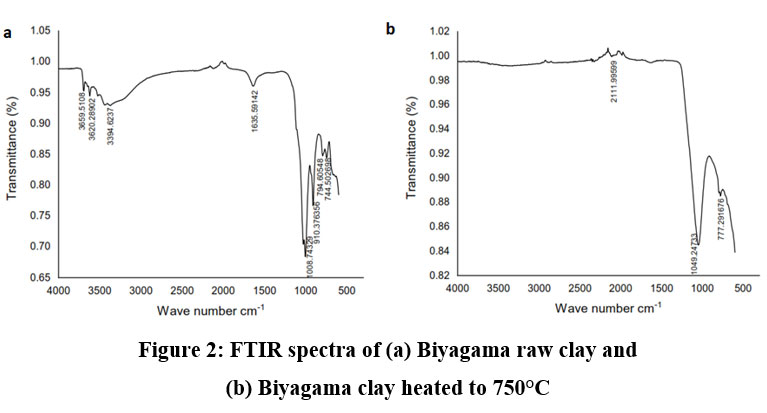
Figure 2: FTIR spectra of (a) Biyagama raw clay and (b) Biyagama clay heated to 750°C
Figure 2 shows FTIR spectra of Biyagama raw clay and clay fired at 750 ºC. The four peaks, observed in the range 3695-3620 cm-1 (OH stretching region) for Biyagama raw clay sample represents the presence of Kaolinite with mostly Al in the octahedral positions15,16. Internal hydroxyls, found between the tetrahedral and octahedral sheets, give the absorption close to wavelength 3620 cm-1. The other three OH groups dwell at the octahedral surface of the layers and form less strong hydrogen bonds with the oxygen of the Si–O–Si bonds on the lower surface of the following layer. The peak at the region of ∼1640 cm-1 can be assigned to the bending vibration of the H-O-H bond. The band at the wavelength of ∼1043 cm−1 can be taken as the characteristic peak of (SiO4)2− groups due to Si-O-Si symmetric stretching vibration. The peaks at the region of ∼650 cm−1 and ∼464 cm−1are due to the bending vibration of the Si-O-Si bond. Among them, the minute peak at the same region ∼600cm−1 and ∼700cm−1 may be due to vibration of reductive carbon in the crystal lattice (14). Some of these peaks have been disappeared after heating the clay at high temperature.
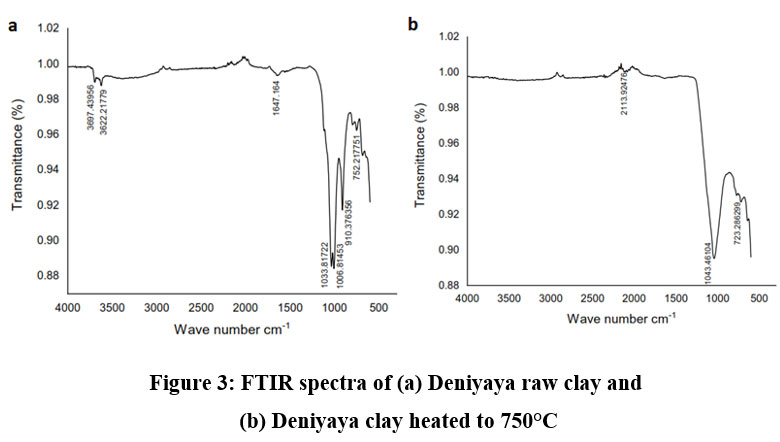
Figure 3: FTIR spectra of (a) Deniyaya raw clay and (b) Deniyaya clay heated to 750°C
Figure 3 shows FTIR spectra of Deniyaya raw and fired clay. Deniyaya clay sample shows two peaks at the region of ∼3694 – ∼3648cm-1 which are the characteristic peaks for the Kaolinite and goethite clay type 17. Peaks at the region of 3694– 3648 cm-1 are due to the O-H stretching vibration of structural O-H groups. The bands at this region correspond to the O-H stretching vibration of H2O 18. The bands at the wavelength between 1050 – 1118 cm-1 represent the Si-O in-plane and out-of-plane stretching vibrations(19). The band which emerges at the region ∼529 cm-1 represents the Si-O bending vibrations. The shoulder-like peak at 1033 cm-1shows Si-O out-of-plane stretching vibration 18.
XRD Analysis
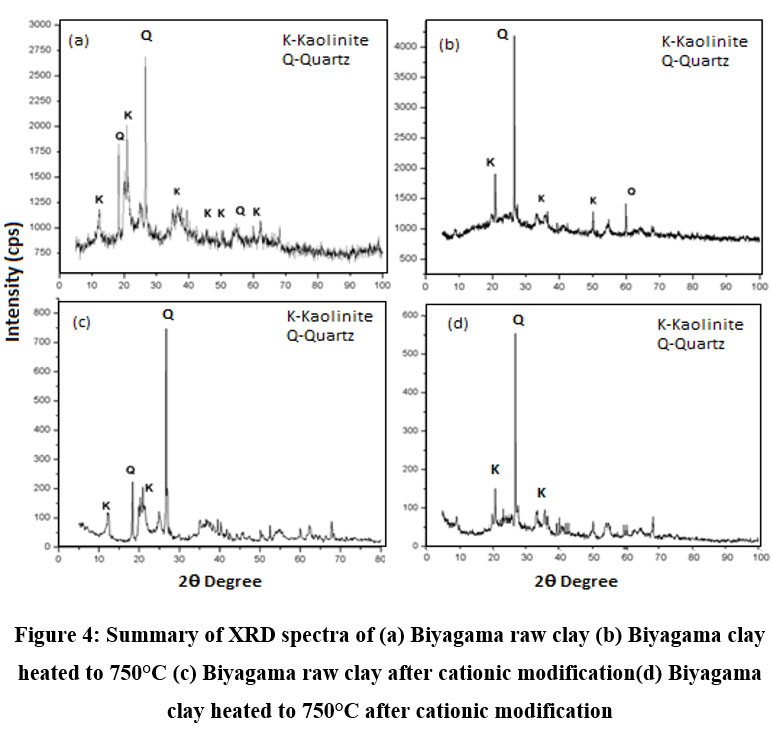
Figure 4: Summary of XRD spectraof (a) Biyagama raw clay (b) Biyagama clay heated to 750°C (c) Biyagama raw clay after cationic modification (d) Biyagama clay heated to 750°C after cationic modification
XRD spectra for the Biyagama raw samples for chemically and thermally treated are shown in Figure 4. Biyagama raw clay (Figure 4. a) two intense peaks at 2θ value of 12.4° and 26.7°, less intense peaks at 2θ of 45.6°, 48.1°,50.2° and humps at 2θ of 19.6°, 21.9°, 35.1°, 36.1°, and 37.8°- 40.2° all represent the presence of Kaolinite in the sample20. The major peak observed is for quarts since quarts is commonly found in clay. The peaks found at the 2θ = 20.9°, 30.1°, 50.9° and 62.4° assigned as quartz 20, 21, 22. The intensities of XRD peaks are due to the orientation of clay mineral particles. Usually, the intensity levels are enhanced by preferred orientations23 as well as intensity values of XRD spectra are closely related to the crystallinity and the particle size of the sample 24. When the raw clay is heated to 750°C intensity levels of the XRD graphs have been increased from 300 cps to 7000 cps. This could be due to the destruction of crystallinity and gaining the preferred orientation with the temperature increase25. And after the cationic modification, the intensity levels have been reduced from about 3000 cps – 800 cps. After the cationic modification, Na atoms are embedded within the kaolinite structure causing for various orientations increasing number of sites available to adsorb Calcium & Magnesium ions 26.The observed improvement of hardness adsorption presumably resulting from this as shown later. Hence, formation of various orientations could be the reason to enhance the hardness adsorption after the modification done26.
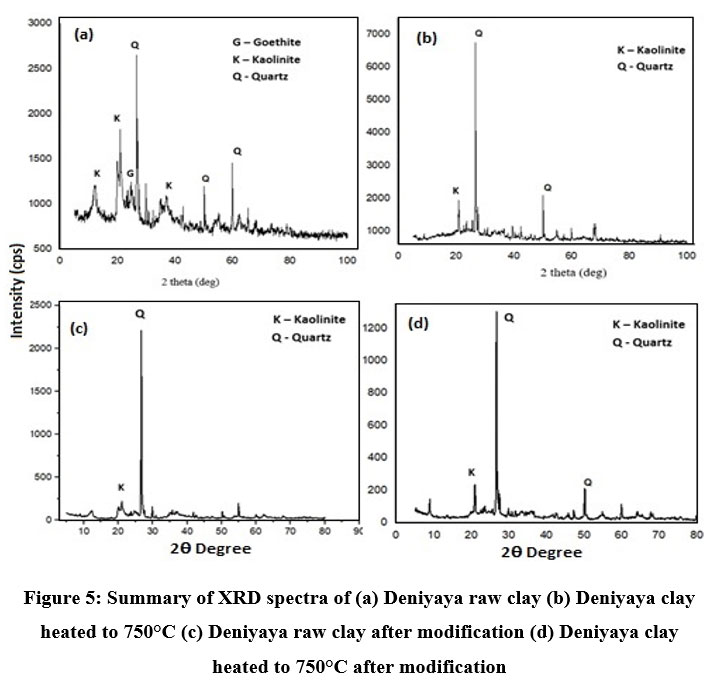
Figure 5: Summary of XRD spectra of (a) Deniyaya raw clay (b) Deniyaya clay heated to 750°C (c) Deniyaya raw clay after modification (d) Deniyaya clay heated to 750°C after modification
When observed the XRD spectra for Deniyaya clay, many similarities with Biyagama clay can be seen with few variations. Major peak observed is for quarts for Deniyaya clay as well. Same as the Biyagama clay, (Figure 5. a) the peaks relevant to the Kaolinite at 2θ value of 12.4° and 26.7°, less intense peaks at 2θ of 45.6°, 48.1°,50.2° and humps at 2θ of 19.6°, 21.9°, 35.1°, 36.1°, and 37.8°- 40.2° were observed. Apart from that, at 2θ 21.5° the peak relevant to Goethite can be seen 27. Goethite has also been used to remove impurities such as heavy metals from water(28). More or similarly, here also the intensity of the peaks has been increased from 3000 cps to 7000 cps when the clay was treated with temperature. When cationic modification was done to Deniyaya raw clay intensity of peaks has been vastly decreased and only the peak relevant to quartz was prominent. This may be because of the loss of the number of preferred orientations in the structure. But when the modification is done for the clay which is thermally treated again the peaks have appeared, hence it can be suggested that at that stage crystal structure of the clay has a high number of preferred orientations26.
SEM Analysis
Figure 6: SEM micrographsof (a) Biyagama raw clay (b) Biyagama clay heated to 750 °C (c) Deniyaya raw clay (d) Deniyaya clay heated to 750 °C
Figure 6 shows SEM images of raw clay and clay heated to 750 ºC. In both samples, particles carry irregular shapes and sizes. Aggregates are observed in heated samples of both clay types. When the samples are heated at high temperatures, the bulk density of the clay reduces obviously due to the decomposition of organic materials at high temperatures. As well this happens due to the vitrification between particles in the clay with the temperature rising29.The pore distribution in the Biyagama clay samples is higher than the Deniyaya clay samples. In the Biyagama clay sample more pores have been exposed when it is heated and the aggregates are deemed to be loosely packed and show a crystalline nature of the surface(30). Both Deniyaya clay samples show a plate-like structure attached to aggregated grains on the plate and a few pores. Aggregation is noticeable when it is heated.
Particle Size Analysis
Table 1: Particle size of 50% of the sample (µm)
Clay Type
The average particle size at different temperatures
Raw clay(°C)
350°C
650°C
700°C
750°C
850°C
Deniyaya Clay
35.88
48.32
64.23
100.18
142.14
143.73
Biyagama Clay
8.90
34.63
33.29
39.10
45.06
63.56
Table 2: Particle size of 100% of the sample (µm)
Clay Type
The average particle size at different temperatures
Raw clay(°C)
350°C
650°C
700°C
750°C
850°C
Deniyaya Clay
120.36
305.37
317.83
328.77
367.33
386.45
Biyagama Clay
43.96
115.28
101.74
149.46
166.34
147.22
The particle size of raw clay and fired clay samples were shown in Table 1 and Table 2. The average particle size of Deniyaya clay observed to be higher than that of Biyagama clay naturally. The average particle size of both samples has been increased with the increasing temperature. This helps in the determination of the most abundant particle size in the samples and this will help determine the amount of grinding needed in the manufacturing process (31). The increase in particle size may be due to the aggregation of clay particles as shown in the SEM.
Hardness Adsorption Efficiency of Clay
Table 3: Summary of efficiency of adsorption in Biyagama clay
Hard water added (ml)
Efficiency of adsorption (%)
Raw clay
350°C
650°C
700°C
750°C
850°C
100.00
55±1
79±1
61±1
72±2
72±2
65±1
200.00
37±2
59±2
34±1
53±1
68±1
52±1
300.00
28±1
46±1
25±3
35±1
47±1
39±1
400.00
21±1
40±1
25±1
36±2
33±2
29±2
500.00
20±1
36±1
17±1
30±1
31±2
14±1
600.00
22±1
35±2
17±2
32±2
26±1
9±2
Biyagama raw clay shows lower hardness adsorption efficiencies than fired clay as shown in Table 3. Raw clay as well as heated clay samples shows decreased adsorption efficiencies on further addition of hardwater. The best retention of the adsorption efficiencies was shown by clay samples heated at 350 ºC and 750 ºC. To be energy effective Biyagama clay heated at 350 ºC is usable in effective reduction of water hardness.
Table 4: Summary of efficiency of adsorption in Deniyaya clay
Hard water added (ml)
Efficiency of adsorption (%)
Raw clay
350°C
650°C
700°C
750°C
850°C
100.00
74±2
69±1
75±3
60±1
67±2
77±2
200.00
35±1
42±2
43±2
57±1
41±1
31±2
300.00
25±1
20±1
29±1
27±2
20±1
24±2
400.00
15±1
22±2
22±1
17±2
12±2
20±2
500.00
10±
21±2
15±2
19±2
10±2
18±2
600.00
3±1
17±2
9±1
23±2
7±2
17±2
The results in Table 4
shows that Deniyaya raw clay and heated clay are effectively minimize hardness
in water although hardness adsorption efficiencies decreases with added hard
water. The retention ability decreases rapidly than that of Biyagama clay.
In general, the temperature has not come out as a critical factor when the efficiency of the hardness removal process is determined. This will provide the freedom of choosing a temperature per industrial requirement. In general, hardness absorption efficiency was its best at all the firing temperatures with the least amount of water (100.00 ml). It was above 60% at all the firing temperatures. But with the increase of added hard water volume, the efficiency of hardness removal dropped obviously due to the saturation of the clay samples. The efficiency of hardness removal averaged at 40% for Biyagama clay versus 31% for Deniyaya clay initially. But with the increase of the volume, it averaged at 23% for Biyagama versus 14% for Deniyaya which indicates that the Biyagama clay sample was able to retain its hardness adsorption efficiency compared to that of the Deniyaya clay sample. In average Biyagama heated clay shows better hardness adsorption ability and retention than that of Deniyaya clay.
Development of Adsorption Isotherms
A proper studying and interpretation of adsorption isotherms are crucial for the overall improvement of adsorption mechanism pathways and the powerful layout of the adsorption system. And also the equilibrium isotherm is essential in explaining the interactive behaviour between the adsorbate and adsorbent (32). The adsorption isotherms have been constructed for the four most commonly used isotherms Langmuir, Freundlich, and Temkin isotherms for the adsorption of Ca2+ and Mg2+ ions by clay samples from Biyagama and Deniyaya at room temperature.
Langmuir adsorption isotherm
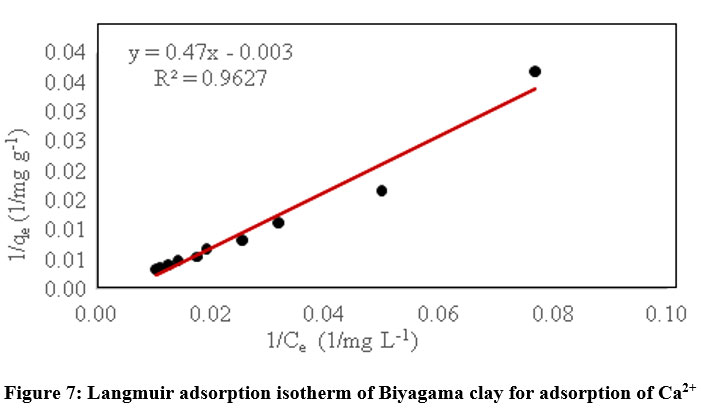
Figure 7: Langmuir adsorption isotherm of Biyagama clay for adsorption of Ca2+
Table 5: Parameters resulting from the application of isotherm models for Ca2+
Isotherm type
Parameter
Biyagama clay
Deniyaya clay
Langmuir
qm (mg/g)
-333.3
769.2
Ke(L/mg)
-6.38×10⁻²
5.2×10⁻³
R2
0.9627
0.9781
Freundlich
KF (L/mg)
1.73
3.98
n
0.9
0.8
R2
0.9869
0.9852
Temkin
b (J mol-1)
18.7
75.9
KT
13.3
7.6
R2
0.9305
0.8809
Table 6: Parameters resulting from the application of isotherm models for Mg2+
Isotherm type
Parameter
Biyagama clay
Deniyaya clay
Langmuir
qm (mg/g)
-10000
-1000
Ke(L/mg)
-0.011
-0.013
R2
0.9834
0.9936
Freundlich
KF (L/mg)
104.7
125.9
n
1.1
0.9
R2
0.9726
0.9888
Temkin
b (J mol-1)
1.3
10.02
KT
2.1
2.3
R2
0.9004
0.9514
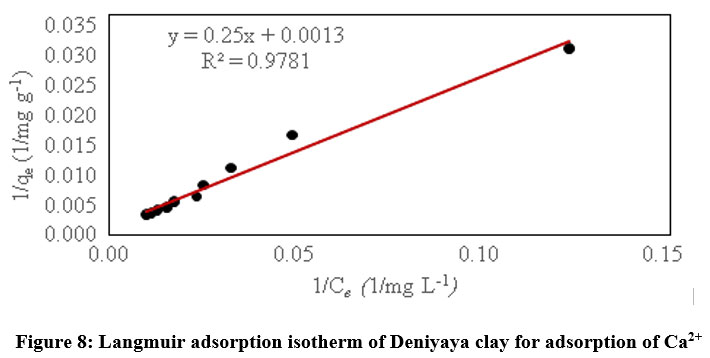
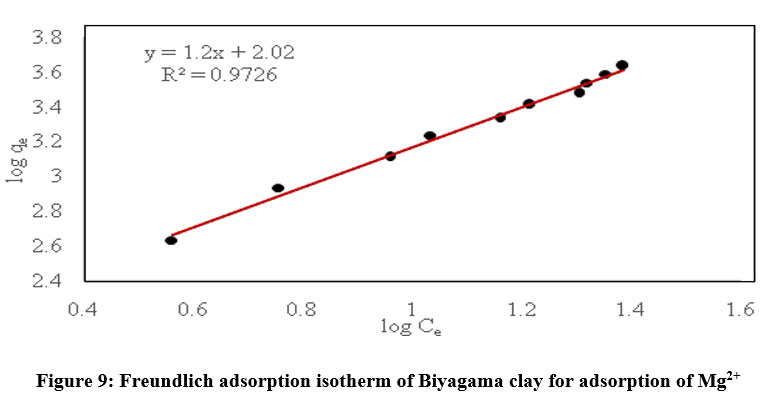
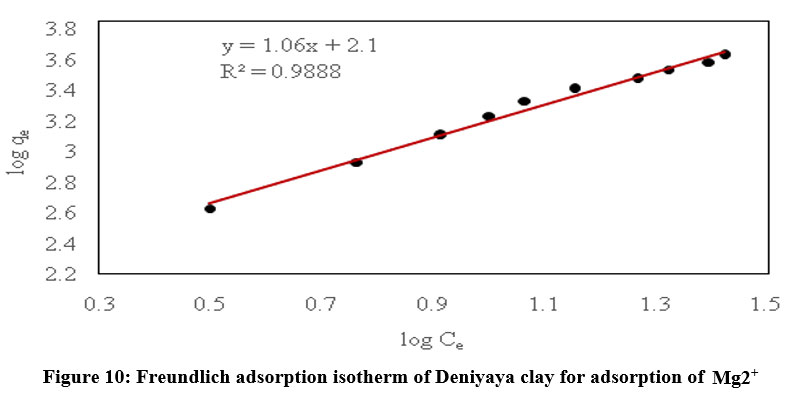
Eventually, based on the highest value of the coefficient of determination (R2), the best-fit isotherm model for both Biyagama clay and Deniyaya clay on Ca2+ adsorption is the Freundlich isotherm mode while that for Mg2+ adsorption is the Langmuir isotherm model. From isotherm model fitting, it can assume that Biyagama clay and Deniyaya show heterogeneous adsorption for Ca2+ while both clays show monolayer adsorption on Mg2+.
Cationic Modification using NaCl
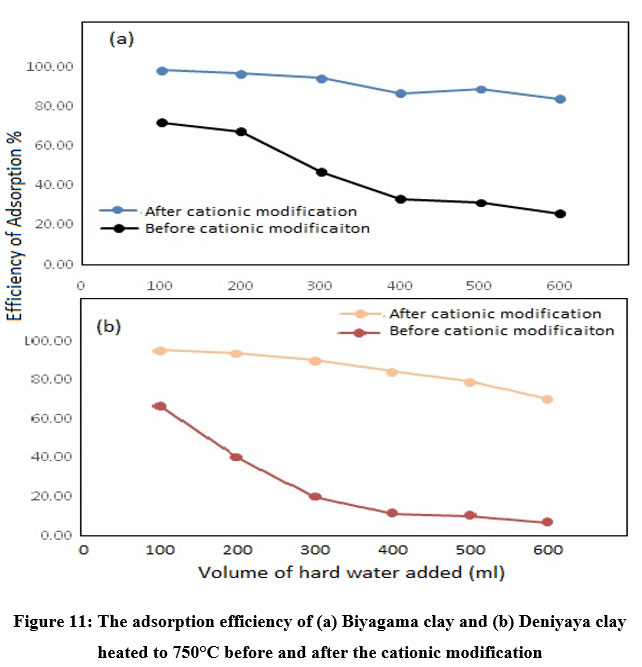
According to the Table 7 and Table 8, Efficiency of adsorption and its retention has been increased in significant levels after cationic modification of raw clay as well as clay heated to 750 ºC. Clay heated to 750 ºC showed the best performances reaching to almost 100% efficiencies. Biyagama clay shows better performances comparing to Deniyaya clay.
Table 7: Efficiency of adsorption of Biyagama raw clay and clay heated to 750°C after cationic modification
Volume of hard water added (mL)
Efficiency of adsorption(%)
Raw clay
750°C
100.00
84
99
200.00
59
97
300.00
71
94
400.00
68
87
500.00
56
89
600.00
53
84
Table 8: Efficiency of adsorption of Deniyaya raw clay and clay heated to 750°C after cationic modification.
Volume of hard water added (mL)
Efficiency of adsorption(%)
Raw clay
750 c
100.00
82
96
200.00
70
94
300.00
64
90
400.00
55
84
500.00
49
79
600.00
39
70
Figure 11: The adsorption efficiency of (a) Biyagama clay and (b) Deniyaya clay heated to 750°C before and after the cationic modification
The graph of adsorption capacities of the Biyagama and Deniyaya samples after cationic modification is illustrated in (Figure 11). The adsorption capacity of Deniyaya clay is gradually decreasing while the Biyagama clay shows excellent retention of the adsorption capacities. Deniyaya clay seems to be saturated more easily than Biyagama clay due to variation in properties with increasing temperature. As per the XRD results, Biyagama clay makes more orientations than Deniyaya clay in their structures when the temperature increases. When the number of orientations increases, the order of the packing gets disturbed making more pores in the clay structure. This would be the reason for the increase in efficiency of Biyagama clay than that of Deniyaya clay.
When the Sodium capture
mechanism occurs in Kaolinite, it tends to enlarge its hollow sites. Hence it
is possible for more Ca& Mg ions to enter into those hollow sites(26).
Kaolinite is a two-layered silicate mineral comprising of exchanging layers of silica tetrahedra and aluminum hydroxide octahedra. The hydrogen holding between the hydroxyl ions of the octahedral sheet of one bilayer and the tetrahedral oxygen of the adjoining silica sheet of the following bilayer holds a two-layered structure together(33). Perfectly, the hexagonal surface structure of the silica tetrahedral sheet is relied upon to be of low polar and unfit to help hydrogen bonding with water molecules as in the situation for the three-layer silicates, pyrophyllite, and talc(32). All things considered, the kaolinite surfaces are wetted and promptly dispersed in water. Some polarity could emerge because of aluminum replacement for silicon in the tetrahedral sheet which then represents the negative charge of the tetrahedral sheet (34).
It has been revealed that the adsorbed species have been affected for the adsorption over different terminal surfaces of kaolinite. There are three main steps in the process of sodium capture mechanism onto the kaolinite adsorbent. They are the physical adsorption stage, internal diffusion stage, and chemical adsorption stage. The basis of the reaction is physical adsorption. At the first stage, Na atoms diffuse into the internal hollow site of the kaolinite through the external surface. This is because of the ability of kaolinite for physical adsorption due to its porous structure. In the second stage, due to the dihydroxylation pore size of the kaolinite clay increases leading it more conducive to the diffusion of sodium. At the last stage, the solid solution of sodium aluminum silicate is formed. The sodium capture process can occur simultaneously and continually until the kaolinite structure is saturated and deactivated (26).
Conclusion
The study was conducted to improve clay for the removal of hardness in water considering two clay types obtained from Biyagama and Deniyaya areas in Sri Lanka. Based on the FTIR and XRD analysis, Biyagama clay mainly consists of Quartz and Kaolinite clay while the Deniyaya clay is mainly consisting of Quartz, Kaolinite and Goethite.
Temperature range 700 – 750 °C can be used as the optimized temperature in industrial applications. When the clay was modified using NaCl, it showed a dramatic surge in hardness adsorption efficiency which is attributable to the Sodium capture mechanism occurring in kaolinite resulting an increase in the size of the hollow sites present in the clay. The hardness removal capacity of Biyagama clay is slightly higher than Deniyaya clay after the cationic modification with NaCl. Hence, both Biyagama and Deniyaya clay can be effectively used in manufacturing the filter.
In attempts to fit the adsorption into a suitable isotherm model, the Freundlich adsorption isotherm model is the best fit for Ca2+ adsorption while Langmuir isotherm is the best fit for Mg2+ adsorption in both clay types. The present study would be very useful in the development of low-cost clay materials in water purification processes.
Acknowledgment
The manuscript was prepared through the contribution of all authors.
Conflict of Interest
There is no conflict of interest regarding the publication of this
article.
Funding source
Treasury Grant (No. 16/125) at Industrial Technology Institute, Colombo 7, Sri Lanka.
References
Y. Hailu, E. Tilahum, A. Brhane, H. Resky, and O. Sahu, Ion exchanges process for calcium, magnesium and total hardness from ground water with natural zeolite. Groundwater for Sustainable Development. 8, 457–467 (2019) CrossRef
A.M. Saeed, M.J. Hamzah. New Approach for Removal of Total Hardness ( Ca2+, Mg2+ ) from Water Using Commercial Polyacrylic Acid Hydrogel Beads, Study and Application. International Journal of Advanced Biological Biomedical Research. 1(9), 1142–1156 (2013)
P. Ramya, A. J. Babu, E. T. Reddy, and L. V. Rao, A study on the estimation of hardness in ground water samples by EDTA titrimetric method. International Journal of Recent Scientific Research. 6, 4505–4507 (2015)
Sengupta P. Potential health impacts of hard water. International Journal of Preventive Medicine. 4(8), 866–875 (2013)
I. R. Lake, L. Swift, L. A. Catling, I. Abubakar, C. E. Sabel, and P. R. Hunter, Effect of water hardness on cardiovascular mortality: an ecological time series approach. Journal of public health. 32(4), 479–487 (2009) CrossRef
H.F. Chiu, S.S. Tsai,T.N. Wu, C.Y. Yang, Effect modification of the association between trihalomethanes and pancreatic cancer by drinking water hardness: Evidence from an ecological study. Environmental Research.110(5), 513–8 (2010) CrossRef
C. Y. Yang, S. S. Tsai, C. F. Lai, and H. F. Chiu, Rectal cancer mortality and total hardness levels in Taiwan’s drinking water. Environmental Research. 80(4), 311–316 (1999) CrossRef
M.K. Moslemi, H. Saghafi, S. M. A. Joorabchin, Evaluation of biochemical urinary stone composition and its relationship to tap water hardness in Qom province, central Iran. Int Journal of Nephrology Renovascular Disease. 4, 145–800 (2011). CrossRef
L. Nicola, V. Bellizzi, R. Minutolo, D. Russo, B. Cianciaruso, M. Andreucci, G. Conte, and V. E. Andreucci, Effects of water hardness on urinary risk factors for kidney stones. Nephron. 81(suppl 1), 66–70 (1999) CrossRef
Y. Artioli. The Chemistry of Adsorption. 60–65 (2008). CrossRef
M. A. Al-Ghouti, A. D. Da’ana, Guidelines for the use and interpretation of adsorption isotherm models: A review. Journal ofHazardous Materials. 100-632 (2019
APHA method. In: APHA Method. 37–9 (2017).
M. S. Rodríguez-Cruz, M. M. J. Sánchez, M.S. Andrades, M. Sánchez-Camazano, Modification of clay barriers with a cationic surfactant to improve the retention of pesticides in soils. Journal of Hazardous Materials.139(2), 363–372 (2007 CrossRef
M. Noori, M. Zarrabi, H. Kazemian, A. Amrane, Removal of hardness agents, calcium and magnesium, by natural and alkaline modified pumice stones in single and binary systems. Applied Surface Science. 274, 295–305 (2013) CrossRef
J. Madejová (2003) ‘FTIR techniques in clay mineral studies’, Vibrational Spectroscopy, 31(1), pp. 1–10. CrossRef
Farmer, V. C. (2000) ‘Transverse and longitudinal crystal modes associated with OH stretching vibrations in single crystals of kaolinite and dickite’, Spectrochimica Acta – Part A: Molecular and Biomolecular Spectroscopy, 56(5), pp. 927–930. CrossRef
Prasad, P. S. R., Prasad, K . S., Chaitanya, V. K., Babu, E. V. S. S. K., Sreedhar, B. and Murthy, S. R. (2006) ‘In situ FTIR study on the dehydration of natural goethite’, Journal of Asian Earth Sciences, 27, pp. 503–511 CrossRef
Xue, W., He, H., Zhu, J. and Yuan, P. (2007) ‘FTIR investigation of CTAB – Al – montmorillonite complexes’, Spectrochimica acta, 67, pp. 1030–1036. CrossRef
Paluszkiewicz, C., Holtzer, M. and Bobrowski, A. (2008) ‘FTIR analysis of bentonite in moulding sands’, 880, pp. 109–114. CrossRef
B. Meroufel, O. Benali, M. Benyahia, Y. Benmoussa, M. A. Zenasni, Adsorptive removal of anionic dye from aqueous solutions by Algerian kaolin: Characteristics, isotherm, kinetic and thermodynamic studies. Journal of Material Environmental Science. 4(3), 482–91(2013)
S. Kahraman, O. Muserref, S. Yuksel, B. Ihsan Characterization of silica polymorphs in kaolins by X-ray diffraction before and after phosphoric acid digestion and thermal treatment.Analytica Chimica Acta. 552:201–206 (2005) CrossRef
M. E. L Ouahabi, L. Daoudi, Mineralogical and geotechnical characterization of clays from northern Morocco for their potential use in the ceramic industry. 35–51 (2014) CrossRef
X. Zhou, D. Liu, H. Bu, L. Deng, H. Liu, P. Yuan, P. Du, and H. Song, XRD-based quantitative analysis of clay minerals using reference intensity ratios, mineral intensity factors, Rietveld, and full pattern summation methods: A critical review. Journal of Solid Earth Sciences. 1-14 (2017) CrossRef
D. Zhao, J. Zhou , N. Liu, Surface characteristics and photoactivity of silver- modified palygorskite clays coated with nanosized titanium dioxide particles.Material Characterizationa. 58, 249–255 (2007) CrossRef
L.N. Warr, F. Nieto, Crystallite thickness and defect density of phyllosilicates in low-temperature metamorphic pelites: A TEM and XRD study of clay-mineral crystallinity-index standards. The Canadian Mineralogist. 1998;36(6):1453–74.
Z. Zhang, J. Liu, Y.Yang, F. Shen, Z.Zhang, Theoretical investigation of sodium capture mechanism on kaolinite surfaces. Fuel 2018;234(July):318–25. CrossRef
J. Macedo , R. B. Bryant, Preferential Microbial Reduction of Hematite ver Goethite in a Brazilian Oxisol. 1985;(Iv).
M. Amrani, M. Ghaleb, A. Ragab, M..Ramadan, Low-Cost Goethite Nanorods for As ( III ) and Se ( VI ) Removal from Water. Applied sciences (III):1–15.
M. Sutcu, H. Alptekin, E. Erdogmus, Erdogmus Y, O. Gencel, Characteristics of fired clay bricks with waste marble powder addition as building materials.Construction and buidling materials. (2015);1-8
B.F. Bohor, R.E. Hughes. Scanning electron microscopy of clays and clay minerals. Clays and Clay Minerals. 1971;19(1):49–54. CrossRef
Nsiah, J. (2008) ‘The Study Of Mfensi Clay In The Ashanti Region Of Ghana’, Ghana Journal of Science, 47(1), pp. 123–129. CrossRef
Ngah, W. S. W. and Fatinathan, S. (2008) ‘Adsorption of Cu(II) ions in aqueous solution using chitosan beads, chitosan-GLA beads and chitosan-alginate beads’, Chemical Engineering Journal, 143(1–3), pp. 62–72. CrossRef
Murray, H. H. (1997) ‘Structure and composition of the clay minerals and their physical and chemical properties’, Applied clay minerology, pp. 7–31. CrossRef
Miller, J. D., Nalaskowski, J., Abdul, B. and Du, H. (2008) ‘Surface Characteristics of Kaolinite and Other Selected Two Layer Silicate Minerals’, The Canadian Journal of Chemical Engineering, 85(5), pp. 617–624. CrossRef

 , R. C. W. Arachchige1