

Manuscript accepted on : 09-02-2021
Published online on: 11-03-2021
Plagiarism Check: Yes
Reviewed by: Dr. Hiren B. Soni![]()

Second Review by: Dr. Bilal Ahmed![]()
Final Approval by: Dr. Fernando José Cebola Lidon![]()
Gulrez Nizami1*, Shifa Rehman1, R. Z. Sayyed2, Ummul Khair Fatma1 and Hesham El Enshasy3,4![]()
1Department of Chemistry, Sir Syed Faculty of Science, Mohammad Ali Jauhar University, Rampur, UP 244901 India.
2Department of Microbiology, PSGVPM’S Arts, Science and Commerce College, Shahada, 425409, Maharashtra, India.
3Institute of Bioproduct Development (IBD), UniversitiTeknologi Malaysia (UTM), Skudai, Johor Bahru, 81310, Malaysia
4City of Scientific Research and Technology Applications (SRTA), New Borg Al-Arab, Alexandria, 21934, Egypt.
Corresponding Author E-mail: gulrezkhurramnizami@gmail.com
DOI : http://dx.doi.org/10.13005/bbra/2896

ABSTRACT:
The present study was aimed to analyze the influence of industrial and agricultural wastes on quality ofKosi river water, Rampur, UP, India. The results of the present study revealed pH values of between 7.2 and 6.3 (neutral to slightly acidic), the electrical conductivity between 129.4 μs/cmto399.3 μs/cm. The maximum EC value was observed at S5 in spring season. The turbidity of each was 0.4 to 7.067 NTU. The highest turbidity observed at S5 in winters. Total hardness of 73 (mg/L) and 506.33 (mg/L) were evident at S4 and S7 sites respectively. The BOD values ranged from 10.5 (mg/L) at S4 to 137.4 (mg/L) at S5. Higher BOD values at each site are reflecting the great extent of pollution. The minimum COD recorded at S3 (32.60 mg/L) however maximum recorded at S5 (168.65 mg/L). The results of the heavy metals showed a significant increase in the concentration of Pb, Zn, Cu, Hg and As at S5 as compared to the other sites. The As concentration was 0.04, 0.08, 0.85, 0.72 and 0.71 at S2, S3, S5, S6, and S7 respectively. These values were higher than the value of Arsenic as per WHO guidelines.The average concentration of Zn obtained was 0.05, 0.786, 0.413, 0.06, 3.26,0.97 and 0.53 mg/L at S1, S2, S3, S4, S5, S6, and S7 respectively. The highest value of Zn was recorded at S5 (SDP) as compared to other sites. Only at S5 the zinc content is exceeding the normal value. The copper content found to be lower (1.0 mg/Ll) than permissible value according to WHO. The Cu concentration was 0.01, 0.06 0.01 at S4, S5 and S6 respectively, at S1,S2, S3 and S7 zero. The changed physicochemical parameters and occurrence of heavy metal ions indicated a significant level of pollution in Kosi River.
KEYWORDS: BOD; COD; Electrical Conductivity; Turbidity
Download this article as:| Copy the following to cite this article: Nizami G, Rehman S, Sayyed R. Z, Fatma U. K, Enshasy H. E. Long term Impacts of Effluents on Quality of the Kosi River Water at District Rampur, Uttar Pradesh, India. Biosci Biotech Res Asia 2021;18(1). |
| Copy the following to cite this URL: Nizami G, Rehman S, Sayyed R. Z, Fatma U. K, Enshasy H. E. Long term Impacts of Effluents on Quality of the Kosi River Water at District Rampur, Uttar Pradesh, India. Biosci Biotech Res Asia 2021;18(1). Available from: https://bit.ly/3veqPEr |
The transition metals with the 5 g/cm3 density are the elements which are essential components of soil, water and air. Several researchers have proved that the concentration of heavy metal higher than the maximum permissible value are lethal and can cause considerable harm to the ecosystem plants, animals and human health1,2.The elevated levels of these metals not only disturb the aquatic ecosystem but also cause toxic effects to living organisms1. The rapid industrialization in India is also an important factor of releasing heavy metals and other harmful pollutants into the soil and water bodies through their untreated waste. Therefore the rules and regulation of environmental protection are implemented more strictly which instructs manufacturers to treat the effluent before their drainage to decrease the levels of certain metal ions. The measurement of extent of contamination is therefore essential to get the information of the quality of soil, water and air for society3. Studies conducted on surface water soil revealed that agricultural runoff, industrial and urban waste are source of heavy metals accumulation 4,5. Along with industrial and agricultural runoff the leaching of heavy metals from sea waters to estuaries and rivers are also a cause of heavy metals contamination in the surface water 6 .It was found that coastal lagoons usually do not allow fast water exchange 7, resulting the gathering of heavy metals in the ecosystem. Several among them are vital for living organisms, like Cu and Zn, whereas, some other heavy metals such as Pb, Cd, Hg, etc. are highly toxic for all living beings 8,9. They are responsible for severe harm to physiological and metabolic processes of organisms when environments possess high concentrations of these elements than desired permissible limit. These heavy metals not only directly affect the organisms by accumulating in the body but also they indirectly enter through food chain to the higher tropic level 10. The gravest consequence of this shift is biological magnification by the food chain11. The dissolution of the heavy metals inflowing water bodies can be inhibited by a balanced set of physicochemical parameters like pH, conductivity, type of metal species, turbidity, the hardness, total alkalinity and the redox atmosphere of the marine system12,28. When these metals reached to the aquatic bodies through numerous sources, they get adsorbed onto inorganic and organic systems and settled as residueensuing in higher concentration of heavy metals in bed sediment13,14. The Physicochemical studies provide important information to determine the water quality. Many external factors like pH, dissolved oxygen, electrical conductivity and the available surface area for adsorption caused by the variation in grain size distribution are factors which determine the solubility of heavy metals15. Though, it is also a fact that metals cannot always be removed by sediments only. Some sediment bounded elements may reach back to water by means of the many disturbed environmental factors as low pH, imbalanced redox potential, the organic ligand levelsetc. and enforceundesirable effects on living organisms12. The Kkosi river water in district Rampur UP India was found to possess higher concentration of lead, mercury and pesticides at some selected sites16. Therefore the present paper is an attempt to analyze and monitor the effect of industrial and agricultural waste on the heavy metals content like Pb, Zn, Cu,Hg and As and physico-chemical balance of the river Kosi at district Rampur, UP, India because such accumulations of heavy metal screatelatenthazard to entire ecosystems including wildlife as well as human welfare.
Materials and Methods
Description of the study area
The basin of river Kosi is the area under study, passed through district Rampur, Uttar Pradesh. It is positioned among longitudes 78o54” to 69o28” E and latitude 28o25”to 29o10”N and on coordinate it 28.8N to 79.0oE. The river Kosi under the basin of Rampur has 3,429 Km² total areas. The citizens of this district labor mostly in farming and industries in neighboring areas. The Kosistream water is mainly utilized for agricultural, domiciliary practice and as well as for drinking purpose. Kosi is one of the chief branches of river Ramganga and is one of the important tributary of northern part of Uttar Pradesh and Uttrakhand. Now days, waterway contamination is a severe and evolving problem in most of the developing countries. Because of speedy industrial development, the disposal of effluent to natural water bodies has been enhanced. Before entering Rampur, the river Kosi crosses Kashipur (UdhamSingh Nagar) Uttarkhand, India, known for its rice-belt and several industries.These industries releasetheir treated/untreatedwaste into it and then it arrives into the district Rampur (Figure 01 and Table 01).
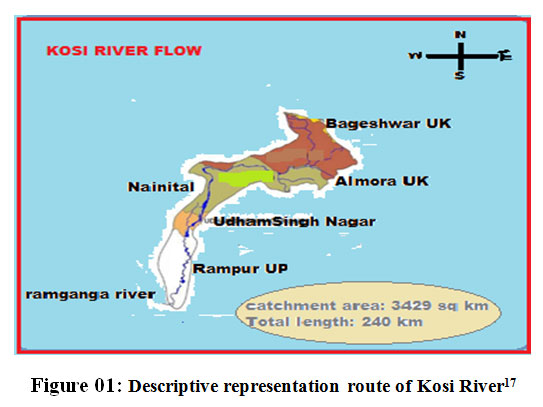 |
Figure 01: Descriptive representation route of Kosi River17 |
Table 01: Description of sampling sites and their geographical locations.
| Site of each sample for collection | Geographical location | |
| S1 | DadiyalTanda | 28.974°N 78.942°E. |
| S2 | Swar | 29.027°N 79.057°E |
| S3 | Lalpur barrage | 27.4060N 77.6110E |
| S4 | Pranpur Said Nagar | 28.840 N 79.0050 E |
| S5 | Shahbad | 28.34°N 79.10°E |
| S6 | NH24 Rampur kosi bridge | 29.027°N 79.057°E |
| S7 | Industrial drainage from Kashipur | 29.220N 78.950E |
Water Sampling
The samples from each site under study were taken in the decontaminated plastic bottles. Replica samples for heavy metals and physicochemical parameters measurement were collected together from all sample sites. The process of collection of samples was carried out each season in a year i.e. in summer, rainy season and in the mid-winter season for one year (2018-2019), the period of sampling was from June 2018 to February 2019. Five different locations were identified from each site for sampling as SB, NB, CP, 20-CP (Table 01).Standard procedures were acquired for the investigation of different water quality assessments15. All flasks were cleaned with dilute acid followed by distilled water and then dried. The sampling bottles were carefully filled completely and sealed, devoid of letting airbubble during sampling. The samples taken were kept airtight in an icebox and preceded to the laboratory immediately for analysis. In the laboratory, samples were kept at -20°C and removalof impurities was carried out within 48 h. Each 100 ml of water sample is acidified with concentrated HNO3 for heavy metal analysis.
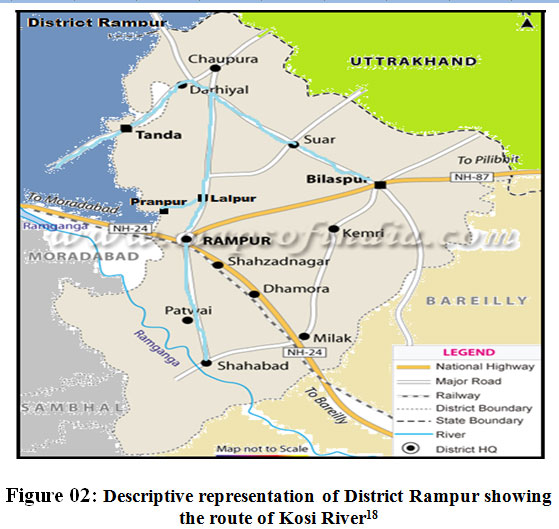 |
Figure 02: Descriptive representation of District Rampur showing the route of Kosi River18 |
Route of flow of Kosi River through selected sampling sites.
Analyses of physicochemical parameters
All the analyses were carried out thrice in a year i.e. in the summer, spring and winter season systematically. The studies of the several physicochemical parameters were conducted as per the standard methods and protocol19.The estimation of Temperature, hydrogen potential (pH) and electrical conductivity were carried out at the same time of sample collection.
pH determination
The pH was recorded with the digital pH-meter20. First pH meter was calibrated with the buffer solutions, the electrode(s) and glassware were rinsed with distilled water. 100 ml of samples were measured and kept in a 150 ml beaker for the pH determination. Then rinsed electrodes were immersed in the test sample. All samples are kept at room temperature in the tightly sealed bottle before estimation. pH was recorded within 5 minutes of opening of the sample bottle.
Turbidity determination
Turbidity of collected water samples was determined by Naphelo-turbidity meter21. Since turbidity is an optical property of water, hence it is very important parameter to measure. It gives the information of suspended impurities or suspended particles in the water. When light passes through suspended particles in water it gets reflected by suspended particles present. This property of scattering of light due to suspended Particle is called turbidity.
Total Hardness determination
The total hardness of water samples was determined by the volumetric method with EDTA22.
Electrical Conductivity determination
It was measured by the dissolved matter in the water, the charge of ions produced, the ionization potential, the frequency and the temperature of the water. Thus, the measurement of the conductivity indicates the total dissolved salts in the water and therefore its mineral content2450 ml of water sample of each site was taken in the conical flask and stirred for 30 minutes and analyzed through conductivity meter its mineral content.
BOD determination
BOD was observed as per standard method. Biochemical oxygen demand is a measure of the quantity of oxygen used by microorganisms (e.g., aerobic bacteria) in the oxidation of organic matter. BOD is conducted over a five day period. To determine five-day biochemical oxygen demand (BOD5), the samples with different dilutions are measured for dissolved oxygen before and after a five-day incubation period at 20 °C in the dark.
COD determination
COD was determined by potassium dichromate open reflex method23.The chemical oxygen demand measurement is conducted to find out the toxic atmosphere of the river and occurrence of biologically immune organic matters.
Chloride determination
The Chlorides content were determined by Mohr’s argentometric method. In this titration the silver nitrate solution is gradually added drop-wise and silver chloride precipitate is obtained. The precipitation of all chloride ions is represented as end point.
Heavy metals determination
Atomic absorption spectroscopy is a technique that records the concentration of metals qualitatively and quantitatively. The examination of heavy metals in water samples was carried out by atomic absorption spectrophotometer each season11.
Statistical analyses
The data of the present study was analyzed by the following statistical approaches.
Percent enrichment
In this study the heavy metal pollution at various sites of Kosi River were ascertained by the calculation of percent enrichment. The percent enrichment24 was calculated by using following formula
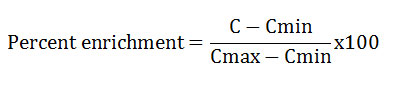
Where,
Cmin and Cmax are the minimum and maximum concentrations(mg/L) obtained in this study
C is the mean concentration (mg/L) in the water sample.
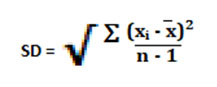
Standard Deviation
The standard deviation of all the observed values was calculated by following formula. Where xi is the observed value, is the average value of all the observed readings and n is the number of observations.
Results
Physicochemical parameters of Kosi
The Kosi river water samples were analyzed for physicochemical characteristics of the water from February 2018 to February 2019.The results showed that temperature range was from 28.12 to 30.49 °C and the minimum value obtained in January and maximum value obtained in May and June. The standard pH values of the water samples obtained between 7.2 and 6.3, which confirm the almost neutral to slightly acidic state of water. At S2 the water pH-value was 7.4 in winter season whileat S5it was 6.3. The results obtained for turbidity of each sample indicated the range from 0.4 to 7.067 NTU. The electrical conductivity values of all the samples were obtained from 129.42to 399.36μs/cm. The highest value obtained at S5. The total solid content value of Kosi river water samples was observed from 15.05 (mg/L) to 2009.166 (mg/L). The highest value obtained at S5 and lowest value at S2. The TDS values ranged from 11.08 (mg/L) to 174.746 (mg/L). The highest value obtained at S5 and lowest value at S1 (Table 02). The maximum permissible limit of each analysis has been enlisted in the Table 03.
Table 02: Physico-chemical parameters of River Kosi and industrial drainage location.
| Sample
Code |
season | Turbidity
NTU |
pH | Conductivity
μs/cm |
Tem | Total solid
(mg/L) |
TDS
(mg/L) |
Total hardness
(mg/L) |
Chloride
(mg/L) |
| S1 | Summer | 0.40 | 6.85 | 221.8 | 36 | 44.75 | 12.093 | 103.0 | 111.0 |
| Spring | 2,80 | 6.98 | 176.9 | 29 | 20.08 | 11.08 | 98.60 | 94.50 | |
| Winter | 6.35 | 6.35 | 232.2 | 23 | 29.15 | 12.10 | 109.5 | 81.00 | |
| S2 | Summer | 1.65 | 7.20 | 261.7 | 36 | 53.55 | 23.75 | 144.0 | 88.00 |
| Spring | 1.43 | 7.10 | 234.0 | 29 | 34.91 | 38.09 | 142.0 | 78.00 | |
| Winter | 1.30 | 7.40 | 255.6 | 23 | 15.05 | 47.50 | 134.0 | 68.00 | |
| S3 | Summer | 3.30 | 7.10 | 250.1 | 36 | 29.67 | 12.67 | 94.33 | 149.0 |
| Spring | 2.05 | 7.10 | 247.1 | 29 | 20.14 | 11.90 | 102.0 | 136.0 | |
| Winter | 1.16 | 7.00 | 234.2 | 23 | 29.66 | 12.50 | 108.6 | 97.33 | |
| S4 | Summer | 2.43 | 6.83 | 491.7 | 36 | 63.00 | 23.36 | 73.00 | 51.33 |
| Spring | 2.50 | 6.90 | 257.5 | 29 | 46.1 | 23.567 | 78.00 | 50.21 | |
| Winter | 5.23 | 6.46 | 241.9 | 23 | 6 | 25.06 | 66.60 | 57.33 | |
| S5 | Summer | 7.06 | 6.33 | 309.55 | 36 | 2009.0 | 174.74 | 446.3 | 244.66 |
| Spring | 20.3 | 6.89 | 399.36 | 29 | 1800.0 | 152.43 | 366.0 | 165.90 | |
| Winter | 25.2 | 6.20 | 244.83 | 23 | 809.26 | 117.57 | 218.6 | 125.88 | |
| S6 | Summer | 3.30 | 6.95 | 129.42 | 36 | 950.8 | 363 | 160.0 | 148.00 |
| Spring | 2.90 | 6.78 | 150.32 | 29 | 850.6 | 360 | 146.0 | 137.00 | |
| Winter | 2.65 | 6.90 | 457.4 | 23 | 435.9 | 363 | 89.60 | 105.80 | |
| S7
|
Summer | 2.03 | 6.86 | 297.4 | 36 | 83.46 | 104.4 | 506.3 | 110.66 |
| Spring | 1.89 | 6.90 | 270.5 | 29 | 68.09 | 102.8 | 380.0 | 102.82 | |
| Winter | 2.26 | 6.43 | 213.5 | 23 | 26.20 | 104.43 | 226.3 | 74.00 |
Table 03: Permissible limits of drinking water quality.
| Parameters | USEPA | WHO | ISI | ICMR | CPCB |
| pH (mg/L) | 6.5-8.5 | 6.5-8.5 | 6.5-8.5 | 6.5-9.2 | 6.5-8.5 |
| Turbidity (NTU) | – | 5 | 10.00 | – | 10 |
| Electrical conductivity (μs/cm) | 500 | 400 | – | – | – |
| DO (mg/L) | 4.5 | 6.0 | |||
| BOD (mg/L) | 2.0 | ||||
| Total hardness(mg/L) | – | 500 | 300 | 600 | 600 |
| Chloride (mg/L) | 250 | 200 | 250 | 1000 | 1000 |
| Lead (mg/L) | – | 0.05 | 0.10 | 0.05 | No relaxation |
| Mercury (mg/L) | 0.02 | 0.001 | 0.00 | 0.00 | No relaxation |
| Zinc (mg/L) | – | 5.0 | 5.00 | 0.10 | 15.0 |
| Arsenic (mg/L) | 0.05 | 0.05 | 0.05 | 0.05 | No relaxation |
| Copper (mg/L) | 1.30 | 1.0 | 0.05 | 1.50 | 1.5 |
Total hardness of the selected sites was observed from 73 (mg/L) at S4 to 506.33 (mg/L) at S7. The chloride content was observed from 88(mg/L) at S2 and 244.667(mg/L) at S5. The chloride contents of the analyzed water samples (Table 03) results show that the chloride concentration is less than 1000 mg/L as per WHO standards of Drinking water. The Dissolved oxygen of Kosi river samples showed the range of 0 mgL-1at S4 & S5 to 2 (mg/L) at S7. Generally when the value of Biochemical oxygen demand exceeds there is decline in the dissolved oxygen level. The Biochemical oxygen demand ranged from 10.5 (mg/L) at S4 to 137.4 (mg/L) at S5. The higher value of COD is indicating the extent of pollution in the Kosi River. The minimum value of chemical oxygen demand observed at S3 32.60 (mg/L) and maximum value was observed at S5 168.65 (mg/L) (Figure 03).
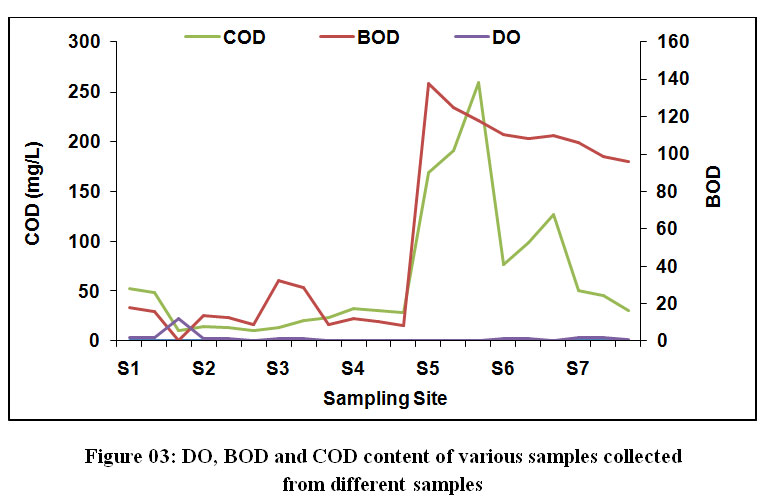 |
Figure 3: DO, BOD and COD content of various samples collected from different samples . |
Samples were collected from seven sampling sites i.e. S1. S2. S3. S4. S5. S6. S7 during summer, winter and spring seasons for the period from June 2018 to Feb 2019. These samples were analyzed for the estimation of DO, BOD and COD contents.
Heavy metals contamination of water of Kosi River
In the present paper, the effect of industrial and agricultural discharge have studied to estimate the quality of Kosi river water by determining the levels of heavy metals of the Kosi River in the basin of district Rampur U.P. When collected samples of at Kosi River examined the value of As was found to be 0.04 at S2, 0.08 at S3, 0.85 at S5, 0.72 at S6 and 0.71 at S7. These values are clearly indicating the exceeding value of As as per WHO at all the sampling sites except S4 and S1.The contents of zinc were found to be 0.04 at S1, 1.28 at S2, 0.19 at S3, 0.05 at S4, 7.76 at S5, 0.685 at S6 and 0.04 at S7 in summer season. The highest value of Zn was recorded at S5 (Shahbad near sewage disposal point). The concentration of Cu was 0.01, 0.06 and 0.01 at S4, S5 and S6 respectively. While at S1,S2, S3 and S7 the Cu was not detected. The results obtained reveal that the concentration of lead in the analyzed waters is very high, varying between 0.14 to 3.86 mg/L. The values recorded in the different sites are very high than the maximum acceptable value (Table 02). The data obtained reveal that the total mercury concentrations in the analyzed waters samples are low, varying from nil to 0.001 mg /L, the values recorded in the different sites are lower than the maximum value as mentioned in Table 02. The results obtained by the analysis of the zinc, copper, arsenic, mercury and lead levels in the water samples are shown in Table 04, Figure 04.
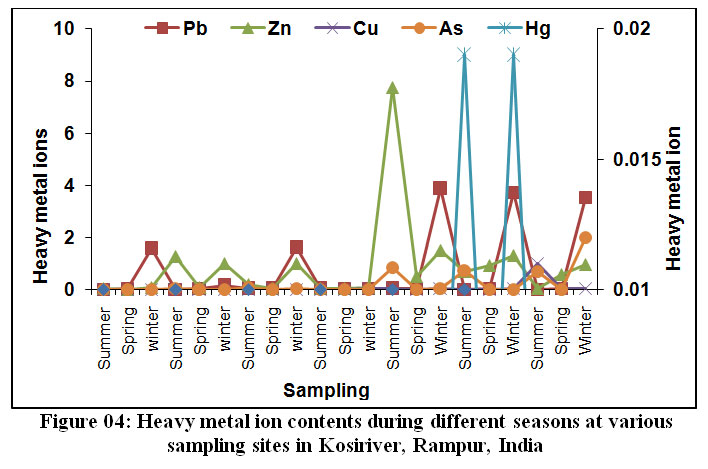 |
Table 04: Heavy metals contents in the water samples of the Kosiriver, Rampur. India. |
Table 04: Heavy metals contents in the water samples of the Kosiriver, Rampur. India
| Sample code | Seasons | Pb | Zn | Cu | Hg | As |
| S1 | Mean | 0.538 | 0.05 | NIL | 0.00 | NIL |
| PE | 33.69 | 42.85 | – | 51.85 | – | |
| SD | 0.88 | 0.03 | – | 0.00 | – | |
| S2 | Mean | 0.06 | 0.78 | – | 0.00 | 0.01 |
| PE | 39.47 | 58.89 | – | 30.00 | 33.25 | |
| SD | 0.06 | 0.62 | – | 0.00 | 0.01 | |
|
S3 |
Mean | 0.55 | 0.41 | – | 0.00 | 0.04 |
| PE | 33.29 | 38.24 | – | 66.66 | 54.12 | |
| SD | 0.88 | 0.51 | – | 0.00 | 0.02 | |
|
S4 |
Mean | 0.03 | 0.06 | 0.02 | 0.00 | NIL |
| PE | 51.20 | 50.00 | 41.73 | 65.00 | – | |
| SD | 0.03 | 0.01 | 0.02 | 0.00 | – | |
| S5 | Mean | 1.30 | 3.26 | 0.03 | 0.00 | 0.30 |
| PE | 33.40 | 37.84 | 55.50 | 67.00 | 34.91 | |
| SD | 2.21 | 3.92 | 0.023 | 0.018 | 0.47 | |
| S6 | Mean | 1.25 | 0.97 | 0.026 | 0.012 | 0.24 |
| PE | 33.51 | 46.60 | 41.75 | 66.68 | 34.74 | |
| SD | 2.12 | 0.72 | 0.024 | 0.00 | 0.37 | |
| S7 | Mean | 1.20 | 0.53 | 0.37 | 0.00 | 0.24 |
| PE | 33.54 | 52.12 | 33.68 | 33.33 | 34.26 | |
| SD | 2.025 | 0.47 | 0.545 | 0.00 | 0.36 |
PE: Percent Enrichment, SD: standard deviation.
Samples were collected from seven sampling sites during summer, winter and spring seasons for the period from June 2018 to Feb 2019 and analyzed were subjected to the estimation of various heavy metal ions.
Discussion
Contamination of water bodies is one of the major rising environmental concerns in India. Urban discharge sources, industrial effluents, and agricultural runoff increase heavy metal levels in receptive rivers. In the present study the impact of prolong industrial and agricultural drainage have been taken into consideration for the assessment of quality of Kosi river water in terms of levels of heavy metals and physicochemical parameters of the Kosi river in the basin of district Rampur U.P. The results showed that temperature range was from 28.12 to 30.49 °C and the minimum value obtained in January and maximum value obtained in May and June. It is quite obvious that the pH of the water is the quantity of the concentration of the H+ ions present which indicates the balance between miscellaneous forms of carbonic acid and formation of buffer system by carbonates and bicarbonates24. The standard pH values of the water samples obtained between 7.2 and 6.3, which is indicative of more or less neutral to some extent acidic state of water. At S2 7.4 water pH-value was obtained in winter season while at S5 it was 6.3. Both the values are suggesting the slight alkaline to slight acidic state of water respectively. The highest value of turbidity was observed at S5 in winters. Turbidity is a parameter to measure thetransparency and clarity of water. It directly alters the color of the water. The amount of suspended impurities in water reduces the channel of light in the water. Soil particles, microbes, algae and other materials are included in suspended substances. Generally in the size range of these substances may be 0.004 mm (clay) to 1.0 mm (sand). As per WHO (World Health Organization), the turbidity of drinking water should be less than 5 NTU, and ideally it should be below 1 NTU.The study of electrical conductivity the capacity of the water to conduct an electrical current is measured. The conductivity increases as concentration of ions increases. All the values of the conductivities found within the maximum permissible value 200-800μs/cm (Table 02), which revealed that water is feebly mineralized. As per (McGowan, 2000) the range of soft water should be 60-12 mg/L, for moderately hard 120-180mg/L and for hard water it remains more than 180 mg/L. therefore S5 and S7 are indicating values higher than moderately hard. The total solid content value of Kosi river water samples was observed from 15.05 (mg/L) to 2009.166 (mg/L). As per EPA its max permissible limits is 500mg/L. The highest value obtained at S5 and lowest value at S2. According to WHO TDS are inorganic salts and small amount of organic matter present in the water. The TDS values ranged from 11.08 (mg/L) to 174.746(mg/L). The highest value obtained at S5 and lowest value at S1 (Table 03) (Figure 02, 04). The maximum permissible limit of TDS is 500 ppm (WHO).
The Dissolved oxygen of Kosi river samples showed the range of 0 mg/L at S4 and S5 to 2 (mg/L) at S7.Generally when the value of Biochemical oxygen demand exceeds there is decline in the dissolved oxygen level. The Biochemical oxygen demand ranged from 10.5 (mg/L) at S4 to 137.4 (mg/L) at S5. At all the sites of Kosi River the BOD value was higher than normal value which is clearly signifying that the surface water is significantly contaminated. The chemical oxygen demand measurement is conducted to find out the poisonous environment of the river and occurrence of biologically immune organic matters. The higher value of COD is indicating the extent of pollution in the Kosi River.The results of the analyses of heavy metals in the collected water samples of Kosiriver at district Rampur UP show a significant increase in the concentration of Pb, Zn, Cu, Hg & As at S5, and the concentration of all the metals at other sites are relatively low. As per the present study lead concentration was highest at S6 and S7 in winter season. Although it was also detected that the Pb concentration was high in winter season as compared to other seasons in all waste water samples like S1, S2, S3,S4, S5, S6 and S7. The level of Pb found at S1 was from (0.0197-0.0131), at S2 (0.0222-0.0125) at S3 (0.0275-0.0183) at S4 (0.0252-0.0148), at S5 (0.027-0.0147), at S6 (0.0217-0.0102), at S7 (0.02075-0.0138).
The higher Hg concentration is obtained at S1 in summer season as compared to other sites. The maximum Hg level was detected at S1 0.00675 μg/L in summer season, while the concentration at other sites were S2 0.001 μg/L in Summer season, S3 0.0009 μg/L in Summer season, S4 0.0002 μg/L in Summer season, S5 0.001 μg/L in Summer season and 0.00012 μg/L in winter season, S6 0.0009 μg/L in Summer season and 0.019 μg/L in winter season and at S7 0.00006 μg/L in winter season. In spring season the Mercury was not recorded at any site it may be due to the dilution effect of the rivers due to rain fall. The maximum concentration for Zn was 7.76 mg/L at S5 in summer season while minimum at 0.02mg/L at S1 in spring season. The concentration of Zinc found at S1 was from (0.02-0.09), at S2 (0.08-1.28) at S3 (0.05-1) at S4 (0.05-0.07), at S5 (7.76-1.5), at S6 (0.685-1.3), at S7 (0.04-0.98).The maximum concentration of Cu was detected at S7 in summer season. While at S1, S2 and S3 Cu level is not observed. The concentration of Cu found at S4 (0.01-0.05), at S5 (0.04-0.06), at S6 (0.01-0.05), at S7 (0.05-1). However the higher concentration of As was obtained at S7 in winter season however at S1 it was not detected. The concentration of As found at S2 (0-0.04) at S3 (0.05-0.08) at S5 (0.01-0.08), at S6 (0.0-0.72), at S7 (0.71-2).
The concentration of Arsenic in drinking water has been investigated at various sites of the Kosi River. WHO has set a provisional guideline value of As 0.01 mg/L in drinking water and in India standard drinking water specification 1991, the maximum limit is 0.05 mg/L and there is no relaxation for maximum permissible level26. The anomalies in the physical and chemical parameters variability of the sub-lagoon Aby (Ebrié Lagoon, Ivory Coast) were monitored. Statistics, recorded from 2007-2009 and at 18 different locations, abnormalities in physical and chemical parameters were observed 27. As per WHO guidelines the highest desirable limit of Zn in drinking water is 5.0 mg/L. Therefore only at S5 the zinc content is exceeding the normal value. The copper content in the KosiRiver was found to lower than permissible value according to WHO (1.0 mg/L) .Such concentration may be either due to the leaching of the heavy metals rich soil or industrial discharges directly to the Kosi. Their contents at S5 are too high and the maximum permissible value has been crossed.
Conclusion
This research paper aimed to through light upon the present state of extent of pollution in the river Kosi due to the presence of heavy metals and alteration in the values of physicochemical parameters of the River. Present research conducted on heavy metal pollution on this river showed that the concentration of heavy metals in these selected sites are exceeding the permissible concentrations, which penetrate the stream, through straight discharges of municipal, industrial and mining effluents as discussed in the paper. The toxic heavy metals and imbalance in physicochemical parameters are not only badly affecting the human health by causing severe diseases but also creating the imbalance of the aquatic ecosystem of river. Since protection and management plan of other rivers is going on a large scale by Government of India but still there is a need of attention towards Kosi River. Therefore the conservation and supervision strategies are suggested for the contaminated sites of Kosi River and to implement the preservation and awareness plan of river Kosi at all the mentioned sites.
Acknowledgement
The authors are highly thankful to council of Science & Technology Uttar Pradesh for providing financial assistance for this work under study.
Conflict of Interest
All authors declare that there is no conflict of interest in this work.
Funding Source
This study was funded by Council of Science & Technology, Uttar Pradesh, India.
References
- Akpoveta, O.V., Okoh B.E.,Osakwe, S.A. Quality assessment of borehole water used in the vicinities of Benin, Edo State and Agbor, Delta State of Nigeria. CurrRes in Chem,2011,3: 62-69.
CrossRef - Coulibaly A.S., Monde S., Wognin A.V., Aka K., Analyse des éléments traces métalliques (ETM) dans les baiesestuariennesd’Abidjanen Côte d’Ivoire. AfriqueSci, 2009, 5; 77 – 96
- Voorde, L. Pinoy, E. Courtijn, F. Verpoort, Influence of acetate ions and the role of the diluents on the extraction of copper (II), nickel (II), cobalt (II), magnesium (II) and iron (II, III) with different types of extractants, Hydrometallurgy, 2005, 78(1-2);92-106.
CrossRef - Shrivastava P., Saxena A., SwarupA.,Heavy metal pollution in sewage fed Lake of Bhopal, (M.P.) India. Lake ReservResMgmt, 2001,8: 1–4.
CrossRef - Kambole M.S., Managing the water quality of the Kafue River. In: Water demand management for sustainable development. 3rd water net werfsa symposium, Dare s Salaam,2002, 1–6.
- Coulibaly A.S., Monde S., Wognin A.V., Aka K.,.Dynamique des elements tracesmétalliquesdans les sédiments des baiesd’Abidjan (baie du Banco et radePortuaire). European J of Sciti. Res, 2012, 46: 204-215.
- Akpetou K.L., Kouassi A.M., Goula B.T.A., Assémian S., Aka K.Nutrients induction on lead, cadmium, manganese, zinc and cobalt speciation in the sediments of Abylagoon (Côte d’Ivoire). Intl JofEnggSciand Technol.2010,2: 3894-3900
- Heidary S.,ImanpourNamin J., Monsefrad F, Bioaccumulation of heavy metals Cu, Zn, and Hg in muscles and liver of the stellate sturgeon (Acipenserstellatus) in the Caspian Sea and their correlation with growth parameters. Iranian JofFishSci. 2012, 11(2): 325-337.
- Virha R., Biswas A.K., Kakaria V.K., Qureshi T.A., BoranaK.Malik N., Seasonal Variation in Physicochemical Parameters and Heavy Metals in Water of Upper Lake of Bhopal. Bulletin of EnvContaand Toxicol,2011,86 (2): 168-174.
CrossRef - Lalah J.O., Ochieng E.Z., Wandiga S.O., Sources of heavy metal input into Winam Gulf, Kennya. Bulletin of EnvContaandToxicol, 2008, 81: 27-284.
CrossRef - Ochieng E.Z., Lalah J.O., Wandiga S.O., Analysis of heavy metals in water and surface sediment in five Rift Valley Lakes in Kenya for assessment of recent increase in anthropogenic activities. Bulletin of EnvContaand Toxicol,2007,79: 570–576
CrossRef - Liu C., Xu J., Liu C., Zhang P., Dai M., Heavy Metals in the Surface Sediments in Lanzhou Reach of Yellow River, China. Bulletin of EnvContaand Toxicol,2009,82: 26–30
CrossRef - Davies O.A., Allison M.E., Uyi H.S., Bioaccumulation of heavy metals in water, sediment and periwinkle (Tympanoonusfuccatusvar radula) from the Elechi creek, Niger Delta. African J Biotechnol,2006,5: 968-973.
CrossRef - Canli M. &Atli G., The relationships between heavy metal (Cd, Cr, Cu, Fe, Pb, Zn) levels and the size of six Mediterranean fish species. Environm Pollution,2003,121:129-136.
CrossRef - APHA Standard methods for the examination of water and waste water. 21st ed. American Public Health 2005.
- Nizami G, Rehman S. Assessment of contamination of heavy metals and pesticides in the Kosi River in District Rampur U.P., India. J EnvironChemToxicol. 2018;2(2):60-64.
- Kumar A, Bahadur Y. Water Quality of kosi river and Rajera systemat Rampur India: Impact Assessment, J Chemistry Hindwai 2013, 4 pages
CrossRef - Yadav S.S., Kumar Rajesh, “Monitoring water quality of Kosi River in Rampur district, Uttar Pradesh Rampur”, Advances in Applied Research, 2011, 2(2): 197-201
- Ezzaouaq, Hydrodynamic, physico-chemical and bacteriological characterization of the surface waters of the Bouregreg estuary (Morocco) subjected to discharges from the cities of Rabat-Salé. Thesis D.E.S. Fac.Sci. Rabat, 2005, 140p.
- Yadav S.S., Kumar Rajesh, “Assessment of ground water pollution due to fluoride content and water quality in and around TandaTaluka of Rampur district, Uttar Pradesh, India. ChemandPharma Res, 2010, 2(4), 564-568.
- ParasharCharu, Verma N., Dixit S., Shrivastava R., “Multivariate analysis of drinking water quality parameters in Bhopal, India” Environ Moinit Assess, 2008,140,119-122.
CrossRef - APHA, Standard methods for the examination of water and wastewater, 18th edition, APHA AWWA. WPCF. (Eds) Washington DC,1998.
- NEERI, Mannual on water and waste water analysis, Nation Environmental Engg. Research, Nagpur, IN NEERI, 1987,86, xvi p.
- Zonta R, Zaggia L, Argrse E, Heavy metal and grain size distributions in estuarine shallow water sediments of the Cona Marsh (Venice Lagoon Italy). Sci Total Environ, 1994 151:19–28
CrossRef - Himmi, M,Fekhaoui, A. Foutlane, H. Bourchic, M. El Maroufy, T. Benazzout, M. Hasnaoui, Ratio ofphysicochemical parameters in a plankton basin dimaturazione (mixed lagoon BeniSlimane – Moroccohydrobiology plays Universitadegli de Perugia, Department of animal biology and ecology hydrobiologylaboratory “G.B. Fats”, 2003, 110.
- Umeobika, U.C., Ajiwe, V.I.E, Iloamaeke, M.I., Alisa, C.O.. Physicochemical analysis of rain water collected from 10 selected areas in Awka South, Anambra State, Nigeria. Intl JSciInnovand Dis, 2013, 3(1), 56-73.
- Saha K.C, Dikshit A. K, Bandyopadhyay M.A. A review of arsenic poisoning and its effect onhuman health. CritRev Environ Sci Technol. 1999;29:281–313.
CrossRef - KouaméAkpétou,Hermann1 YapiYapo,Ted-Edgar Wango,SylvieAssémian,AlexKouaJérémie , Marcel KouassiAka,Anomalistics of physical and chemical parameters variability under anthropogenic and natural conditions in the four sectors of Aby lagoon (Ebrié lagoon system, CÔte d′Ivoire),2020, 10 (1); 34-40.

This work is licensed under a Creative Commons Attribution 4.0 International License.


