Mapping of Physicochemical Properties of Groundwater Using QGIS of Bhopal District of Madhya Pradesh, India
Rajshekhar Kumar
 and Shailza Verma
1
Department of Civil Engineering,
Jabalpur Engineering College,
Jabalpur,
Madhya Pradesh
India
http://dx.doi.org/10.12944/CWE.19.1.34
Copy the following to cite this article:
Kumar R, Verma S. Mapping of Physicochemical Properties of Groundwater Using QGIS of Bhopal District of Madhya Pradesh, India. Curr World Environ 2024;19(1). DOI:http://dx.doi.org/10.12944/CWE.19.1.34
Copy the following to cite this URL:
Kumar R, Verma S. Mapping of Physicochemical Properties of Groundwater Using QGIS of Bhopal District of Madhya Pradesh, India. Curr World Environ 2024;19(1).
Download article (pdf) Citation Manager Publish History

Introduction
The primary sources of drinking water in Bhopal include the Upper Lake and the Narmada River, complemented by groundwater. Water is the basic requirements of all life on Earth. 10 Regular monitoring of groundwater quality is crucial due to its significance in the city's water supply. Once groundwater is contaminated, restoring it becomes challenging, making preventive measures essential 1. Over time, there has been a noticeable decline in groundwater quality attributed to both anthropogenic and natural factors. Anthropogenic factors, such as industrial and domestic waste disposal, agricultural runoff, etc., and natural factors, including geological formations, weathering of rocks, and mineral leaching, contribute to groundwater contamination. Improper management of water resources and environmental degradation are leading to a fresh water crisis.2,19 This decline in groundwater quality can led to serious consequences for both human health and the environment. Contaminated groundwater can pose a risk to public health by exposing individuals to harmful chemicals and pollutants. In addition, polluted groundwater can have detrimental effects on ecosystems, affecting aquatic life and vegetation. Monitoring groundwater quality through regular testing and analysis can help identify potential sources of contamination and guide remediation efforts. Groundwater is used for various purposes of domestic, agricultural and industrial water all over the world.3 According to a report of World Health Organization (WHO), almost 80% diseases are due to poor water quality consumed by human beings in the year of 2017. 1. Groundwater fulfils more than 40% of the world’s domestic water demand and around 50% of agricultural water demands. 12
In recent years, the GIS (Geographic Information System) approach, along with the IDW (inverse distance weighted) interpolation approach, is the simple and best approach for estimating and analysing spatial data.5,16 GIS allows for several sources of data integration, like satellite imagery and topographic maps, to create accurate and detailed spatial representations. These tools have revolutionized the way of handling large data, allowing more informed decision-making and effective planning. In this study to find the value of unknown points IDW interpolation has been used. The IDW interpolation method, assigns values to unknown locations on the basis of a weighted average of the known values surrounding them, making it a reliable tool for spatial data interpolation. The hydrologic operations and status of groundwater systems are intricate and challenging to comprehend without the assistance of computer tools.6,15 Together, GIS and IDW provide a powerful combination that is widely used in fields like urban planning, environmental management, and epidemiology for making informed decisions and predictions. The Geographic Information System (GIS) technology has been combined with the groundwater quality data of the Bhopal district to present the variation of ground water quality.
In the present work, QGIS Desktop 3.22.16 is employed to create the map of 11 physiochemical water quality parameters in the Bhopal district. The research involves the analysis of 47 groundwater samples, which are compared against the standards set by the BIS and IS 10500: 2012. Groundwater quality is governed by Chemical, biological and physical parameters. 4 Maps of various water quality parameters have been prepared using QGIS. These maps allows us to visually identify areas of concern and prioritize where interventions are needed to improve water quality. By examining the spatial distribution of water quality parameters, we can better target our efforts towards sustainable water management practices. A comprehensive assessment is performed using a single parameter known as the WQI, a unitless number that offers a simplified representation of the overall water quality by condensing complex water quality parameters into easily understandable information. The spatial distribution map generated in this study provides a visual representation of the variations in water quality across the Bhopal district. These maps can be used as a tool for the various water resources planning and decision making works to identify areas with poor water quality and prioritize interventions.
Study Area
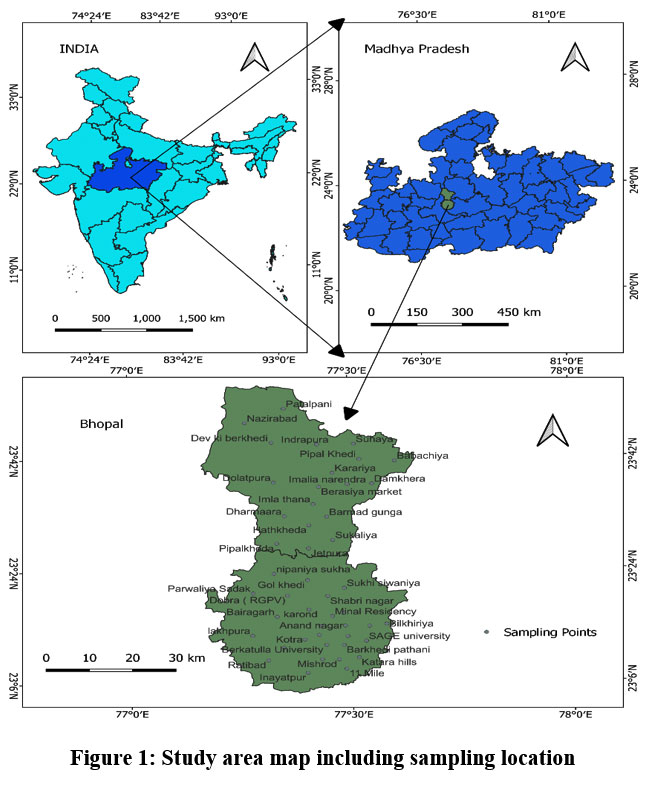
Bhopal, is a central Indian city located in the Madhya Pradesh state of India, and serves as the capital of the state. The study area spans from North latitudes 23°05'N to 22°54'N and East longitudes 77°10'E to 77°40'E, covering an approximate area of 2772 km2. According to the Survey of India Topo Sheet, Bhopal is located in Sheet No. 55 E. The district experiences an annual average rainfall of approximately 1126.7 mm. Bhopal district comprises two Tehsils (Huzur and Berasia) and two Blocks (Phanda and Berasia), as depicted in Figure 1. As per the 2011 census of India, the population of Bhopal district was recorded as 23,71,061. The topography of Bhopal district is characterized by undulating features, being part of the Malwa Plateau. The district includes two river sub-basins; the Betwa River sub-basin occupies 82% of the area, while the lower Chambal basin comprises the remaining 18%. Approximately three-fourths of the district is covered with Black cotton soil, while the remaining part is characterized by yellowish-red mixed soil.14 Notably, the Betwa and Narmada rivers are significant water bodies flowing through Bhopal.
 | Figure 1. Study area map including sampling location
|
Materials and Methodology
The methodology involves the water samples collection along with analysis, subsequently followed by the computation of the WQI to calculate the groundwater overall quality in the district. Groundwater samples are collected from several locations in the district in PET (polyethylene terephthalate) plastic bottles, before collecting the samples of water the bottles are cleaned with distilled water. These samples are tested in 5 MGD Nagar Nigam laboratory Arera Hills Bhopal. Additionally, some data were sourced from the same laboratory. The sampling locations are marked using Qfield, an open-source mobile GIS (geographic information system) app, which is based on the QGIS desktop. Qfield helps the user to add and edit features and use GPS to capture and update location information. This app facilitated the addition and editing of features, as well as the use of GPS for capturing and updating location information.
A total of 47 samples were gathered and tested, and the parameters included pH, TDS, Turbidity, Alkalinity, Electrical Conductivity, Calcium Hardness, Total Hardness, Magnesium Hardness, Chloride, Sulphate, and Iron. Geographic Information Systems are widely used tools and methods for storing, organizing, analysing, and displaying massive datasets that include information about time, space, and non-spatial attributes.9A spatial distribution map for these parameters was prepared using the Inverse Distance Weightage (IDW) technique through QGIS desktop 3.22.16, an open-source GIS software enabling the creation, editing, and visualization of geospatial data.
For the efficient management of the extensive dataset, a singular parameter, WQI, was computed. The Water Quality Index sorts water into several classifications such as excellent, good, poor, very poor, and unsuitable, depending on its numerical value. Subsequently, a correlation matrix for the water quality parameters was generated using MS Excel 2016. This matrix serves as a statistical measure, indicating the strength and direction of the linear associations among various variables. Utilizing the correlation coefficient, varies in the ranges of -1 to +1, these relationships are interpreted, with +1 signifying a perfect positive linear relationship and -1 show a perfect negative relationship.
Inverse Distance Weighted Interpolation
For the Interpolation process, the shapefile for the study area is acquired from the Survey of India website. All the sampling points have been shown on the map of study area, and data on water quality parameters were imported into the QGIS project. Utilizing the IDW (Inverse Distance Weightage) interpolation technique, a spatial distribution map was generated based on these data, as shown in figures no. 2 to 12. A groundwater quality map is an important tool for assessing the drinkability of water and as a preventive measure for identifying possible environmental health issues in any city.8, 21 In IDW interpolation, a weight is assigned to the point being measured, and this weight depends on how far away the point is from another unknown point. This technique provides a smooth visual representation of all the water quality parameters across the study area. The IDW interpolation method is particularly useful when there are limited data points available, as it estimates values for the unsampled locations based on the nearby sampled points. By assigning weightage based on distance, the interpolation ensures that points closer to each other have a stronger influence on the estimated values, providing a more accurate representation of the water quality parameter's spatial distribution. The mapping of the groundwater quality shows the variation groundwater quality of the study area.3
The expression of IDW is: -

K(Si) = The tested value of ith point

= An unknown weight for the tested value at ith point.
So = the prediction points.
n = The number of measured values.
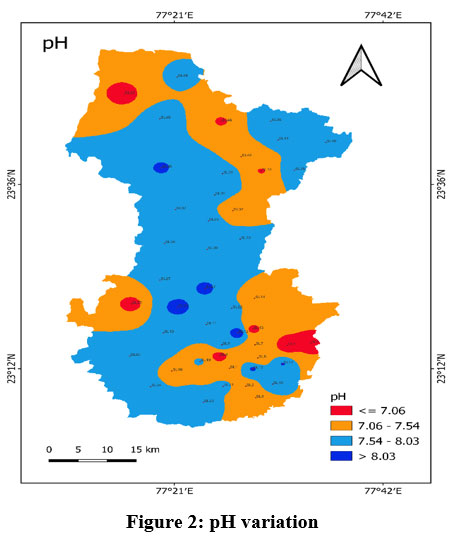
 | Figure 2: pH variation
|
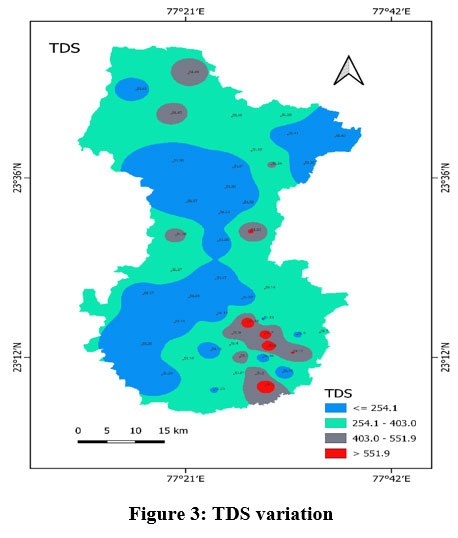
 | Figure 3: TDS variation
|
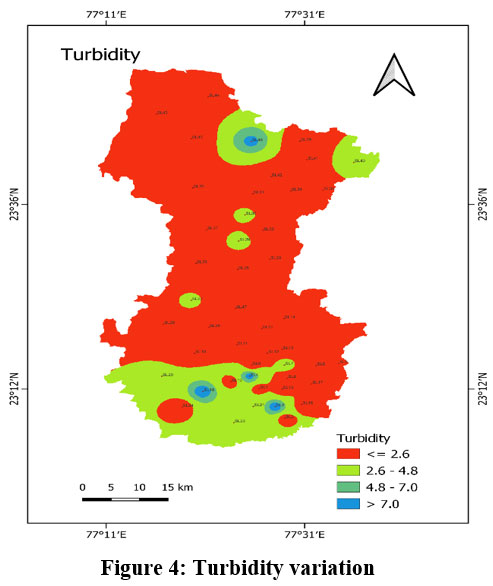
 | Figure 4: Turbidity variation
|
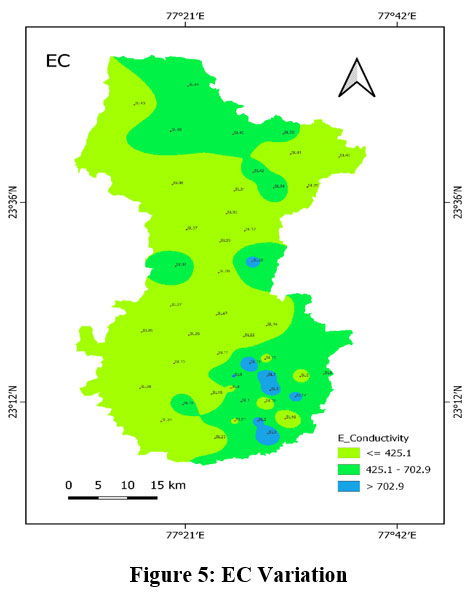
 | Figure 5: EC Variation
|
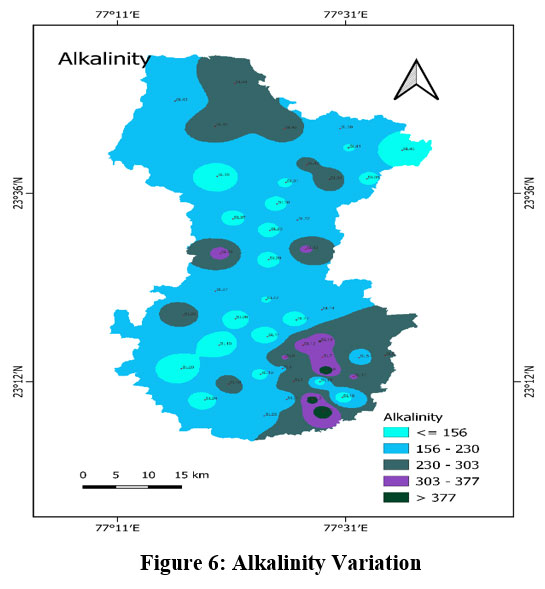
 | Figure 6: Alkalinity Variation
|
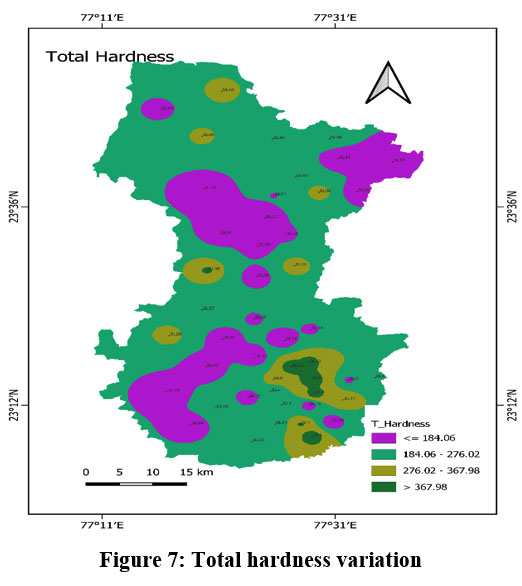
 | Figure 7: Total hardness variation
|
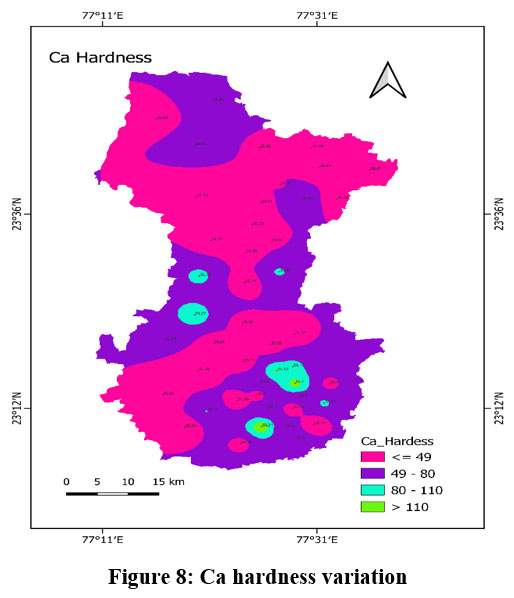
 | Figure 8: Ca hardness variation
|
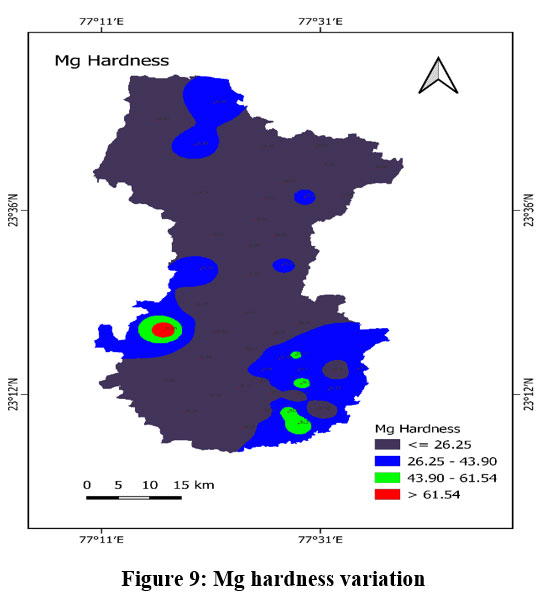
 | Figure 9: Mg hardness variation
|
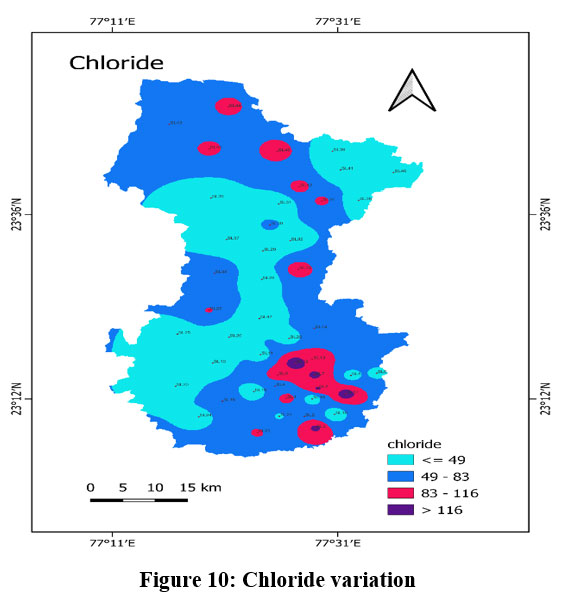
 | Figure 10: Chloride variation
|
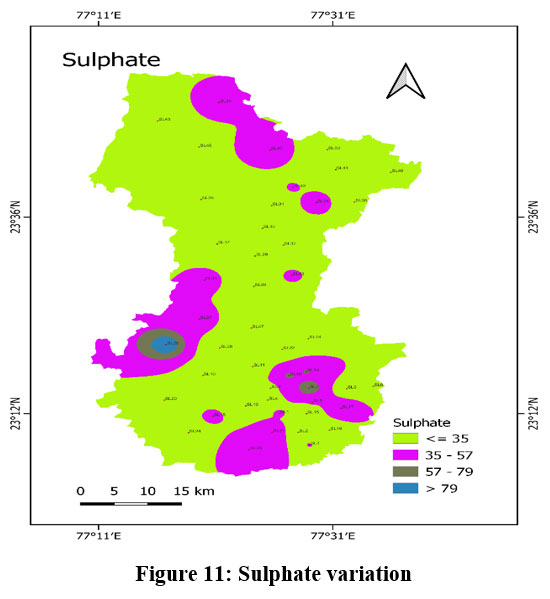
 | Figure 11: Sulphate variation
|
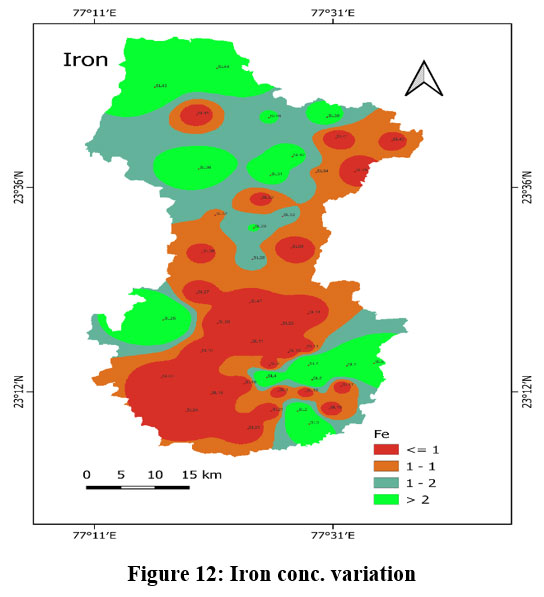
 | Figure 12: Iron conc. variation
|
Result and Discussion
The results of interpolation are shown in the figure below from figure no. 2 to Figure no. 12. The analysis of various physiochemical and interpolation results provides valuable insight into these parameters at various locations. The various water quality parameters observed for the groundwater analysis has been discussed below: -
pH
The pH is a measurement that reflects the hydrogen ions concentration (H+) in a solution, also referred to as the hydronium ion concentration (H3O+). The examination of the outcomes reveals that the pH ranges from 6.57 to 8.52, aligning with the acceptable limits prescribed by Indian standards. Figure 2 shows the variation of pH in study area.
Total Dissolved Solid (TDS)
TDS represents the concentration of all inorganic and organic substances that are present in the water sample. The analysis of data shows that the TDS varies among 105mg/l to 701mg/l, which exceeds the permissible threshold by a small margin in Mishrod,11-mile, awadhpuri, minal residency, and sukaliya area but are within the permissible limit (500mg/l to 2000 mg/l). Figure 3 shows the variation of TDS in the area of research.
Turbidity
Turbidity is defined as the extent to which light is either scattered or observed due to the existence of suspended particles in water. The analysis of data shows that the turbidity varies between 0.4 NTU to 9.2 NTU. The turbidity at certain locations is higher than the permissible limit (1.0 NTU to 5.0 NTU) in Mishrod, M.P Nagar, Neelbad and Indrapuri area. Figure 4 illustrate the variation of Turbidity in the research area.
Electrical Conductivity
It is a measure of the amount of solid substances that are dissolved in water. It is defined as the ability to conduct the electric current through the solution. The analysis of data shows that the electrical conductivity varies between 147 µS/cm to 981 µs/cm. Some areas with higher electrical conductivity than the permissible limit which shows the high dissolved mineral content. The permissible limit of electrical conductivity for drinking purposes is 750 µs/cm. Figure 5 illustrate the variation of EC in study area.
Alkalinity
Alkalinity may be defined as the ability to neutralize the H+ ion or acidity. The analysis of data shows that the alkalinity varies between 82mg/l to 451 mg/l. The alkalinity is higher than acceptable limit (200 mg/l) in Berkatulla university, mishrod, 11-miles, anand nagar, awadhpuri, minal residency, sahara bypass, Sukaliya, and pipalkhedi area. The major ions responsible for alkalinity are CO3-2, HCO3-1, and OH-1. Figure 6 shows the variation of alkalinity.
Total Hardness
The degree to which water can destroy the surfactant properties of shops is known as its hardness. The analysis of the data shows that the hardness varies between 92mg/l to 460mg/l, that is greater than the permissible limit (200mg/l) in mishrod, 11-miles, anand nagar, awadhpuri, govindpura, minal residency, sahara bypass, pipalkhedi areas. Ca+2 and Mg+2 are the major ions responsible for hardness, and the leaching of minerals into the groundwater is also responsible for the hardness of the groundwater. The hardness variation in the research area is shown in Figure 7.
Calcium Hardness
Calcium hardness primarily arises from the presence of Ca+2 ions in the water sample. In this research, the calcium ion concentration differs in the range of 19.2mg/l to 140mg/l, which is in the permissible range, as per IS 10500: 2012 the permissible range for the Calcium hardness is 75 mg/l to 200 mg/l. The variation of calcium ion concentration area is shown in Figure 8.
Magnesium Hardness
In the study area, the magnesium hardness ranges from 8.6 mg/l to 79.2mg/l. As per IS 10500: 2012 the permissible range for the magnesium hardness ranges from 30 mg/l to 100 mg/l. Therefore Magnesium hardness is also within the permissible range. Figure nine shows variation of the magnesium hardness in study area.
Chloride
The chloride in the groundwater is due to agricultural runoff and the natural weathering of rocks. The study area's chloride levels range from 16mg/l to 150mg/l, which is within the acceptable limit. As per IS 10500 the acceptable limit of chloride is 250 mg/litre and permissible range of chloride is from 250 mg/l to 1000mg/l for the drinking purpose. Figure 10 shows the fluctuation in chloride levels in the study area.
Sulphate
Sulphate in the ground water is mainly due to the agricultural practices and industrial activities. On the In the study area, the sulphate level varies from 12mg/l to 102 mg/l, which are within the acceptable range. On the outskirts of the city, agriculture is the main activity, and in the city, there are industries that may contribute to the sulphate in the groundwater. Figure 11 shows the fluctuation in sulphate levels in the study area.
Iron
The iron concentration fluctuates within the range of 0.01mg/l to 5.8mg/l. Bhopal district is a part of the Malwa plateau, which comprises the Vindhyan Hills and the Narmada Valley. The geology of the Malwa plateau plays a important role in the presence of a high iron content in the groundwater of Bhopal district. The unique geology and topography of the region ultimately influence the distribution of iron in the groundwater. Understanding how the Vindhyan Hills and Narmada Valley contribute to the hydrogeological conditions in Bhopal can help us identify potential solutions for addressing water quality issues. Figure 12 illustrates the variation in iron concentration across the study area. Table - 1. Illustrate the Statistical analysis of physiochemical parameter of all the observed water quality parameters and their standard permissible limit as per the BIS and WHO.
Table 1: Statistical study of physiochemical parameter of BIS and WHO standards
Parameters (unit) | BIS | WHO | Min. | Max. | Avg. | S.D |
pH | 6.50 - 8.50 | 7.0 - 8.0 | 6.57 | 8.52 | 7.540851 | 0.462017 |
TDS ( mg/l ) | 500 - 2000 | 600 - 1000 | 105 | 701 | 302.4043 | 180.1202 |
Turbidity ( NTU ) | 1.0 - 5.0 | 1.0 - 5.0 | 0.4 | 9.2 | 2.334043 | 2.132897 |
EC ( µS/cm ) | 750 - 3000 | _ | 147 | 981 | 422.1426 | 251.6888 |
Total Alkalinity ( mg/l ) | 200 - 600 | _ | 82 | 451 | 215.0213 | 102.8442 |
Total Hardness ( mg/l ) | 200 - 600 | 200 | 92 | 460 | 224.9447 | 110.6491 |
Ca+2 ( mg/l ) | 75 - 200 | 100 - 300 | 19.2 | 140 | 53.64426 | 29.06206 |
Mg+2 ( mg/l ) | 30 - 100 | _ | 8.6 | 79.2 | 24.02 | 15.95743 |
Cl ( mg/l ) | 250 - 1000 | 250 | 16 | 150 | 58.62298 | 40.56412 |
SO4 ( mg/l ) | 200 - 400 | 250 | 12 | 102 | 30.51064 | 19.74938 |
Fe ( mg/l ) | 0.3 | 0.3 | 0.01 | 5.8 | 1.121915 | 1.446392 |
Water Quality Index Calculation
WQI is a comprehensive index that evaluates quality of water by incorporating physical, chemical, and biological characteristics into a single index. It is a unitless number varying between 0 to 100, that is used to represent the total quality of the water and translate numerous and complex water quality variables into information which is easy to comprehend. A WQI was developed by Brown et al. (1970) by giving appropriate weights to the factors through their investigation of different water quality parameters.7Analyzing water quality metrics is crucial for routine monitoring and assessing the natural conditions. 11, 17 The calculation of WQI includes two main source, the first one is IS 10500: 2012 specification recommended BIS (Bureau of Indian Standards') and second one is the weighted arithmetic index method described by Brown and colleagues in 1972. The quality of water has an inherent relationship to the well-being of humans, the elimination of poverty, the assurance of food security, the sustainability of livelihoods, the preservation of ecosystems, as well as the acceleration of economic growth. 13, 18The BIS's recommended specifications for water quality provide a comprehensive set of guidelines that ensure the safety and suitability of water for various purposes. These specifications take into account parameters such as pH levels, Hardness, turbidity, and the presence of harmful substances like heavy metals and pathogens. By adhering to these standards, the WQI can accurately assess the overall health of a water body and identify any potential risks or issues.20, 21
Steps for the calculation of WQI
Step 1
The unit weightage factor (Wi) for each parameter is determined by utilizing equation:

Where
Zi = Standard desirable value of the nth parameter as prescribed by BIS
Summation of all the unit weight factors for selected parameters is unit i.e.

Step 2
The sub-index value or rating (Qi) is calculated by the equation:

Where,
Yo Measured value of the ith parameter.
Yi The optimal value of the ith parameter in pure H2O.
Si optimal threshold for the ith parameter.
Generally, the optimal values for all parameters are zero, except for pH and dissolved oxygen. The optimal pH value is 7, whereas the desired level for dissolved oxygen is 14.6 mg/l.
Step 3
The WQI is computed as

Water is categorized into different classes based on the calculated WQI value as follows
Table 2: Classification of WQI
| WQI | Classification |
| 0-25 | Excellent |
| 26-50 | Good |
| 51-75 | Poor |
| 76-100 | Very poor |
| >100 | Unsuitable |
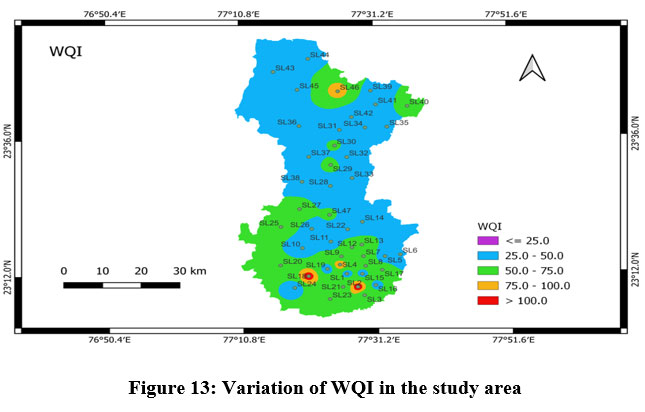
 | Figure 13: Variation of WQI in the study area.
|
Figure 13 shows the WQI variation of the study area. According to the analysis approximately 80% of the water is of good quality (26 < WQI < 50) and can be directly taken for drinking purposes without prior treatment and approx. 20% of the water is of poor category (51 < WQI < 75) and at very few points very poor (WQI >100) at sampling location 2 and 18, i.e. Hathkheda and Dev ki Barkhedi respectively. There is an urgent need to protect the water quality of these area otherwise severe health issues may occurs.
Correlation Matrix Analyssis
The correlation matrix shows the relationship among different water quality parameters and their respective weights in the calculation of the WQI. This allows for a more comprehensive and holistic evaluation of water quality, as it recognizes the varying importance of different parameters in determining the overall quality of water. The WQI is a valuable tool for water resource management and decision-making, as it provides a standardized and objective measure to compare water quality across different locations and time periods. The Correlation matrix is generated for the water quality parameters using MS Excel 2016. The various parameters considered for the correlation are pH, TDS, Turbidity, Electrical Conductivity, Total Hardness, Alkalinity, Magnesium Hardness, Calcium Hardness, Sulphate, Chloride, and Iron. The correlation coefficient (r) within the matrix denotes the direction & strength of the linear relationship among these different parameters. There is positive relation exist between EC and TDC as correlation coefficient is 0.99, i.e. if one parameter increases then the other parameter also increases in the same direction.
Table 3: Correlation Matrix analysis.
PH | TDS | Turbidity | E.C | TA | TH | Ca+2 | Mg+2 | Cl | SO4 | Fe | |
| PH | 1 | ||||||||||
| TDS | -0.15 | 1 | |||||||||
| Turbidity | -0.27 | 0.12 | 1 | ||||||||
| E.C | -0.15 | 0.99 | 0.13 | 1 | |||||||
| TA | -0.34 | 0.91 | 0.21 | 0.91 | 1 | ||||||
| TH | -0.21 | 0.89 | 0.11 | 0.89 | 0.95 | 1 | |||||
| Ca+2 | -0.06 | 0.71 | 0.11 | 0.7 | 0.66 | 0.78 | 1 | ||||
| Mg+2 | -0.35 | 0.7 | 0.11 | 0.69 | 0.85 | 0.84 | 0.5 | 1 | |||
| Cl | -0.16 | 0.88 | 0.16 | 0.88 | 0.85 | 0.85 | 0.71 | 0.62 | 1 | ||
| SO4 | -0.26 | 0.54 | 0.17 | 0.54 | 0.59 | 0.69 | 0.71 | 0.67 | 0.64 | 1 | |
| Fe | -0.31 | -0.01 | 0.06 | -0.01 | 0.14 | 0.17 | 0.02 | 0.55 | -0.08 | 0.54 | 1 |
Conclusion
The study of the groundwater parameters of Bhopal shows that the iron content is more than the standard limit as prescribed by BIS and WHO, and this is mainly due to weathering of rocks and leaching of minerals. At some places alkalinity and hardness are more than the acceptable limit but within the permissible limit, due to some agricultural and industrial activity around the area.
WQI has been calculated with the measured water quality parameters provides valuable insights on the overall quality of groundwater. According to the WQI, 80% water quality is good (26 < WQI < 50), 20% poor category (51 < WQI < 75) and at very few points severely infected that needs proper treatment before consumption. Therefore, there is a need of regular monitoring of water quality and source identification for poor water quality are very important to address the problem promptly.
Acknowledgement
The author would like to thank Dr. Shailza Verma (Associate Professor, Department of Civil Engineering, Jabalpur Engineering College, Jabalpur, M.P, India), 5 MGD Nagar Nigam laboratory Arera Hills Bhopal and everyone who helped to finish this project.
Funding Sources
There is no funding or financial support for this research work
Conflict of Interest
The authors declare no conflicts of interest, whether academic or commercial.
Author’s Contribution
Rajshekhar Kumar (Author 1) perform the experiment, analysed the data, GIS analysis and wrote the manuscript. Dr. Shailza (Author 2) Verma developed the theoretical framework and contribute to the final version of the manuscript and supervised the project.
Data Availability Statement
Total 47 sample has been analysed out of which 19 samples are analysed and remaining 28 sample data has been collected from 5 MGD Nagar Nigam laboratory. The different shapefile used in this project for the interpolation has been downloaded from survey of Indai official website.
Ethics Approval Statement
The study doesn’t involve any experiment on humans and animals.
References
- Ram A, Tiwari DS, Pandey DH, Khan D. Assessment of groundwater quality using water quality index (WQI) in Kulpahar watershed, District Mahoba, Uttar Pradesh, India. Journal of Indian Association for Environmental Management (JIAEM). 2020 Sep 30;40(3):24-38.
CrossRef - DeepChand, Khan NA, Saxena P, Goyal SK. Assessment of Supply Water Quality Using GIS Tool for Selected Locations in Delhi—A Case Study. Air, Soil and Water Research. 2022 Aug; volume 15.
CrossRef - Ilayaraja K, Ambica A. Spatial distribution of groundwater quality between injambakkam-thiruvanmyiur areas, south east coast of India. Nature Environment and Pollution Technology. 2015 Dec 1;14(4):771.
- Shukla A, Vishwakarma AK, ONO H HM. Using Quantum GIS for Real-Time Monitoring of Groundwater Quality: A Case Study of Gorakhpur City, India. Indian Journal of Science and Technology. 2021 Sep 13;14(30):2472-82.
CrossRef - Raghav A, Singh SK. Drinking water quality evaluation for groundwater of Delhi, India using GIS techniques. Ecology Environment and conservation. 2021;27.
- Nordin NF, Mohd NS, Koting S, Ismail Z, Sherif M, El-Shafie A. Groundwater quality forecasting modelling using artificial intelligence: A review. Groundwater for Sustainable Development. 2021 Aug 1;14.
CrossRef - Verma P, Singh PK, Sinha RR, Tiwari AK. Assessment of groundwater quality status by using water quality index (WQI) and geographic information system (GIS) approaches: a case study of the Bokaro district, India. Applied Water Science. 2020 Jan;10:1-6.
CrossRef - Singh P, Khan IA. Ground water quality assessment of Dhankawadi ward of Pune by using GIS. International Journal of Geomatics and Geosciences. 2011;2(2):688-703.
- Rossetto R, Cisotto A, Dalla Libera N, Braidot A, Sebastiani L, Ercoli L, Borsi I. ORGANICS: A QGIS Plugin for Simulating One-Dimensional Transport of Dissolved Substances in Surface Water. Water. 2022 Sep 13;14(18):2850.
CrossRef - George GK, Akhilasree DG, Lakshmi Chandran M, Reshma PR, Siga G. Study of ground water pollution around an industry using GIS. International Journal of Civil and Structural Engineering Research. 2015,
- Mulani SJ, Babar KS, Patil RS, Rasanka DA, Mathane RS, Patil RC, Hangande AB. Review on Krishna River Water Quality Assessment from BAHE to MASUCHIWADI using QGIS Software. International Research Journal of Innovations in Engineering and Technology. 2021 Jun 1;5(6):118.
- Duarte L, Espinha Marques J, Teodoro AC. An open source GIS-based application for the assessment of groundwater vulnerability to pollution. Environments. 2019 Jul 21;6(7):86.
CrossRef - Jha MK, Shekhar A, Jenifer MA. Assessing groundwater quality for drinking water supply using hybrid fuzzy-GIS-based water quality index. Water Research. 2020 Jul 15;179.
CrossRef - Tiwari, V. and Chatterjee, A., 2022. Application of Artificial Neural Network in Master Planning—A Case of Simulating the Land Use and Land Cover Changes in Bhopal. In Smart Master Planning for Cities: Case Studies on Digital Innovations pp. 83-108.
CrossRef - Machiwal D, Cloutier V, Güler C, Kazakis N. A review of GIS-integrated statistical techniques for groundwater quality evaluation and protection. Environmental Earth Sciences. 2018 Oct;77(19).
CrossRef - Swain S, Sahoo S, Taloor AK. Groundwater quality assessment using geospatial and statistical approaches over Faridabad and Gurgaon districts of National Capital Region, India. Applied water science. 2022 Apr;12(4).
CrossRef - Aigberua A, Tarawou T, Erepamowei Y. Environmental assessment of Imiringi River in South-South Nigeria: the water quality index approach. Current World Environment. 2020;15(1):59.
CrossRef - Bhaskar CV, Nagendrappa G. A comparative study of ground water quality and water quality index of certain selected areas situated around Tumkur city, Karnataka. Current World Environment. 2008;3(1).
- Pandey HK, Gakhar S, Chawla G. The impact of agriculture on ground water quality of Canal area, Bikaner. Current World Environment. 2006;1(1).
CrossRef - Sharma A, & Tiwari D. Monitoring of ground water quality in Mandideep industrial area, Bhopal (India). Current World Environment.2008; 3(1).
CrossRef - Rajendran R, Emerenshiya CA, Dheenadayalan MS. Investigations on groundwater quality in Tiruchirappalli city, Tamilnadu, India. Sustainable Water Resources Management. 2019 Jun.
CrossRef


