Forest Dependent Communities and Forest Degradation in Thiruvananthapuram, South-India
Midhun Manohar
*
 and Rubeena T. A
1
Department of Geography,
University College (University of Kerala),
Palayam, Thiruvananthapuram,
Kerala
India
http://dx.doi.org/10.12944/CWE.18.1.34
Copy the following to cite this article:
Manohar M, Rubeena T. A. Forest Dependent Communities and Forest Degradation in Thiruvananthapuram, South-India. Curr World Environ 2023;18(1). DOI:http://dx.doi.org/10.12944/CWE.18.1.34
Copy the following to cite this URL:
Manohar M, Rubeena T. A. Forest Dependent Communities and Forest Degradation in Thiruvananthapuram, South-India. Curr World Environ 2023;18(1).
Download article (pdf) Citation Manager Publish History

Introduction
The forest resource extraction and forest conservation has been two contrasting but the most discussing topic of late. The direct and indirect benefits of forests as life supporting system have made it an invaluable natural resources. However, we live in an period of accelerated ecosystem deterioration, increasing the need for ensuring global participation in guarding forest ecosystems.1 Apart from climate change and associated problems, the anthropogenic activities have directly and indirectly affect the quality and quantity of global forest ecosystem. The forest degradation begins at low pace and in limited regions but with time, it increase with increasing population and pressure on forest lands. Most forest disturbances occur at small spatial scales, and regional patterns evolve over long periods.2,3 The activities of people, who directly use forest products and services for the survival can cause deterioration of forest ecosystem. The indigenous tribal communities living within the forest and non-triabal native population living in the forest fringe are the direct beneficiaries of forest services and so they can be termed as 'forest dependent people'. The impact of these people on forest resources needs to be studied for deriving proper forest conservation strategies. In India, there is high concentration of tribal people within the forest and the rural population along the forest fringes.4 They usually exert severe pressure on forest ecosystem, but the extent of degradation caused by these two groups are different, which is being analysed in the present study. It estimates the spatio-temporal changes in forest cover in Thiruvananthapuram by using remote sensing and Geographic information system and thereby examine forest degradation rate as a product of interaction with the forest dependent people. The study analyses the extent of relationship between Tribal Population Size (TPS) and Rate of Forest-cover Changes (RFC) in Thiruvananthapuram district. The growth of tribal population is one among the primary reason of deforestation.5 Hence TPS is used as an indice to estimate the extend of influence of tribals on forest degradation. The relationship between RFC[1] and Forest Dependency Ratio (FDR) of non-tribal rural population inhabiting the forest fringe is also analysed to determine the level of forest degradation caused by them. Estimation of forest dependency of any community will help in designing strategies for forest conservation.6 The results of the study would help in comparing the impact of tribals and non-tribal local population on forest ecosystems and would encourage the future researches in the same field. Results of the present study would help the policy makers in designing region specific forest conservation strategies within the forest and along the forest fringes.
Review of Literature
Forest is the large area or enclave dominated by various types of trees, plants and animals7, which determine the livelihood, environmental stability, and societal development8 and supply various ecosystem services9 such as global climate regulation, habitat provision, water and soil conservation, biodiversity preservation, and carbon sequestration.10,11 Forests are source of timber products, a home for tribals, carbon storage sink and many other ecosystem services.12 It also promote mental and physical health for humans by reducing stress.9 Hence the forest conservation and socio-economic refinement of forest relying people are essential.13 Deforestation is one of the most pressing global environmental issue at present14 and the forest depletion rate in India is much higher.15 The term “forest-dependent people” indicate those people who reap profits from forests16 and include both Tribals living within the forest and local population living along forest fringes. The carrying capacity of forests , and the rate of human interaction on forest ecosystem is a product of geographical relationship between mankind and forests.17 Most tribals live within the forest and depend on the forest for their livelihood.18 They are residing on their ancestral lands from times immemorial and are integral part of the forest eco-systems19and live a life in harmony with the nature. Land use modifications alter land cover and vegetation, destruct forest cover.20 Increased forest dependence of tribals results in exploitation of forest resources.5 The rural population living in close proximity to the forest boundaries are another class of forest dependent people. The success of forest conservation depends on the cultural aspects of residing population and through their agile partaking in forest guardianship.21 Human activities can cause land salinisation and adversely affect agricultural yields.22 Forest degradation is a leading cause for global environmental change.23 Estimating changes in forest cover and its driving factors are very difficult due to insufficient field data during different time periods and relatable aerial data.24 The alterations in forest cover is quantified by evaluating topographical maps and present day data systems.25 Remote sensing (RS) and geographic information system (GIS) helps in attaining reliable geographical data.26 Mapping the spatial relationship between forests and the people who live in and around them is an important part of understanding the nature of these relationships between forests and people.16,17 RS[2] techniques using satellite images are the most effective for mapping of forest areas and its changeover time27 and it is largely confined to the era of Landsat satellites, from 1972 to present.28 Evaluation of satellite data of different time period helps in adjudging rate of forest cover changes.29 in GIS, besides the reduction of geographical data5, the driving factors leading to the biodiversity loss in risk zones can be studied.30
Materials and Methods
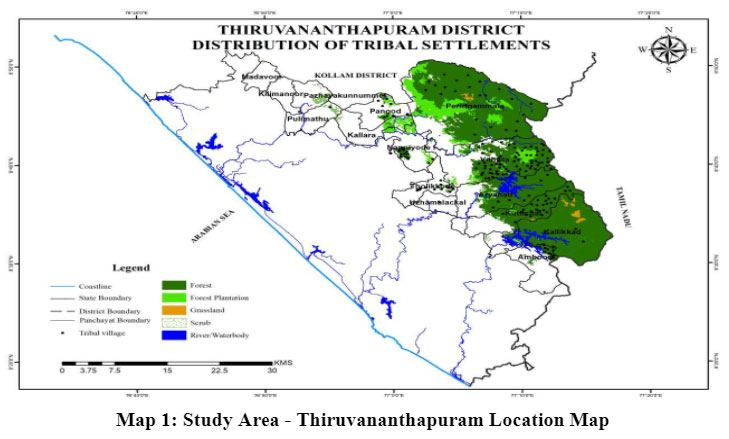
The study is conducted in Thiruvananthapuram district, the southernmost district in Kerala, India. The hilly eastern side of the Thiruvananthapuram District is covered by dense forest tracts falls within Agasthyamalai Biosphere Reserve. The forests in the Panchayat is distributed in about 13 panchayats located along the eastern border of the district. The forests in Thiruvananthapuram are mainly conserved under three Wildlife Sanctuaries (WS) namely Neyyar WS, Peppara WS, and Agasthyavanam Biological Park (AVBP). Forests are the main source region for all the major rivers flowing through the district. Kanis are the prominent tribal group living in and around the forests of Thiruvananthapuram district. They are mostly forest dwellers, and only a few are settled outside the forest premises. They are numerous in 5 panchayats namely Amboori, Kallikadu, Kuttichal, Vithura and Peringamala.
 | Map 1: Study Area - Thiruvananthapuram Location Map
|
Source: Kerala State Land Use Board
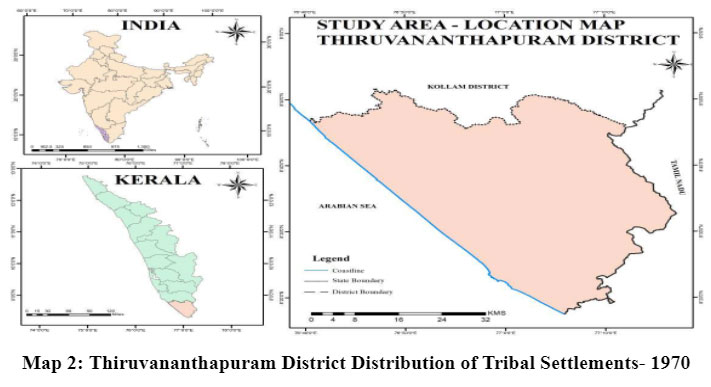
 | Map 2: Thiruvananthapuram District Distribution of Tribal Settlements- 1970.
|
Source: Kerala State Land Use Board
Both primary data and secondary data were collected and recorded during December 2021 and April 2022. The secondary data for the study includes base maps, census data and other basic demographic statistics. They were collected from various government departments. The primary data was collected by conducting structured questionnaire survey, interviews and field observations. The samples for questionnaire survey were randomly selected from the forest dependent population comprising tribals living within forests and rural population living along the forest fringe. The data on panchayatwise tribal population and number of settlements were extracted from the Government of India, Census Survey Handbook, 2011.
To satisfy the first objective of the study, base maps collected from various sources were georeferenced. The toposheets (toposheets no: 58A/2 1970) was collected Survey of India, Thiruvananthapuram and Landsat-8 images (2012, 2022) of the study area with suitable spatial and temporal resolution (censor: OLI[3], band no: 1-9) were availed from Google Earth explorer website. Landuse and land cover maps for forested region in Thiruvananthapuram district during the years 1970, 2012 and 2022 were created using ArcGIS software. Using these maps the spatio-temporal changes in Forest cover was evaluated. With the help of 'Calculate Geometry' tool in ArcGIS software, the panchayatwise spatial distribution of the forest areas were calculated and tabulated. The average rate of temporal forest cover changes are evaluated and are recorded in tables. The areas of rock outcrops, water bodies and tribal agricultural land and settlements within forest boundary are exempted from measurement since the human interventions are minimal in these regions.
To analyze the nature of relationship between RFC and TPS[4], both RFC and TPS are estimated using mathematical methods. RFC refers to the average annual rate of forest cover change (the term is previously used by Meyer A L, 2003)31 in the study area. It is estimated as follows;
RFC = [RFC1 + RFC2] ÷ 2
RFC1 is the average annual rate of forest cover change31 during 1970 to 2012 and RFC2 is the average annual rate of forest cover change31 during 2012 to 2022 in the study area (temporal scale is selected based on the study conducted by Jada E. K, 2021)32
.Then RFC is determined as the average of RFC1 and RFC2.
RFC1 is calculated as follows;
RFC1 = Total forest cover change during 1970 to 2012 ÷ 42
Here 42 is the total number of years during 1970 to 2012.
Similarly, RFC2 is calculated as follows;
RFC2 = Total forest cover change during 2012 to 2022 ÷ 10
Here 10 is the total number of years during 2012 to 2022.
TPS refers to the proportion of tribal population living within the forests of each Panchayat in the district. When TPS increase, the forest-man interaction also increases since the tribals are inhabiting within the forest ecosystem. It is calculated by dividing number of tribals living within the forests of each Panchayat and the total number of tribals living within the forests of the Thiruvananthapuram district.
TPS = Number of tribals living within forests in each Panchayat ÷ Total Tribal Population living within the forests of Thiruvananthapuram district.
Here 15122 is the total number of tribals living within the forests of Thiruvananthapuram district. The number of tribals living outside forest boundary were not considered for the study.
To find out the nature of relationship between RFC and FDR[5], the forest dependency of non-tribal rural population living along the forest boundary in each panchayat was calculated using scoring method (refer table:1). About 30 sample households from each panchayat were randomly selected from non-tribal rural population living within 1 Km buffer zone of the forest boundary. The dependency of inhabitants to five factors namely food products, housing material, fuel wood, livestock fodder and medicinal plants were selected for assigning scores. These factors are the most exploiting forest products throughout the world and increased dependence on forest for these factors could lead to forest degradation. Hence these five parameters were selected for quantifying forest dependence of people inhabiting forest fringe. The samples who depend on forest for all these five factors, were assigned the highest score of five, whereas those who don't depend on forest for any of these factors are assigned the lowest score of zero. The FDR is calculated as follows;
FDR = Total Score of 30 samples ÷ Maximum Possible Score for the 30 samples
Here Maximum Possible Score is 150 for 30 samples (only achieved if all the 30 samples score highest score of five)
The nature of relationship between RFC and FDR was evaluated using Pearson's Correlation method.
Table 1: Scores for deriving FDR
SCORES FOR DERIVING FDR | |||||
Score : 5 | Score : 4 | Score : 3 | Score : 2 | Score : 1 | Score : 0 |
Depend on forest for at least five commodities (Food products, Housing material, Fuel wood, Livestock fodder, medicinal plants) | Depend on forest for any four commodities | Depend on forest for any three commodities | Depend on forest for any two commodities | Depend on forest for only one commodity | Never Depend on forest for any commodity |
Source: The Author
Findings
Temporal Forest Cover Changes in Thiruvananthapuram District
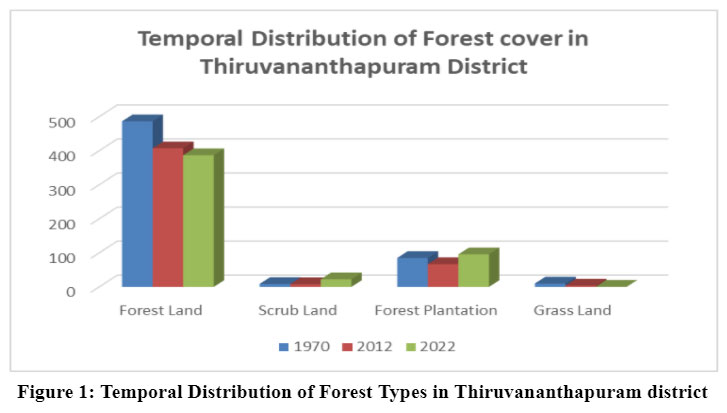
In 1970, total area under forest cover in the district was 486.58 Km2. Apart from forests (which include both open and dense forest) 8.89 Km2 area was Scrubland, 85.18 Km2 area was under Forest Plantation and 10.12 Km2 area was Grasslands. In 2012, about 42 years from 1970, the total forest cover in the district was reduced to 407.23 Km2. During this period, 79.35 Km2 of forests were lost. During the same year, the area under scrubland was 8.18 Km2, which is about 0.71 km2 less than the area in 1970. The area under forest plantation also showed a decline of 85.18 km2 in 1970 to 67.08 Km2 in 2012 with a loss of about 18.1 Km2. The grassland also shows considerable deterioration during this period. The area under grasslands was only 3.92 km2 in 2012, which indicate a loss of about 6.2 Km2 since 1970.
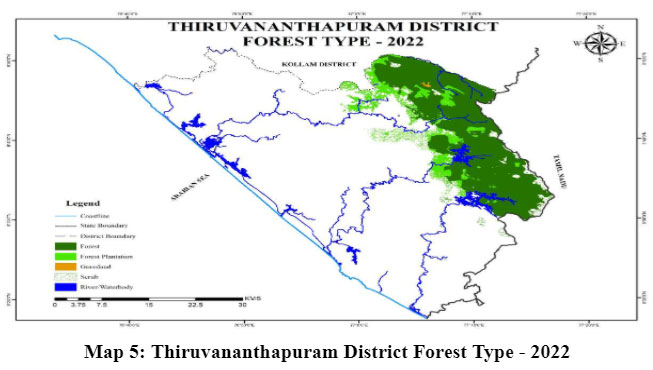
From 2012 to 2022, the area under forest cover continued to exhibit a declining trend. In 2022, the total area under forest cover is 386.97 Km2, which is 20.26 km2 less than the area under forest in 2012. However the area under both scrubland and forest plantation shows an increasing trend from 2012 to 2022. The area under scrubland shows an increase of about 14.43 km2 whereas the area under forest plantation shows an increase of 28.76 km2. But the grasslands continued to diminish and the area under grassland was only about 0.81 km2 in 2022. The temporal changes is listed in table: 2 and shown in figure: 1. The forest cover distribution of the district for the year 1970, 2012, and 2022 are plotted in Map:3, Map:4 and Map:5 respectively.
Table 2: Temporal distribution of Forest Types in Thiruvananthapuram district
Forest Category | Total Area in Km2 | ||
1970 | 2012 | 2022 | |
Forest Land | 486.58 | 407.23 | 386.97 |
Scrub Land | 8.89 | 8.18 | 22.61 |
Forest Plantation | 85.18 | 67.08 | 95.84 |
Grass Land | 10.12 | 3.92 | 0.81 |
(Source: Landsat images)
.jpg) | Figure 1: Temporal Distribution of Forest Types in Thiruvananthapuram district
|
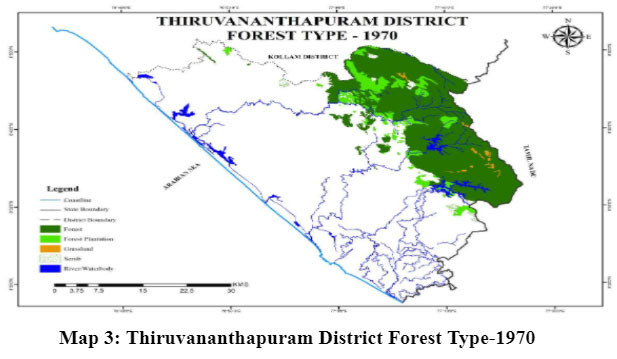
 | Map 3: Thiruvananthapuram District Forest Type-1970.
|
Source: Landsat images
 | Map 4: Thiruvananthapuram District Forest Type - 2012.
|
Source: Landsat images
 | Map 5: Thiruvananthapuram District Forest Type - 2022.
|
Source: Landsat images
Spatial Distribution of Forest Cover in Thiruvananthapuram District
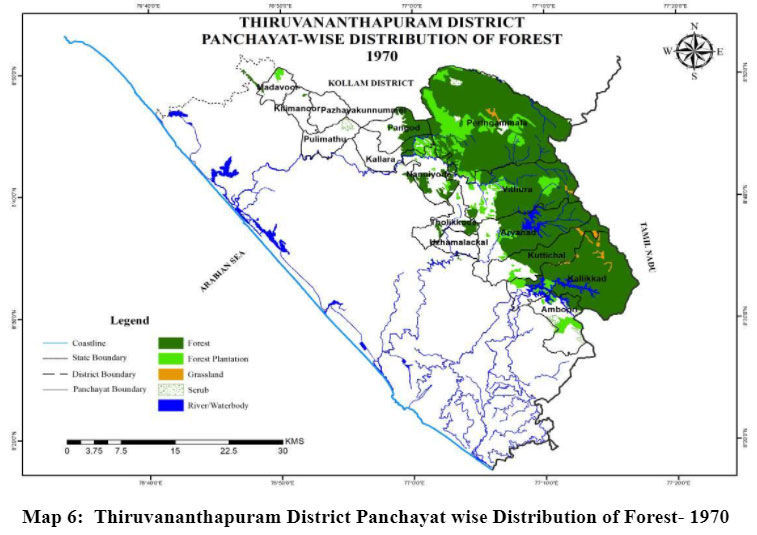
In 1970, the forest cover in the district falls within the political jurisdiction of 13 panchayats. The Peringamala panchayats had the largest area under forest cover with an area of 180.85 Km2 followed by Kallikad panchayat (97.59Km2), Vithura (75.49 Km2) and Aryanad (57.24 Km2). The scrubland was only seen in 3 panchayats namely Amboori (3.03 Km2), Peringamala (4.23 Km2) and Pulimath (1.63 Km2). The forest plantation was distributed along 12 panchayats in which Peringamala Panchayat (42.53 Km2) had the highest share, followed by Vithura (14.80 Km2) and Amboori (6.25 Km2). The grasslands were found in 5 panchayats in which Kallikadu Panchayat (6.38Km2) had the largest share followed by Kuttichal (1.52 Km2).
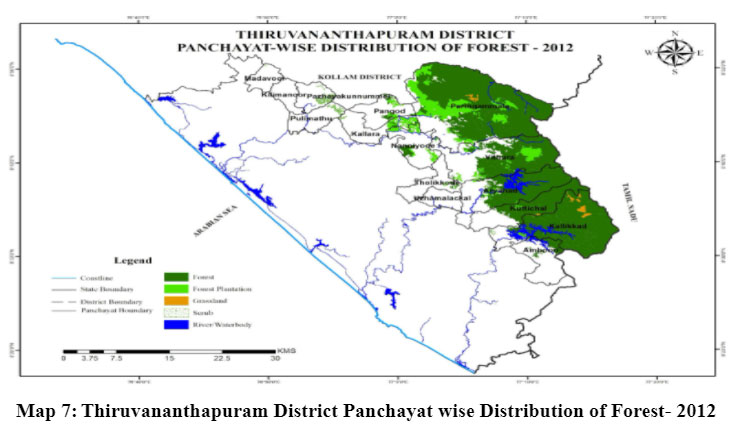
In 2012, the forest cover in the district fell within the political jurisdiction of 10 Panchayats. The Peringamala Panchayat had the largest area under forest cover with an area of 150.80 Km2, followed by Kallikad panchayat (88.63 Km2), Vithura (61.61Km2) and Aryanad (51.46 Km2). The scrubland was seen in 6 panchayats. Apart from Amboori, Peringamala and Pulimath, the scrubland was found in three more Panchayats (Kallikadu, Aryanad and Pazhayakunnumel), where scrublands were absent in 1970. The forest plantation was found in 11 panchayats in which Peringamala Panchayat (36.25 Km2) had the highest share of area. During the same period, the forest plantation in Uzhamalakkal Panchayat was completely lost. The number of Panchayats having share of grasslands decrease from 5 panchayats in 1970 to 3 panchayats in 2012. The grasslands in Aryanad and Vithura Panchayat were completely lost.
In 2022, forest cover is found only in 8 Panchayats. The forest cover in Tholikode and Pangode Panchayat were completely lost during the period from 2012 to 2022. Peringamala has the largest area under forest cover with an area of 150.80 Km2, followed by Kallikadu (88.63 Km2) and Vithura (61.61 Km2). During this period, the number of Panchayats having scrublands increased to seven. The scrubland in Pazhayakunnumel and Pulimath was completely lost during this period. However scrublands are newly formed in three other panchayats namely Kuttichal, Vithura and Kallara. The forest plantations are seen in 10 panchayats in which Peringamala (37.78 Km2) has the largest share of area followed by Vithura (16.97 Km2) and Aryanad (15.44 Km2). However forest plantation in Madavoor was completely lost during the period. The distribution of grasslands in the district shows a steep decline during this period. They were only seen in Peringamala Panchayat. The panchayatwise distribution of forest types is listed in table: 3 and spatio-temporal changes of forests in 1970, 2012 and 2022 is clearly evident from Map: 6, 7 and 8. The field survey with the help of local tribal community, identified about 46 trees species belonging to 22 families in the study area during 2022. Among them, about 9 species are from Fabaceae family, 4 species each from combretaceae, Dipterocarpaceae and Euphorbiaceae. The most abundant and widely distributed tree species in the region are Lophopetalum wightianum, Holigarna arnottiana, Terminalia bellrica, Aporosa lindleyna and Careya arborea. According to the local tribal head, the floral species present in the area are more than 50 years old, and there is not any significant change in floral composition structure from 1970 to present. However local people have identified the presence of saplings of certain plantation trees like tectona grandis and accacia species in the inner forest areas, which affirms the intrusion of exotic plantation trees within the forest area.
Table 3: Panchayatwise Temporal Forest Cover Changes
Name of Panchayat | Forest Cover (Km2) | Scrub Land (Km2) | Forest Plantation. (Km2). | Grassland (Km2) | ||||||||
YEARS | YEARS | YEARS |
| |||||||||
1970 | 2012 | 2022 | 1970 | 2012 | 2022 | 1970 | 2012 | 2022 | 1970 | 2012 | 2022 | |
Pazhayakunnumel | 0 | 0 | 0 | 0 | 2.20 | 0 | 0 | 0 | 0 | 0 | 0 | 0 |
Amboori | 5.81 | 5.28 | 5.10 | 3.03 | 0.51 | 1.99 | 6.25 | 0.11 | 0.07 | 0 | 0 | 0 |
Kallikkad | 97.59 | 91.95 | 88.63 | 0 | 1.30 | 15.06 | 5.07 | 3.88 | 2.42 | 6.38 | 2.88 | 0 |
Kuttichal | 38.13 | 36.56 | 33.17 | 0 | 0 | 0.01 | 2.10 | 1.47 | 5.51 | 1.52 | 0.01 | 0 |
Aryanad | 57.24 | 51.46 | 49.92 | 0 | 0.63 | 1.32 | 3.82 | 1.59 | 15.44 | 0.02 | 0 | 0 |
Uzhamalakkal | 0.10 | 0 | 0 | 0 | 0 | 0 | 0.04 | 0 | 0 | 0 | 0 | 0 |
Tholikode | 4.63 | 0.97 | 0 | 0 | 0 | 0 | 0.60 | 0.39 | 0.90 | 0 | 0 | 0 |
Vithura | 75.49 | 61.61 | 58.80 | 0 | 0 | 0.31 | 14.80 | 9.72 | 16.97 | 1.01 | 0 | 0 |
Nanniyode | 11.37 | 2.48 | 0.03 | 0 | 0 | 0 | 4.05 | 5.62 | 4.36 | 0 | 0 | 0 |
Peringamala | 180.85 | 154.77 | 150.80 | 4.23 | 0.93 | 3.40 | 42.53 | 36.25 | 37.78 | 1.19 | 1.03 | 0.81 |
Pangode | 10.71 | 1.31 | 0 | 0 | 0 | 0 | 0.63 | 2.59 | 7.17 | 0 | 0 | 0 |
Kallara | 4.20 | 0.84 | 0.52 | 0 | 0 | 0.52 | 3.62 | 5.42 | 5.22 | 0 | 0 | 0 |
Pulimath | 0 | 0 | 0 | 1.63 | 2.61 | 0 | 0 | 0 | 0 | 0 | 0 | 0 |
Kilimanoor | 0.19 | 0 | 0 | 0 | 0 | 0 | 0 | 0 | 0 | 0 | 0 | 0 |
Madavoor | 0.27 | 0 | 0 | 0 | 0 | 0 | 1.67 | 0.04 | 0 | 0 | 0 | 0 |
Total Area (Km2) | 486.58 | 407.23 | 386.97 | 8.89 | 8.18 | 22.61 | 85.18 | 67.08 | 95.84 | 10.12 | 3.92 | 0.81 |
Source: Landsat images
 | Map 6: Thiruvananthapuram District Panchayatwise Distribution of Forest- 1970.
|
Source: Landsat images
 | Map 7: Thiruvananthapuram District Panchayat wise Distribution of Forest- 2012.
|
Source: Landsat images
 | Map 8: Thiruvananthapuram District Panchayat wise Distribution of Forest- 2022
|
Source: Landsat images
Panchayat wise RFC in Thiruvananthapuram District
The determination of RFC shows that, the forest cover in all panchayats in the district continue to decrease with time. The Peringamala Panchayat has the highest RFC of 0.508. This means that the forest in Peringamala degrade at a rate of 0.508 Km2 per year. The other panchayats having higher RFC are Vithura (0.305), Kallikadu (0.233) Nanniyode (0.228), Kuttichal (0.188) and Pangode (0.177). At the same time, Uzhamalakkal panchayat has the least RFC of 0.001. The other panchayats having lesser RFC are Kilimanoor and Madavoor. However in these three Panchayats area under forest cover in 1970 were scanty and are completely absent in 2022. The Panchayatwise RFC of Thiruvananthapuram district is listed in Table: 4.
Table 4: Panchayatwise RFC in Thiruvananthapuram District
Name of Panchayat | Rate of change of forest cover31 from 1970 to 2012 | RFC1 | Rate of change of forest cover31 from 2012 to 2022 | RFC2 | RFC |
Amboori | 0.53 | 0.012 | 0.18 | 0.018 | 0.015 |
Kallikkad | 5.64 | 0.134 | 3.32 | 0.332 | 0.233 |
Kuttichal | 1.57 | 0.037 | 3.39 | 0.339 | 0.188 |
Aryanad | 5.78 | 0.137 | 1.48 | 0.148 | 0.142 |
Uzhamalakkal | 0.10 | 0.002 | 0 | 0 | 0.001 |
Tholikode | 3.66 | 0.087 | 0.97 | 0.097 | 0.092 |
Vithura | 13.88 | 0.330 | 2.81 | 0.281 | 0.305 |
Nanniyode | 8.89 | 0.211 | 2.45 | 0.245 | 0.228 |
Peringammala | 26.08 | 0.620 | 3.97 | 0.397 | 0.508 |
Pangode | 9.4 | 0.223 | 1.31 | 0.131 | 0.177 |
Kallara | 3.36 | 0.079 | 0.32 | 0.032 | 0.055 |
Kilimanoor | 0.19 | 0.004 | 0 | 0 | 0.002 |
Madavoor | 0.27 | 0.006 | 0 | 0 | 0.003 |
Source: Landsat images
Relationship between RFC and TPS
The TPS value indicates the proportional value of tribal population in a panchayat, evaluated according to the 2011 census data. The Vithura Panchayat has the highest TPS value of 0.258, followed by Peringamala (0.176), Tholikode (0.160) and Nanniyode (0.103). The three panchayats have TPS value of 0, since there is no tribal population. The Pearson's Correlation coefficient derived for RFC and TPS shows a value of +0.68. This clearly shows that, changes in forest cover of any panchayat in Thiruvananthapuram district has a strong positive relationship with the tribal population size of the respective Panchayat. In other words, the forest degradation shows an increasing trend with increasing number of tribals. The panchayatwise distribution of RFC, FDR, TPS values of Thiruvananthapuram district are shown in Table: 5.
Table 5: panchayatwise RFC, TPS and FDR
Name of Panchayats | RFC | FDR | TPS |
Amboori | 0.015 | 0.161 | 0.082 |
Kallikkad | 0.233 | 0.782 | 0.03 |
Kuttichal | 0.188 | 0.623 | 0.079 |
Aryanad | 0.142 | 0.721 | 0.032 |
Uzhamalakkal | 0.001 | 0 | 0.003 |
Tholikode | 0.092 | 0.602 | 0.16 |
Vithura | 0.305 | 0.823 | 0.258 |
Nanniyode | 0.228 | 0.683 | 0.103 |
Peringammala | 0.508 | 0.882 | 0.176 |
Pangode | 0.177 | 0.681 | 0.071 |
Kallara | 0.055 | 0.360 | 0 |
Kilimanoor | 0.002 | 0 | 0 |
Madavoor | 0.003 | 0 | 0 |
Source: Questionnaire survey, Census survey, 2011
Relationship between RFC and FDR
The FDR value indicates the rate of forest dependency of non-tribal rural population living along the boundaries of the forest. The higher FDR value indicates a higher dependency on forest resources. The Peringamala panchayat has the highest FDR of 0.882, followed by Vithura (0.823), Kallikad (0.782), Aryanad (0.721) and Nanniyode (0.683). The three Panchayats have FDR of 3, since there is no forest area at present. The tribals of these panchayats are currently living in non-forested areas. The Pearson's Correlation coefficient derived for RFC and FDR shows a value of +0.84. This clearly shows that the pace of changes in forest cover of any Panchayat of Thiruvananthapuram district has a strong positive relationship with the forest dependency of non-tribal rural population living along the forest fringes. This confirms that the activities of non-tribals living along the forest boundaries have a crucial role in forest degradation in the district. The Correlation coefficient between RFC and TPS is comparatively lower (+0.68) than the correlation coefficient between RFC and FDR (+0.84), which indicates that the activities of non-tribal rural population exert comparatively much more pressure on forest than the tribals inhabiting the forests in Thiruvananthapuram district. The comparison of RFC, FDR and TPS is shown in figure 2.
 | Figure 2: Comparison of RFC, FDR and TPS
|
Source: Questionnaire survey, Census survey, 2011
Comparison with other studies
The study points out that a large number of people living within and along the fringes depend of forest for their survival, which was stated earlier by Firdoz in 2005, who identified forest as the main source of livelihood for about 100 million forest dwellers.33 According to the study conducted by Damodaran in Wayanad district of Kerala, the restrictive forest policies and unscientific development policies have lead to natural resource conflicts involving tribal communities.34 The present study quantifies the direct factors (tribal population and forest dependence of rural population living in forest fringe) influencing the forest covee loss. Similarly, Bishop, JT in 1999 affirmed that the direct uses of forest are most easy to quantify.35 The rate of forest cover shows a strong correlation with increasing tribal population. The cultural diffusion of tribals make them exploiters of natural resources. It was affirmed by Wood C in 1992. According to him, development and infrastructure advancement would lead to cultural diffusion among tribal communities which would inturn leads to social conflicts.36 But increasing tribal population is not the only cause for unabated deforestation but their changing attitude towards the forest is major factor for the deforestation in the district.4 The study points out that, rural population living in forest fringes were highly dependent of forest thereby exerting pressure on forest lands. Damania et al in 2018, analysed the people of Madhya Pradesh and Chhattisgarh in India, it was found that 30% of the economically backward rural population inhabiting forest fringes earn their living from forest products and they completely depend on forest during the period of crisis.37 The study recommend for the designation of inhabited forest fringe as protection zones to reduce the exploitation of inhabitants. Similarly, Myers in 2000, suggested the provision of protected areas as the main step to reduce deforestation which is made in practice through biodiversity conservation.38 According to Kumari et al in 2019, deforestation negatively influnce the ecosystem functions, which in turn affect the lives of forest dependent people.14 The sustainable management of forest should treat economy as a part of the society, which itself is a component of the environment. This is affirmed by Chakravarty in 2012, who state that ecology, economy and society should be sustainably treated to adopt sustainable forest development practices.39
Discussions
The forest cover change in all the panchayats shows clearly declining trend over the decades. The rate of forest cover loss from 2012 to 2022 is higher than rrate of loss of forest cover from 2012 to 2022, which shows that there is an accelerated forest degradation during the last decade. The area under scrubland and forest plantations shows a considerable increase during the last decade. The reason for the conversion of forest area into scrubland has to be identified, though the human interventions and climatic changes are the main reasons. The activated afforestation during 1980's has improved the existence of forest plantation in the district, and the area under forest plantation has shown a rapid increase during the last decade. However, the forest plantations located along the forest fringes has adversely affected the quality and quantity of forest ecosystem. The study clearly shows that the forest plantations has intruded to the forest areas during the last decade. This can be a possible reason for accelerated forest loss in near future since these exotic trees could combete with the endemic flora and thereby eliminating the later. Hence it is high time to introduce government interventions for managing forest plantations and to demarcate their boundaries. The human interventions are identified as one of the key driving force for forest degradation in the region. The study shows that the activities of forest dependent people, both tribals and non-tribals have direct inpact on forest ecosystem. The activities of both, shows a positive relationship with forest cover loss. It is evident from the study that, when the number of tribals inhabiting a forest ecosystem imcreases, there is an increase in forest area loss. In other words, the study points out that the modern tribal culture and activities play a significant role in forest degradation in the district. Also the tribal population in the study area shows an increasing trend from 1970 to present, thus the increasing tribal population can be factor for large scale forest degradation. The intensive tribal agriculture by using modern farming practices and exploitatof forest products can be other factors leading to forest degradation.
The forest dependency of non-tribal rural population living along the forest fringes has also lead to forest degradation. The rate of degradation was high in regions with higher forest dependency of the inhabitants of forest fringes. The study shows that, the activities of non-tribals have munch more impending role in forest cover changes in a region.The panchayats having designated forest protection zones where the forest fringes are uninhabited have lesser forest degradation, which affirms the role of people living in forest fringe on the forest degradation. The local population living in fringe areas are forest products and services for their benefits. The grazing of cattles along forest fringes is one among the major activities leading to forest loss. The extensive fuel wood collection and illegal selling, collection of fodder, medicinal plants, sand and rocks are few of the common services availed by pepple inhabiting forest fringes
So from the study, it is clear that inorder to conserve foeest ecosystem, all of its components including tribals and non-tribals should be properly managed. Since the non-tribals are more exploitive in nature, there should be measures to reduce the forest dependence of non-tribals living in the fringe. The policies encouraging down migration of these people should be adopted inorder to conserve forest ecosystem. At the same time, the tribal activities should also be managed by improving their socioeconomic condirions. For the sustainable development of forest ecosystem and conservation, the forest dependent people should be managed properly.
Strength and Limitations
The study has bring out the nature and extend of damage caused by the forest dependent communities on their surrounding forest landscapes. This could lead to more concentrated researches in the field and would help authorities to formulate strategies to reduce pressure on forests in the district. The spatio-temporal forest cover changes estimated within the study points out the areas of maximum and minimum forest degradation, which can help in frameworking regional plans to conserve forests. Also the forest dependency of the people living along forest fringe, estimated within the study could help in uplifting those people with minimum impact to the immediate forest surroundings. However, the study couldn't determine the forest dependency of Tribals living within the forest ecosystem. The primary data collection from within the tribal settlements were not possible due Covid-19 restrictions. Hence, further studies should focus on analysing the forest dependency of tribals and its associarion with forest degradation.
Conclusion and Recommendation
The study estimated the spatio-temporal changes in forest cover in Thiruvananthapuram from 1970 to 2012 and identified the role of forest dependent people including both tribal communities and non-tribals inhabiting the forest fringes on forest degradation in the district. The exploitive nature and unscientific extraction of forest resources by forest dependent people is a major reason for forest cover loss. The activities of non-tribals have comparitively more impact on the forest ecosystem. The increased forest dependence of non-tribals shows a strong positive correlation with the rate of forest degradation. However, in government designated forest protection zones, where the forest fringes are no habitation zones, the forest cover loss is minimum. This affirms the effectiveness of conserving forests under various protection categories based on their ecological importance. Though, the extent of forest degradation caused by tribals is lesser compared to non-tribals, they also play a crucial role in forest cover loss. The improved accesibility and regular contact with outside world has lead to cultural diffusion and advent of modernization in tribal areas within the forest areas. This has deteriorated tribal life and altered the traditional living system of many tribal communities in the country. This has, in turn, lead to practices which are not sustainable for their ecosystem. There should be efforts from government agencies for sustainable sociocultural upliftment of tribals, so that they could regain their harmonious bond with forest ecosystem without exploiting the forest goods and services. The study recommends for strict implementation of forest laws, thereby limiting the forest resources exploitation. However the eviction of tribals from their ancestral land is impossible. The sociocultural upliftment could lead to down migration of many such communities. There should be region specific plans for improving the sociocultural and economic upliftment of forest dependent people. The upliftment in living condition could inturn reduce the forest dependence and thereby bring down the rate of forest degradation. Further, the local forest dependent people should be employed as forest watchers and conservative officers. The active participation of humans living in and around the forests is inevitable to reduce the forest degradation. The forest department should analyse the environmental degradation and forecast the possible cultural conflicts of local people due to deforestation.5 Also, the intrusion of forest plantations on forest lands should be controlled and there should be proper management of forest plantation. There should be more studies in this field in near future to point out the role of forest dependent people on forest degradation and thereby formulate forest conservative plans.
Acknowledgements
The authors are grateful to the concerned authorities of Department of Scheduled Tribe, Thiruvananthapuram, Kerala and Forest Headquarters in Vazhuthacadu, Thiruvananthapuram, for providing access to tribal communities for data collection. The corresponding author is greatful to University Grants Commission (UGC), India for providing Junior Research Fellowship during the period of research with grant number F. 15-9(JULY 2018)/2018(NET) and student id: 3353/(NET-JULY2018).
Conflict of Interest
The authors declare no conflict of interest.
Funding Sources
This research work did not receive any financial support or funding.
Reference
- Aronson J, Alexander S. Ecosystem restoration is now a global priority: time to roll up our sleeves. Restoration Ecology. 2013;21(3): 293–296. Doi: 10.1111/rec.12011.
CrossRef - Li Y, Wu Z, Xu X, Fan H, Tong X, Liu J. Forest disturbances and the attribution derived from yearly Landsat time series over 1990–2020 in the Hengduan Mountains Region of Southwest China. Forest Ecosystem. 2021; 8 (1).
CrossRef - Kim D.H, Sexton J.O, Noojipady P, Huang C, Anand A, Channan S, Feng M, Townshend J.R. Global, Landsat-based forest-cover change from 1990 to 2000. Remote Sens Environ. 2014;155: 178–193. https://doi.org/10.1016/j.rse.2014.08.017
CrossRef - Biswas, P.K. Sociological Issues in Forestry. Indian Journal of Social Sciences. 1988;1(2).
- Nath D.C, Mwchahary D. D. Deforestation and Transition of Tribal Population: A Study in Kokrajhar district of Assam, India. International Journal of Asian Social Science. 2012; 2 (6): 790-802.
- Soman D, Anitha V. Community dependence on the natural resources of Parambikulam Tiger Reserve, Kerala, India. Trees, Forests and People. 2020;2: 100014. https:doi.org/10.1016/j.tfp.2020.100014
CrossRef - Bera B, Saha S, Bhattacharjee S. Forest cover dynamics (1998 to 2019) and prediction of deforestation probability using binary logistic regression (BLR) model of Silabati watershed, India. Trees, Forests and People. 2020; 2: 100034. https://doi.org/10.1016/j.tfp.2020.100034.
CrossRef - Badesso B.B, Madalcho A.B, Mena M.M, Li F. Trends in forest cover change and degradation in Duguna Fango, Southern Ethiopia. Cogent Environmental Science. 2020;6(1): 1-12. DOI: 10.1080/23311843.2020.1834916.
CrossRef - Karjalainen E, Sarjala T, Raitio H. Promoting human health through forests: overview and major challenges. Environmenta Health Prev. 2010;15(1): 1-8. https://doi.org/10.1007/s12199-008-0069-2
CrossRef - Bonan G.B. Forests and climate change: Forcings, feedbacks, and the climate benefits of forests. Science. 2008;320(5882): 1444–1449. https://doi.org/10.1126/science.1155121.
CrossRef - Pan Y, Birdsey R.A, Fang J, Houghton R, Kauppi, P.E, Kurz W.A, Phillips O.L, Shvidenko A, Lewis S.L, Canadell J.G, Ciais P, Jackson R.B, Pacala S.W, McGuire A.D, Piao S, Rautiainen A, Sitch S, Hayes D. A. large and persistent carbon sink in the world’s forests. Science. 2011;333(6045): 988–993. https://doi.org/10.1126/science.120.
CrossRef - Chazdon R.L, Brancalion P.H, Laestadius L, et al. When is a forest a forest? Forest concepts and definitions in the era of forest and landscape restoration. Ambio. 2016;45(5): 538-550. doi:10.1007/s13280-016-0772-y
CrossRef - Seymour F, Busch J. Why forests? Why now? The science, economics, and politics of tropical forests and climate change. Center for global development, Brookings Institution Press. 2016.
- Kumari R, Banerjee A, Kumar R, Kumar A, Saikia P, Khan M. L. Deforestation in India: Consequences and Sustainable Solutions. Forest Degradation around the World. Environmental Science. 2019. https://doi.org/10.5772/intechopen.85804
CrossRef - Bowonder B. Deforestation in India. International Journal of Environmental Studies. 1982;18(3-4): 223-236.
CrossRef - Newton P, Kinzer A, Miller D. C, Oldekop J, Agrawal A. The Number and Spatial Distribution of Forest-Proximate People Globally. One Earth. 2020;3(3): 363-370, ISSN 2590-3322, https://doi.org/10.1016/j.oneear.2020.08.016.
CrossRef - Ellis E.C, Ramankutty N. Putting people in the map: anthropogenic biomes of the world, Front. Ecological Environment. 2008;6(8): 439-447.
CrossRef - Tripathi P. Tribes and Forest: A critical appraisal of the tribal forest right in India. Research Journal of Social Science and Management. 2016;6: 6-6.
- Chaudhuri B, Roy C. Regeneration of Forest Resources Based on Tribal Enterprise: An Approach towards an Eco-Friendly Environment. E-cadernos CES. 2017; 237-247 URL: http://journals.openedition.org/eces/2735; DOI: https://doi.org/10.4000/eces.2735
CrossRef - Krishnayanti S. D, Bunganaen W, Frans J. H, Seran Y. A, Legono, D. Curve Number Estimation for Ungauged Watershed in Semi-Arid Region. Civil Engineering Journal. 2021;7 (6). Doi: 10.28991/cej-2021-03091711.
CrossRef - Hillman, J. C. Ethiopia: Compendium of wildlife conservation information. Environmental Science. 1993; 1: 580.
- Cheikh, F..Comparative Analysis of Meteorological Drought based on the SPI and SPEI Indices. HighTech And Innovation Journal. 2022;3: 15-27. 10.28991/HIJ-SP2022-03-02
CrossRef - Appiah J. O, Duah W. A, Kpienbaareh D. Analysing patterns of forest cover change and related land uses in the Tano-Offin forest reserve in Ghana: Implications for forest policy and land management. Trees, Forests and People. 2021;5: 100-105. ISSN 2666-7193, https://doi.org/10.1016/j.tfp.2021.100105.
CrossRef - Giriraj A, Irfan-Ullah M. Murthy M.S.R, Beierkuhnlein C. Modelling Spatial and Temporal Forest Cover Change Patterns (1973-2020): A Case Study from South Western Ghats (India). Sensors. 2008;8(10): 6132—6153. https://www.mdpi.com/1424-8220/8/10/6132, ISSN 1424-8220.
CrossRef - Loran C, Munteanu C, Verburg P. H, Schmatz D. R, Bürgi M, Zimmermann N. E. Long-term change in drivers of forest cover expansion: an analysis for Switzerland (1850-2000). Reg Environ Change. 2017;17: 2223–2235. https://doi.org/10.1007/s10113-017-1148-y
CrossRef - Srivastava P.K, Singh S.K, Gupta M, Thakur J.K, Mukherjee S. Modeling Impact of Land Use Change Trajectories on Groundwater Quality Using Remote Sensing and GIS. Environ Eng manag J. 2013;12(12): 2343-2355.
CrossRef - Rathinagiri S, Manivel M, Raj J & Pugalanthi V, Ravichandran N, Anand V. Remote sensing and GIS based forest cover change detection study in Kalrayan hills, Tamil Nadu. Journal of Environmental Biology. 2010;31(5): 737-747.
- Song D. X, Huang C, Sexton J. O, Channan S, Feng M, Townshend J. R. Use of Landsat and Corona data for mapping forest cover change from the mid-1960s to 2000s: Case studies from the Eastern United States and Central Brazil. ISPRS Journal of Photogrammetry and Remote Sensing. 2015;103: 81-92. ISSN 0924-2716, https://doi.org/10.1016/j.isprsjprs.2014.09.005.
CrossRef - Tucker C.J, Townshend J.R.G. Strategies for monitoring tropical deforestation using satellite data. Int. J. Remote Sens. 2000; 2: 1461–1471.
CrossRef - Ahmad F, Goparaju L. Assessment of Threats to Forest Ecosystems Using Geospatial Technology in Jharkhand State of India. Current World Environment. 2017; 12(2). DOI:http://dx.doi.org/10.12944/CWE.12.2.19.
CrossRef - Meyer A. L, Kooten G. C, Wang S. Institutional, social and economic roots of deforestation: A cross-country comparison. International Forestry Review. 2003; 5(1): 29-37.
CrossRef - Kasri J.E, Lahmili A, Soussi H, Jaouda I, Bentaher M. Trend Analysis of Meteorological Variables: Rainfall and Temperature. Civil Engineering Journal. 2021; 7 (11). Doi: 10.28991/cej-2021-03091765
CrossRef - Firdos S. “Forest Degradation, Changing Workforce Structure and Population Redistribution: The Case of Birhors in Jharkhand. Economic and Political Weekly. 2005; 40 (8): 773–78.
- Damodaran A. Tribals, Forests and Resource Conflicts in Kerala, India: The Status Quo of Policy Change. Oxford Development Studies. 2006; 34:3. 357-371. DOI: 10.1080/13600810600921976
CrossRef - Bishop J.T. Valuing Forests: A Review of Methods and Applications in Developing Countries. International Institute for Environment and Development, London. 1999; 23-34.
- Marianne S, Wood C.H. Contested Frontiers in Amazonia. New York: Columbia University Press.1992.
- Damania R, Joshi A, Russ J. India’s forests – Stepping stone or millstone for the poor?. World Development. 2020;125(C) . DOI: 10.1016/j.worlddev.2018.11.007
CrossRef - Myers N, Mittermeier R.A, Mittermeier C. G, Fonseca G. A. B, Kent J. Biodiversity hotspots for conservation priorities. Nature. 2000;403: 853-858.
CrossRef - Chakravarty S, Ghosh S. K, Suresh C. P, Dey A. N, Shukla G. Deforestation: Causes, effects and control strategies. In: Okia C. A. Global Perspectives on Sustainable Forest Management. Croatia: InTech; 2012: 3-28. Doi: https://doi.org/10.5772/2634.Accessed July 11, 2022.
CrossRef
Avarivation
Acronym | Full name | Explanation |
RS | Remote Sensing | The process of detecting information about distant objects. |
GIS | Geographic Information System | A computer system that analyses and displays geographic information. |
OLI | Operational Land Imager | An image capturing instrument onboard the Landsat satellites. |
TPs | Tribal Population Size | The proportion of tribal population living within the forests. |
RFC | Rate of Forest-cover Changes | Average annual rate of changes in forest cover.31 |
FDR | Forest Dependency Ratio | The index for forest dependence of inhabitants to five factors namely food products, housing material, fuel wood, livestock fodder and medicinal plants. |


