Diversity of Fish Species and Physico-Chemical Assessment of Dejla Dewda Reservoir Khargone (M.P.) - India
Golden Gokhale1
*
 , Pir Mohammad Ishfaq2
and G D Sharma1
, Pir Mohammad Ishfaq2
and G D Sharma1
http://dx.doi.org/10.12944/CWE.15.2.20
The aim of this work was to find the seasonal variations of physico-chemical properties of the Dejla Dewda reservoir. The physico-chemical characteristics have been studied and analysed in the present investigation during Nov 2016 to Dec 2017.Water samples were collected from three sampling stations, changes in the physico-chemical parameters of water, such as Water temperature, transparency, alkalinity, chloride, sulphate, nitrate, phosphate, Total dissolved solids (TDS), Biological oxygen demand (BOD), Dissolved oxygen (DO), Chemical oxygen demand (COD) and pH were analysed. The result was compared with the water quality standard of WHO. Between various physico-chemical parameters systematic calculation of average and standard deviation was done to compare the water quality level at different stations. During the investigation period of one year, 24 species of fishes belonging to 03 orders and 06 families were recorded. Therefore, monitoring of the water quality of sampling sites of Dejla Dewda reservoir should be done at regular intervals to facilitate the growth of fish species. It was observed during the study that this reservoir water is not much polluted and supports high diversity of aquatic animals.
Copy the following to cite this article:
Gokhale G, Ishfaq P. M, Sharma G. D. Diversity of Fish Species and Physico-Chemical Assessment of Dejla Dewda Reservoir Khargone (M.P.) – India . Curr World Environ 2020; 15(2). DOI:http://dx.doi.org/10.12944/CWE.15.2.20
Copy the following to cite this URL:
Gokhale G, Ishfaq P. M, Sharma G. D. Diversity of Fish Species and Physico-Chemical Assessment of Dejla Dewda Reservoir Khargone (M.P.) – India . Curr World Environ 2020; 15(2). Available from: https://bit.ly/3hKHVm2
Download article (pdf) Citation Manager Publish History

Introduction
Water plays a crucial role in boosting the world economy. The fresh water used by humans which is used for agriculture is approximately 70%. Fishing in salt and freshwater bodies is the primary source of food in many parts of the world. Most of the long distance trade of commodities (oil and natural gas) as well as the manufactured products are transported by the boats through rivers, seas, lakes and the canals. In the industries and homes large quantities of ice, water and steam is used for heating and cooling. Water is an excellent solvent for a wide variety of chemical substance; such as it is widely used in industrial processes, in cooking and washing (Chowdhary, Bharagava, Mishra, & Khan, 2020). Water is considered as a significant resource having a multidimensional value that include hydropower generation, flood control, navigation, water supply, restoration, etc (Yaseen, Sulaiman, Deo, & Chau, 2019). Water is regarded as the great gift of nature and lays the foundation of life and development. The wetlands form the unique biological fresh water ecosystem on the earth. There is no life without water, it very much essential for healthy growth of organisms (Hintz & Relyea, 2019). Water plays very significant role in the life cycle of organisms, hydrology of area and economy of the nation (Hodkinson, Webb, Bale, & Block, 1999; Valentina, Singh, Tamuli, & Teron, 2015). Water also serves as the habitat for migratory birds, plants, aquaculture, animals and microbes. The fresh water resources are in different forms mainly in the form of lentic and lotic ecosystems. The lentic ecosystems comprise of the tanks, ponds, lakes, and the reservoirs. Perennial reservoirs mostly play a healthy role for domestic, aquaculture and agriculture as a productive water resource (Eriegha, Ovie, & Ovie SO and Aminu, 2019; Hujare, 2008). The amount of aquatic habitat is more than any other habitat. A productive reservoir is mostly dependent upon the significant biological and physico-chemical characteristics (Kumar & Krishna, 2017). The physical as well as the chemical properties of water has a greatly affected its use, richness and the distribution of the biota of an area (Hardikar, et al., 2017). To understand the nature of aquatic habitat, it is necessary to get the information of hydrobiology of aquatic resources. Hydrobiology of any surface water resource encompasses the relationship of physico-chemical characteristics of water with its aquatic flora and fauna available in it (Shinde, Pathan, Raut, & Sonawane, 2011). The chemical and biological factors of water are interrelated and interdependent. The physico-chemical factors are important for analyzing various constituents of water as well as concentration of the pollutants or the contaminants (Doong, Lee, Lee, Sun, & Wu, 2008; Naveen, Mahapatra, Sitharam, Sivapullaiah, & Ramachandra, 2017).
Aquatic ecosystem is mostly dependent on the water quality as well as the biological diversity and its habitat for fish must have favourable quality parameters such as biological oxygen demand and dissolved oxygen, minerals, ammonia, nitrate, nitrite, phosphate etc in such amounts that are not harmful to fishes. The physico-chemical parameters usually play a healthy role in biology and the physiology of the fish lakes and reservoirs that pay way to one of the largest inland fishery resource, both in size as well as the production potential (Bera, Bhattacharya, Patra, & Sar, 2014; Vajravelu, Martin, Ayyappan, & Mayakrishnan, 2018). Fishes are one of the most useful indicators of the aquatic ecosystem that usually occupy a prominent position from the socioeconomic point of view (Frisch, Ireland, & Baker, 2014; Orihel, et al., 2017). Generally fish is a rich source of protein, vitamins as well as the other essential minerals. Fish being totally dependent on water to excrete waste, breathe, reproduce and for maintaining the proper salt balance therefore, it’s worthy to understand physical and the chemical qualities of water for better aquaculture. Significant work has been done on the physical and chemical qualities of water in the different coastal ecosystems of India (Vajravelu, et al., 2018; Yerima, Suleiman, & Bolorunduro, 2018).
The Dejla Dewada reservoir is used for irrigation as well as for the fish production by the Fishery Department, Government of Madhya Pradesh, by the involvement of communities of the local fishermen. In the present study, the primary focus was to understand suitability of the water to increase the fishery activity by studying various water parameters. In the present investigation the fish diversity in Dejla Dewda reservoir was analysed in relation with different physico-chemical parameters in order to manifest the future planning for the well-being and development of the socioeconomic status of the fishermen of the area living in close vicinity of the reservoir. Therefore, the present study primarily focus on the water quality and then relate it to the fish production in Dejla Dewda reservoir in Khargone, Madhya Pradesh.
Materials and Methods
Study Area
Kunda river is one of the main rivers of Khargone district, it’s a tributary river of the main river “Narmada”. It’s origin is from the forests and it has a length of approximately 169Kms with the catchment area of approximately 3825sq.km. The river is situated in west direction of Madhya pradesh and flows from South to North maily through the four blocks of Khargone district Goganwa, Bhagwanpura, Kasrawad and Khargone. A number of stop dams have been constructed in previous couple of years that are mostly used for irrigation facility as well as drinking water by the people of Khargone district, with a water capacity of around 20 crore litres. Water holding capacity of these dams is 0.646 million cubic meters. On the Kunda river two main reservoirs are constructed, Dejla-Devda reservoir & Vanihar reservoir. In the present study our focus was on Dejla dewda reservoir that provides drinking water for the Khargone city. Its capacity in stop water is 1.5 million cubic meter with a latitude of 21º49‟16” (DMS) N and longitude (DMS) 75º36‟4”E (Figure 1).
 |
Figure 1: Satellite image of Dejla Dewda reservoir Click here to View Figure |
Sample Collection
For estimation of physico-chemical parameters, water samples were collected on monthly basis. Collections were made on specific dates of every month with three different sampling stations. Surface samples were collected using clean plastic containers for the study of various physico-chemical and biological parameters. Sample collection and observations were made in the morning time (6:00 am to 9:00 am). Some of the parameters were calculated at the collection point and other parameters were estimated in the lab throughout the study period. Water samples that were collected mainly for the purpose of understanding of the different physico-chemical parameters were freshly brought to laboratory and were subjected to the analysis immediately. Standard methods were consulted for estimation of Physico-chemical parameters (APHA AWWA, 1998) (Table 1).
Ichthyofauna
Fishes were collected by using gill net, drag net, hand net, cast net and purely by the help of local fishermen society of Dejla and Dewda villages. Collected fishes were photographed immediately and the specimen were preserved in 10% formalin and then brought to laboratory for identification (Figure 2). The fish specimens were identified by taking into account the standard identification keys (Day, 1871 {Day, 1871 #285; Jayaram, 1981; Talwar & Jhingran, 1991).
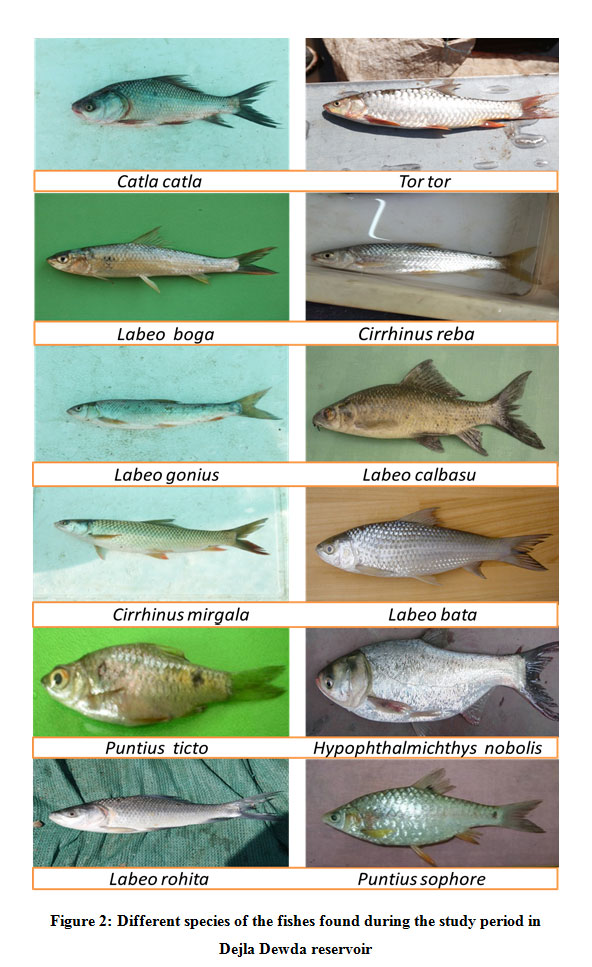 |
Figure 2: Different species of the fishes found during the study period in Dejla Dewda reservoir Click here to View Figure |
Table 1: Methods employed for the measurement of physico-chemical parameters
|
S.No. |
Parameters |
Method/ Instruments |
|
1. |
Temperature |
Thermometer |
|
2. |
Transparency |
Secchi Disc |
|
3. |
Alkalinity |
Titrimetric |
|
4. |
Chloride |
Gravimetric |
|
5. |
Sulphate |
Nephelometer |
|
6. |
Nitrate |
Spectrophotometric |
|
7. |
Phosphate |
Spectrophotometric |
|
8. |
TDS |
Conductometery |
|
9. |
BOD |
Bottle Incubation Method |
|
10. |
COD |
Open Reflux Method |
|
11. |
DO |
Wrinkle’s Method |
|
12. |
pH |
pH meter |
Results
Seasonal variation of the physico-chemical parameters of Dejla Dewda reservoir were analysed on the water samples that were collected from three different sampling stations: Sampling station-S1, Samping station-S2, Samping station-S3 and the results have been summarized in the tables. (Table 2, 3, 4).
Temperature
In physico-chemical analysis of water of Dejla Dewda reservoir it was observed that the water temperature varied between 20.5ºC-29.3ºC at sampling station S1 with a standard deviation of ±4.96, at sampling station S2 it ranged between 20.7 ºC- 29.5 ºC with standard deviation of ±4.94 and at sampling station S3 it ranged between 20.6 ºC – 29.4 with a standard deviation of ±4.96 (Figure 3a). Water temperature shows increased significant positive association with chloride, sulphate, alkalinity and pH.
Transparency
At sampling station S1, transparency ranged between 4.6 cm-11.7 with standard deviation of ±3.55 cm, at sampling station S2 it ranged between 4.8 cm-11.6 cm with standard deviation of ±3.40 and at sampling station S3 the transparency ranged between 4.8 cm – 11.5 cm with standard deviation of ±3.35 (Figure 3b). Low value of transparency observed in monsoon may be due to influx of rain water from catchment area, less penetration of light and suspended inert particulate matter. Transparency shows high significant positive relationship with DO, BOD. COD and shows negative relationship with pH.
Alkalinity
Alkalinity was analysed at sampling station S1 and ranged between 110.4mg/L-144.1mg/L with standard deviation of ±16.8, at sampling station S2 it was 109.7 mg/L-144.3 mg/L with standard deviation of ±17.40 and at sampling station S3 it was found between 110.2 mg/L – 144.8 mg/L with standard deviation of ±17.42 (Figure 3c). Alkalinity shows high significant positive relationship with water temperature, pH and sulphate.
Chloride
Chloride at sampling station S1 ranged between 16.5 mg/L-25.6 mg/L with a standard deviation of ±4.56, at sampling station S2 it was found between 16.52 mg/L-25.5 mg/L with a standard of deviation ±4.51 and at sampling station S3 it was 16.4 mg/L – 25.7 mg/L with standard deviation of ±4.66 (Figure 3d). Chloride showed high significant positive relationship with water temperature, pH and sulphate.
Sulphate
Sulphate at sampling station S1 ranged between 17.3mg/L-26.5mg/L with standard deviation of ±4.70, at sampling station S2 it was 17.2 mg/L – 26.5 mg/L with standard deviation of ±4.75 and at sampling station S3 sulphate was between 17.4 mg/L- 26.6 mg/L with standard deviation of ±4.69 (Figure 3e). Sulphate show high significant positive relationship with temperature and alkalinity.
Nitrates
Nitrates at sampling station S1 ranged between 0.1mg/L-0.5mg/L with a standard deviation of ±0.20, at sampling station S2 it was between 0.1 mg/L – 0.5 mg/L with standard deviation of ±0.20 and at sampling station S3 it was 0.1 mg/L – 0.5 mg/L with standard deviation of ±0.20 (Figure 3f). Nitrate level showed significant negative relationship with that of BOD, pH, DO, COD and transparency.
Phosphate
Phosphate range at sampling station S1 was found between 1.2mg/L-1.5mg/L with standard deviation of ±0.15, at sampling station S2 it was 1.3 mg/L – 1.6 mg/L with standard deviation of ±0.17 and at sampling station S3 it was 1.3 mg/L- 1.6 mg/L with a standard deviation of ±0.11 (Figure 4a). Phosphate show high significant positive relationship with nitrate and show negative relationship with DO, BOD, COD and transparency.
Total Dissolved Solids (TDS)
TDS was calculated and it was found that at sampling station S1 TDS ranged between 139.5 mg/L-187.7 mg/L with a standard deviation of ±24.11, at sampling station S2 it was 139.5 mg/L -187.5 mg/L with a standard deviation of ±24.0 and at sampling station S3 the value ranged between 139 mg/L – 186.5 mg/L with a standard deviation of ±23.75 (Figure 4b). TDS showed significant relationship with water temperature, pH and phosphate.
Biological Oxygen Demand (BOD)
BOD at sampling station S1 ranged from 3.4 mg/L-4.3 mg/L with a standard deviation of ±0.45, at sampling station S2 it was 3.4 mg/L -4.3 mg/L with standard deviation of ±0.45 and at sampling station S3 the value ranged between 3.4 mg/L – 4.4 mg/L with a standard deviation of ±0.50 (Figure 4c). Biological oxygen demand show high significant positive relationship with DO, COD and Nitrate.
Chemical Oxygen Demand (COD)
COD at sampling station S1 ranged between 9.8 mg/L-10 mg/L with a standard deviation of ±0.58, at sampling station S2 it was 9.9 mg/L – 10.8 mg/L with a standard deviation of ±0.47 and at sampling station S3 it was 9.8 mg/L-10.8 mg/L with a standard deviation of ±0.50 (Figure 4d). Chemical oxygen demand show high significant positive relationship with pH and BOD.
Dissloved Oxygen (DO)
The range of dissolved oxygen at sampling station S1 was found between 6.4 mg/L-9 mg/L with a standard
deviation of ±1.44, at sampling station S2 it was between 6.5 mg/L – 9 mg/L with a standard deviation of ±1.47 and at sampling station S3 it was 6.4 mg/L -8.9 mg/L with a standard deviation of ±1.36 (Figure 4e).
pH
pH at sampling station S1 was recorded between 8.3-8.7 with a standard deviation of ±0.20, at sampling station S2 it was 8.2 – 8.8 with a standard deviation of ±0.30 and at sampling station S3 it was 8.1 – 8.7 with a standard deviation of ±0.3 (Figure 4f). pH showed high significant positive relationship with temperature, alkalinity, COD, transparency, chloride, sulphate and pH.
Table 2: Seasonal variation of physico-chemical parameters of Dejla Dewda reservoir sampling station-S1
|
Parameters |
Units |
Summer |
Monsoon |
Winter |
SD |
Maximum Range |
Minimum Range |
WHO Standard |
|
Temperature |
ºC |
29.3 |
28.9 |
20.5 |
±4.96 |
29.3 |
20.5 |
- |
|
Transparency |
Cm |
11.7 |
4.6 |
7.8 |
±3.55 |
11.7 |
4.6 |
- |
|
Alkalinity |
mg/L |
125.8 |
144.1 |
110.4 |
±16.8 |
144.1 |
110.4 |
200 |
|
Chloride |
mg/L |
16.5 |
25.6 |
21.6 |
±4.56 |
25.6 |
16.5 |
250 |
|
Sulphate |
mg/L |
17.3 |
23.6 |
26.5 |
±4.70 |
26.5 |
17.3 |
250 |
|
Nitrate |
mg/L |
0.5 |
0.2 |
0.1 |
±0.20 |
0.5 |
0.1 |
50 |
|
Phosphate |
mg/L |
1.4 |
1.5 |
1.2 |
±0.15 |
1.5 |
1.2 |
5.0 |
|
TDS |
mg/L |
139.5 |
162 |
187.7 |
±24.11 |
187.7 |
139.5 |
600 |
|
BOD |
mg/L |
3.4 |
4.3 |
3.9 |
±0.45 |
4.3 |
3.4 |
6.0 |
|
COD |
mg/L |
9.8 |
10.9 |
10 |
±0.58 |
10 |
9.8 |
10 |
|
DO |
mg/L |
9 |
6.6 |
6.4 |
±1.44 |
9 |
6.4 |
5.0 |
|
pH |
|
8.7 |
8.6 |
8.3 |
±0.20 |
8.7 |
8.3 |
7-8.5 |
Table 3: Seasonal variation of physico-chemical parameters of Dejla Dewda reservoir sampling station- S2
|
Parameters |
Units |
Summer |
Monsoon |
Winter |
SD |
Maximum Range |
Minimum Range |
WHO Standard |
|
Temperature |
ºC |
29.5 |
29 |
20.7 |
±4.94 |
29.5 |
20.7 |
- |
|
Transparency |
Cm |
11.6 |
4.8 |
7.8 |
±3.40 |
11.6 |
4.8 |
- |
|
Alkalinity |
mg/L |
123.7 |
144.3 |
109.7 |
±17.4 |
144.3 |
109.7 |
200 |
|
Chloride |
mg/L |
16.5 |
25.5 |
21.7 |
±4.51 |
25.5 |
16.5 |
250 |
|
Sulphate |
mg/L |
17.2 |
23.6 |
26.5 |
±4.17 |
26.5 |
17.2 |
250 |
|
Nitrate |
mg/L |
0.5 |
0.2 |
0.1 |
±0.20 |
0.5 |
0.1 |
50 |
|
Phosphate |
mg/L |
1.3 |
1.6 |
1.3 |
±0.17 |
1.6 |
1.3 |
5.0 |
|
TDS |
mg/L |
13.9 |
162.7 |
187.5 |
±24.0 |
187.5 |
13.9 |
600 |
|
BOD |
mg/L |
3.4 |
4.3 |
3.9 |
±0.45 |
4.3 |
3.4 |
6.0 |
|
COD |
mg/L |
9.9 |
10.8 |
10.1 |
±0.47 |
10.8 |
9.9 |
10 |
|
DO |
mg/L |
9 |
6.5 |
6.4 |
±1.47 |
9 |
6.5 |
5.0 |
|
pH |
|
8.4 |
8.8 |
8.2 |
±0.30 |
8.8 |
8.2 |
7-8.5 |
Table 4: Seasonal variation of physico-chemical parameters of Dejla Dewda reservoir sampling station- S3
|
Parameters |
Units |
Summer |
Monsoon |
Winter |
SD |
Maximum Range |
Minimum Range |
WHO Standard |
|
Temperature |
ºC |
29.4 |
29 |
20.6 |
±4.96 |
29.4 |
20.6 |
- |
|
Transparency |
Cm |
11.5 |
4.8 |
8 |
±3.35 |
11.5 |
4.8 |
- |
|
Alkalinity |
mg/L |
123.9 |
144.8 |
110.2 |
±17.42 |
144.8 |
110.2 |
200 |
|
Chloride |
mg/L |
16.4 |
25.7 |
21.7 |
±4.66 |
25.7 |
16.4 |
250 |
|
Sulphate |
mg/L |
17.4 |
23.6 |
26.6 |
±4.69 |
26.6 |
17.4 |
250 |
|
Nitrate |
mg/L |
0.5 |
0.2 |
2.1 |
±0.20 |
0.5 |
0.1 |
50 |
|
Phosphate |
mg/L |
1.3 |
1.5 |
1.3 |
±0.11 |
1.5 |
1.3 |
5.0 |
|
TDS |
mg/L |
139 |
162.5 |
186.5 |
±23.75 |
186.5 |
139 |
600 |
|
BOD |
mg/L |
3.4 |
4.4 |
3.8 |
±0.50 |
4.4 |
3.4 |
6.0 |
|
COD |
mg/L |
9.8 |
10.8 |
10.2 |
±0.50 |
10.8 |
9.8 |
10 |
|
DO |
mg/L |
8.9 |
6.7 |
6.4 |
±1.36 |
8.9 |
6.4 |
5.0 |
|
pH |
|
8.4 |
8.7 |
8.1 |
±0.3 |
8.7 |
8.1 |
7-8.5 |
 |
Figure 3: Graphs showing average seasonal variations of three sampling stations Click here to View Figure |
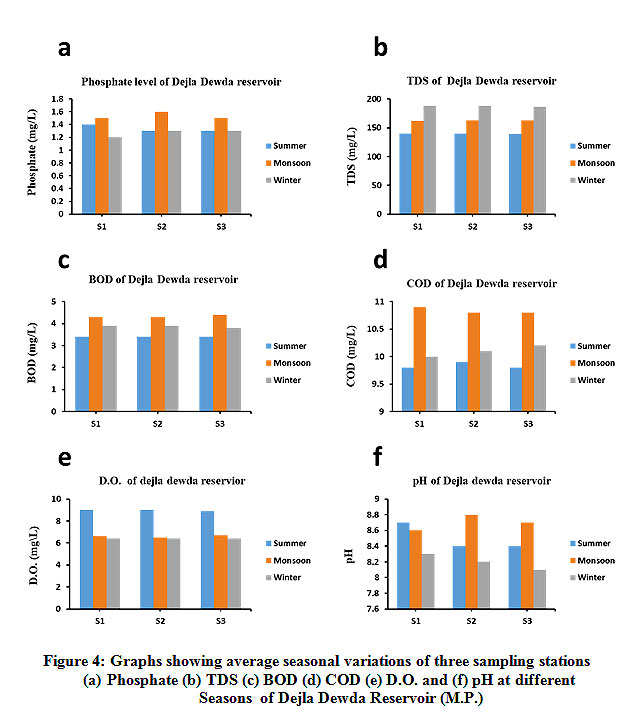 |
Figure 4: Graphs showing average seasonal variations of three sampling stations Click here to View Figure |
Diversity of the Fishes Collected from Dejla Dewda Reservoir
In the present investigation diversity of the fishes collected from Dejla Dewda reservoir comprised of 24 species belonging to 06 different families viz., Cyprinidae, Siluridae, Bagridae, Claridae, Ophiocephalidae and Belonidae of 03 orders. Order Cypriniformes has been found to be a major order with 12 species (Table 5).
Table 5: Diversity of the fishes collected from Dejla Dewda reservoir
|
S.No. |
Order |
Family (No. of Species) |
Name of Species |
|
1.
|
Cypriniformes |
Cyprinidae (12) |
Calta calta, Cirrhinus mrigala, Cirrhinus reba, Labeo boga, Labeo calbasu, Labeo bata, Labeo rohita, Tor tor, Panctius sophore, Panctius ticto, Hypophthalmichthys nobilis, Labeo gonius |
|
Siluridae (03) |
Ompok pabda, Ompok bimaculatus, wallago attu |
||
|
Bagridae (04) |
Mystus singhala, Mystus bleekeri, Mystus aor, Rita-rita |
||
|
Claridae (01) |
Clarious batrachus |
||
|
2. |
Ophiocephaliformes |
Ophiocehalidae (03) |
Channa marulis, Channa gachua, Channa punctatus |
|
3. |
Belonifores |
Belonidae (01) |
Xenetodon cancila |
Percentage of Different Orders of Fish Species Collected from Dejla Dewda Reservoir
In the present investigation, the percentage of different orders of the fish species was calculated and it has been observed that order cypriniformes formed 84% of the overall fish species while order ophioicphaliformes formed 12 % of the total fish species and order belioniformes formed 4% of the all the fish species in the Dejla Dewda reservoir (Figure 5).
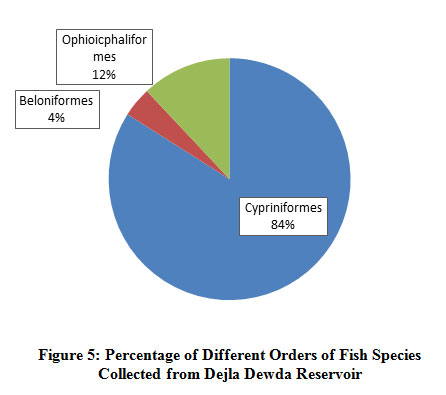 |
Figure 5: Percentage of Different Orders of Fish Species Collected from Dejla Dewda Reservoir Click here to View Figure |
Percentage of Different Families of Fish Species Collected from Dejla Dewda Reservoir
In the present study, the percentage of different families of the fish species was analysed and it was observed that family cyprinide formed 50 % of the total fish species, family bagridae formed 17 % of the total fish species, family ophiocephalidae formed 13 % of the total fish species, family siluridae formed 12% of the total fish species, family belonidae formed 4% of the aggregate fish species and family claridae formed 4% of the total species in the Dejla Dewda reservoir (Figure 6)
 |
Figure 6: Percentage of different families of fish species collected from Dejla Dewda reservoir Click here to View Figure |
Disscussion
Biodiversity is the distribution and variety ranging through genetics and life forms of different populations, communities, species and ecosystems. Biodiversity is extremely of huge importance for the sustainability of the marine resources which mostly include commercial fisheries. During the present investigation among the reported fish families, cyprinidae family was more dominant. Our findings are in consistent with the earlier studies that have reported significant dominance of cyprinidae family during the investigations on the ichthyofaunal diversity (Laxmappa, Naik, & Vamshi, 2015{Balkhande, 2015 #270). Diversity of the fish species was high in Dejla Dewda reservoir, considering the fact that the sampling sites were not too large. Various species of fish, were not that vulnerable to be captured in the present study site. The complex habitats usually support more species than the homogeneous habitats. Therefore, the increased habitat heterogeneity proves to provide greater diversity of the resources for the species, thereby leading to the reduced competition becuause of the resource partitioning. Previous studies have reported 23 species of fish that belong to 7 orders with cyprinidae family being most dominant with 11 species from the Jawalgaon reservoir Solapur district Maharastra (Humbe, Jadhav, & Borde, 2014; Sakhare, 2001). Earlier studies have reported 37 species of fish from the Issapur dam in district Yavatmal where the cyprinidae family was more dominant with 20 fish species (Khedkar & Gynanath, 2005). From the literature survey, studies reported 45 species in Rajnandgaon town of Chhattisgarh, India, Cyprinadae being the largest dominant family that contributed 20 species and Bagridae formed the sub dominant family (Dhanalakshmi, 2015; Narasimha Ramulu & Benarjee, 2013; UTTAR, 2013). Earlier studies reported 68 species of fishes in Tribal district Satpura valley, Betul of Madhya Pradesh in India where order cypriniformes was dominated (Jain, Shukla, Azad, & Rai, 2016). During the present investigation, 24 fish species belonging to 03 orders and 06 familes were observed in Dejla Dewda reservoir. The most abundant family was cyprinidae with 12 different species followed by bagridae with 05 species, siliuridae with 03 species, ophiocephalidae with 03 species and belonidae with 01 species. The family cyprinidae was found as dominant all through the year. Our findings were supported by earlier studies where 51 fish species under family cyprinidae were found covering 36% of the total fish species (Chowdhury, et al., 2019). Development of the longer term management and conservation of fisheries and support for huge consumer choice can minimise the chances of loss of the fish biodiversity in Dejla Dewda reservoir.
Conclusion
In present observation among the fish species collected, the following were considered as the most economically important and cultivable fish including Cyprinus carpio, Labeo rohita, Labeo gonia, Cirrhinus mrigala, Catla catla, Mystus seenghala, Mystus oar and Channa punctatus. The natural water bodies sustain the populations of Labeo rohita and Catla catla as the major food fishes. It was observed that the species richness was at its peak in the month of July while as the species evenness was at its highest in late monsoon that provides an indication of an evenly distributed as well as the rich fauna in monsoon and the post monsoon respectively. The Indian major carps such as Catla catla, Cirrhinus mrigala and Labeo rohita were recorded in considerable quantity in all the three sampling stations.
In the present study, the results show detailed physico-chemical characteristics and quality of water in Dejla Dewda reservoir. The summer, monsoon and winter seasons showed increased seasonal fluctuations in the various physico-chemical parameters that were analyzed in this study. There is also a need to draw an attention of the people to take care and maintain the water at its highest quality as well its purity level. To improve the quality of the water, continuous monitoring of thepollution level and methods should be applied for removing water pollution in the reservoir for better production of the fish and other aquatic life. Monitoring of the water quality of sampling sites of Dejla Dewda reservoir should be done at regular intervals. In the present investigation values of various physico-chemical parameters were within the permissible limits of WHO. Therefore, on the basis of these results it may be advocated that this reservoir water is not much polluted and supports high diversity of aquatic animals.
Acknowledgements
The authors are thankful to Phalguni Potdar, for her valuable suggestions during the manuscript writing.
Conflict of Interest
The authors declare no conflict of interest.
References
- APHA AWWA, W. (1998). Standard methods for the examination of water and wastewater 20th edition. American Public Health Association, American Water Work Association, Water Environment Federation, Washington, DC.
- Bera, A., Bhattacharya, M., Patra, B. C., & Sar, U. K. (2014). Ichthyofaunal diversity and water quality in the Kangsabati Reservoir, West Bengal, India. Advances in Zoology, 2014.
- Chowdhary, P., Bharagava, R. N., Mishra, S., & Khan, N. (2020). Role of Industries in Water Scarcity and Its Adverse Effects on Environment and Human Health. In Environmental Concerns and Sustainable Development (pp. 235-256): Springer.
- Chowdhury, M. A., Karim, M. A., Rahman, M. T., Talukder, S. H., Shefat, A. R., & Hossain, M. A. (2019). Biodiversity Assessment of Indigenous Fish Species in the Surma River of Sylhet Sadar, Bangladesh. Punjab University Journal of Zoology, 34, 73-77.
- Day, F. (1871). Report on the Fish and Fisheries of the Fresh Waters of India: Government central Press.
- Dhanalakshmi, B. (2015). An assessment of fresh water piscine diversity in selected wetlands in Coimbatore District, Tamilnadu, India—A Preliminary Study. Open Access Library Journal, 2, 1.
- Doong, R.-a., Lee, S.-h., Lee, C.-c., Sun, Y.-c., & Wu, S.-c. (2008). Characterization and composition of heavy metals and persistent organic pollutants in water and estuarine sediments from Gao-ping River, Taiwan. Marine pollution bulletin, 57, 846-857.
- Eriegha, O., Ovie, S., & Ovie SOand Aminu, A. (2019). Shrinking Lake Chad: Initialization of culture-based fisheries for improved livelihood in Nigeria.
- Frisch, A. J., Ireland, M., & Baker, R. (2014). Trophic ecology of large predatory reef fishes: energy pathways, trophic level, and implications for fisheries in a changing climate. Marine Biology, 161, 61-73.
- Hardikar, R., Haridevi, C., Chowdhury, M., Shinde, N., Ram, A., Rokade, M., & Rakesh, P. (2017). Seasonal distribution of phytoplankton and its association with physico-chemical parameters in coastal waters of Malvan, west coast of India. Environmental monitoring and assessment, 189, 151.
- Hintz, W. D., & Relyea, R. A. (2019). A review of the species, community, and ecosystem impacts of road salt salinisation in fresh waters. Freshwater biology, 64, 1081-1097.
- Hodkinson, I., Webb, N., Bale, J., & Block, W. (1999). Hydrology, water availability and tundra ecosystem function in a changing climate: the need for a closer integration of ideas? Global Change Biology, 5, 359-369.
- Hujare, M. S. (2008). Limnological studies of the perennial waterbody, Attigre tank, Kolhapur dist., Maharashtra. Nature Environment and Pollution Technology, 7, 43.
- Humbe, A., Jadhav, S., & Borde, S. (2014). Diversity of Ichthyofauna from Sina Kolegoan Dam Osmanabad Dist. Maharashtra. Weekly Science Research Journal, 1, 1-5.
- Jain, S., Shukla, A., Azad, Z., & Rai, S. (2016). An overview of evolutionary concept, food supplements, growth pattern and diversity of ichthyofauna in central India. IJAR, 2, 874-879.
- Jayaram, K. C. (1981). Freshwater fishes of India, Pakistan, Bangladesh, Burma and Sri Lanka.
- Khedkar, G., & Gynanath, G. (2005). Biodiversity and Distribution of the Fishes from the Back Waters of Issapur Reservoir District Yeotmal, Maharashtra State India. Trends in Life Science (India), 20, 117.
- Kumar, G. V. P., & Krishna, K. R. (2017). Comparative study on the water quality status of Andra reservoir and Denkada anicut constructed on Champavati River, Vizianagaram, India. Applied Water Science, 7, 1497-1504.
- Laxmappa, B., Naik, S. J. K., & Vamshi, S. (2015). Ichthyofaunal diversity of Koilsagar reservoir in Mahbubnagar district, Telangana, India. International Journal of Fisheries and Aquatic Studies, 2, 23-30.
- Mondal, S., Agarwal, R., & Thiske, S. (2014). Ichthyofaunal diversity of the Pakhanjore dam dist Kanker, CG, India. In: Biolife.
- Narasimha Ramulu, K., & Benarjee, G. (2013). Fish Species Diversity of Nagaram Tank of Warangal, Andhra Pradesh. IOSR Journal of environmental science, Toxicology and food technology, 3, 14-18.
- Naveen, B., Mahapatra, D. M., Sitharam, T., Sivapullaiah, P., & Ramachandra, T. (2017). Physico-chemical and biological characterization of urban municipal landfill leachate. Environmental Pollution, 220, 1-12.
- Orihel, D. M., Baulch, H. M., Casson, N. J., North, R. L., Parsons, C. T., Seckar, D. C., & Venkiteswaran, J. J. (2017). Internal phosphorus loading in Canadian fresh waters: a critical review and data analysis. Canadian Journal of Fisheries and Aquatic Sciences, 74, 2005-2029.
- Sakhare, V. (2001). Ichthyofauna of Jawalgaon reservoir in Solapur District (MS). Journal of Aquatic Biology, 16, 31-33.
- Shinde, S., Pathan, T., Raut, K., & Sonawane, D. (2011). Studies on the physico-chemical parameters and correlation coefficient of Harsool-savangi Dam, District Aurangabad, India. Middle-East Journal of Scientific Research, 8, 544-554.
- Talwar, P., & Jhingran, A. (1991). Inland fishes of India and adjacent countries, Volume 1&2. In: AA Balkema, Rotterdam, 541pp.
- Uttar, o. D. B. I. W. (2013). Studies on freshwater fish fauna of district bijnor in western uttar pradesh, india.
- Vajravelu, M., Martin, Y., Ayyappan, S., & Mayakrishnan, M. (2018). Seasonal influence of physico-chemical parameters on phytoplankton diversity, community structure and abundance at Parangipettai coastal waters, Bay of Bengal, South East Coast of India. Oceanologia, 60, 114-127.
- Valentina, T., Singh, H., Tamuli, A., & Teron, R. (2015). Assessment of Physico-Chemical Characteristics and Fish Diversity of Hill streams in Karbi Anglong district, Assam, India. Int. Res. J. Environ. Sci, 4, 6-11.
- Yaseen, Z. M., Sulaiman, S. O., Deo, R. C., & Chau, K.-W. (2019). An enhanced extreme learning machine model for river flow forecasting: State-of-the-art, practical applications in water resource engineering area and future research direction. Journal of Hydrology, 569, 387-408.
- Yerima, R., Suleiman, B., & Bolorunduro, P. (2018). Trends in physicochemical parameters in Dadin-Kowa reservoir Gombe, Nigeria. Trends Sci. Technol, 3, 207-214.


