The Integrated Quality Analysis of Sediment on BanjirKanal Barat River as the Basis of River Environment Management
Haeruddin 1 * , Supriharyono 1 , Abdul Ghofar1 and Arif Rahman1
http://dx.doi.org/10.12944/CWE.14.3.14
Copy the following to cite this article:
Haeruddin, Supriharyono,Ghofar A, Rahman A. The Integrated Quality Analysis of Sediment on BanjirKanal Barat River as the Basis of River Environment Management. Curr World Environ 2019; 14(3). DOI:http://dx.doi.org/10.12944/CWE.14.3.14
Copy the following to cite this URL:
Haeruddin, Supriharyono,Ghofar A, Rahman A. The Integrated Quality Analysis of Sediment on BanjirKanal Barat River as the Basis of River Environment Management. Curr World Environ 2019; 14(3). Available from: https://bit.ly/2tb7gS1
Download article (pdf) Citation Manager Publish History


Introduction
Banjir Kanal Barat (BKB) River is part of the Garang River Basin. The upstream of the BKB River is located at the foothill of Mount Ungaran, Semarang Regency, Central Java, Indonesia, which includes three Districts, i.e. West Ungaran District, East Ungaran District and Bergas District (Central Bureau of Statistics, Semarang Regency, 2019). The area around BKB watershed majority is used for settlements, industrial areas and drinking water sources (Haeruddin et al., 2019). Many studies have been conducted in order to investigate the pollution status of BKB River (Ministry of Marine and Fisheries Affair, 2015; Ujianti, 2016; Haeruddin et al., 2019). Furthermore, it is reported that the studies are still limited to the concentration of metals in river water and the biodiversity of water biota in the river (Tungka, 2016; Haeruddin et al., 2016), as well those are still in partial studies. Also, Harding (1992) states that the determination of the quality of the marine environment can only be determined by evaluating various responses to measurement results with integrated analysis. Chapman and Long (1983) in Long and Chapman (1985) reported that the analysis of the quality of modern sediments should involve three categories of measurement, i.e. concentration of material in sediment, the toxicity of sediment samples and changes in the structure of benthic biota communities. Palma et al., (2014) states that the study of pollution in aquatic ecosystems is not limited to analysis of the level of pollution in water, but must also be accompanied by studies of the accumulation of pollutants in sediments, in addition to analysing the ecotoxicological status.
The measurement of material concentration in sediments may not show biological damage; therefore, it is necessary to determine the extent and nature contaminations while biota community structure analysis can confuse. Moreover, this will result in the changes in community structure due to predation, competition, climate change and other various non-pollutant factors. Measurement of benthic community structure alone is not appropriate to be used for determining the effects of contaminants. The presence or absence of specific biota may occur due to the effect of toxic chemicals, changes in various environmental factors (temperature, salinity, dissolved oxygen), diversity of sediment texture and water depth or various biological factors such as the recruitment cycle, predation and competition (Long and Chapman, 1985). Integrated analysis of sediments which has been carried out by Chapman (1988) is limited to determining whether that area polluted or not, without determining the level of pollution while the integrated analysis used by delVallset al. (1999) is limited to determining the amount of pollution based on the value of the RTR (Ratio to Reference).
Sediment analysis conducted by the Marine Pollution Studies Laboratory, University of California (2003) in the B Street / Broadway area of ​​Piers, Down Town, Anchorage and Switzer Creek, San Diego, seems to be more developed. Since here, the researcher are involving pollutant bioaccumulation as a component of integrated analysis. The utilisation of integrated sediment analysis had been used up to now, as currently used by Hyland et al., (2000), Haeruddin (2006); Buruaem et al., (2013), Palma et al., (2014), and Barhoumiet al., (2016).
This study was conducted to analyse the concentration of metals in the BKB river sediments, their toxicity to benthic biota and the effects of various metals on benthic abundance and biodiversity. While the pollution status evaluation has been carried out with an integrated approach between three components, i.e. the concentration and toxicity of metals in sediments and their effects on biodiversity and abundance of benthic biota, this study is beneficial related to the management of aquatic resources (biota and environment) of the BKB river.
Materials and Methods
The research material used sediment, which was taken from three observation stations in the BKB River, which three replications at each site. Station I (110.396985; -6.955531) is located in the river under the north arterial bridge, YosSoedarsoStreet, which crosses the BKB River. Station II (110.401309; -6.996587) is located in the river around South GedungBatu I Street. Station III (110.387141; -7.017227) is located in the river under the bridge around Soeharto’s Monument on Kali Pancur. Reference station (110.402476; -7.154663) is located at upper Kali Garangriver, nearly from the bridge across Kali Garang on GedongSongo and Prambanan Street. (Map enclosed in Appendix 1). Sediments were collected using grabs coated with Teflon to prevent sediment contamination from grab metal material. Sediment samples were collected from the surface substrate to a maximum depth of 5 cm. Sediment collected is put into a dark PE plastic bag, in order to protect against photooxidation. Then it was placed in a cooler box and transported to the laboratory. In the laboratory, the sediment is preserved by cooling in a freezer at a temperature of -10 to -15ºC.
Heavy metal concentrations in sediments were analysed according to the APHA, AWWA and WPCF (1989) methods. The types of heavy metals analysed including, i.e. Total Cr, Cd, Pb, Cu, Fe, Mn and Zn. Chemical analysis methods of metal content in the sediments observed were carried out by the spectrophotometric method using the Atomic Absorption Spectrophotometer (APHA, AWWA and WPCF (1989) Part 3000).
Analysis of heavy metal concentrations was conducted as soon as possible. However, if it is not possible to be analysed, the sediment samples are being remained in the freezer, until the analysis is completed to be done. In order to prevent the effect of organic material in sediments on metal analysis, then it is used the method of nitric acid hydrochloric acid digestion (APHA, AWWA and WPCF Part 3030 E, 1989), with the exception for metal Pb. While for the Pb digestion is used nitric acid.
Benthos community structure observed included the abundance of macrozoobenthos (individuals /m3), and the diversity of benthic samples obtained from each location, including Shannon-Wiener diversity index analysis. Identification of various species of benthic animals found at each observation station was identified using various key books of identification, i,e, Dance (1977), Eisenberg (1979), Abbott (1991) and Durma (1998).
Toxicity testing is achieved in order to observe the effect of sediment and pore water on aquatic biota. These include a test of growth inhibition of Chlorella sp algae in pore water sediments (CEA, 1993) and toxicity test of reburial failure of blood clams (Anadaragranosa Linn.) in substrate/sediment (CEA, 1995). Toxicity tests were conducted at room temperature conditions with a continuous level of dark lighting, according to the condition of sediment in nature, which is always dark.
The difference of results between in the polluted and uncontaminated (reference) areas are examined using a comparative test, mainly appropriate statistical test. For this purpose, the data obtained is checked first, to find out whether the variance of data is homogeneous and spread according to normal distribution or not. If the data is heterogeneous with abnormal distribution, the data then be analysed using a nonparametric test.
The statistical hypothesis to be tested in the comparison test is:
H0: no significant difference is observed between the variables observed at the reference location and the suspect polluted locations
H1: there is a significant difference in the observed variables at the reference location from the suspect polluted location.
The tests had been carried out at a confidence interval (a) a maximum of 5%. Moreover, the results of the analysis of variance then were summarised in the form of Table Integrated Component Analysis. If the analysis of variance on the three components (sediment chemistry, macrozoobenthos community structure, and toxicity) showed significant differences to the reference, then the columns of sediment chemistry, toxicity tests and biota community structure were given a positive sign. Contrary, when it is not significantly different, it is recognised as a negative sign. Compilation of response classification tables is needed for more comfortable with making conclusions from the data obtained. In the situation where all columns in 1 row are positive, it can be concluded that the area within the observed station has been polluted and has affected on individuals (causing reburial failure in blood clams s and interfering with algal growth) and population (changes in the structure of the biota community). Therefore, such appropriate treatment is needed in order to improve the condition of the watershed, which is being monitored. As well, the damage can not continue with more severe consequences, such as the extinction of specific biota.
If the positive column is only the structure of the biota community, while the other two columns are negative, it can be concluded that the change in the structure of the biota community in the area being monitored may be caused by natural factors such as competition and predation. When only the chemical concentration column which is positive is an understanding that the concentration of the material contained in the contaminated area is higher than the regeneration station, but it has not yet affected individuals or populations of marine biota. Therefore this area must be given attention by the monitoring/authority. The conclusions of each situation as described above, are summarised in Table 1.
Table 1: Criteria for the status of sediment pollution based on the results of integrated sediment analysis methods
|
No. |
C |
T |
SK |
Conclusion |
|
1. |
- |
- |
- |
Sediment quality is still good and does not cause adverse effects on individuals or aquatic biota communities |
|
2. |
+ |
- |
- |
Sediment is contaminated but has not caused adverse effects on individuals or aquatic biota communities |
|
3 |
+ |
+ |
- |
Sediment is polluted and has adverse effects on individuals but has not disrupted the structure of aquatic biota communities |
|
4. |
+ |
+ |
+ |
Sediment is polluted and has adverse effects on individuals and disrupts the structure of aquatic biota communities |
Information:
C = Pollutant Concentration
SK = Benthic community structure
T = Toxicity
+ = significantly different from the reference station
- = not significantly different from the reference station
Ratios between data from the more contaminated sites and from an uncontaminated reference site namely Ratio to Reference (RTR) value is a technique that will be used to rank level of contamination for each site.
Results and Discussion
Results
Sampling results at three sediment sampling stations in the BKB River show metal concentrations: Cadmium, Chromium, Copper, Iron, Manganese, Lead and Zinc as presented in Table 2.
Table 2: Concentrations (mg/kg) of various types of metals in the BKB River sediments
|
Station |
Attribute |
Cd |
Cr |
Cu |
Fe |
Mn |
Pb |
Zn |
|
I |
Average |
0.05 |
7.33 |
32.27 |
2098.10 |
238.18 |
18.78 |
0.05 |
|
|
SD |
0.00 |
1.45 |
8.36 |
41.78 |
217.61 |
27.13 |
0.00 |
|
II |
Average |
0.05 |
8.34 |
29.70 |
2060.43 |
7.18 |
56.23 |
0.05 |
|
|
SD |
0.00 |
2.65 |
5.05 |
202.97 |
10.15 |
39.10 |
0.00 |
|
III |
Average |
0.05 |
6.37 |
34.90 |
2010.73 |
1.00 |
35.62 |
0.05 |
|
|
SD |
0.00 |
1.18 |
10.78 |
140.87 |
1.65 |
41.09 |
0.00 |
|
Reference |
Average |
0.05 |
5.58 |
27.02 |
1470.74 |
1.30 |
18.82 |
0.05 |
|
|
SD |
0.00 |
4.78 |
3.54 |
131.55 |
0.77 |
9.67 |
0.00 |
Table 2 shows that the highest average concentrations of Iron and Manganese in the BKB river are located at station I. Cadmium and Zinc concentrations were not detected, so a value of half of the accuracy of the instrument was taken (Gilliom and Helsel, 1986). The highest Cu concentration is found at Station III. While the highest Chromium and Lead concentrations are obtained at Station II, chrome and Lead are thought to have originated from activities in the Simongan industrial area (Haeruddin, 2019). In the Simongan industrial area, several activities have the potential to produce waste containing Cr and Pb metals, namely the pharmaceutical industry, the steel pipe industry, the spinning industry and various industries (www.media.neliti.com). Chromium, Iron and Manganese lowest are found at station III, and the lowest concentration of lead is at station I. Almost all types of metal, except the lowest Pb at station III. This is suspected that there is relationship location of the station, between the upper and its surrounded location, which may be no source of metal contamination.
The study of the structure of the macrozoobenthos community has been carried out in order to find out the individual's abundance, diversity, evenness and the existence of dominance of one type from another. The results of sampling in the field are presented in Table 3. Table 3 shows that the highest abundance of macrozoobenthos individuals is at station I. The highest diversity index is at station III. The lowest abundance of macrozoobenthos is at station III, the lowest average diversity, evenness and dominance indexes are found at the reference station.
Types of macrozoobenthos found consist of 9 genera, namely: Brotiacostula, Melanianigritna, Melanoidesacrea, Melanoidesdactylus, Pantherinal Melanoides, Melanoidessp, Melanoides tuberculate, Terebiagranifera, and Turitellacommus. The most abundant types are Melanoidesacrea and Turitellacommunis while the rarest types are Pantherinalmelanoides and Melanoides sp.
Table 3: Individual Abundance Average and Standard Deviation (ind / m3), Diversity Index, Evenness Index and Macrozoobenthos Dominance Index at the observation station
|
Station |
Benchmark |
Abundance |
Diversity |
Evenness |
Dominancy |
|
measure |
|
Index |
Index |
Index |
|
|
I |
Average |
5.053 |
0.86 |
0.39 |
0.49 |
|
SD |
2720.39 |
0.11 |
0.05 |
0.08 |
|
|
II |
Average |
613 |
1.02 |
0.47 |
0.38 |
|
SD |
234 |
0.06 |
0.03 |
0.04 |
|
|
III |
Average |
467 |
1.08 |
0.49 |
0.37 |
|
SD |
227 |
0.08 |
0.04 |
0.02 |
|
|
Reference |
Average |
575 |
0.82 |
0.37 |
0.29 |
|
SD |
21 |
0.08 |
0.04 |
0.01 |
Toxicity test results to determine the percentage of growth inhibition of algae population Chlorella sp. in pore water sediment and reburial failure of blood clams (Anadaragranosa Linn.) exposed to sediments collected from the BKB are presented in Table 4.
Table 4: Percentage (%) of growth inhibition of Chlorella sp. in pore water sediments and reburial failure of blood cockles in sediment
|
Stasiun |
Growth Inhibition (%) |
Reburial Failure (%) |
||
|
Average |
SD |
Average |
SD |
|
|
1 |
79.79 |
0.21 |
36.67 |
5.77 |
|
2 |
90.72 |
0.24 |
60.00 |
10.00 |
|
3 |
69.62 |
0.19 |
20.00 |
0.00 |
|
Reference |
61.37 |
0.78 |
33 |
5.77 |
Table 4 shows the growth inhibition (%) of algae Chlorellasp in the pore water toxicity test and reburial failure (%) blood cockles (Anadaragranosa Linn.). The highest average algae growth inhibition (%) occurred at station II and the lowest at the reference station. Likewise, the highest average reburial failure (%) occurred at station II and the lowest at the reference station.
Comparative tests between reference stations with stations I, II and III for the chemical components of sediments, macrozoobenthos community structure and sediment toxicity tests were performed with Mann-Whitney nonparametric test statistics because the data did not spread according to the normal distribution and the variance of the data was not homogeneous. Comparative test results between the reference stations with stations I, II and III for the chemical components of the sediment, macrozoobenthos community structure and sediment toxicity tests show the results as presented in Table 5.
Table 5: Comparative test results of sediment chemical components, community structure and toxicity tests with Mann Whitney's nonparametric test statistics
|
Tests Components |
Reference vs Station I |
Reference vs Station II |
Reference vs Station III |
Conclusions |
|
Sediment Chemistry |
ns |
ns |
ns |
Quality of sediments at all stations are still good |
|
Community structure |
ns |
ns |
ns |
Community structure at all stations are still good |
|
Toxicity Tests |
ns |
ns |
ns |
Pore waters of sediment and sediment at all stations have not endangered yet on the survival and growth of aquatic biota |
Note: ns = test results are not significantly different at the level of confidence (α) 5%.
Although overall variables are not significantly different, the results of comparisons made between each constituent element of the integrated analysis component show that in the chemical components of the sediment, the iron (Fe) elements at stations I, II and III show significant differences with the reference station.
In the community structure component, the abundance of macrozoobenthos at station I is significantly different from the reference station, the diversity index element is significantly different from the reference station at stations II and III, the evenness index element is significantly different from the reference station at stations II and III and the elements of the dominance index are different manifest with reference stations on stations I, II and III.
In the toxicity test component, an inhibition of algal growth Chlorella sp. significantly different from the reference stations on stations I, II and III. In the reburial failure, the blood cockles is significantly different from the reference station at station II. If tabulated per element for each component, the results are shown in Table 6.
Table 6: Comparative test results of each constituent element of sediment chemical components, community structure and toxicity.
|
Components Test |
Reference vs Station I |
Reference vs Station II |
Reference vs Station III |
|
Sediment Chemistry |
|||
|
Cd |
ns |
ns |
ns |
|
Cr |
ns |
ns |
ns |
|
Cu |
ns |
ns |
ns |
|
Fe |
s |
s |
s |
|
Mn |
ns |
ns |
ns |
|
Pb |
ns |
ns |
ns |
|
Zn |
ns |
ns |
ns |
|
Community Structure |
|||
|
Abundance |
s |
ns |
ns |
|
Diversity Index |
ns |
s |
s |
|
Evenness Index |
ns |
s |
s |
|
Dominance Index |
s |
s |
s |
|
Toxicity Test |
|||
|
Inhibition of algal growth |
s |
s |
s |
|
Reburial failure |
ns |
s |
ns |
Note: s/ns = test results are different / not significantly different at the level of confidence (α) 5%.
The data in Table 6 above shows that the chemical components of sediments, community structure and sediment toxicity do not show significant differences at the level of confidence (α) of 5%, so it can be suggested that the three components analyzed are not significantly different, so it can be concluded that the quality of BKB river sediments studied are still good and have not caused adverse effects on individuals or water biota communities. Even so, RTR (Table 6) indicates that the ratio for all test components is generally higher than 1. An RTR that is more than 1 indicates that the test component's value exceeds the reference value.RTR values of sediment chemical components, community structure and toxicity tests on each station showed in Table 7.
Table 7: RTR values of sediment chemical components, community structure and toxicity tests
|
Tests Components |
Reference vs Station I |
Reference vs Station II |
Reference vs Station III |
|
Sediment Chemistry |
31.15 |
5.82 |
4.47 |
|
Community structure |
3.14 |
1.22 |
1.00 |
|
Toxicity Tests |
1.21 |
1.65 |
0.87 |
|
RTR average |
11.83 |
2,90 |
2,11 |
Discussion
Iron, Manganese, Lead, Cadmium, Zinc and Mercury; metalloids such as Arsenic and Selenium are types of pollutants that can be found in sediments (US-EPA, 2004). In this research, several types of metals were found in the BKB River sediments with varying concentrations.
The concentration of Cadmium detected in sediments (0.04 - 0.05 mg Cd/kg sediment) is lower than the results of research Haq et al., (2017) in the Plumbon River sediment (1.35-2.47 mg Cd/kg sediment), Mangkang, Semarang, but still higher than the results of research by Nadia et al., (2017) in the Cisadane River, Banten Province (<0.02 mg Cd/ g of sediment). The measured cadmium concentration is still within the limits of natural concentration. US-EPA states that the natural concentration of cadmium is 32 mg Cd/kg of sediment (Zarba, 1989). The concentration Cd detected in sediments is under concentration Canadian Freshwater Sediment Guidelines (0.6 mg Cd/kg) (Burton, Jr., 2002).
Lead concentration detected in sediments are 18.78 - 56.2 mg Pb/kg of sediment or still below natural concentrations according to the US-EPA limit of 132 mg Pb/kg of sediment (Zarba, 1989), and still below and upper the limit concentration of Pbaccording to Canadian Freshwater Sediment Guidelines (35 mg Pb/kg) (Burton, Jr., 2002). The measured Pb concentration is higher than the research results of Haq et al., (2017) in the Plumbon River sediment (3.92 - 7.34 mg Pb / kg of sediment), Mangkang, Semarang, but still higher than the results of the research of Nadia et al., (2017) in the Cisadane River, Banten Province (<0.01 - 52.8 mg Pb / kg of sediment).
The concentration of Cu detected in sediments (29.70 - 34.90 mg Cu/kg of sediment) is higher than the results of Haeruddin's research (2006) in the Plumbon River (0.11 - 0.20 mg Cu / kg of sediment) and Wakak River (0.08 - 0.14 mg Cu / kg of sediment). The concentration of Cu detected in the BSB River sediments observed was still far below the natural concentration according to US-EPA of 136 mg Cu/kg of sediment (Zarba, 1989), and still below the limit concentration of Cu according to Canadian Freshwater Sediment Guidelines (35,7 mg Pb/kg) (Burton, Jr., 2002).
Total chromium concentration measured in sediments (6.37 - 8.34 mg Cr/kg sediment) is higher than the results of Haeruddin (2006) research in Plumbon River (1.19 - 1.55 mg Cr/ kg sediment) and Wakka River (1.06 - 1.21 mg Cr/kg of sediment). The total chromium concentration measured in sediment is still below the Dutch Quality Standards for Metals in Sediments (IADC/CEDA 1997) quality standard of 26 μg /g, and still far below the limit concentration Chromium according to Canadian Freshwater Sediment Guidelines (37.3 mg Cr/kg) (Burton, Jr., 2002).
Measured zinc concentration in sediments (0.05 - 0.07 mg Zn/kg sediment) is lower than the results of Haeruddin's research (2006) in the Plumbon River (0.71 - 1.82 mg Zn/kg sediment) and Wakak River (0.89 - 1.17 mg Zn/kg sediment). The measured zinc concentration in the BKB River sediments is still far below the US-EPA natural limit of 760 mg Zn/kg of sediment (Zarba, 1989) and still below the limit concentration of zinc according to Canadian Freshwater Sediment Guidelines (123 mg Zn/kg) (Burton, Jr., 2002). Measured iron concentration in sediments (2010.73 - 2098.10 mg Fe/kg of sediment) is much higher than the results of Wibowo research (2017) in the Kutai Lama River (84.948 mg Fe/kg of sediment) but still lower than the results of research Putri et al., (2019) in the Surabaya River (16.944,24 – 83.096,96 mg Fe/kg of sediment). Iron is the highest concentration of metal in the BKB river sediments. Montalvo et al., (2014) found a similar thing in the Palizadariver in Mexico. High iron concentrations from upstream to BKB river mouth indicate that the source of iron comes from rock erosion.
Measured Manganese concentration in sediments (1.00 – 238/118 mg Mn/kg of sediment) is much lower than the results of Wibowo (2017) research in the Kutai Lama River (25.079 mg Mn/kg of sediment), but is still lower than the research results of Putri et al., (2019) in the Surabaya River (16.944,24 – 83.096,96 mg Fe/kg of sediment). Manganese concentrations that are only high in the estuary are thought to be related to the texture of the sediment. Sediments in estuaries have smaller grain sizes and higher organic carbon. Fine sediments have a higher percentage of organic matter than coarse sediments, which is related to calm environmental conditions, thus allowing the deposition of clay and silt followed by the accumulation of organic matter into the waters (Wood, 1987).
Concentration of metals in all station, except Cd and Zn, are still high than concentration of metals in reference station. Concentration of Cd and Zn are not detected in reference station. Various factors cause differences in metal concentrations detected in BKB river sediment. Meador et al., (1998) states that there are at least four factors that can affect the distribution of pollutants in the sediment namely: the granular size of sediment, redox status, organic carbon and bioturbation. Togwell (1979) states that the concentration of heavy metals in the mud (sediments), not only determined by the process of weathering rocks but also influenced by the concentration of organic matter, mineral composition as well as the size (particles) of the mud deposits. Organic carbon and clay content are the dominant factors governing metal bonds in sediments (de Groot et al., 1974, Fletcher et al., 1994; Williams et al., 1994; Khaledian et al., 2017).
The metals contained in sediments can come from various sources, namely: rock erosion, iron ore and other metal mining industry activities, metal utilization and metal compounds in industry, burning fossil fuels and leaching from landfills (Forster and Whitmann, 1984; Armstrong-Altrinet al., 2015; Ramos-Vasquez et al., 2017; Zhang et al., 2017; Islam et al., 2018). Metal sources detected in the BKB River are thought to originate from rock erosion in addition to the use of metals and metal compounds in industry, burning fossil fuels and leaching from landfills. Chapra, (1997) states that most heavy metals occur naturally, but there are also other sources such as human activities that will affect the amount of heavy metal content in a waters besides that most metals are conservative, which means the value of heavy metal content is not influenced by the process of biodegradation, photolysis and radioactive decay.
Analysis of the structure of the macrozoobenthos community at the study site showed that the macrozoobenthos animals were most abundant at the station I (5.053 individuals / m3) and most rarely found at station III (467 individuals/m3). The most abundant types of macrozoobenthos are Melanoidesacrea and Turitellacommunis, while the rarest types are Pantherinal, Melanoides and Melanoides sp. Melanoidesacrea belongs to the Thiaridae genus consisting of 151 species (www, conchology.be. Accessed 30 July 2019). This snail is a freshwater snail, while Turitellacommunis is a type of gastropod which is commonly found in the muddy gravel substrate (Yonge, 1946 in plymsea.ac.uk accessed 30 July 2019). The highest diversity and evenness were obtained at station III. This station is the most upstream station of the three stations observed, while the lowest diversity and evenness were found at the reference station. When associated with metal concentrations, metal concentrations at station III tend to be the lowest, especially for Total Chrome, Iron and Manganese metals. Only the highest Cu concentration at this station. Haeruddin (2006) found a tendency that the higher the pollution index at a sediment sampling site, the lower the level of macrozoobenthos diversity at that location. Sediment pollution index with the macrozoobenthos diversity index is negatively correlated with the correlation coefficient value of -0.78 at the real level of 0.7%.
The results of the toxicity test showed that the highest growth inhibition of algae Chlorellasp exposed to pore water and reburial failure blood cockles into the sediment substrate collected from various stations were found at Station II. Inhibition of algal growth and reburial failure themselves in the lowest blood cockles found at the reference station. Inhibition of the growth of algae Chlorellasp and reburial failure themselves in blood cockles sediments allegedly closely related to the quality of the sediment. Research by Haeruddin et al., (2017) shows that blood clams exposed in sediments from the Wakak-Plumbon estuary that are suspected to be contaminated and from Pulau Panjang that have not been contaminated, do not show failure in attempting to reburial failure after 48 hours of exposure. Differences only occur in adaptation time before immersing itself. Blood cockles generally require more time for adaptation before immersing themselves in sediments originating from the Wakak-Plumbon Estuary than from PulauPanjang. Haeruddin's research results (2006) show that sediment toxicity increases with higher sediment pollution.
Although there is a tendency that the sediment quality at all stations observed tends to be lower than the sediment quality at the reference station, the results of the integrated analysis of 3 components: sediment chemistry, macrozoobenthos community structure and toxicity test results all indicate that between the 3 stations observed in the BSB Canal and suspected pollution, all components do not show a real difference with the reference station at 5% real level. Thus it can be said that the quality of the three station sediments observed in the BKB Canal is still in good condition. However, with the increasing number of types of activities and the increasing volume of waste generated by each of these activities, it is necessary to take preventive steps to maintain the condition of the sediment so that it remains good, and can support the survival of living things that make use of it.
Conclusions and Recommendations
The results of this study indicate that although the metal concentrations contained in the BKB river sediment are quite high, the quality of the sediment is still in good condition. Metal concentrations in sediments, macrozoobenthos community structure and sediment toxicity were not significantly different from those of uncontaminated reference stations, Although RTR values for metal concentrations in sediments, macrozoobenthos community structure and sediment toxicity were exceeded 1 in general. Nevertheless, it is necessary to take preventive steps to maintain the condition of the sediment so that it remains good, and can support the survival of living things that make use of it.
Acknowledgements
We are very grateful to the Dean of the Faculty of Fisheries and Marine Sciences, Diponegoro University, who has funded this research based on Research Contract No. ….. Sincerely thank is also addressed to all friends and reviewers, who have assisted this study.
References
- [CBS] Central Bureau of Statistics. Regency of Semarang in figures 2018. Central Bureau of Statistics Semarang Regency. Central Java. Indonesia. (2019: 2-4)
- Haeruddin, Purnomo, P.W., Febrianto, S. Pollution Load, Assimilation Capacity and Pollution Status of BanjirKanal Barat Estuary. Semarang City. Central Java. Journal of Natural Resources and Environmental Management (2019). Vol. 4: 24-35.
- Ministry of Marine and Fisheries Affairs (MMFA). Final Report on Compilation of Pollution Profiles (Coastal City of Semarang), Directorate General of Marine, Coastal and Small Islands, Work Unit of the Coastal and Ocean Directorate. (2015)
- Ujianti, R M D., Anggoro, S., Bambang, A.N., and Purwanti, F. Water quality of the Garang River, Semarang, Central Java, Indonesia based on the government regulation standard, IOP Conf, Series: Journal of Physics: Conf, Series 1025 (2018) 012037 doi :10,1088/1742-6596/1025/1/012037.
- Tungka, A.W., Haeruddin and Ain, C. Nitrate and Orthophosphate Concentrations at the BanjirKanal Barat Estuary and its Relation to the Abundance of Phytoplankton Harmful Algae Blooms (HABs), Saintek Fisheries. (2016). Vol.12 No.1: 40-46, http://ejournal.undip.ac.id/index.php/saintek.
- Haeruddin, Ain, C., danTungka, A.W. The Dependency Analysis of Abundance of Phytoplankton toward The Concentration of Nitrate, Phosphate, TSS and Several Environmental Factors Other In BanjirKanal River, Semarang City, Central Java, Article presented in the 3rd National Simposium on Marine Science and Fisheries at Hasanuddin University, Makassar, South Celebes, Indonesia. (2016)
- Harding L.E. Measures of marine environmental quality, Marine Poll. Bull. 25 1992 (1-4) : 23 – 27.
- Long E.R., Chapman P.M. A sediment quality triad : measures of sediment contamination, toxicity and infaunal community composition in Puget Sound,Mar. Poll. Bull. (1985) 16 : 405 – 415.
- Palma, P., Ledo, L., Soares, S., Barbosa, S.R., Alvarenga, P. Spatial and temporal variability of the water and sediments quality in the Alqueve Reservoir (Guadiana Bsin, southern Portugal), Science of The Total Environment (2014) 470-471: 780 – 790. https://doi.org/10.1016/j.scitotenv.2013.10.035https://doi.org/10.1016/j.scitotenv.2013.10.035.
- Chapman P.M. Marine sediment toxicity tests. in : Lichtenberg J.J., Winter, F.A., Weber C.I., Fradkin, L., editor. Chemical and biological characterization of sludge sediments, dredge spoils and drilling muds. ASTM STP 976. (ed by :). ASTM, Philadelphia. Pp. 391 – 402. (1988)
- del Valls T.A., Forja J.M., Parra A.G. An integrative study of environmental quality sediments from the Bay of Cadiz,Ecotoxicology and Env. Restoration(1999) 2 (1) : 26 – 33.
- Hyland, J.L., Balthis, W.L., Hackney, C.T., Posey, M. Sediment quality of North Carolina estuaries: an integrative assessment of sediment contamination, toxicity, and condition of benthic fauna, Journal of Aquatic Ecosystem Stress and Recovery, December 2000, Volume 8, Issue 2, pp 107–124. DOI: 10.1023/A:1011464609142.
- Haeruddin. Sediment Integrated Analysis in determining status of Plumbon-Wakak estuary, Kendal, Central Java, Dissertation in the Postgraduate Program, Bogor Agricultural University. (2006)
- Buruaem, LM., de Castro I.B., Hortellani M.A, Taniguchi, S., Filmann, G., Sasaki, S.T., Petti, M.A.V., de Souza Sarkis, J.E., Bicego, M.C., Maranho, L.A., Davanso, M.B., Nonato, E.F., Cesar, A., Costa-Latufo, L.V., de Souza Abessa, D.M. Integrated quality assessment of sediments from harbour areas in Santos-São Vicente Estuarine System, Southern Brazil, Estuarine, Coastal and Shelf Science. (2013) Volume 130. Pages 179-18. https://doi.org/10.1016/j.ecss.2013.06.006.
- Barhoumi, B., Elbarhoumi, A., Clérandeau, C., AlRawabdeh, A., Atyaoui, A.M., Touil, S., Driss, M. R., Cachot, J. Using an Integrated Approach to Assess the Sediment Quality of an Mediterranean Lagoon, the Bizerte Lagoon (Tunisia). Ecotoxicology. August 2016, Volume 25, Issue 6, pp 1082–110. DOI : 10.1007/s10646 01616644.
- APHA, AWWA and WPCF. Standard methods for the examination of water and wastewater. American Public Health Association, Washington DC. (1989)
- Dance S.P. The encyclopedia of shells, 2nd edition, Blanford Press, Pooled, Dorset., (1977).
- Eisenberg, J.M.A. Collector guide to seashell of the world, Bloomsburry Book, London. (1979)
- Abbott, R.T. Seashells of southeast Asia, Tynron Press, Scotland. (1991)
- Durma, B. Indonesian snails and shells, PT. SaranaGraha, Jakarta. (1998)
- [CEA] Canadian Executing Agency. A generic protocol for conducting tropical acute toxicity tests with fish and invertebrates, ASEAN-Canada Cooperative Programmes on Marine Sciences-Phase II (CPMS-II), Canadian International Development Agency. (1993).
- [CEA] Canadian Executing Agency. Draft protocol for sublethal toxicity tests using tropical marine organisms, ASEAN-Canada Cooperative Programmes on Marine Sciences-Phase II (CPMS-II), Canadian International Development Agency. (1995)
- Gilliom, R.J., and Helsel, D.R. 1 Estimation of Distributional Parameters for Censored Trace Level Water Quality Data: 1. Estimation Techniques. Water Resources Research. (1986)Volume 2, Issue2,Pages 135-146.https://doi.org/10.1029/WR022i002p00135.
- Nadia N., Rudiyanti, S., Haeruddin. Spatial distribution of heavy metal Pb and Cd in water column and sediment in the waters of MuaraCisadane, Banten. Journal Of Maquares(2017). Volume 6, No. 4.pages: 455-462. Website: http://ejournal-s1.undip.ac.id/index.php/maquares.
- [IAC/CEDA} International Association for Drilling. Dutch Quality Standards for Metals in Sediments. (1997)
- Wibowo, M. Study of water quality and bottom sediment of Kutai Lama River, KutaiKartanegara Regency, as initial consideration of dredging plan, PresipitationJournal.(2017) Vol.14, No. 1.
- Putri, A.D.N., Utomo, Y., and Kusumaningrum, I.K. Analysis of iron content in water bodies and sediment of Surabaya River, Online Journal.um.ac.id. (2019). article9DDDDOCF28402 C9321E3874ABD10D776 (3).pdf .
- Wood MS. Subtidal ecology. Edward Arnold Pty Limited Australia. 1987.
- Meador JP, Robisch PA, Clark RC, Ernest DW. Element in fish and sediment from the Pacific Coast of the United States : result from the national benthic surveillance project. Marine Poll. Bull. 1998. Vol. 37 (1-2) : 56 – 66.
- Togwell AJ. Sources of heavy metals contamination in a river-lake system. Environ. Pollut. England (1979)(18) : 131 – 138.
- Montalvo, C., Aguilar, C.A., Amador, L.E., Cer’on, J.G., Cer’on, R.M., Anguebes, F., and Cordova, A.V. Metal Contents in Sediments (Cd, Cu, Mg, Fe, Mn) as indicators of Pollution of Palizada River Mexico, Environment and Pollution (2014) Vol. 3 No. 4: 89 – 98.
- de Groot A.J., Salomons, W. and Allersma, E. Processes affecting heavy metals in estuarine sediments. In JD Burton and PS Liss (eds), EstuarineChemistry, 131–53, London, Academic Press. (1976)
- Khaledian, Y., Pereira, P., Brevik, E.C., Pundyte, N., Paliulis, D. The influence of organic carbon and pH on heavy metal, Potassium and Magnesium levels in Lithuanian Podzols. Land and Degradation and Development, (2017). Vol. 28, Issue I: 345 – 354. http://doi.org/10.1002/idr.2638/.
- Armstrong-Altrin, J.S., Machain-Castillo, M.L, Rosales-Hoz, L., Caranza-Edward, A. Sanchez-Cabeza, J.A, Ruis-Fernandez, A.C. Provenance and depositional history of continental slope sediments in the Soutwestern Gulf of Mexico unraveled by Geochemical Analysis.Continent, Shelf Resources (2015) 95: 15 -26.
- Ramos-Vasquez, M.A., Armstrong-Altrin, J.S., Rosales-Hoz, L., Machain-Castillo, M.L., Caranza-Edward, A. Geochemistry of deep sea sediment in two core retrieved at the mouth of the Coatzacoalcos River delta, Western Gulfof Mexico, Mexico, Arab, J. Geoscie. (2017) 10(6): 148.
- Zhang, G., Bai J., Xiao, R., Zhao, Q., Jia J., Cui B., Liu X. Heavy metals fraction and ecological risk asssesmentin sediments, from urban, rural and reclamation affected rivers of the Pearl River Estuary, China, Chemosphere (2017) 184: 278 – 288.
- Islam, M.S., Hossain, M.B., Matin, A., Sarker, M.S.I. Assesment of heavy metal pollution, distribution and source apportionment in the sediment of Feni River estuary, Bangladesh. Chemosphere (2018) 202: 25 -32. https://doi.org/10.1016/j.chemosphere.2018.03.077
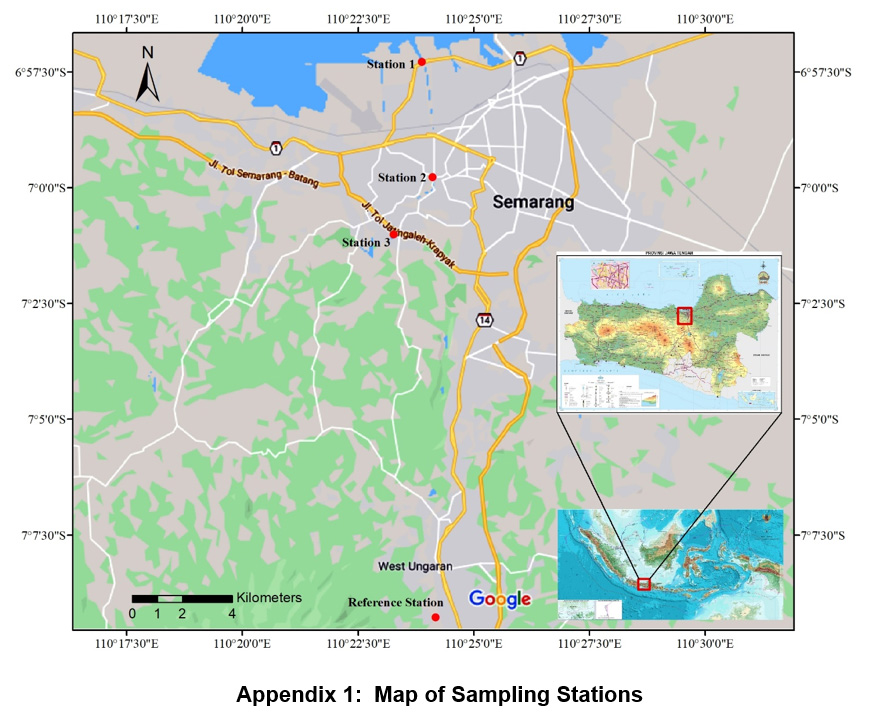 |
Appendix 1: Map of Sampling Stations Click here to vire Image |


