
Introduction
Sacha Inchi (Plukenetia volubilis L.) is a well-known plant by multiple names, including inca nut, mountain peanut, sacha peanut, or Inca peanut. In Malaysia, the cultivation of Sacha Inchi has been introduced by the Rubber Industry Smallholders Development Authority (RISDA) with the aim of boosting farmers’ income, as this plant offers numerous potential benefits (Zakaria et al. ,2022). This plant originates from the Amazon region in South America. Sacha Inchi is identified by its star-shaped fruit capsule, which changes in color from green to blackish brown as it ripens. Within these capsules, there are edible oval seeds that are dark brown with the size of 1.5–2 cm. These seeds are abundant in lipids, making up 35-60% of their composition, and they are high in omega-3, omega-6, and omega-9 fatty acids. Furthermore, these seeds encompass proteins, comprising approximately 25-30% of their content, which include vital amino acids like cysteine, tyrosine, threonine, and tryptophan. Moreover, these seeds offer vitamin E, flavonoids, minerals, polyphenols, and the shell contains higher amounts of alpha-tocopherol and omega-6 and omega-3 fatty acid levels that are comparable. Additionally, the Sacha Inchi leaves might serve as a source of saponins, terpenoids and phenolic compounds, specifically flavonoids (Wang et al., 2018).
According to Wuttisin et al., (2020), the Sacha Inchi leaves are extensively grown in Thailand, and the resulting products, particularly tea and have already made their way into the market which demonstrating significant antioxidant properties. Additionally, Sacha Inchi leaves are potentially endowed with natural antioxidant capabilities due to their abundance of bioactive components, such as polyphenols (Kittibunchakul et al., 2022). The quantity of polyphenols present in the tea plant can fluctuate, contingent on the specific cultivar, climatic conditions and the methods used during processing (Karaosmanoglu & Kilmartin, 2015). Nevertheless, there is insufficient data available regarding the impact of tea processing stages on chemical compositions and bioactive properties (Ding et al.,2022).
Green tea (unfermented), oolong tea (partially fermented) and black tea (fermented) are the three basic forms of tea based on the degree of fermentation (Wang et.al, 2008). The increasing popularity of tea can be linked to its delightful taste, enchanting aroma, revitalizing effects and the multitude of health benefits it offers (Hu et al., 2014). Green tea is rich in bioactive substances, with polyphenols being the primary component, renowned for their antioxidant characteristics (Trisha et al., 2022). According to Yuan et al., (2011) green tea displays notably elevated levels of polyphenols, whereas black tea contains a comparatively lower number of polyphenols.
In general, tea is subjected to a processing method aimed at deactivating polyphenol oxidase in freshly harvested leaves, thereby preventing enzymatic oxidation (Haw et. al. 2020). The steam blanching procedure may contribute to preserving the tea’s colour, polyphenolic content, and antioxidant characteristics (Ahmed & Stepp, 2012). Apart from steam blanching, the drying temperature plays a crucial role in shaping the quality of tea. The use of intense heat during the drying process has the potential to trigger the activation of low molecular weight natural antioxidants and at the same time, deactivate enzymes that might have caused deterioration, ultimately improving the tea’s overall quality (Jeong et al. 2004).
The leaves of Sacha Inchi have been widely processed into herbal teas which have many benefits to human health (Silalahi., 2022). Despite the various benefits associated with its consumption, the utilization of Sacha Inchi leaves remains restricted or limited. There is potential for exploring the use of Sacha Inchi leaves in tea production to enhance their utilization and added value. Therefore, the objective of the present investigation was to examine the phenolic compounds, examine the free radical scavenging capabilities, and determine the α-Glucosidase inhibition characteristics of extracts derived from green, oolong, and black Sacha Inchi.
Materials and Methods
Fresh Sacha Inchi leaves were harvested from the Sacha Inchi plantation. The selection process involved picking vibrant, undamaged and fully matured leaves. These freshly plucked Sacha Inchi leaves were then carefully stored in airtight plastic containers to prevent any bruising or wilting. Following this, the leaves were thoroughly washed with clean water and underwent further processing tailored to the desired final product. Additionally, commercial green tea, oolong tea, black tea (all containing Camellia sinensis), and dried stevia were procured from the local market.
Production of green tea, oolong tea and black tea from Sacha Inchi leaves
Tea is typically categorized as green, black, or oolong, depending on the processing method it undergoes and the extent of enzymatic oxidation. Green tea is left unfermented, oolong tea is partially fermented and black tea is fully fermented. This study involved the creation of three tea varieties: green tea, oolong tea, and black tea, all made from Sacha Inchi leaves using distinct processing methods and varying degrees of fermentation. It’s essential to recognize that tea consists of a blend of leaves from the Camellia sinensis plant (Awadalla et al. 2011). Thus, in this study, the tea composition was formulated using the following ratios; 50% of commercial Green, Oolong and Black tea (which consists of Camellia sinensis plant), 45% Sacha Inchi tea leaves (Green, Oolong and Black) and 5 % of the commercial dried stevia.
Processing of Green Tea from Sacha Inchi leaves
The production of green tea in this study was modified from the method outlined in KC et al. (2020) with some modifications. The process included steaming Sacha Inchi leaves at 100°C for 14 minutes, followed by a 15-minute cooling period and a subsequent 15-minute hand-rolling phase. After this, the leaves were dried using an electric oven (Luxury Electric Deck Oven, China) at 110°C for 20 minutes.
A final 30-minute rolling session was carried out after drying to complete the green tea production. The weight of the final product was recorded, and it was vacuum-sealed using an Automatic Heavy Duty Double Chambers Vacuum Packaging Machine (Taiwan). For the analytical process, a mixture was prepared by combining 50% commercial green tea, 45% Sacha Inchi green tea leaves, and 5% commercial dried stevia.
Processing of Oolong tea from Sacha Inchi leaves
Oolong tea of Sacha Inchi was produced according to Wong et al. (2022) with some modifications. The process began with an indoor withering of Sacha Inchi leaves. During this step, the leaves were evenly laid out on a tray and left at room temperature for 2 hours, with two turning treatments applied. Subsequently, the leaves underwent parching and were then subjected to fermentation in a laboratory dryer (Floor Model Laboratory Dryers FDD-720, Malaysia) at 25ºC for 2 hours. Following fermentation, the leaves were dried in an electric oven (Luxury Electric Deck Oven, China) at 160ºC for 20 minutes.
Next, they were manually rolled for a duration of 5 minutes and then subjected to additional drying in the same electric oven at 80ºC for another 20 minutes. Finally, the leaves were hand-rolled once more, completing the production of oolong tea. The final weight was recorded and the oolong tea was vacuum-sealed to maintain its moisture content, utilizing an Automatic Heavy Duty Double Chambers Vacuum Packaging Machine (Jaw Feng Machinery, Taiwan). For analytical purposes, a blend was created, consisting of 50% commercial oolong tea, 45% Sacha Inchi oolong tea leaves, and 5% commercial dried stevia.
Processing of Black tea from Sacha Inchi Leaves
Black tea of Sacha Inchi leaves was produced according to KC et al., (2020) with some modifications. To begin, Sacha Inchi leaves were thinly spread on trays for indoor withering at room temperature for a period of 2 hours. Following this, the leaves were hand-rolled on a tabletop surface for a duration of 25-35 minutes. The fermentation process occurred in a laboratory dryer (Floor Model Laboratory Dryers FDD-720, Malaysia) for 14 hours at 25ºC.
After the completion of fermentation, additional rolling took place, followed by drying in an electric oven (Luxury Electric Deck Oven, China) at 200ºC for 4 minutes. Once all these steps were concluded, the black tea derived from Sacha Inchi leaves was produced and vacuum-sealed using Vacuum Packaging Machine (Jaw Feng Machinery, Taiwan). For the purpose of analysis, a blend was prepared, combining 50% of commercial black tea, 45% Sacha Inchi black tea leaves, and 5% of commercially dried stevia.
Preparation of extracts from Sacha Inchi tea
Maceration procedure was performed by weighing 30g of tea sample consisting of ratios; (50 commercial tea: 45 Sacha Inchi leaves: 5 commercial dried stevia) respectively and 300 ml of ethyl acetate (Milan, 2011). The mixture was placed in a 500 mL beaker and left undisturbed in the dark at room temperature for 24 hours. Subsequently, the supernatants were collected following filtration via a Grade 1 Whatman® qualitative filter paper once the extracts had been filtered. Pooled supernatants were condensed in a rotary evaporator (Heidolph Rotary Evaporator, German) at 60°C under reduced pressure. Before being used, the extract was collected and kept in a chiller at 5°C.
Phenolic Compounds analysis of Green, Oolong and Black Sacha Inchi Tea Extract
Preparation of Standard Solution
The preparation of gallic acid and quercetin standard solutions followed the method outlined by Shirazi et al., (2014). Gallic acid (1 g) was dissolved in 100 ml of methanol, yielding a 1% concentration of Gallic acid. This solution is referred to as the standard 1 solution. Similarly, 1 g of Quercetin was dissolved in 100 ml of methanol to obtain a 1% concentration of Quercetin in a standard 2 solution.
Determination of Total Phenolic Content (TPC)
The Folin-Ciocalteu colorimetric method was used to determine the TPC in Sacha Inchi extracts as outlined by Fuad et al., (2020). Initially, a stock solution of the extracts was produced at a concentration of 1 mg/mL in ethyl acetate. Subsequently, this solution was diluted to create three distinct concentrations (125, 250, and 500 µg/mL). A microplate reader (Thermo Scientific™️ Multiskan™️ FC Microplate Photometer, Finland) was used and the absorbance was measured at a wavelength of 765 nm. The total phenolic content was calculated using the gallic acid standard curve, and the findings were represented as milligrams of gallic acid equivalent per microgram of extract. The calibration equation for gallic acid was y = 0.8409x + 0.0094 (R2 = 0.9991). Every experiment was carried out in triplicate.
Determination of Total Flavonoid Content (TFC)
The TFC of the sample was measured using the techniques outlined in Milan (2011) and Maheshkumar (2012) studies. Extract stock solution was produced at 1 mg/mL in ethyl acetate and was then diluted to various concentrations (125, 250, and 500 µg/mL). A microplate reader (Thermo Scientific™️ Multiskan™️ FC Microplate Photometer, Finland) was used to measure the absorbance at 415 nm. The result was expressed as mg of quercetin equivalents per microgram of extract. The calibration equation for gallic acid was y = 0.4316x + 0.0449 (R2 = 0.9973). All the experiments were performed in triplicate.
Analysis of Tannins Concentration
Preparation and Standardization of the Reagent
Two primary reagents employed for tannin quantification were indigo carmine and potassium permanganate (KMnO4). The indigo carmine powder (6 g) was dissolved in 500 mL of distilled water to produce the indigo carmine solution and subsequently boiling it. After the mixture had cooled, 50 ml of a 95% H2SO4 solution was added. The resultant mixture was then diluted with distilled water until reaching a total volume of 1 litre, followed by filtration using qualitative filter paper. Potassium permanganate powder (3.3 g) were dissolved in 1 L of distilled water to get a KMnO4 solution. Titration was used to standardize the solution with oxalic acid. The standardization resulted in 1 ml of 0.1 N KMnO4 equalling 0.0067g oxalic acid (Wangiyana et al., 2021).
Qualitative Estimation of Tannin
A preliminary examination of Sacha Inchi tea samples containing tannins was conducted. To identify the presence of tannins, three drops of an aqueous solution with a 5% (w/v) ferric chloride content were added to 1 mL of green tea, oolong tea, and black tea made from Sacha Inchi leaves. The greenish precipitate formation was observed which indicates the presence of tannins in the samples. Following a positive test result, a quantitative evaluation of tannin content was performed (Wangiyana et al., 2021).
Quantitative Estimation of Tannin
Tea samples were titrated for quantitative estimation with a standard KMnO4 solution, based on Wangiyana et al., (2021) with some modifications. A stock solution of the extracts was initially formulated in ethyl acetate at a concentration of 1 mg/mL. Subsequently, this solution was diluted into three distinct concentrations. (125, 250 and 500 µg/mL). In a 250 mL conical flask, 2.5 mL of tea samples and 2.5 mL of indigo carmine solution were mixed. The resulting mixture was then diluted with 75 mL of distilled water. Next, titration was performed with standardized KMnO4 until the solution’s blue colour turned to green. A few additional drops were added until the solution turned golden yellow. The indigo carmine solution (2.5 mL) was mixed with 75 mL of distilled water for the blank test, followed by titration. To ensure accuracy, triplicate samples were used for evaluation.
The tannin content (T%) in the sample was determined using the following formula:
V represents the volume of 0.1 N KMnO4 utilized for titrating the sample (mL), V0 denotes the volume of 0.1 N KMnO4 employed for titrating the blank sample (mL), 0.004157 signifies the tannins equivalent in 1 mL of 0.1 N KMnO4, 2.5 corresponds to the volume of the extraction solvent used for the sacha inchi tea extract sample (mL), g represents the mass of the sample selected for analysis (g), and 80 indicates the total sample volume (mL).
Free radical scavenging activity analysis of green tea, oolong tea and black tea extract
2,2-Diphenyl-1-Picrylhydrazyl (DPPH) assay
The assessment of free radical scavenging activity in the sample extract was conducted using a method adapted by Mensor et al., (2001) and Dudonne et al., (2009). Initially, a 1 mg/mL stock solution of the extracts in ethyl acetate was produced. Following that, the solution was diluted into six different concentrations (15.625, 31.25, 62.5, 125, 250, 500, and 1000 µg/mL). For the control, a blank solution comprising ethanol and DPPH was prepared. In a 96-well plate, 150 µL of a 0.1 mM DPPH working solution was added to the sample (50 µL), followed by thorough mixing. The plate was then placed in a dark environment and left undisturbed for 30 minutes. Afterward, the change in absorbance was measured at 515 nm using a microplate reader (Thermo Scientific™️ Multiskan™️ FC Microplate Photometer, Finland).
Ascorbic acid served as the standard in this analysis. Three sets of measurements were conducted and the percentage of DPPH scavenging activity was determined using the following formula, where Ac represents the absorbance of the control and As stands for the absorbance of the sample.

α-Glucosidase
Preparation of phosphate buffer (0.1 M phosphate buffer pH 7.0)
Following the procedure outlined by Xing et al. (2017) with some modification, the preparation of a 0.1 M phosphate buffer at pH 7.0 entailed the following steps: Initially, 35.5 grams of sodium phosphate dibasic were dissolved in 500 mL of distilled water, resulting in the creation of a 0.5 M sodium phosphate dibasic stock solution. Subsequently, by diluting 80 mL of the 0.5 M sodium phosphate dibasic solution with distilled water to a final volume of 400 mL, a 0.1 M sodium phosphate dibasic solution was produced. Approximately 30 grams of anhydrous sodium phosphate monobasic were dissolved in 500 mL of distilled water to produce the 0.5 M sodium phosphate monobasic stock solution. Then, the 0.5 M sodium phosphate monobasic stock solution was then diluted with distilled water to a final volume of 150 mL resulting in a 0.1 M sodium phosphate monobasic solution. The 0.1 M phosphate buffer solution was prepared by adding the required amount of 0.1 M sodium phosphate monobasic solution to the 0.1 M sodium phosphate dibasic solution until a pH of 7.0 was reached.
Preparation of p-nitrophenyl-α-D-glucopyranoside (PNPG) solution
The preparation of PNPG solution was based on a method by Mohiuddin et al., (2016) with some modification. The PNPG powder (0.0023g) was dissolved in 15 mL of phosphate buffer (0.1 M, pH 7.0).
Preparation of α-Glucosidase solution (0.2 unit/mL)
Preparation of working solution for 25 µl was used in each well which calculated according to the following formula:
Where M1 is the concentration of alpha glucosidase enzyme which is 100 unit/mL, V1Volume needs to be taken from 100 unit/mL, M2 is the concentration for working solution and V2 is the total volume needed of 96 well plates.
α-Glucosidase Inhibition Activity Assay
According to Wan Nadilah et al. (2019), the glucose-lowering ability of the leaf extracts was evaluated by determining their α-glucosidase inhibitory activity. The assay of α-Glucosidase inhibitory activity in green tea, oolong tea, and black tea was conducted following the procedure outlined by Yilmazer-Musa et al. (2012) with some modification. A stock solution of the extracts was initially formulated at a concentration of 1 mg/mL in ethyl acetate.
Subsequently, this solution was then diluted to obtain seven different concentrations (15.625, 31.25, 62.5, 125, 250, 500, and 1000 µg/mL). The 100 unit/mL of α-glucosidase from S. cerevisiae was diluted into 0.2 unit/mL in 3 µL phosphate buffer (pH 7.0). The sample extract (10 μL) and acarbose as a control were added into well A and B. Followed 10 μL distilled water (well B-H) and 10 μL of serial dilution. The reaction was initiated by introducing 25 μL of pNPG as the substrate, along with 50 μL of phosphate buffer, and 25 μL of α-Glucosidase into all wells of a 96-well plate. These plates were then incubated at 37°C for a duration of 30 minutes.
Following this initial incubation, the plate underwent an additional 15-minute incubation at 37°C, and the reaction was halted by adding 100 μL of 1 M sodium carbonate (Na2CO3). The progress of the reaction was monitored by measuring the change in absorbance at 410 nm using a microplate reader. The α-Glucosidase inhibitory activity was presented as inhibition percent and was calculated as in the equation below:
where GI represents α-Glucosidase inhibition, where As and Ac correspond to the absorbance of the sample and control, respectively. Each incubation process was repeated three times, and the presented results represent the average value along with the standard deviation derived from these triplicate determinations.
Statistical Analysis
The total phenolic content, total flavonoid content, free radical scavenging activity (DPPH) and α-Glucosidase inhibition activity assay were performed in triplicate for each sample and concentration. The measurements obtained were averaged to calculate the mean value for each assay. The results were presented with ± standard deviation (SD) and statistical analysis was conducted using Statistical Package for the Social Science (SPSS) Software version 20.0. A two-way (ANOVA) and appropriate comparison were made using the Duncan test with significance defined as (p<0.05).
Results and Discussion
Total Phenolic Content (TPC)
Phenolic compounds primarily encompass flavonoids, phenolic acids, stilbenes, coumarins, and tannins, primarily serving as antioxidants that counteract free radicals (Islam et al., 2015). The assessment of total phenolic content was conducted through the utilization of the Folin-Ciocalteu method, which relies on colorimetry and reactions of electron transfer between the Folin-Ciocalteu reagent and phenolic compounds. The total phenolic content in the ethyl acetate-extracted tea samples fell within the range of 1.61 to 2.10 µg GAE/mL, in different concentration as indicated in Table 1.
Table 1: Total Phenolic Content (µg GAE/g extract) of Sacha Inchi tea extract.
|
Concentration (µg /mL) |
Sample |
||
|
Green Tea |
Oolong Tea |
Black Tea |
|
|
125 250 500 |
1.84 ± 0.02aA 2.00 ± 0.01aB 2.10 ± 0.01aC |
1.75 ± 0.00bA 1.85 ± 0.00bB 1.98 ± 0.01bC |
1.61 ± 0.01cA 1.75 ± 0.01cB 1.83 ± 0.01cC |
The data is presented as the mean ± SD based on triplicate determinations (n=3). Mean values within the same row with distinct lowercase letters are statistically significant (p<0.05).
Mean values within the same column with different uppercase letters are statistically significant (p<0.05).
The content of phenolic compounds varied substantially (p > 0.05) between concentrations at different type of tea which the subset represents in lowercase alphabet (a, b, c) and between the same group of tea sample with different concentration which represent uppercase subset (A, B, C). From the table, at concentration 500µg/mL, green tea, oolong tea and black tea has the highest value of phenolic content (2.10 ± 0.007 µg GAE/mL, 1.98 ± 0.013 µg GAE/mL, and 1.83 ± 0.005 µg GAE/mL). This finding was aligned with study reported by Abdullah & Mazlan, (2020) indicate that all green tea samples have a higher phenolic content in comparison to herbal teas. The variations in these findings can be traced back to the prevalence of catechins, the principal phenolic compound in green tea samples. Furthermore, elements like the initial leaf processing before drying, the region of cultivation, and the environmental conditions can also impact catechin levels. Moreover, the time of year, climate, and maturity of the tea leaves significantly affect the overall composition of the teas.
According to Yang & Liu (2013), the overall phenolic content in tea is typically high across various types of tea. Nevertheless, specific varieties, such as green tea and black tea, are recognized for their elevated phenolic content compared to other types. Green tea, in particular, boasts a wealth of phenolic compounds, most notably catechins like epigallocatechin, epigallocatechin gallate (EGCG), epicatechin and epicatechin gallate. These catechins serve as potent antioxidants and green tea’s antioxidants play a significant role in the numerous health benefits linked with it. Black tea, on the other hand, also contains phenolic compounds, but its oxidation process during production diminishes the overall catechin content compared to green tea. Nonetheless, black tea still retains substantial quantities of other phenolic compounds, such as theaflavins and thearubigins, which contribute to its distinctive flavor and health attributes.
Other types of tea, such as white tea and oolong tea, also contain phenolic compounds but in varying amounts. White tea, being minimally processed, retains a relatively higher phenolic content, whereas oolong tea is in between green tea and black tea in terms of phenolic levels. It’s important to highlight that the exact phenolic content can fluctuate due to factors such as tea quality, cultivation conditions, processing methods, and brewing approaches. Nevertheless, all types of tea are generally acknowledged as valuable sources of phenolic compounds (Yang & Liu, 2013). According to Roslan et al., (2020), rapid and brief heating may result in the deactivation of oxidative enzymes, resulting in greater retention of phenolic chemicals and thus the increased of TPC in the black tea could be linked to the generation of phenolic compounds through non-enzymatic conversions among phenolic molecules, likely influenced by the presence of phenolic precursors.
Total Flavonoids Content (TFC)
Tea is versatile in its consumption, with options ranging from brewing loose leaves or using tea bags to opting for ready-to-drink varieties. Additionally, tea extracts can be tailored to suit various needs, coming in a range of physical forms. These tea extracts come in various forms, including liquid preparations like potent infusions, semi-solid concentrates, and purified catechins. Potent infusions are produced by steeping tea leaves in alcohol/water mixtures, while semi-solid concentrates are produced by reducing the water content of the strong infusion to about 20-25%. For tea extract powders or dry extracts, concentrated infusions are transformed through spray drying, leading to solid concentrations of 40-50% (Wang et al., 2000). According to Dwyer & Peterson, (2013), flavonoids belong to a group of phenolic compounds commonly encountered in a variety of plant-based foods, with tea standing out for its notably high levels of these compounds. Among the non-nutrient bioactive components in our diets, flavonoids are well-known for their exceptional diversity and wide distribution.
Table 2 shows the TFC in samples of green, oolong and black tea extract of Sacha Inchi leaves. The range of the total flavonoid content extracted with ethyl acetate was 0.56 to 3.23 µg QE/mL. Tea fermentation includes the oxidation of flavonoids within tea leaves, which is triggered by the release of intracellular polyphenol oxidase. This transformation impacts both the color and flavor profile of the final product, as well as the composition of flavonoids. Catechins are sensitive to oxidation during the manufacture of black tea, resulting in its distinctive color and flavor characteristics that define black tea. Traditionally, the pigments in black tea have been classified into orange-hued theaflavins. Consequently, in black tea, four primary theaflavins are discernible: theaflavin 3′-gallate, theaflavin 3,3′-digallate, theaflavin and theaflavin 3-gallate. These theaflavins emerge from the interaction between quinones originating from a foundational catechin and a gallocatechin (Dwyer & Peterson, 2013).
Table 2: Total flavonoids content (µg QE/g of extract) of Sacha Inchi tea extracts
|
Concentration (µg /mL) |
Sample |
||
|
Green Tea |
Oolong Tea |
Black Tea |
|
|
125 250 500 |
0.94 ± 0.03aB 1.38 ± 0.07aB 3.23 ± 0.20aA |
0.56 ± 0.06bB 0.88 ± 0.04aB 2.49 ± 0.29aA |
0.82 ± 0.03aB 1.05 ± 0.16aB 3.17 ± 0.07aA |
The data is presented as the mean ± SD based on triplicate determinations (n=3). Mean values within the same row with distinct lowercase letters are statistically significant (p<0.05).
Mean values within the same column with different uppercase letters are statistically significant (p<0.05).
Furthermore, green tea is unfermented, whereas oolong tea is partially fermented and black tea is fermented. According to Fang et al. (2021), distinct tea processing procedures result in different biochemical changes inside the tea leaves. The tea production process involves both enzymatic and nonenzymatic transformations, leading to intricate alterations in tea flavonoids and resulting in the differentiation of tea varieties (Peterson et al., 2005). Throughout all stages of tea production, including withering, ‘killing-green, ‘shaking-green,’ yellowing, fermentation, microbiological fermentation, and drying, significant modifications occur in tea flavonoids. Tea leaves typically contain catechins as the predominant flavonoids, but their concentrations vary notably among different types of tea. Factors like oxygen levels, system pH, temperature, and moisture content during tea processing contribute to the variability in tea catechin profiles (Ananingsih et al., 2013). As a result, tea catechins can undergo substantial alterations influenced by temperature, time, and their interaction (Ye et al., 2018).
In this study, quercetin served as the standard due to its prevalence as the most common flavanol typically found in tea. The results indicated that green tea exhibited the highest flavonoid content (3.23 ± 0.197 µg QE/mL), slightly surpassing that of black tea (3.17 ± 0.074 µg QE/mL). However, these findings contrasted with those reported by Rahman et al. (2021), where a notable disparity in the average flavonoid content between black and green tea was observed. In their study, black tea displayed an average flavonoid content of 61.82 mg QE/g dry extract, whereas green tea had a lower average of 31.85 mg QE/g dry extract. This divergence can be attributed to the fact that green tea undergoes minimal processing and oxidation, which helps preserve its flavonoid content. Notably, green tea predominantly contains key flavonoids such as catechins, including epicatechin, epicatechin gallate, epigallocatechin, and epigallocatechin gallate (EGCG). In contrast, black tea experiences significant oxidation during its production, resulting in changes to the composition and quantity of flavonoids. The primary flavonoids in black tea are theaflavins and thearubigins, and their levels are influenced by the degree of oxidation (Bag et al., 2022).
Tannin Concentration (%)
Qualitative estimation of tannin
Based on Table 3, all the sample shows positive results on qualitative estimation where (+) indicates that there was tannin present in the tea extract. Tannins are high molecular weight phenolic polymers commonly present in grapes, tea, and legumes (Saxena et al., 2013). Studies have shown that phytoconstituents classified as tannins have significant antioxidant activity, and certain tannins also demonstrate radical scavenging abilities (Ghosh,2015).
Table 3: Tannin screening of Sacha Inchi Tea Extract.
|
Concentration (µg /mL) |
Sample |
||
|
Green Tea |
Oolong Tea |
Black Tea |
|
|
125 250 500 |
+ + + |
+ + + |
+ + + |
Positive (+) signifies the detection of tannin in the tea extract.
Quantitative estimation of
tannin
Tannin is an essential component that has been recognized as a quality standard element in traditional tea preparations (KC et al., 2020). Plant tannins are polyphenols that are divided into condensed and hydrolysable tannins with a wide structural diversity and high polymerization levels (Kardel et al., 2013). The tannin concentrations in several forms of traditional tea, such as green tea, oolong tea, and black tea, vary significantly. These varying tannin levels are responsible for the distinct tastes and flavours found in each type of conventional tea product (Khasnabis et al., 2015).
Table 4: Tannin concentration in tea sample (%).
|
Concentration (µg /mL) |
Sample |
||
|
Green Tea |
Oolong Tea |
Black Tea |
|
|
125 250 500 |
20.54 ± 0.00cB 25.36 ± 0.00cA 13.16 ± 1.43aC |
41.07 ± 10.27bA 32.12 ± 2.93bA 18.10 ± 1.43bB |
54.76 ± 5.93aA 45.64 ± 5.07aA 27.15 ± 2.47cB |
The data is presented as the mean ± SD based on triplicate determinations (n=3). Mean values within the same row with distinct lowercase letters are statistically significant (p<0.05).
Mean values within the same column with different uppercase letters are statistically significant (p<0.05).
Tannins, a widely distributed class of phenolic antioxidants, can be found in various plant sources like barks, leaves, fruits, and vegetables. These compounds have gained attention for their potential medicinal and therapeutic properties. Among them, tannic acid stands out as an exceptional compound with robust antioxidant capabilities. The structural feature responsible for tannic acid’s antioxidant properties consists of its hydrophobic central core, which includes glucose, and its hydrophilic shell. Tannic acid is characterized by ten galloyl groups and is water-soluble. Phenolic compounds are renowned for their antioxidant activity due to their redox properties, enabling them to counteract oxygen radicals by supplying hydrogen to neutralize reactive oxygen species (Ghosh, 2015).
Based on Table 4, black tea exhibited the highest tannin concentration, ranging from 27.15% to 54.76%, in contrast to oolong and green tea extracts, with green tea containing the lowest tannin content. These findings align with those of Khasnabis et al. (2015), who reported the tannin concentration of black tea ranges from 11.76% to 15.14%, with an average of 13.36%. Tea tannin, a type of polyphenol found in tea leaves, differs from tannic acid. Additionally, Kaur et al. (2015) noted that the total polyphenol content in green tea (3.066±1.911 mg TAE/g) was significantly higher than that in black tea (0.72±0.55 mg TAE/g) (p<0.05).
Furthermore, the findings clearly indicate that black tea exhibits the highest tannin content among oolong and green teas. Nevertheless, when concentration is taken into account, a reverse relationship emerges, with greater concentration leading to a reduction in tannin levels within the tea. Hence, the extraction of tannins into the tea infusion can also be influenced by the brewing time and temperature. According to Khasnabis et al., (2015), although black tea tannins offer potential health advantages, it is crucial to exercise restraint in consumption. Excessive tannin intake can lead to adverse effects, including interference with iron absorption and inducing digestive discomfort in individuals with heightened sensitivity.
Hence, the quantity of tannin in tea has a substantial influence on its coloration. As stated by Ghosh, (2015), there is a direct relationship between tea’s blackness and the concentration of tannins it contains. In other words, teas with a darker colour have a greater tannin concentration. Tannins are polyphenolic compounds present in a variety of plant-based foods and drinks, including tea. Tannins contribute to black tea’s distinctive astringency and bitterness. The higher tannin content in black tea is primarily due to the processing methods involved in its production. During the production of black tea, tea leaves undergo withering, rolling, and oxidation. The oxidation process, in particular, leads to the formation and accumulation of tannins in the tea leaves.
Kumari and Jain (2015) have reported that the consumption of food products containing tannins differs across regions. Their research indicates that in India, the intake of tannins ranges between 1.5 and 2.5 grams per day, varying by the area. On the other hand, the United States has an average tannin consumption of around 1 gram per day. It is worth nothing that a daily tannin intake within the range of 1.5-2.5 grams is considered safe and does not lead to any adverse effects.
Furthermore, according to the study by Bone & Mills (2013), excessive amounts of tannins result in an intensified astringency on mucous membranes, which can cause irritation. However, prolonged consumption of tannins inhibits the activity of digestive enzymes, particularly the membrane-bound enzymes found on the mucous membranes of the small intestine. In conclusion, variations in tannin levels among various tea samples can likely be attributed to differences in the manufacturing process, tea leaf aging, or variations in climate and soil conditions (Khasnabis et al., 2015).
Free radical Scavenging Activity (2.2-diphenyl-1-picrylhydrazyl, DPPH)
The levels of free radical scavenging activity were assessed at various concentrations, ranging from 15.625 to 500 μg/mL for Sacha Inchi tea extract (green tea, oolong tea and black tea) (Figure 1). The DPPH radical is a stable free radical that is widely used to test antioxidant activity (Chen et al., 2012). According to Silalahi, (2022), the leaf of Sacha Inchi extract contains phenolic compounds, steroids, and terpenoids that are associated to their ability as antioxidants which are declared equivalent to ascorbic acid ranging from 59.31 to 97.76 EAA/g, while DPPH test value is 62.8% to 88.3%.
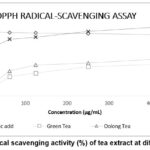 |
Figure 1: DPPH radical scavenging activity (%) of tea extract at different concertation. |
Figure 1 shows that the most significant DPPH radical scavenging activity was found in black, oolong, and green tea extract samples at 500 μg/mL with the percentages of scavenging activity at 89.4, 48.9 and 41.4% respectively. Thus, the black tea demonstrated the widest range of percentage scavenging activity (20.4 to 89.4% μg/mL) of all three tea samples at five different concentrations and the data was higher than the finding of Silalahi, (2022).
Moreover, Kumar et al. (2014) revealed that Sacha Inchi extracts from Quito, Ecuador exhibited DPPH radical scavenging activities of up to 19% within a 1.0 mL sample. However, in the present study of DPPH show that the percentage of scavenging activity was higher starting from 9.1% up to 89.4% at concentration 15.625 μg/mL to 500 μg/mL respectively compared to the study done by Kumar et al. (2014). The variation is due to the temperature, storage method, and chemicals used for extraction all have a major influence on Sacha Inchi’s ability to operate as an antioxidant (Silalahi, 2022).
According to Meng et al., (2018), the increase in antioxidant activity observed in samples exposed to higher drying temperatures may be attributed to the release of phytochemical compounds that were previously bound, which occurs as cellular components degrade and new compounds with enhanced antioxidant properties are formed. This phenomenon could explain the heightened antioxidant activity observed in samples dried at elevated temperatures, as seen in the case of Sacha Inchi black tea dried at 200°C. Furthermore, the increase in trend by the black tea sample was correlate by Chen et al., (2012) as the percentage scavenging rate of black tea from Camellia sinensis L. increased with increasing concentration (1.7 μg/mL to 13.3 μg/mL). However, in this study three types of tea were produced from Sacha Inchi leaves. Thus, different concentrations from tea extract were compared to make comparative evaluation on the effect on antioxidants and black tea extract shown higher percentages of scavenging activity range from 20.4 to 89.4% μg/mL.
α-Glucosidase Inhibition Activity Assay
Glycosidases, enzymes that break glycosidic bonds in polysaccharides and glycoconjugates, play important roles in a variety of biological activities, including carbohydrate digestion, lysosomal glycoconjugate breakdown, and glycoprotein post-translational modification. Within carbohydrate digestion, α-Amylase and α-Glucosidase play pivotal roles. α-Amylase facilitates the conversion of dietary carbohydrates into disaccharides. Subsequently, α-Glucosidase operates in the small intestine, breaking down disaccharides (e.g., maltose and sucrose) into monosaccharides like glucose before absorption. Inhibiting α-Amylase and α-Glucosidase can moderate the pace of starch digestion, thereby mitigating the post-meal rise in blood glucose levels. Consequently, these enzymes, α-Amylase and α-Glucosidase, represent potential targets for managing postprandial hyperglycaemia in individuals with type 2 diabetes (Xu & Wang, 2019).
In the present study, α-Glucosidase inhibition activity on Sacha Inchi tea extract of green, oolong and black tea at different concentrations was identified. In Figure 2, it is evident that black, oolong, and green tea extracts exhibited a more effective inhibitory impact on α-Glucosidase, with inhibitory rates of 95%, 95%, and 92%, respectively. At a concentration of 15.625 µg/mL, these rates exceeded those of acarbose (90%). However, green tea extract shows that up to concentration 250 µg/mL (83%) it is more potent than acarbose with same concentration compared to oolong and black tea extract which showed their inhibitory effects were only potent than acarbose up to 125 µg/mL of concentration.
Tea is well-known for its multiple health advantages. Several studies have shown that black tea has anticancer and antioxidative characteristics, aids in lowering postprandial blood sugar and blood fat levels, decreases the risk of cardiovascular disease, and helps to prevent obesity (Pan et al., 2013). As reported by Li et al. (2013), the primary constituents found in black tea include polyphenols, flavanol or flavone compounds, theaflavins, and thearubigins. Additionally, research conducted by Zhang et al. (2010) has indicated that the majority of α-Glucosidase inhibitors derived from tea are tea polyphenols or polyphenol polymers.
Therefore, as indicated by the results presented in Figure 2, it is possible that black tea could serve as an inhibitor of α-Glucosidase, potentially opening avenues for the development of innovative medications and functional foods aimed at diabetes prevention and treatment. However, it’s worth noting that the trend in percentage inhibition of green, oolong, and black tea extracts using ethyl acetate from Sacha Inchi tea leaves, as observed in the results, contradicts the findings of Huang et al. (2013). Their study reported an increase in the inhibitory effect of the ethyl acetate fraction from 20.43% to 84.77% with an increase in concentration from 4 μg/mL to 125 μg/mL.
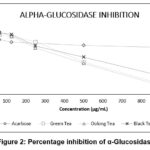 |
Figure 2: Percentage inhibition of α-Glucosidase |
Hence, this discovery highlights the significance of assessing the concentration in various tea types consumed to confirm their potency surpasses that of acarbose, and potentially making them viable alternatives to pharmaceutical inhibitors designed for glycosidase hydrolase enzymes.
Conclusion
In conclusion, different methods of processing of Sacha Inchi leaves showed distinct impacts on the phenolic components, free radical scavenging activity and inhibitory capabilities of green, oolong, and black Sacha Inchi tea. The green tea extract of Sacha Inchi showed high total phenolic content and total flavonoid content at concentration 500µg/mL with a value of 2.10 ± 0.01 µg GAE/mL and 3.23 ± 0.20 µg QE/mL respectively. Meanwhile, at a concentration of 500g/mL, Sacha Inchi black tea demonstrated strong antioxidant activity by DPPH with radical scavenging activity (%) (89.4 ± 0.002). Besides while the inhibitory effects of green tea extract surpass those of acarbose at concentrations up to 250 µg/mL (83%), the inhibitory effects of oolong and black tea extract was only stronger than acarbose up to 125 µg/mL, indicating a relatively lower potency. However, green, oolong and black Sacha Inchi extract exhibit higher potency compared to acarbose at certain concentration and have the potential to serve as viable substitutes for pharmaceutical inhibitors targeting the glycosidase hydrolase enzymes. The findings of this study might support the notion that underutilized Sacha Inchi leaves are captivating sources of potential natural antioxidants.
Acknowledgement
This study was funded by a research grant – University Research Fund (UniSZA/2022/DPU2.0/11).
Conflict of Interest
All authors declare no conflict of interest.
References
- Abdullah SS, Mazlan AN. Quantification of polyphenols and antioxidant activity in several herbal and green tea products in Malaysia. Materials Today: Proceedings. 2010;31. doi:10.1016/j.matpr.2020.12.1083.
CrossRef - Ahmed S, Stepp JR. Green tea: The plants, processing, manufacturing and production. Tea in health and disease prevention. 2013:19-31.
CrossRef - Ananingsih VK, Sharma A, Zhou W. Green tea catechins during food processing and storage: A review on stability and detection. Food Research International. 2013;50(2):469–479. doi:10.1016/j.foodres.2011.03.004.
CrossRef - Awadalla H, Ragab M, Bassuoni M, Fayed M, Abbas M. A pilot study of the role of green tea use on Oral Health. International Journal of Dental Hygiene. 2011;9(2):110–116. doi:10.1111/j.1601-5037.2009.00440. x.
CrossRef - Bag S, Mondal A, Majumder A, Banik A. Tea and its phytochemicals: Hidden Health Benefits & modulation of signaling Cascade by Phytochemicals. Food Chemistry. 2022;371:131098. doi:10.1016/j.foodchem.2021.131098.
CrossRef - Bone K, Mills S. Principles of herbal pharmacology. Principles and practice of phytotherapy: Modern herbal medicine.2013:17-82.
CrossRef - Chen H, Zhang Y, Lu X, Qu Z. Comparative studies on the physicochemical and antioxidant properties of different tea extracts. Journal of Food Science and Technology. 2011;49(3):356–361. doi:10.1007/s13197-011-0291-6.
CrossRef - Ding J, Mei S, Gao L, Wang Q, Ma H, Chen X. Tea processing steps affect chemical compositions, enzyme activities, and antioxidant and anti‐inflammatory activities of coffee leaves. Food Frontiers. 2022;3(3):505–516. doi:10.1002/fft2.136.
CrossRef - Dudonné S, Vitrac X, Coutière P, Woillez M, Mérillon JM. Comparative study of antioxidant properties and total phenolic content of 30 plant extracts of industrial interest using DPPH, ABTS, FRAP, SOD, and Orac assays. Journal of Agricultural and Food Chemistry. 2009;57(5):1768–1774. doi:10.1021/jf803011r.
CrossRef - Dwyer JT, Peterson J. Tea and flavonoids: Where we are, where to go next. The American Journal of Clinical Nutrition. 2013;98(6). doi:10.3945/ajcn.113.059584.
CrossRef - Fang ZT, Yang WT, Li CY, Li D, Dong Z, Xu HR, Ye JH, Zheng XQ, Liang YR, Lu JL. Accumulation pattern of catechins and flavonol glycosides in different varieties and cultivars of tea plant in China. Journal of Food Composition and Analysis. 2021;97:103772. doi:10.1016/j.jfca.2020.103772.
CrossRef - Fuad AFA, Alwi A, Zulkifly NAH, Mohamed NA. Total Phenolic, Total Flavonoids Content and Antioxidant Activity of Mangifera sp. Leaf Extracts. Journal Of Agrobiotechnology. 2020;11(1S).
CrossRef - Ghosh D. Tannins from foods to combat diseases. Int J Pharm Res Rev. 2015;4(5):40-44.
- Haw YT, Sim YY, Nyam KL. Effect of steam blanching and high temperature drying on the physicochemical properties, antioxidant activities and consumer acceptability of Hibiscus cannabinus leaves tea. Journal of Food Science and Technology. 2020;57(12):4588–4598. doi:10.1007/s13197-020-04497-0.
CrossRef - Hu G, Zhang L, Rong Y, Ni X, Sun Y. Downstream carcinogenesis signaling pathways by green tea polyphenols: a translational perspective of chemoprevention and treatment for cancers. Current Drug Metabolism. 2014;15(1):14-22.
CrossRef - Huang Q, Chen S, Chen H, Wang Y, Wang Y, Hochstetter D, Xu P. Studies on the bioactivity of aqueous extract of Pu-erh tea and its fractions: In vitro antioxidant activity and α-glycosidase inhibitory property, and their effect on postprandial hyperglycemia in diabetic mice. Food and Chemical Toxicology. 2013;53:75–83. doi:10.1016/j.fct.2012.11.039.
CrossRef - Islam MZ, Hoque MM, Asif-Ul-Alam SM, Monalisa K. Chemical composition, antioxidant capacities and storage stability of citrus macroptera and garcinia pedunculata fruits. Emirates Journal of Food and Agriculture. 2015;27(3): 275. doi:10.9755/ejfa.v27i3.18624.
CrossRef - Jeong SM, Kim SY, Kim DR, Jo SC, Nam KC, Ahn DU, Lee SC. Effect of heat treatment on the antioxidant activity of extracts from citrus peels. Journal of Agricultural and Food Chemistry. 2004;52(11):3389–3393. doi:10.1021/jf049899k.
CrossRef - Karaosmanoglu H, Kilmartin PA. Tea extracts as antioxidants for Food Preservation. Handbook of Antioxidants for Food Preservation. 2015:219–233. doi:10.1016/b978-1-78242-089-7.00009-9.
CrossRef - Kardel M, Taube F, Schulz H, Schütze W, Gierus M. Different approaches to evaluate tannin content and structure of selected plant extracts–review and new aspects. J. Appl. Bot. Food Qual. 2013;86(1):154-166.
- Kaur A, Kaur M, Kaur P, Kaur H, Kaur S, Kaur K. Estimation and comparison of total phenolic and total antioxidants in green tea and black tea. Global Journal of Bio-Science and Biotechnology. 2015;4(1):116-120.
- KC Y, Parajuli A, Khatri BB, Shiwakoti LD. Phytochemicals and quality of green and black teas from different clones of Tea Plant. Journal of Food Quality. 2020:1–13. doi:10.1155/2020/8874271.
CrossRef - Khasnabis J, Rai C, Roy A. Determination of tannin content by titrimetric method from different types of tea. Journal of chemical and pharmaceutical research. 2015;7(6): 238-241.
- Kittibunchakul S, Hudthagosol C, Sanporkha P, Sapwarobol S, Suttisansanee U, Sahasakul Y. Effects of maturity and thermal treatment on phenolic profiles and in vitro health-related properties of Sacha Inchi leaves. Plants. 2022;11(11):1515. doi:10.3390/plants11111515.
CrossRef - Kumar B, Smita K, Cumbal L, Debut A. Synthesis of silver nanoparticles using Sacha inchi (plukenetia volubilis L.) leaf extracts. Saudi Journal of Biological Sciences. 2014;21(6):605–609. doi:10.1016/j.sjbs.2014.07.004.
CrossRef - Kumari M, Jain S. Screening of potential sources of tannin and its therapeutic application. International Journal of Nutrition and Food Engineering. 2015;9(7):820-823.
CrossRef - Li S, Lo CY., Pan MH, Lai CS, Ho CT. Black tea: Chemical Analysis and stability. Food Funct. 2013;4(1):10–18. doi:10.1039/c2fo30093a.
CrossRef - Maheshkumar SK, Kirti SL. Determination of total flavonoids content and quantification of rutin in Momordica tuberosa (Roxb) Cogn. fruits by RP-HPLC. Asian Journal of Traditional Medicines. 2012;7(5):220-225.
- Meng Q, Fan H, Li Y, Zhang L. Effect of drying methods on physico-chemical properties and antioxidant activity of dendrobium officinale. Journal of Food Measurement and Characterization. 2017;12(1):1–10. doi:10.1007/s11694-017-9611-5.
CrossRef - Mensor LL, Menezes FS, Leitão GG, Reis AS, Santos T C, Coube CS, Leitão SG. Screening of Brazilian plant extracts for antioxidant activity by the use of DPPH free radical method. Phytotherapy Research. 2001;15(2):127–130. doi:10.1002/ptr.687.
CrossRef - Milan SS. Total phenolic content, flavonoid concentration and antioxidant activity of Marrubium peregrinum L. extracts. Kragujevac Journal of Sciences. 2011;33:63-72.
- Mohiuddin M, Arbain D, Islam AKM, Ahmad MS, Ahmad MN. Alpha-glucosidase enzyme biosensor for the electrochemical measurement of antidiabetic potential of medicinal plants. Nanoscale Research Letters. 2016;11(1). doi:10.1186/s11671-016-1292-1.
CrossRef - Pan MH, Lai CS, Wang H, Lo CY, Ho CT, Li S. Black tea in chemo-prevention of cancer and other human diseases. Food Science and Human Wellness. 2013;2(1):12–21. doi:10.1016/j.fshw.2013.03.004.
CrossRef - Peterson J, Dwyer J, Bhagwat S, Haytowitz D, Holden J, Eldridge AL, Beecher G, Aladesanmi J. Major flavonoids in dry tea. Journal of Food Composition and Analysis. 2005;18(6):487–501. doi:10.1016/j.jfca.2004.05.006.
CrossRef - Rahman M, Jahan IA, Ahmed S, Ahmed KS, Roy M, Zzaman W, Ahmad I. Bioactive compounds and antioxidant activity of black and green tea available in Bangladesh. Food Research. 2021;5(3):107–111. doi:10.26656/fr.2017.5(3).491.
CrossRef - Roslan AS, Ismail A, Ando Y, Azlan A. Effect of drying methods and parameters on the antioxidant properties of tea (camellia sinensis) leaves. Food Production, Processing and Nutrition. 2020;2(1). doi:10.1186/s43014-020-00022-0.
CrossRef - Saxena M, Saxena J, Nema R, Singh D, Gupta A. Phytochemistry of medicinal plants. Journal of pharmacognosy and phytochemistry. 2013;1(6):168-182.
- Shirazi OU, Khattak MMAK, Shukri NAM. Determination of total phenolic, flavonoid content and free radical scavenging activities of common herbs and spices. Journal of pharmacognosy and phytochemistry. 2014;3(3):104-108.
- Silalahi M. Sacha inchi (Plukenetia volubilis L.): Its potential as foodstuff and traditional medicine. GSC Biological and Pharmaceutical Sciences. 2022;18(3):213-218.
CrossRef - Trisha AT, Shakil MH, Talukdar S, Rovina K, Huda N, Zzaman W. Tea polyphenols and their preventive measures against cancer: Current trends and directions. Foods. 2022;11(21):3349. doi:10.3390/foods11213349.
CrossRef - Wang H, Provan GJ, Helliwell K. Tea flavonoids: Their functions, utilisation and analysis. Trends in Food Science & Technology. 2000;11(4–5):152–160. doi:10.1016/s0924-2244(00)00061-3.
CrossRef - Wang LF, Lee JY, Chung JO, Baik JH, So S, Park SK. Discrimination of teas with different degrees of fermentation by SPME–GC analysis of the characteristic volatile flavour compounds. Food Chemistry, 2008;109(1):196–206. doi:10.1016/j.foodchem.2007.12.054.
CrossRef - Wang S, Zhu F, Kakuda Y. Sacha Inchi (plukenetia volubilis L.): Nutritional composition, biological activity, and uses. Food Chemistry. 2018;265:316–328. doi:10.1016/j.foodchem.2018.05.055.
CrossRef - Wangiyana IGAS, Supriadi, Nikmatullah A, Sunarpi, Mulyaningsih L. Tannin concentration of gyrinops tea taken form different agarwood plantation and different processing method. IOP Conference Series: Earth and Environmental Science. 2021;913(1):012068. doi:10.1088/1755-1315/913/1/012068.
CrossRef - Wan Nadilah, W. A, Manaf-Ali, A. Wan Nur Amalina WM, Mahmod NH. Evaluation of DPPH Free Radical Scavenging, α-Glucosidase Inhibitory, and Antimicrobial Activities of Aquilaria malaccensis Leaf Extracts. Journal of Agrobiotechnology. 2019;10(1).
- Wong M, Sirisena S, Ng K. Phytochemical profile of differently processed tea: A Review. Journal of Food Science. 2022;87(5):1925–1942. doi:10.1111/1750-3841.16137.
CrossRef - Wuttisin N, Nararatwanchai T, Sarikaputi A. Total phenolic, flavonoid, flavonol contents and antioxidant activity of Inca peanut (plukenetia volubilis L.) leaves extracts. Food Research. 2020;5(1):216–224. doi:10.26656/fr.2017.5(1).346.
CrossRef - Xing R, Wang S, Bie Z, He H, Liu Z. Preparation of molecularly imprinted polymers specific to glycoproteins, glycans and monosaccharides via boronate affinity controllable–oriented surface imprinting. Nature Protocols. 2017;12(5):964–987. doi:10.1038/nprot.2017.015.
CrossRef - Xu P, Chen L, Wang Y. Effect of storage time on antioxidant activity and inhibition on α‐amylase and α‐glucosidase of white tea. Food Science & Nutrition. 2019;7(2):636–644. doi:10.1002/fsn3.899.
CrossRef - Yang J, Liu RH. The phenolic profiles and antioxidant activity in different types of tea. International Journal of Food Science & Technology, 2012;48(1):163–171. doi:10.1111/j.1365-2621.2012.03173.x.
CrossRef - Ye Y, Yan J, Cui J, Mao S, Li M, Liao X, Tong H. Dynamic changes in amino acids, catechins, caffeine and gallic acid in green tea during withering. Journal of Food Composition and Analysis. 2018;66:98–108. doi:10.1016/j.jfca.2017.12.008.
CrossRef - Yilmazer Musa M, Griffith AM, Michels A J, Schneider E, Frei B. Grape seed and tea extracts and catechin 3-gallates are potent inhibitors of α-amylase and α-glucosidase activity. Journal of Agricultural and Food Chemistry. 2012;60(36):8924–8929. doi:10.1021/jf301147n.
CrossRef - Yuan JM, Sun C, Butler LM. (2011). Tea and cancer prevention: Epidemiological studies. Pharmacological Research. 2011;64(2):123–135. doi:10.1016/j.phrs.2011.03.002.
CrossRef - Zakaria Z, Muhamad A, Syimira Rasdi F, Hussin N, Abu Bakar C, Zaizuliana N, Anwar R, Shahidan N. Microencapsulation of Sacha Inchi Oil using Spray Drying Method. Bioscience Research. 2022;19(SI-1):165-185.
- Zhang L, Li J, Hogan S, Chung H, Welbaum GE, Zhou K. Inhibitory effect of raspberries on starch digestive enzyme and their antioxidant properties and phenolic composition. Food Chemistry. 2010;119(2):592–599. doi:10.1016/j.foodchem.2009.06.063.
CrossRef

This work is licensed under a Creative Commons Attribution 4.0 International License.


