Awareness and Practices of Carbon Footprint Reduction: A Survey among Postgraduate students
Dipti Shankar Dash1  , Pratima Pradhan1 and Rajesh Kumar2
1Fakir Mohan University, Balasore, Odisha India .
2RNIASE, Cuttack, Odisha India .
http://dx.doi.org/10.12944/CRJSSH.6.1.10
Copy the following to cite this article:
Dash D. S, Pradhan P, Kumar R. Awareness and Practices of Carbon Footprint Reduction: A Survey among Postgraduate students. Current Research Journal of Social Sciences and Humanities. 2023 6(1). DOI:http://dx.doi.org/10.12944/CRJSSH.6.1.10
Copy the following to cite this URL:
Dash D. S, Pradhan P, Kumar R. Awareness and Practices of Carbon Footprint Reduction: A Survey among Postgraduate students. Current Research Journal of Social Sciences and Humanities. 2023 6(1). Available here:https://bit.ly/43XGrN2
Download article (pdf) Citation Manager Review / Publish History

Introduction
The significant surge in carbon levels in the atmosphere during the 21st century can be attributed to factors such as population growth, industrialization, and deforestation. Individuals and organizations rely on various forms of energy, such as electricity, coal, and oil, in their daily activities, thereby emitting carbon dioxide into the atmosphere. This carbon dioxide remains suspended in the environment for over a hundred years. The increase in carbon concentration has resulted in global warming, which is a widely discussed and emphasized issue worldwide.
The rise in global temperatures caused by increased carbon levels has led to climate change, bringing about severe consequences such as rising sea levels, extreme weather events, and the loss of biodiversity. Essentially, we are leaving our footprint in the atmosphere, making it challenging for future generations to thrive. Consequently, it becomes the responsibility of every individual to assess and reduce their carbon emissions during their lifetime.
The concerns and awareness surrounding climate change and its consequences can influence household decision-making, prompting the adoption of more climate-friendly practices. This, in turn, contributes to progress towards building a low-carbon society. Households that prioritize reducing their carbon footprint and actively change their behavior, along with additional incentives like social norms or health benefits, play a significant role in this transition. It is worth noting that environmental awareness and behavior change are closely interconnected.
The factors associated with personal carbon footprints are linked to individuals' knowledge, values, emotions, and perceptions regarding the environment, particularly climate change. Hence, recognizing the urgent need for action in mitigating climate change, understanding the awareness and actions of the younger population is crucial. By exploring their attitudes, knowledge, and behaviors related to carbon footprint reduction, we can gain insights into their role in shaping a sustainable future. By empowering and mobilizing the youth, we can foster a generation that is equipped with the knowledge and motivation to create a greener and more environmentally conscious world.
Objectives of the Study
The study outlined the following objectives.
- To study the level of carbon footprint awareness among the post graduate students.
- To compare the level of carbon footprint awareness among the post graduate students with respect to,
- Gender (Male/Female)
- Streams of Education (Arts/Science/Commerce)
- To study the level of practices of various postgraduate students in reducing carbon footprint.
- To compare the level of practices in reducing the carbon footprint among the post graduate students with respect to,
- Gender (Male/Female)
- Streams of Education (Arts/Science/Commerce)
- To study the correlation between the awareness of carbon footprint and the adoption of carbon footprint practices among postgraduate students.
Hypotheses of the Study
The following null hypotheses have been formulated for the above objective no. 2,4 & 5:
- There is no statistically significant difference between male and female post graduate students in their level of carbon footprint awareness.
- There is no statistically significant difference among the postgraduate students from Arts, Science and Commerce streams of education in their level of awareness of carbon footprint.
- There is no statistically significant difference between the male and female post graduate students in their level of carbon footprint reducing practices.
- There is no statistically significant difference among the post graduate students from Arts, Science and Commerce stream of education in their level of adoption of carbon footprint practices.
- There is no significant relationship between level of awareness of carbon footprint and carbon footprint reducing practices among post graduate students.
Scope and Delimitations of the Study
The present study had a comprehensive and extensive scope. It investigated the levels of carbon footprint awareness and the implementation of carbon footprint practices among postgraduate students during the academic year 2021-22, considering gender and educational streams as factors of analysis.This study was conducted over a period of one year and four months, from October 2020 to February 2022. During this period, the study underwent various stages including an in-depth literature review, development of research tools, data collection, and rigorous analysis and interpretation of the collected data.
- The study was confined on university students specifically within the Balasore District of Odisha, India.
- The study was delimited to post graduate level only.
- The study was delimited to the students studying in Arts, Science and Commerce streams only.
- The size of the data producing sample was 180.
- The investigators relied solely on what data were supplied by the students. There was no other way to recheck or verify the authenticity of the data provided by the students.
Population and Sample
The study aimed to examine the awareness of carbon footprint among male and female postgraduate students pursuing diverse educational streams at the University of Balasore, Odisha, India. Additionally, it investigated their efforts in reducing the carbon footprint. Therefore, the study population encompassed all postgraduate students at Balasore University. The researchers considered both the students' educational streams and gender while selecting the sample, employing a stratified random sampling method. Equal numbers of samples were collected from the science, arts, and commerce streams. The entire student body studying across various streams at Fakir Mohan University constituted the population for this study, totaling approximately 1,004 students regardless of gender. Consequently, the data-generating sample comprised 180 students, including both male and female students from the three aforementioned streams. The categorical distribution of the sample is as follows;
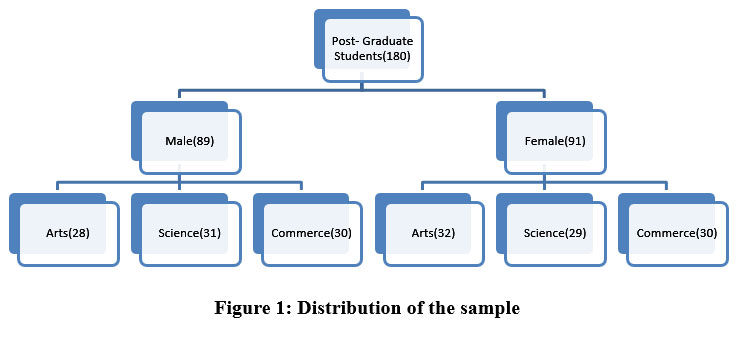 |
Figure 1: Distribution of the Sample. Click here to view Figure |
Tools of the Study
The present study utilized the following researcher-developed tools to collect the required data.
Carbon footprint awareness test constructed by the investigators
Carbon footprint practices scale constructed by the investigators
Construction of the tools: The investigators referred to various books(Reduce Your Carbon Footprint - Google Books, n.d.; The Pocket Idiot’s Guide to Your Carbon Footprint - Google Books, n.d.), past dissertations, Journals(Abdul Sukor & Basri, 2014; Carbon Footprint in Higher Education Institutions: A Literature Review and Prospects for Future Research - PMC, n.d.; The Science of Carbon Footprint Assessment, n.d.; Gao et al., 2014; Kaur & Kaur, 2014, 2014; Öz-Aydin, n.d.) and theses, Internet (Awareness Regarding the Carbon Footprint Assessment of Your Activity - Trainevo, n.d.; Carbon Footprint Assessment, n.d.; QUIZ, n.d.; US EPA, n.d.) to get an idea of the past studies done on the variables selected by the investigators relevant to this study in order to develop the tools for the required data. The experts in the field were requested for the content validity of both tools. A careful note of the corrections and suggestions given by the experts were taken into considerations and accordingly modifications, corrections, deletions and additions to the tools were done and the final draft of the tool was prepared.
Carbon Footprint Awareness Test
Investigators identified following areas for development of this test.
- Concept of carbon footprint, b. Culprits of carbon footprint, c. Industrialization, d. Transportation, e. Energy use, f. Waste generation, g. Waste management h. Diet i. Renewable energy sources j. Energy efficient electronics
The final version of the research tool comprised a total of 25 items. Among these, 15 items followed a 'true or false' format, while the remaining 10 items required participants to select the correct response. Each item was assigned a weightage of 1 mark for a correct response and 0 marks for an incorrect response.
Carbon Footprint Practices Scale
The investigators conducted a comprehensive review of relevant literature and research studies to identify and formulate 40 statements pertaining to personal activities and habits. These statements were designed to be straight forward and easily understandable. Among the 40 statements, there were 17 positive statements and 23 negative statements.


 A five-point rating scale was employed to classify the statements, using the following options: Always, Often, Sometimes, Occasionally, and Never. Respondents were requested to select the appropriate option for each statement by placing a check-mark ().
Scoring was determined based on the nature of the statements. Positive statements were assigned scores of 5, 4, 3, 2, and 1 for the options Always, Often, Sometimes, Occasionally, and Never, respectively. Conversely, negative statements were scored in reverse, with options receiving scores of 1, 2, 3, 4, and 5. All necessary precautions were taken during the development of the rating scale.
The content validity of both tools was established by soliciting expert feedback and incorporating their suggestions to modify the items accordingly. The Content Validity Index (CVI) was calculated, and items with a positive CVI were retained, while those with a CVI of 0 or less were discarded.
In order to evaluate the reliability of the research tools, a pilot study was conducted involving 30 postgraduate students. The reliability of the instruments was assessed using the split-half method. The carbon footprint awareness test yielded a reliability value of 0.89, indicating high consistency in measuring carbon footprint awareness. Similarly, the carbon footprint practices scale demonstrated a reliability value of 0.93, indicating strong internal consistency in assessing carbon footprint practices among the participants.
Data Collection Technique
The investigators obtained permission from the respective Heads of Departments and personally visited various departments to distribute the carbon footprint awareness test and carbon footprint practices scale to postgraduate students from different disciplines. After distributing the tools, the participants were briefed about the study's purpose, and the investigators ensured that the respondents understood the objectives. The administration of both tools took approximately 35 minutes. In total, around 220 copies were handed out to selected individuals. However, out of the distributed research tools, only 180 completed and returned sheets were received. Incomplete tools were excluded from the analysis, resulting in a final dataset of 180 valid data samples for further analysis.
Analysis and Interpretation
Level of carbon footprint awareness of students
Table 1: Percentage analysis of carbon footprint awareness level of students.
|
Levels |
Range |
Frequency |
Percentage |
|
Low |
1-8 |
98 |
54.44 |
|
Moderate |
9-16 |
54 |
30 |
|
High |
17-25 |
28 |
15.55 |
|
Total |
180 |
100 |
|
According to the data in Table 1, the majority of postgraduate students (54.44%) are unaware of their carbon footprint. Around 30% of students have a moderate level of awareness, whereas 15.55% of them have a high level of carbon footprint awareness.
Figure-2 provides a clear visualization of the same data. The overall findings indicate that a majority of the students in the study possessed a low level of awareness regarding their carbon footprint. This implies that a majority of the students had limited knowledge or understanding of their carbon footprint.
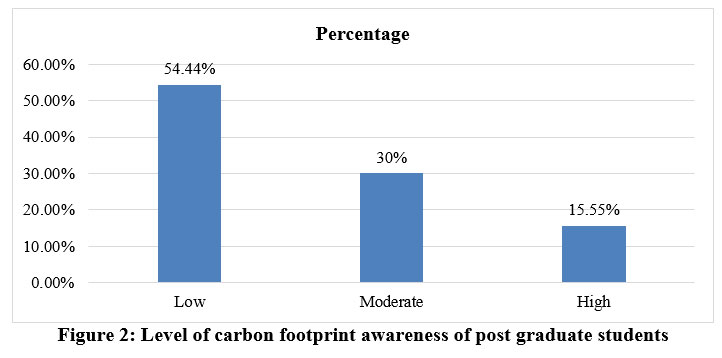 |
Figure 2: Level of carbon footprint awareness of post graduate students. Click here to view Figure |
Table 2: Significance of difference between male & female students in their mean carbon footprint awareness
|
Gender |
N |
Mean |
SD |
df |
‘t’ |
Level of Significance |
|
Female |
91 |
10.85 |
6.07 |
178 |
0.77 |
P = 0.44 Not Significant at 0.05 |
|
Male |
89 |
10.19 |
5.35 |
Based on the data presented in Table 2, the t-value obtained is 0.77, which was found to be statistically insignificant at the 0.05 level. The observed 't' value indicates that there is no significant difference in the level of carbon footprint awareness between female and male students. Therefore, the null hypothesis, which states that there is no significant difference in carbon footprint awareness between male and female students, is accepted at the 0.05 significance level.
Table 3: One-Way ANOVA Test Result of Carbon Footprint Awareness among Post Graduate Students from various Streams of Education.
|
Sources of variation |
df |
SS |
MS |
F Statistical |
F Critical |
Level of Significance |
|
Between Groups |
2 |
270.74 |
135.37 |
4.28 |
3.04 |
Significant at 0.05 |
|
Within Groups |
177 |
5596.11 |
31.61 |
The ANOVA result shown in Table -3 indicated that, at the 0.05 level of significance, the f-statistical value 4.28 was found to be bigger than the table value 3.07. As a result, it can be established that the mean carbon footprint awareness scores of postgraduate students from diverse fields of study vary considerably. It suggests that students who followed different academic courses had varying degrees of awareness of their carbon footprint. Hence, the null hypothesis that there is no significant difference in the mean carbon footprint awareness scores of postgraduate students from various educational streams was rejected at the 0.05 level.
Additionally, in order to determine the significance of the difference in mean carbon footprint awareness scores between student groups, a t-test was conducted and the resulting findings are presented in the following table.
Table 4: Mean Difference in Carbon Footprint Awareness Scores of Students from Different Streams of Education (Arts, Science And Commerce).
|
CF Awareness |
Streams |
Mean |
SD |
df |
t-value |
t-critical |
Level of Significance |
|
Science |
12.16 |
6.14 |
118 |
2.21 |
1.98 |
Significant at 0.05 |
|
|
Arts |
10.2 |
5.72 |
|||||
|
Arts |
10.2 |
5.72 |
118 |
1.03 |
1.98 |
Not Significant at 0.05 |
|
|
Commerce |
9.21 |
4.68 |
|||||
|
Commerce |
9.21 |
4.68 |
118 |
2.95 |
1.98 |
Significant at 0.05 |
|
|
Science |
12.16 |
6.14 |
In the above Table 4, a t-test is applied between the science and arts, arts and commerce, and commerce and science groups. The calculated 't' values of 2.21 and 2.95 were found to be greater than the t-critical value at a significance level of 0.05 for the comparisons between the science-arts and commerce-science groups, respectively. This indicates that there is a statistically significant difference between these two groups. Therefore, the findings suggest that there is a significant distinction among students in the Science-Arts and Science-Commerce groups in terms of their carbon footprint awareness.
In contrast, at the 0.05 significance level, the calculated t-value for the third group (Arts-Commerce) is 1.03, which is lower than the critical t-value of 1.98 from the table. As a result, the hypothesis stating that there is no significant difference between the mean carbon footprint awareness scores of arts and commerce students is accepted.
In other words, it may be inferred from the mean score that the science students are better at recognizing their carbon footprint in comparison to their counterparts in the arts and commerce streams. Students in both arts and commerce streams are equal in their level of carbon footprint awareness. This implies that students from both disciplines possess similar levels of awareness regarding their carbon footprint.
Carbon footprint practices
Table 5: Percentage analysis of Level of Adoption of Carbon Footprint Practice among PG Students
|
Levels |
Range |
Frequency |
Percentage |
|
Low |
1-56 |
97 |
53.88 |
|
Moderate |
57-112 |
55 |
30.56 |
|
High |
112-170 |
28 |
15.56 |
|
Total |
180 |
100 |
|
From the above table 5, it is observed that, from the students under study highest percentage (53.88%) of them had showed low level of practices for reducing carbon footprint. 30.56% of students showed moderate level of carbon footprint practice, where as 15.56% of them fall in the high level of carbon footprint practices.
The data presented in Figure 3 provides a clear visualization of the same information. The overall findings reveal that over 50% of the students included in the study exhibited a low level of carbon footprint practices.
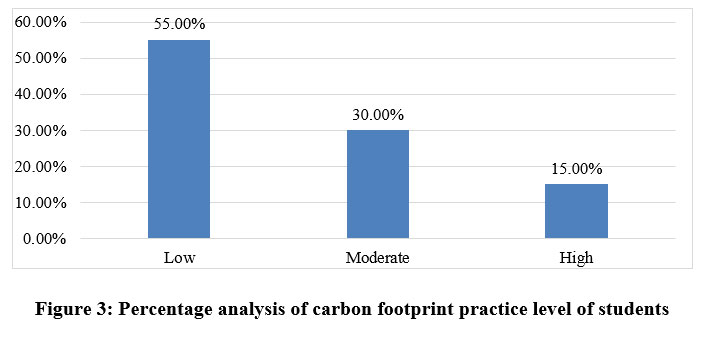 |
Figure 3: Percentage analysis of carbon footprint practice level of students |
Table 6: Significance of difference in the mean carbon footprint practice scores of students in relation to their gender.
|
Gender |
N |
Mean |
SD |
df |
‘t’ |
Level of significance |
|
Female |
91 |
114.13 |
38.36 |
178 |
1.501 |
P = 0.9118 Not significant at 0.05 |
|
Male |
89 |
105.74 |
36.54 |
Based on the data presented in Table 6, the calculated 't' value is 1.501, which was determined to be statistically insignificant at the 0.05 level. The observed 't' value indicates that there is no significant difference between female and male students in terms of their carbon footprint practices. Therefore, the null hypothesis, which states that there is no significant difference between male and female students in their carbon footprint practice scores, is accepted at the 0.05 significance level.
Table 7: Summary of one-way ANOVA result: Carbon footprint practices of students from different streams of education (Arts, Science and Commerce)
|
Sources of variation |
df |
SS |
MS |
F statistical |
F critical |
Level of significance |
|
Between Groups |
2 |
20981.32 |
10490.66 |
8.005 |
3.04 |
Significant at 0.05 |
|
Within Groups |
177 |
231948.61 |
1310.44 |
The ANOVA analysis presented in Table 7 reveals that the calculated F-statistic of 8.005 is greater than the critical table value of 3.04 at a significance level of 0.05. This indicates a significant difference in the mean carbon footprint practice scores among postgraduate students from different streams of education. It suggests that students from various educational backgrounds vary in their carbon footprint practices. Consequently, the null hypothesis, which assumes no significant difference among postgraduate students from different streams of education in their mean carbon footprint practice scores, is rejected at the 0.05 significance level.
Additionally, in order to determine the significance of the difference in mean carbon footprint practice scores between student groups, a t-test was conducted, and the resulting findings are presented in the following table.
Table 8: Mean difference in the carbon footprint practice scores of students from different streams of education (Arts, Science and commerce).
|
CF Practices |
Streams of Education |
Mean |
SD |
df |
t-value |
t-critical |
Level of Significance |
|
Science |
123.58 |
37.47 |
118 |
2.14 |
1.98 |
Significant at 0.05 |
|
|
Arts |
109.25 |
35.79 |
|||||
|
Arts |
109.25 |
35.79 |
118 |
1.86 |
1.98 |
Not Significant at 0.05 |
|
|
Commerce |
97.11 |
35.33 |
|||||
|
Commerce |
97.11 |
35.33 |
118 |
3.98 |
1.98 |
Significant at 0.05 |
|
|
Science |
123.58 |
37.47 |
In the above Table 8 ‘t’ test is applied between the Science-Arts, Arts-Commerce, and Commerce-Science groups. It is learnt that the estimated‘t’ values of 2.14 and 3.98 are greater than the ‘t’ critical value between the Science-Arts and Commerce-Science groups, respectively, at 0.05 level of significance, which means that the difference among the two groups was found to be statistically significant. Thus, the findings showed that there are significant differences among the students in the Science-Arts and Science-Commerce groups.
In contrast, for the third group (Arts-Commerce), the calculated 't' value is 1.86, which is lower than the critical 't' value of 1.98 at the 0.05 level of significance. Therefore, there is no significant difference observed between Arts and Commerce students in terms of their mean carbon footprint practice scores.
In other words, it may be interpreted from the mean scores that the science students are better at their carbon footprint practice level in comparison to their counterparts in the Arts and Commerce streams. Students in both Arts and Commerce streams are equal in their level of carbon footprint practices.
Relationship between level of carbon footprint awareness and adoption of carbon footprint practices
The relationship between carbon footprint awareness level and carbon footprint practices can be established by calculating the coefficient of correlation. The strength and direction of the relationship are indicated by the coefficient of correlation, typically denoted by the letter 'r'."
Table 9: Coefficient of correlation between level of carbon footprint awareness and carbon footprint practices of post graduate students.
|
Variable |
N |
Mean |
‘r’ |
|
CF Awareness |
180 |
10.52 |
0.92 |
|
CF Practices |
180 |
109.98 |
The above table shows the correlation between carbon footprint awareness and carbon footprint practices as viewed by the postgraduate students. A detailed explanation is given below with the help of the diagram.
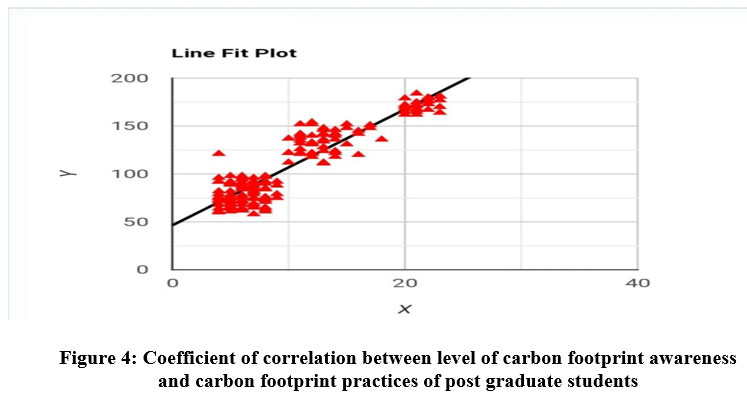 |
Figure 4: Coefficient of correlation between level of carbon footprint awareness and carbon footprint practices of post graduate students Click here to view Figure |
According to the data presented in Table 9, it is observed that the correlation between carbon footprint awareness and carbon footprint practices is 0.92. The coefficient of correlation, which indicates the strength and direction of the relationship, is positive. Moreover, the correlation is found to be significant at the 0.01 level, further confirming the strong relationship between carbon footprint awareness and carbon footprint practices.
The observed correlation of 0.92 between carbon footprint awareness and carbon footprint practices suggests the presence of a relationship as perceived by the students. Consequently, the null hypothesis, which assumes no significant relationship between carbon footprint awareness and carbon footprint practices among postgraduate students, is rejected at the 0.01 level of significance. These findings also indicate a strong, positive association between activities aimed at reducing carbon footprints and an understanding of carbon footprints.
It may further be interpreted that higher the level of awareness of carbon footprint, the higher is the level of practices for reducing carbon footprint among the post graduate students.
Conclusion
The analysis of results indicates a strong correlation between carbon footprint practices and awareness. However, the majority of students exhibit a low level of awareness and engagement in carbon footprint-related practices. To protect the environment, it is crucial to disseminate knowledge and promote actions that minimize carbon footprints. Scientific research demonstrates the critical link between the environment and life, as well as the impact of carbon emissions on ecosystems. The goal of carbon footprint awareness should be to develop a population that understands the issues and is motivated to reduce their carbon footprint. Changes in educational curricula should prioritize environmental education and empower individuals and communities to actively participate in solving environmental problems. Increasing awareness about carbon footprints is vital, as people are more likely to adopt sustainable behaviors when they understand the problems and their consequences. Education efforts can involve public campaigns, school programs, and government policies. By fostering a sense of responsibility and urgency, we can encourage individuals and communities to mitigate climate change by reducing their carbon footprints. Teacher education plays a crucial role in shaping students' awareness and actions, necessitating comprehensive training on carbon footprints. NGOs and the media also have significant roles in raising awareness and disseminating accurate information about carbon footprints. This study's findings offer valuable insights for designing targeted interventions and educational programs to enhance carbon footprint awareness and promote sustainable practices based on gender and educational streams. Taking action to reduce our carbon footprint is essential in addressing climate change, and these findings can inform policymakers and administrators in refining environmental education strategies.
Acknowledgement
The authors would like to thank Fakir Mohan University, Balasore, Odisha, India for providing us with the opportunity to conduct research on carbon footprint awareness and practices. We greatly appreciate the help and guidance received from the professors of the PG Department of Environmental Science and the PG Department of Education in this endeavour.
Conflict of Interest
There is no conflict of interest
Funding Source
This research was not funded by any agency or organization.
References
- Abdul Sukor, N. S., & Basri, N. (2014). “Investigation of carbon footprint awareness using travel diary method.” International Journal of GEOMATE, 7, 1090–1095. https://doi.org/10.21660/2014.14.140617
- Awareness regarding the carbon footprint assessment of your activity—Trainevo. (n.d.). Retrieved May 16, 2023, from https://trainevo.lu/en/training/awareness-of-the-assessment-of-the-carbon-footprint-of-your-activity/
- ProMusa - Carbon footprint assessment (2016, September 12). Retrieved May 16, 2023, from http://www.promusa.org/Carbon+footprint+assessment
- Val-Valls, K., & Bovea, D. M. (2021) “Carbon footprint in Higher Education Institutions: a literature review and prospects for future research”. National Library of Medicine doi: 10.1007/s10098-021-02180-2
CrossRef - Gao, T., Liu, Q., & Wang, J. (2014). “A comparative study of carbon footprint and assessment standards.” International Journal of Low-Carbon Technologies, 9(3), 237–243. https://doi.org/10.1093/ijlct/ctt041
CrossRef - Kaur, P., & Kaur, S. (2014). “CARBON FOOTPRINT: A DECARBONISING DISCLOSURE.” GE-INTERNATIONAL JOURNAL OF MANAGEMENT RESEARCH, 2, 361–376.
- Öz-Ayd?n, S. (2016). “The awareness of Turkish high school students about carbon footprint and the effects of the high school biology curriculum on this awareness.” International Electronic Journal of Environmental Education, 6(2), 29-53.
CrossRef - QUIZ: Test Your Climate Change IQ - Energy.Gov. (2016, April 18). Retrieved May 16, 2023, from https://www.energy.gov/articles/quiz-test-your-climate-change-iq
- How to Reduce Your Carbon Footprint—Google Books. Retrieved from https://www.google.co.in/books/edition/Reduce_Your_Carbon_Footprint/D0dPrgEACAAJ?hl=en
- The Pocket Idiot’s Guide to Your Carbon Footprint—Google Books. Retrieved from https://www.google.co.in/books/edition/The_Pocket_Idiot_s_Guide_to_Your_Carbon/MQnawiTMcDQC?hl=en&gbpv=1&dq=carbon+footprint+awareness+book&printsec=frontcover
- The Science of Carbon Footprint Assessment. Retrieved from https://wgbis.ces.iisc.ac.in/energy/paper/science-of-carbon/footprint.html
- EPA United States Environmental Protection Agency (2016, July 14). Retrieved May 16, 2023 from https://www3.epa.gov/carbon-footprint-calculator/

This work is licensed under a Creative Commons Attribution 4.0 International License.