

Green Synthesis, Characterization, and Empirical Thermal Conductivity Assessment of ZnO Nanofluids for High-Efficiency Heat-Transfer Applications


Abstract
:
1. Introduction
2. Materials and Methods
2.1. Chemicals and Reagents
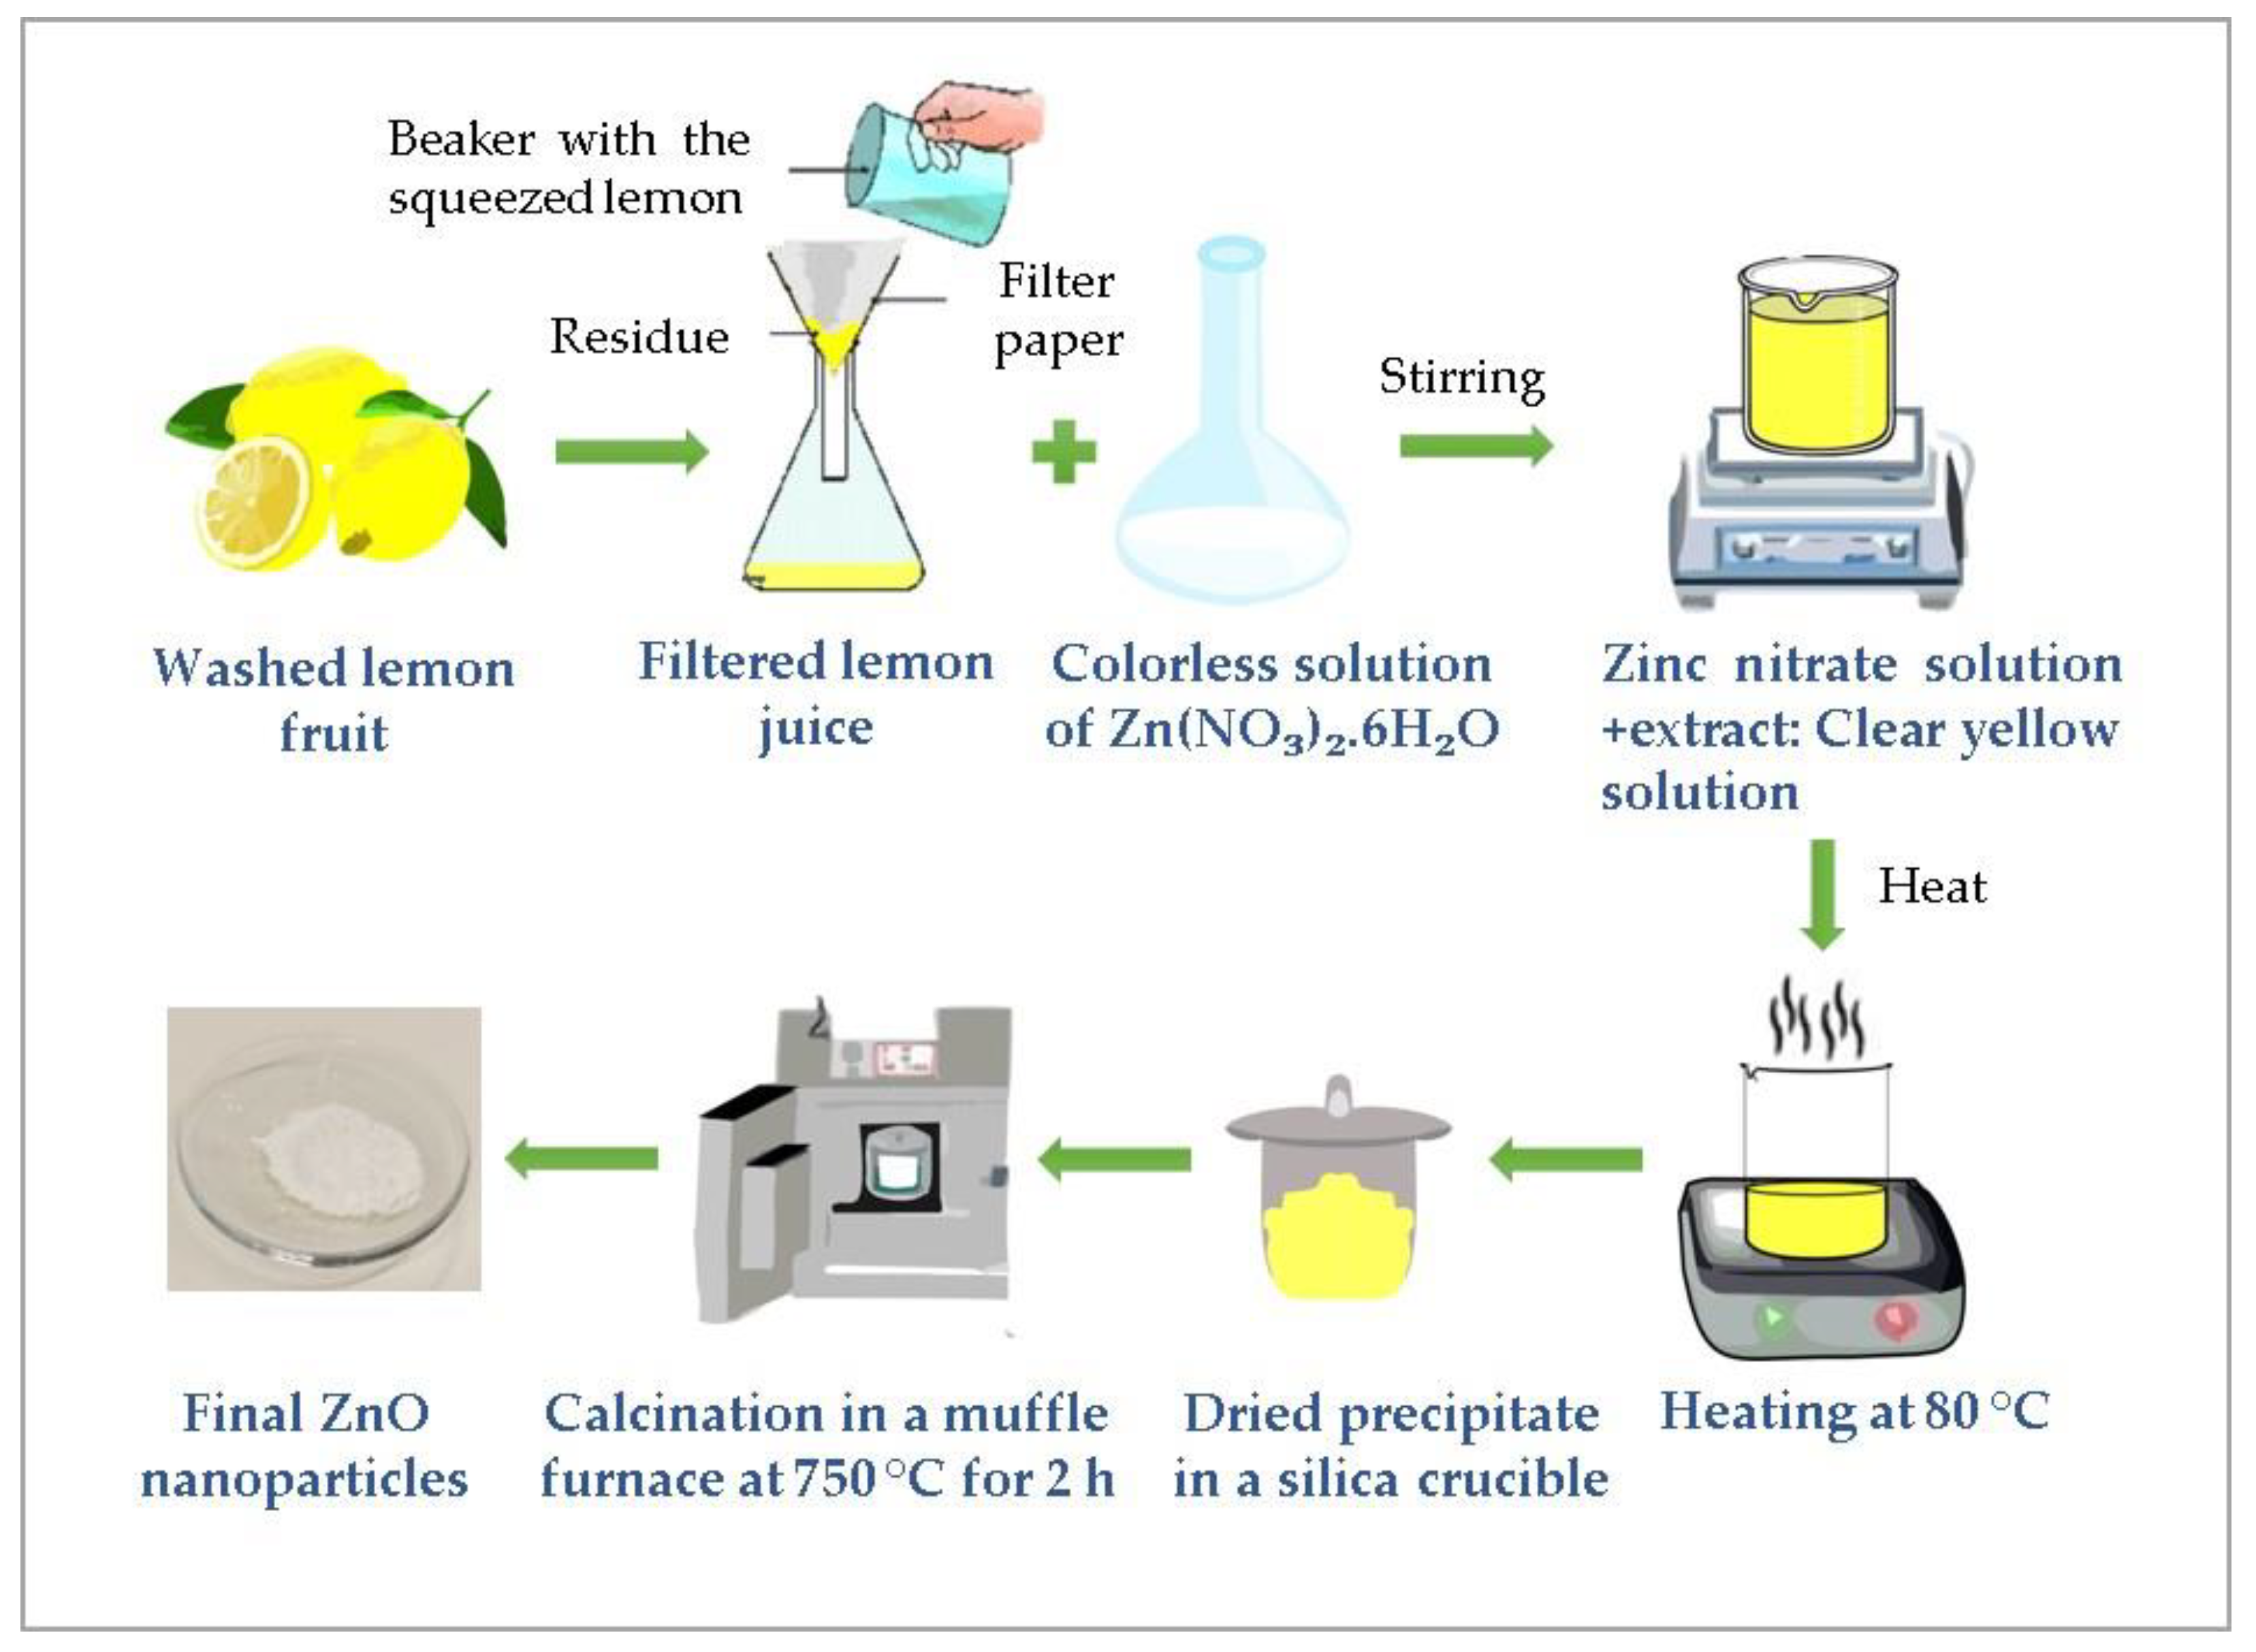
2.2. Preparation of ZnO Nanoparticles
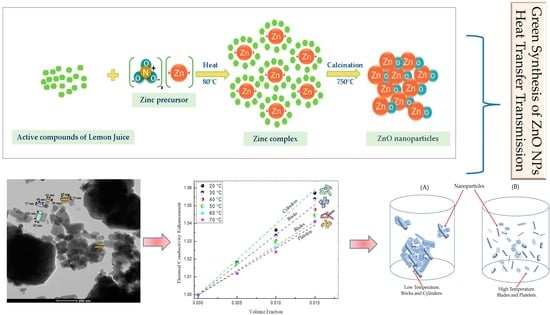
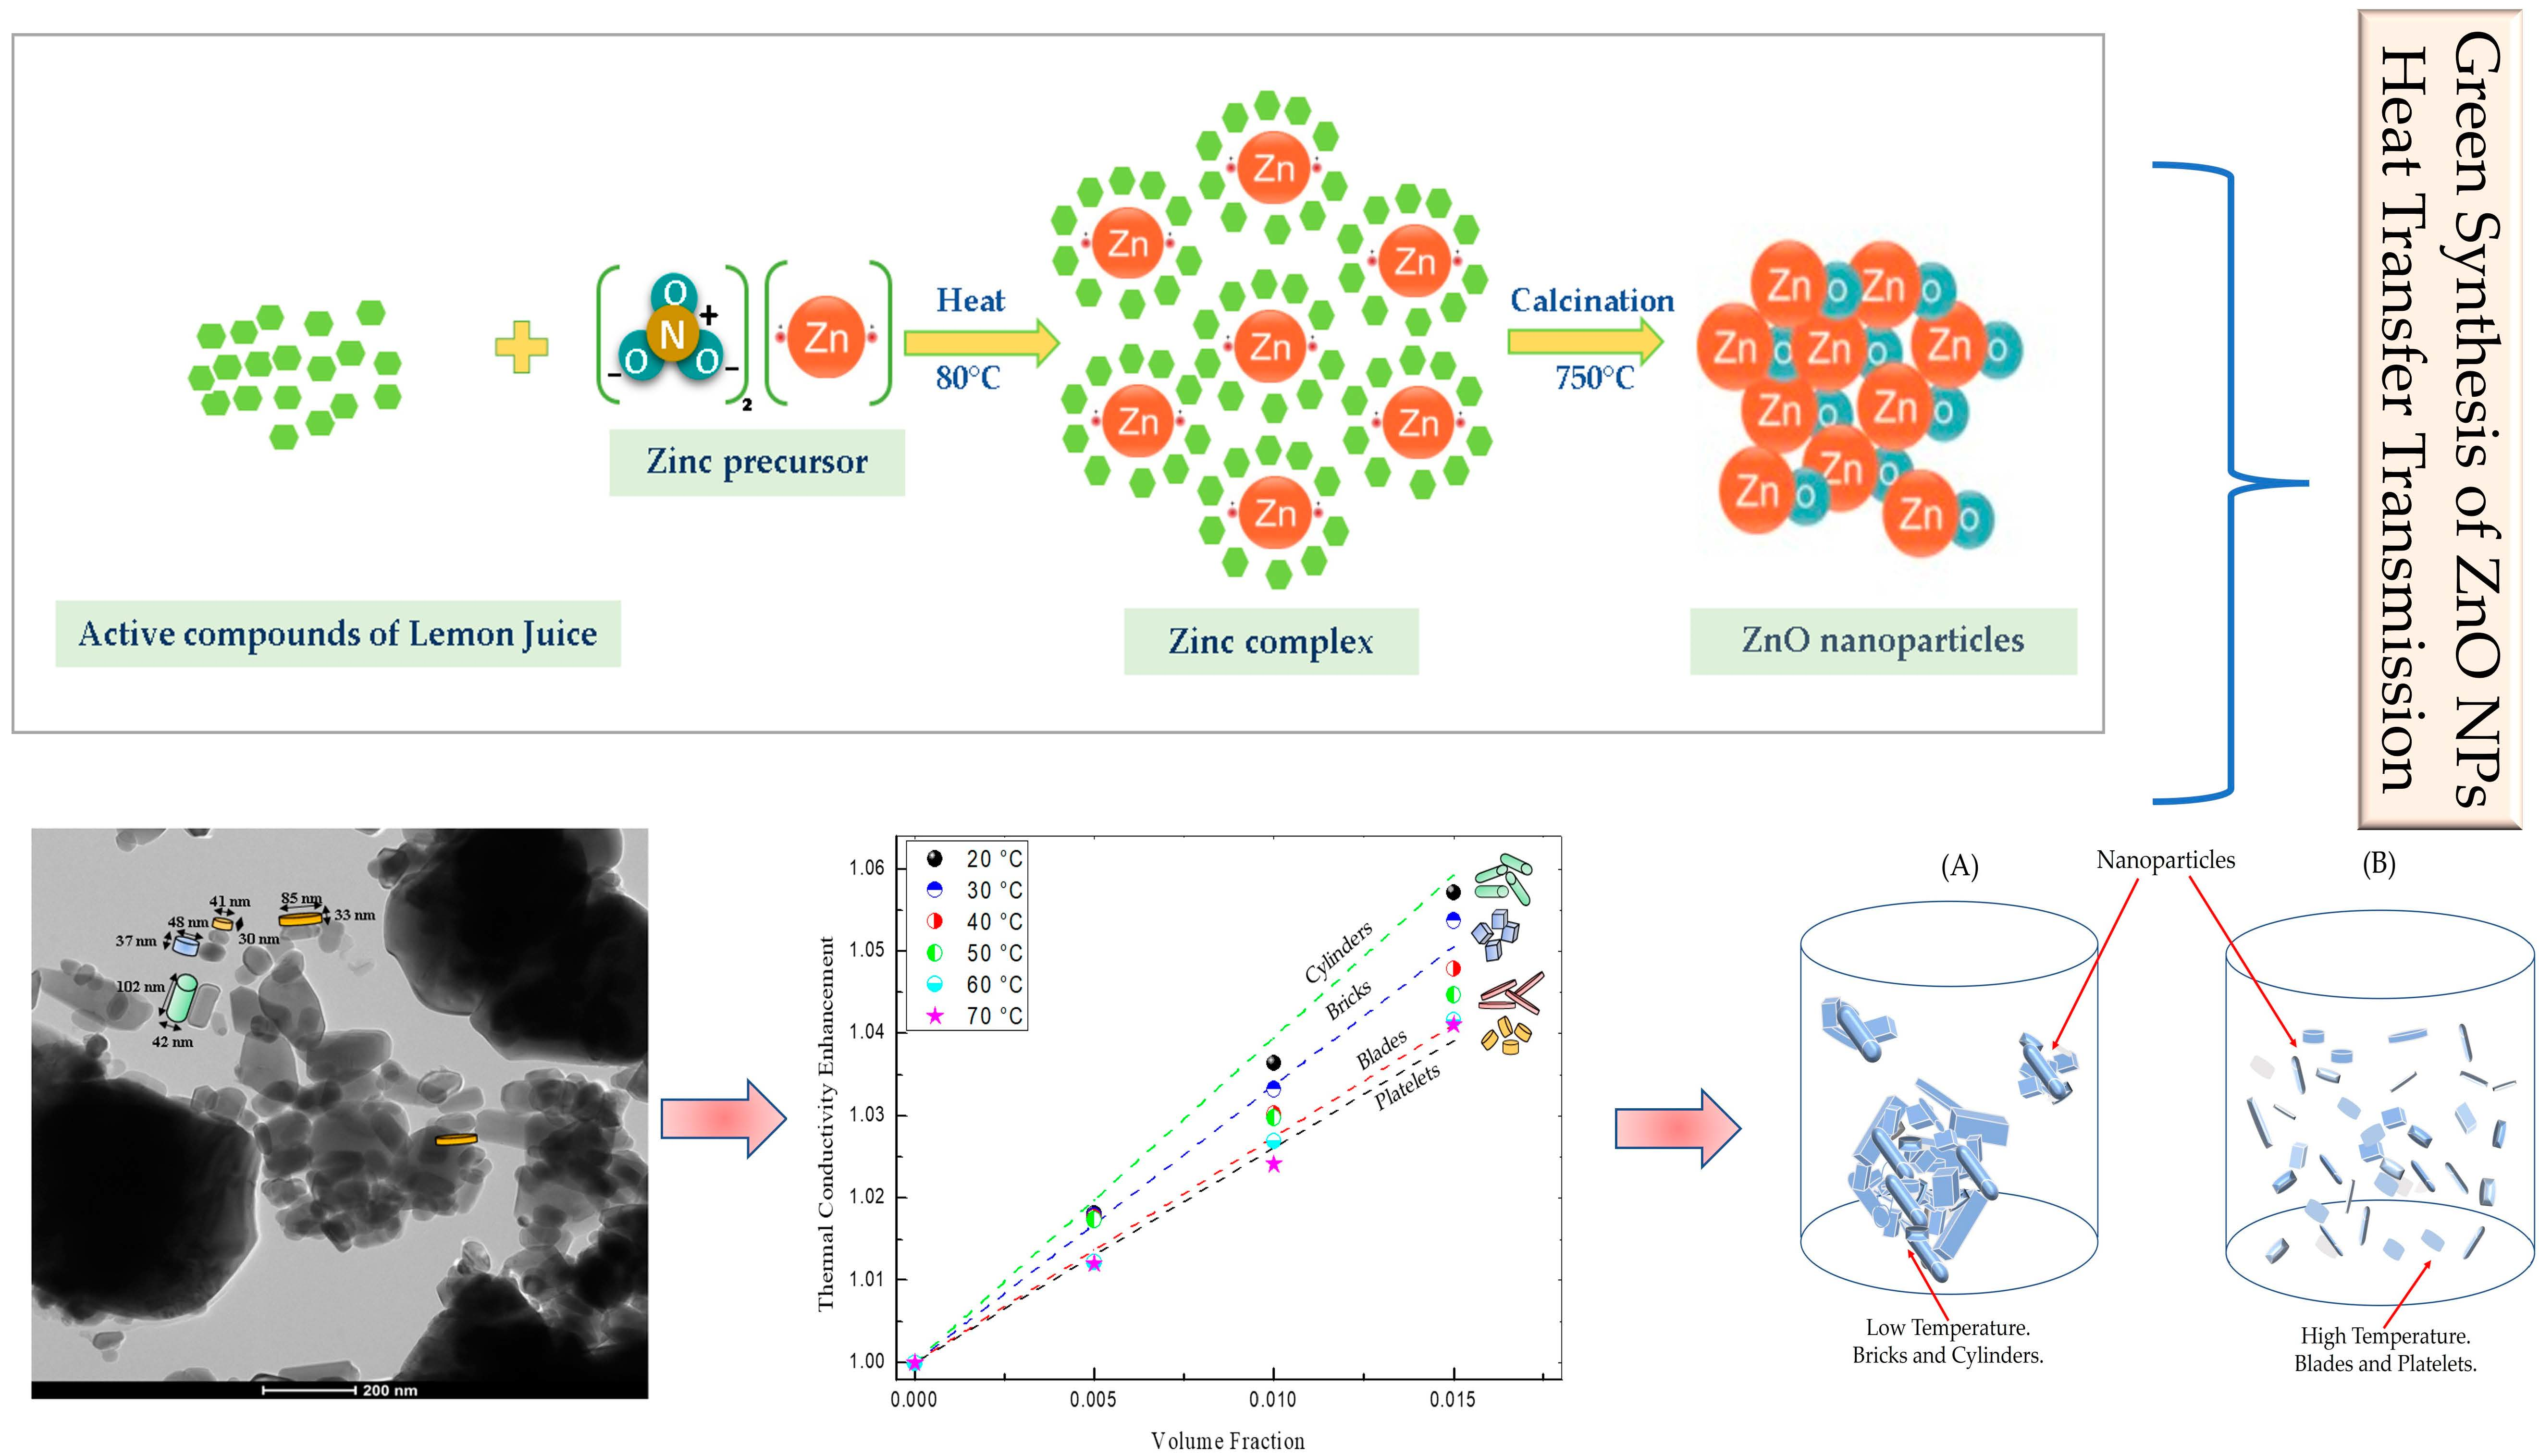
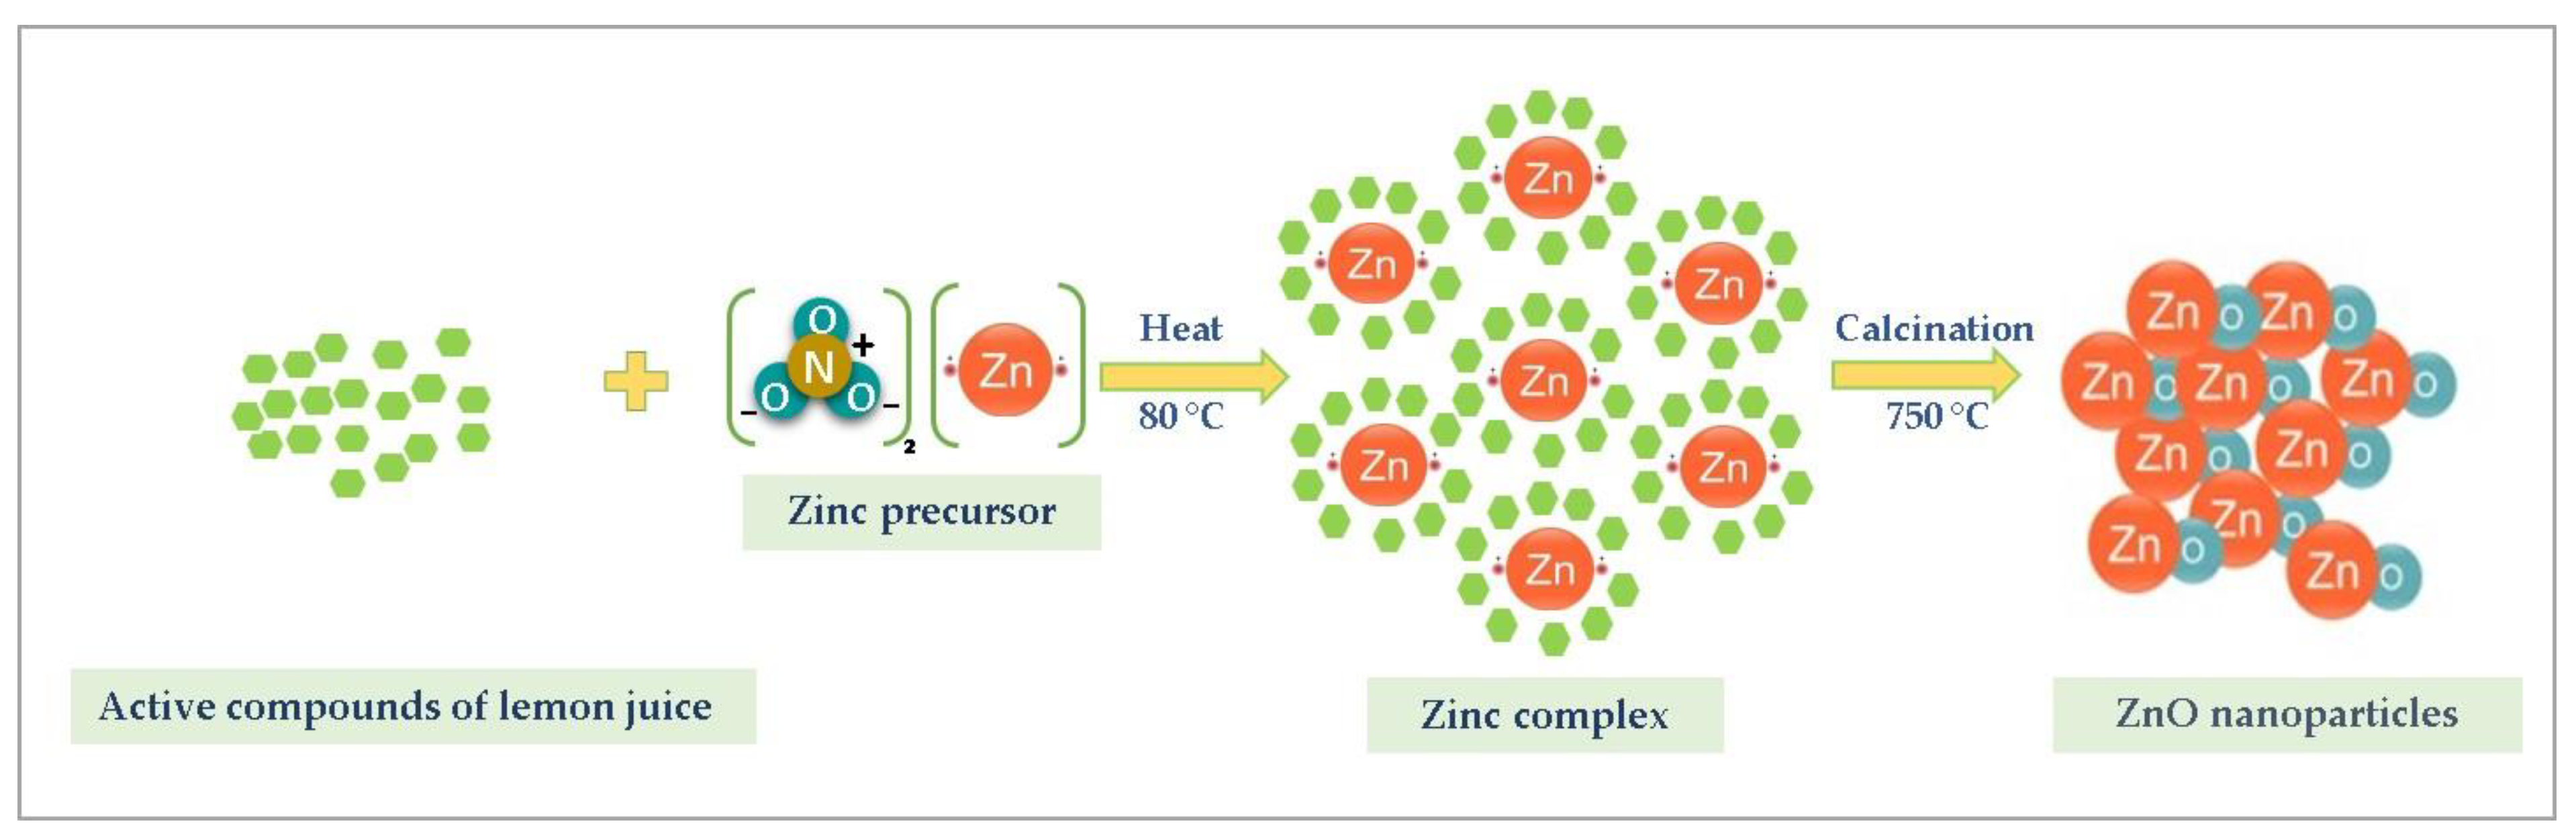
- Mechanism of ZnO formation by green synthesis
2.3. Characterization Techniques
2.4. Preparation of ZnO Nanofluids
2.5. Stability and Characterizations of Nanofluids
2.6. Measurement of Thermal Conductivity
3. Results and Discussions
3.1. XRD Analysis
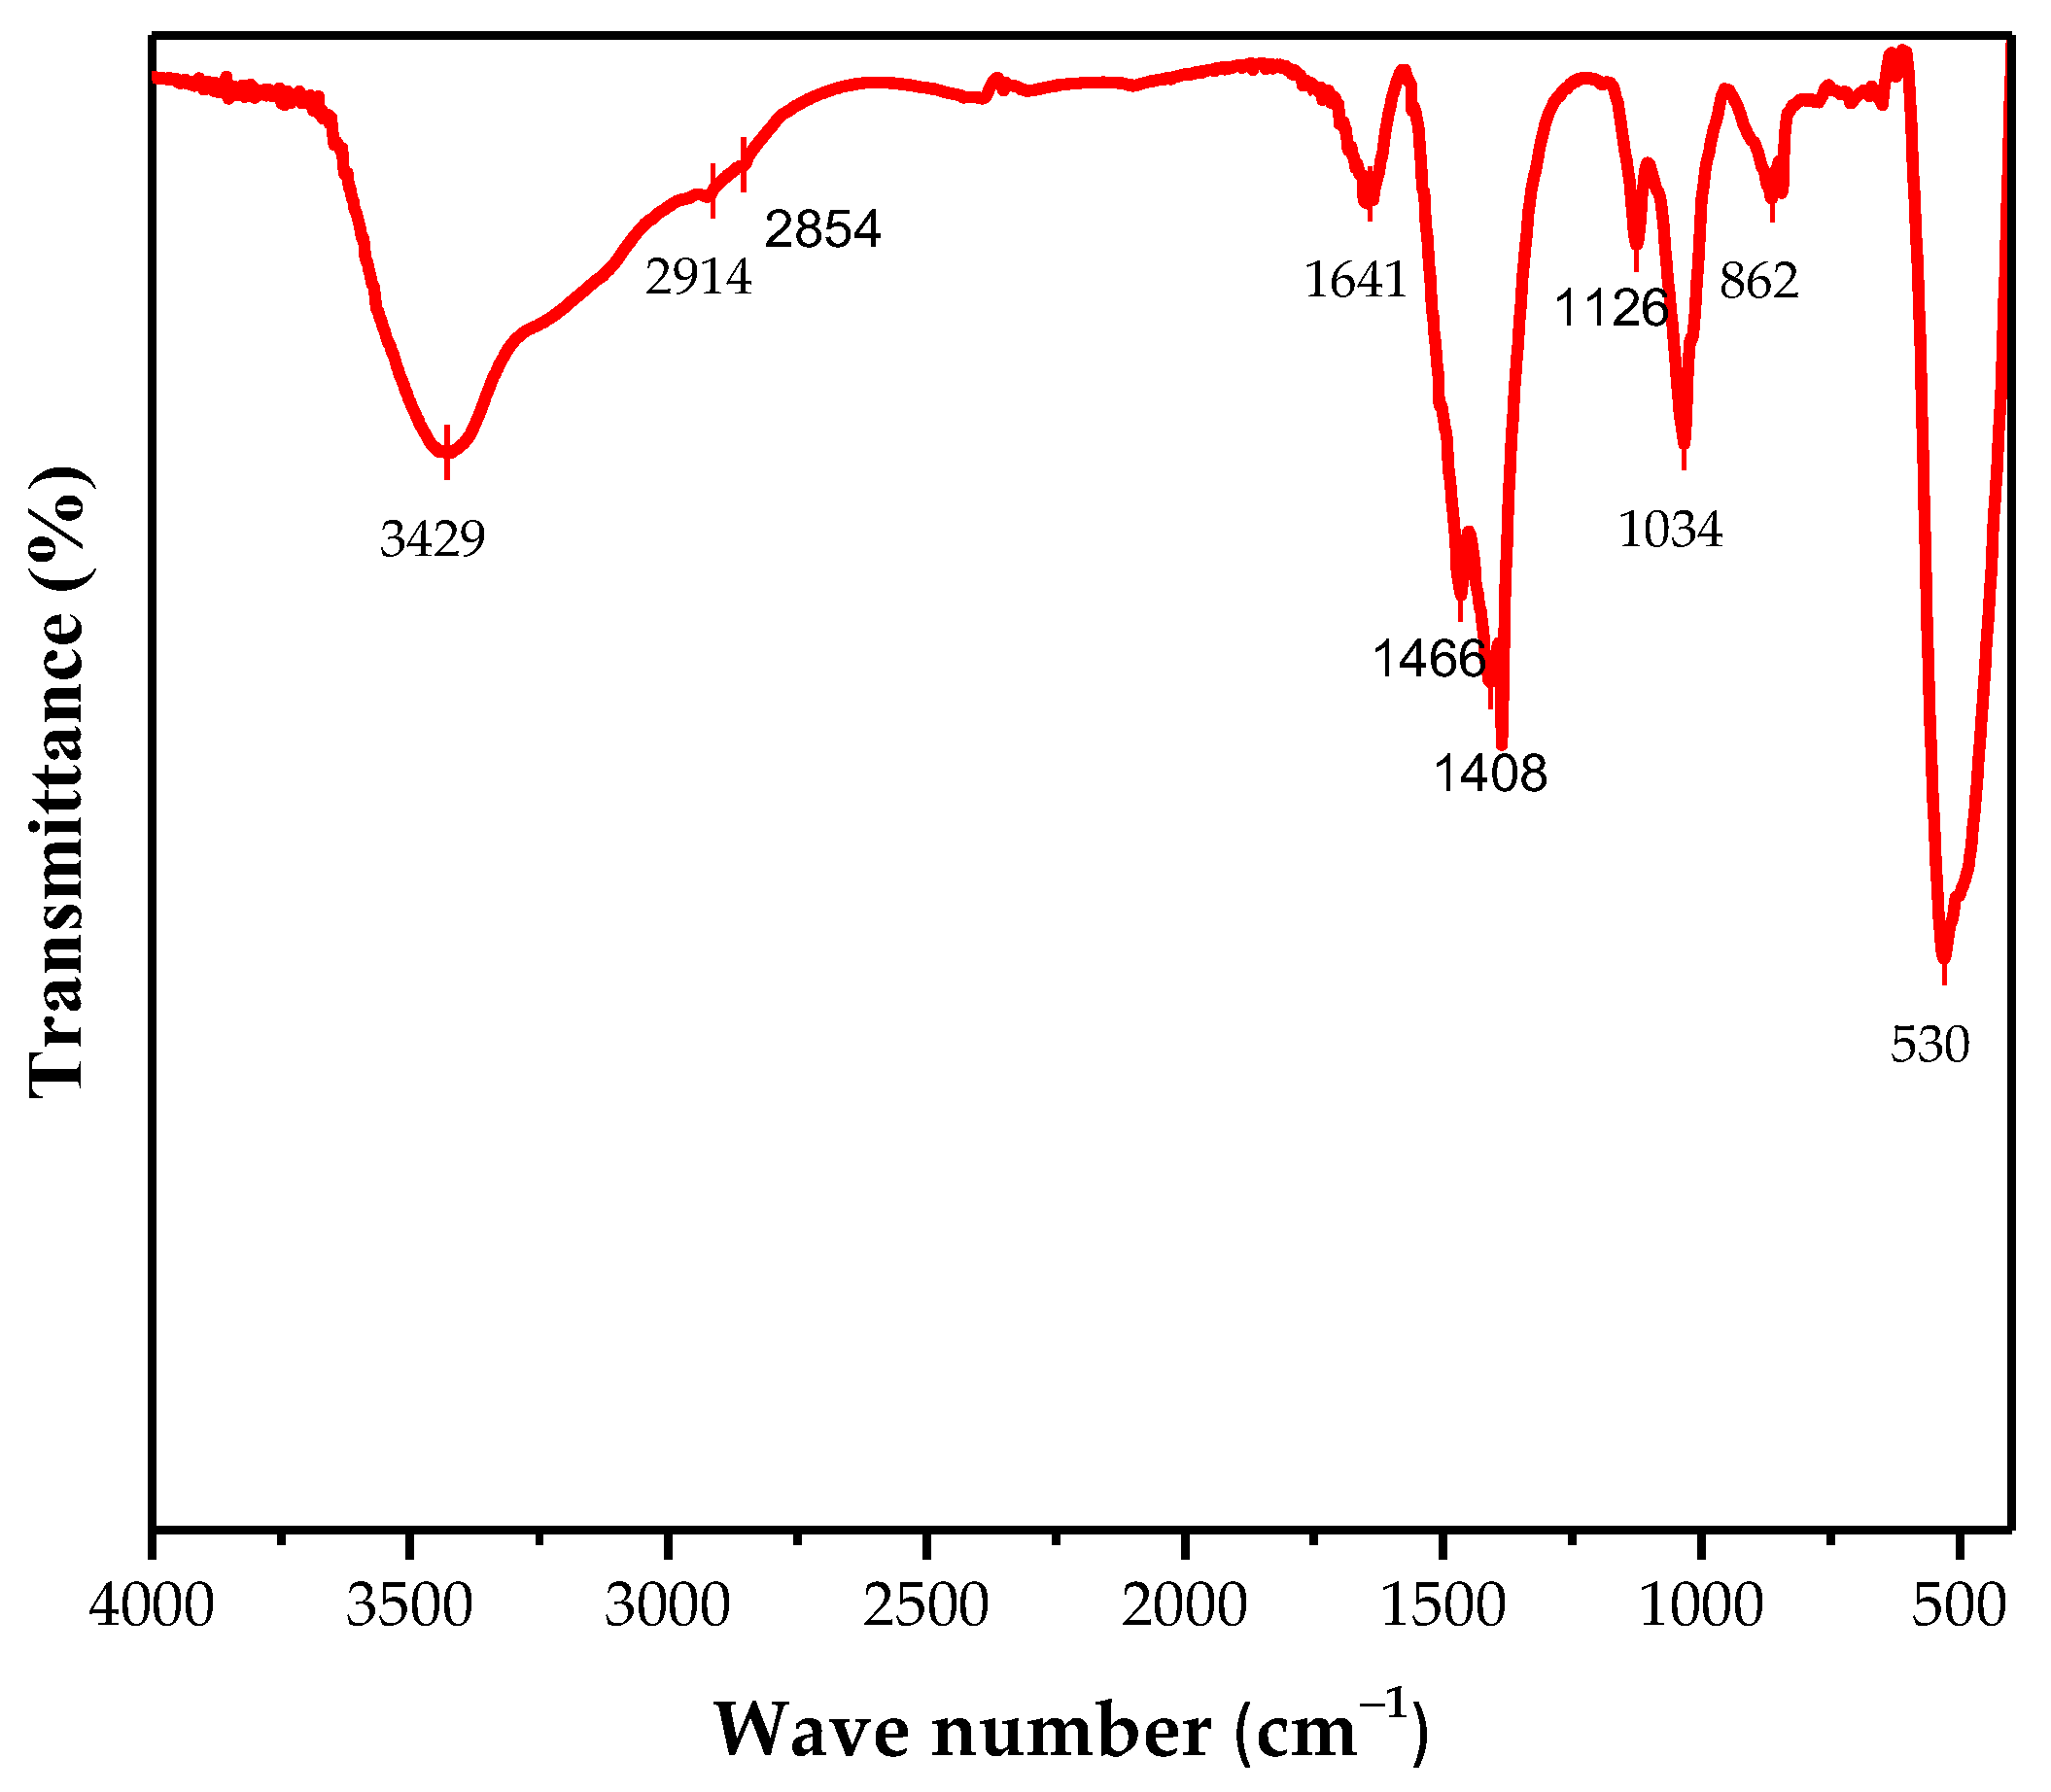
3.2. FTIR Analysis
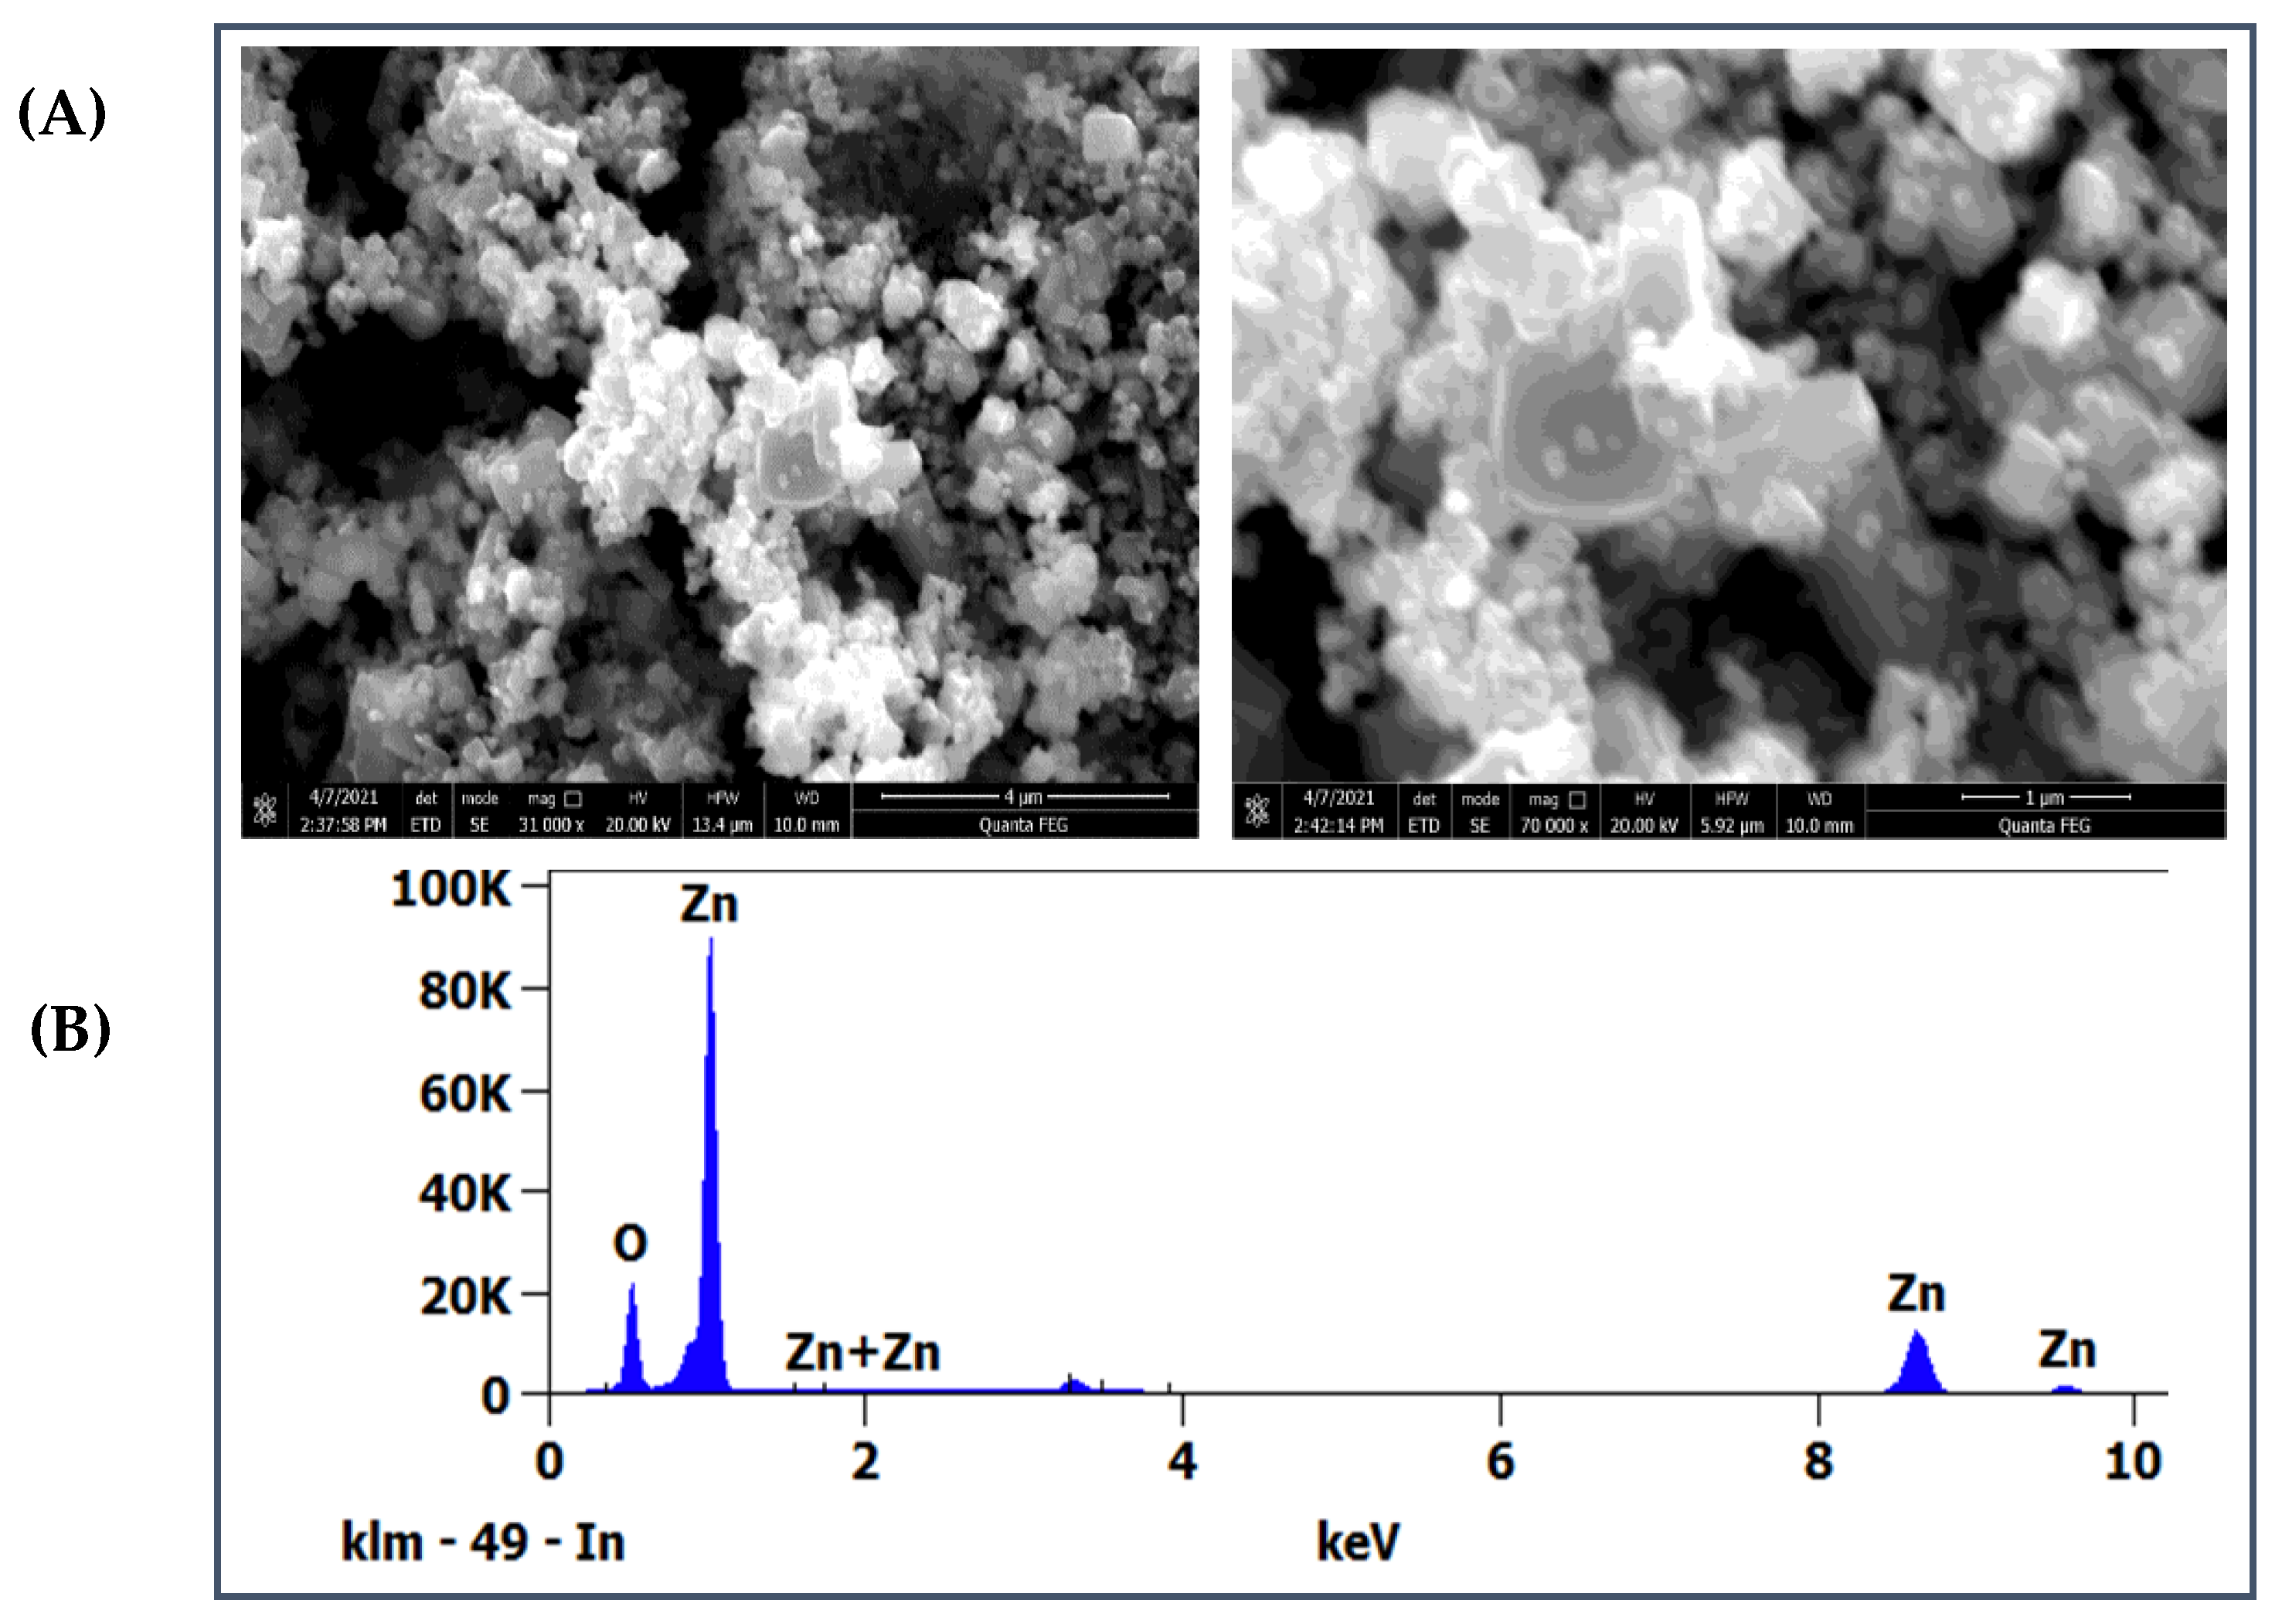
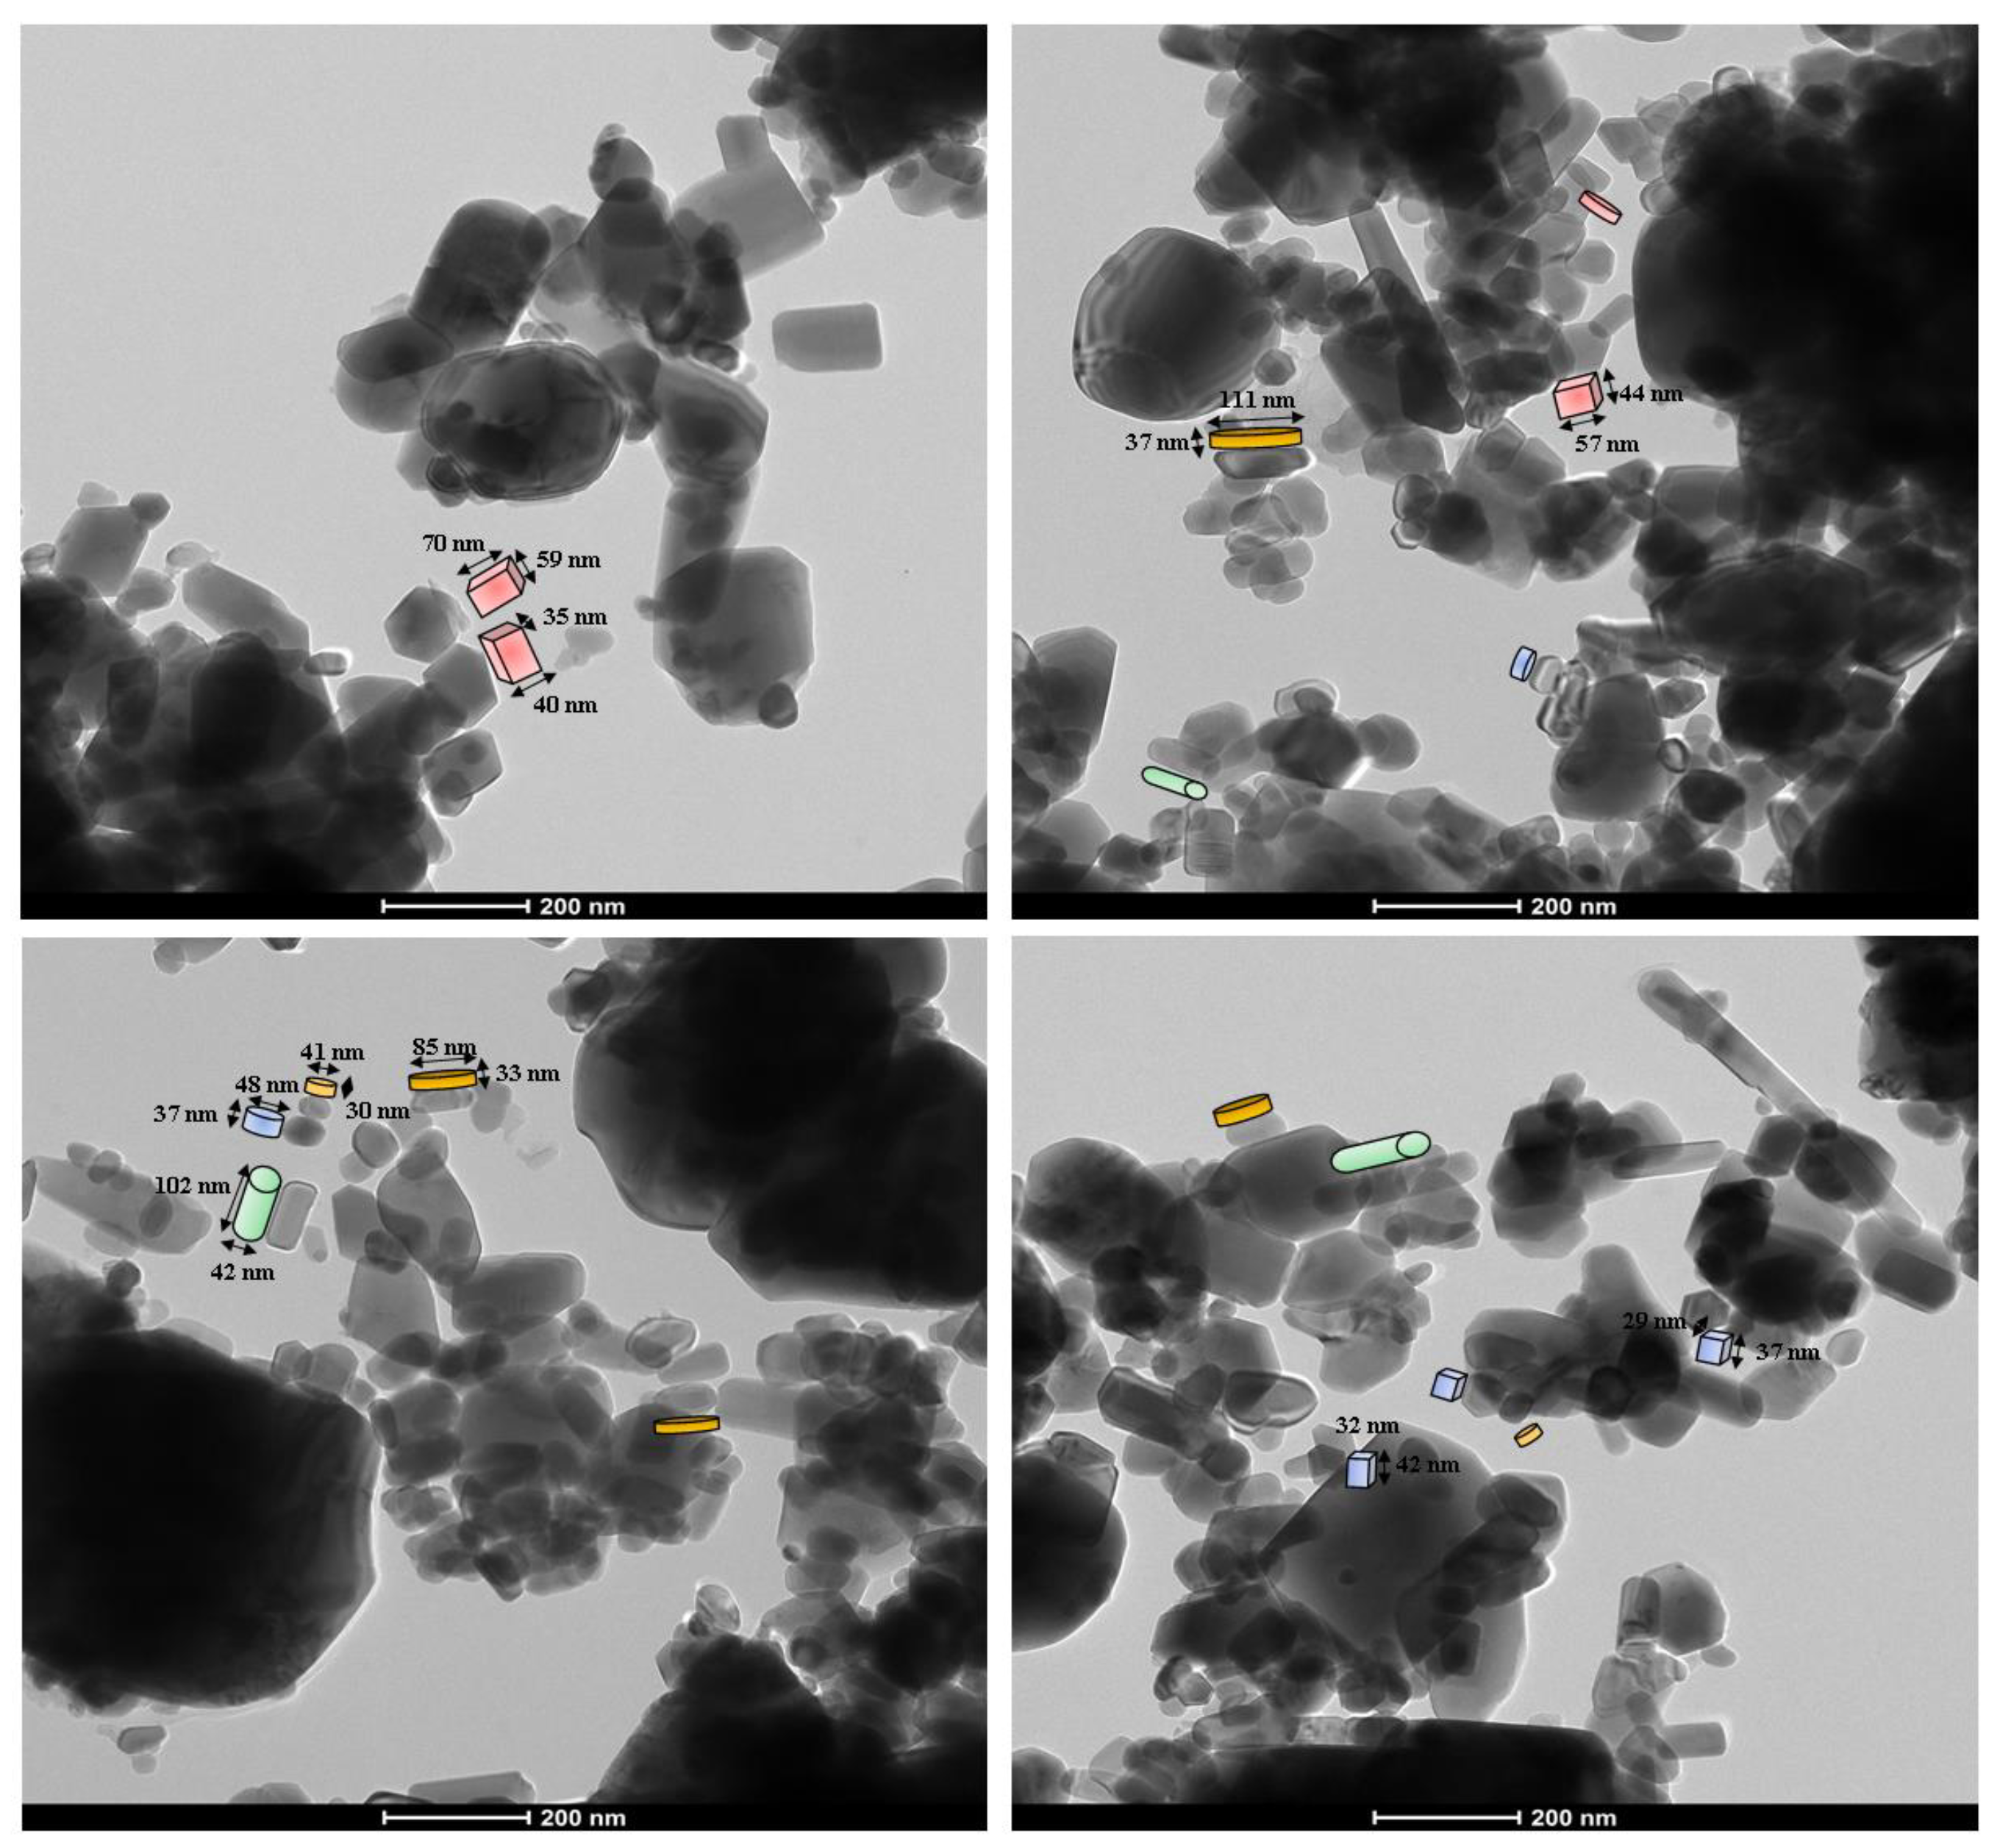
3.3. Morphological Studies
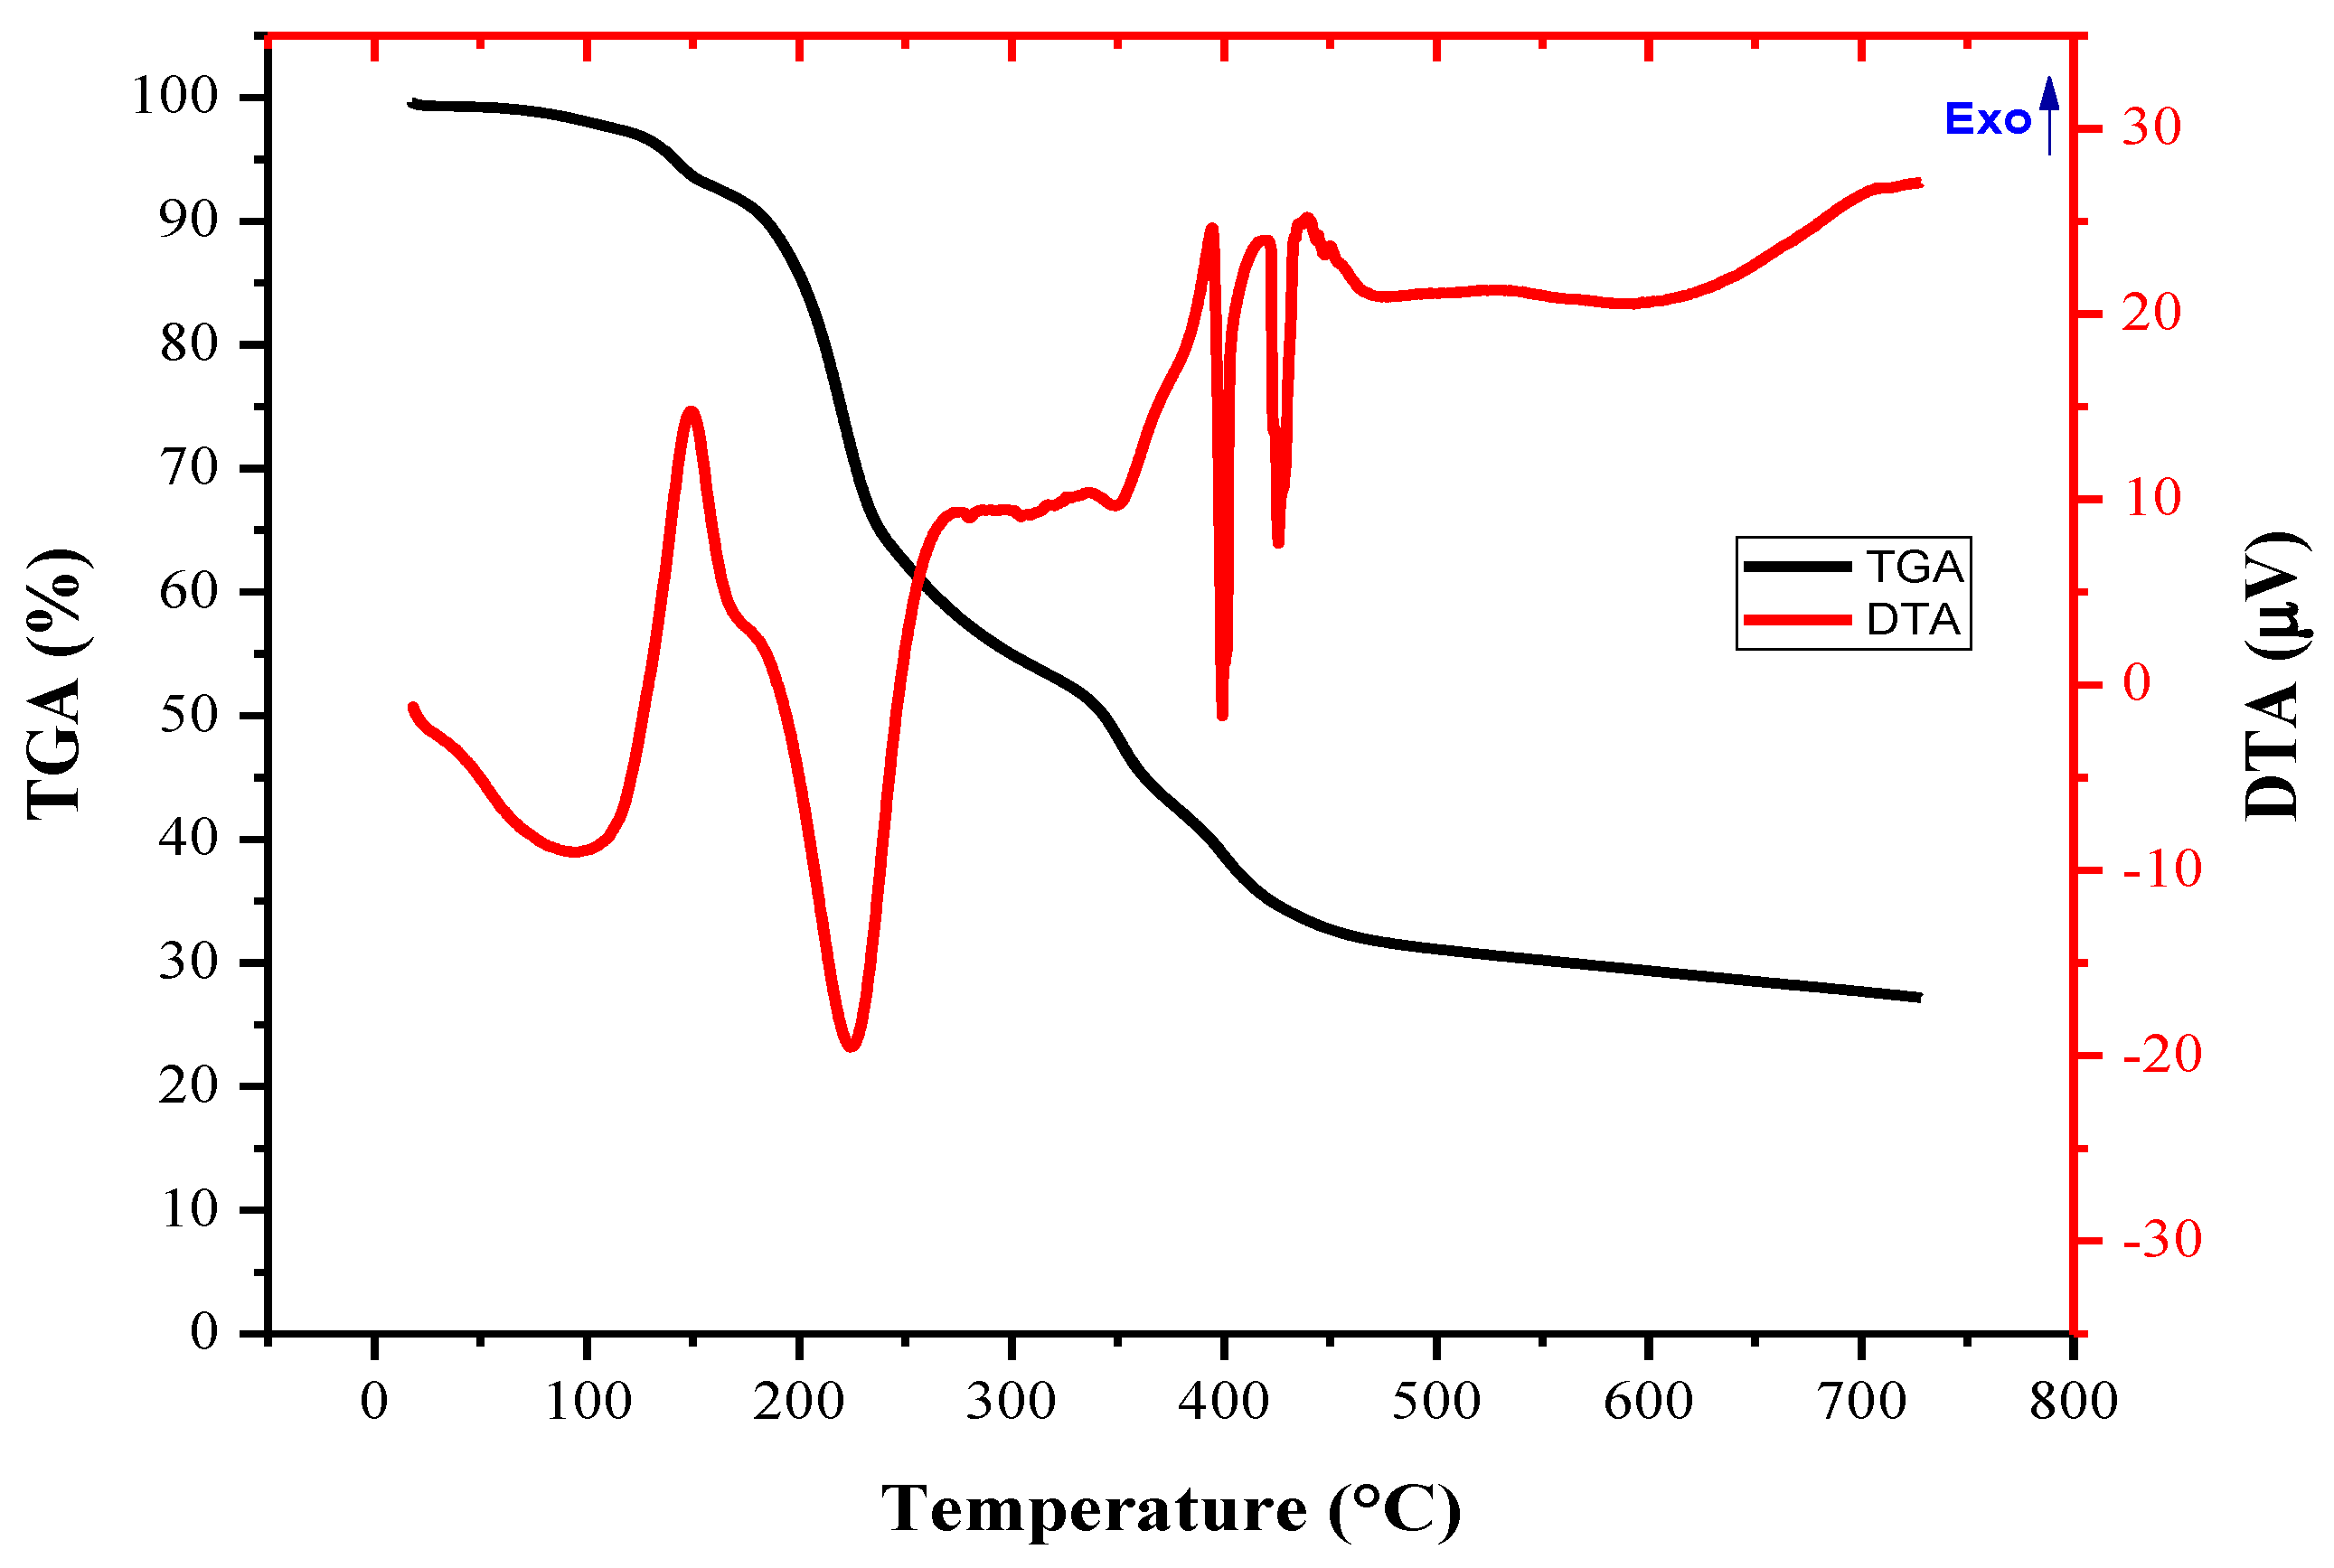
3.4. TGA/DTA Analysis
3.5. Stability and Characterization of Nanofluid
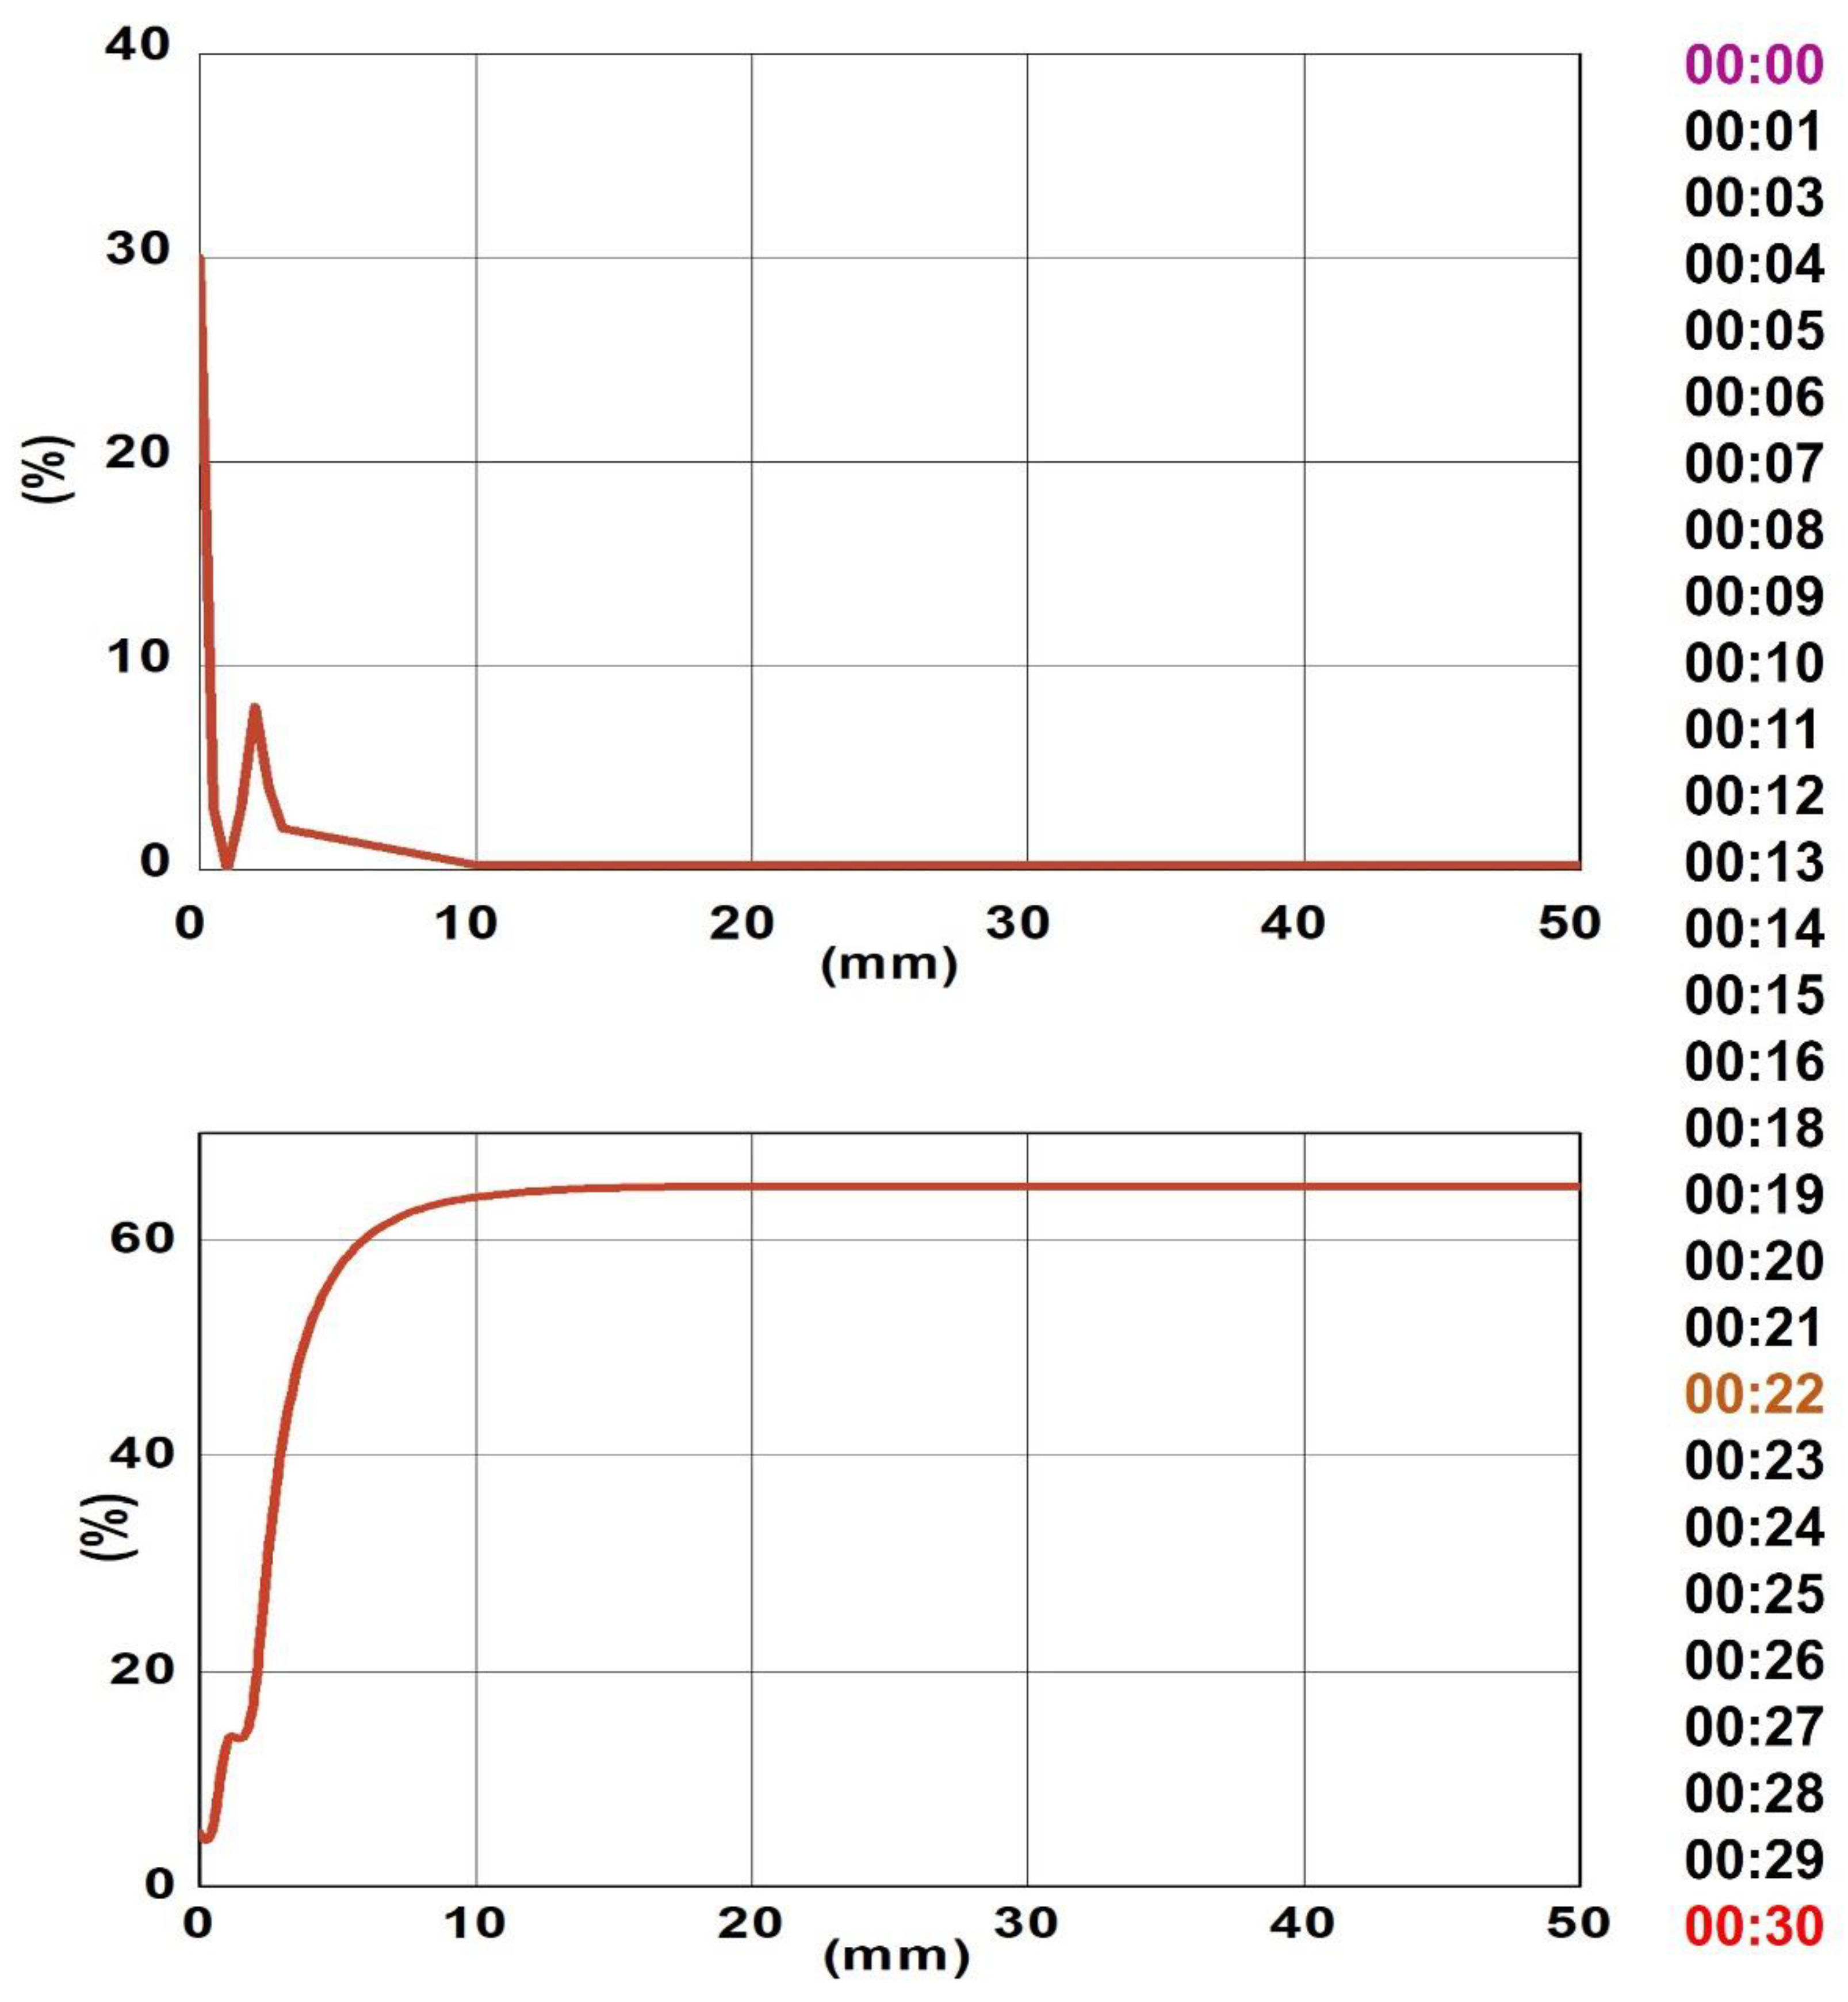
3.5.1. Stability of Nanofluid
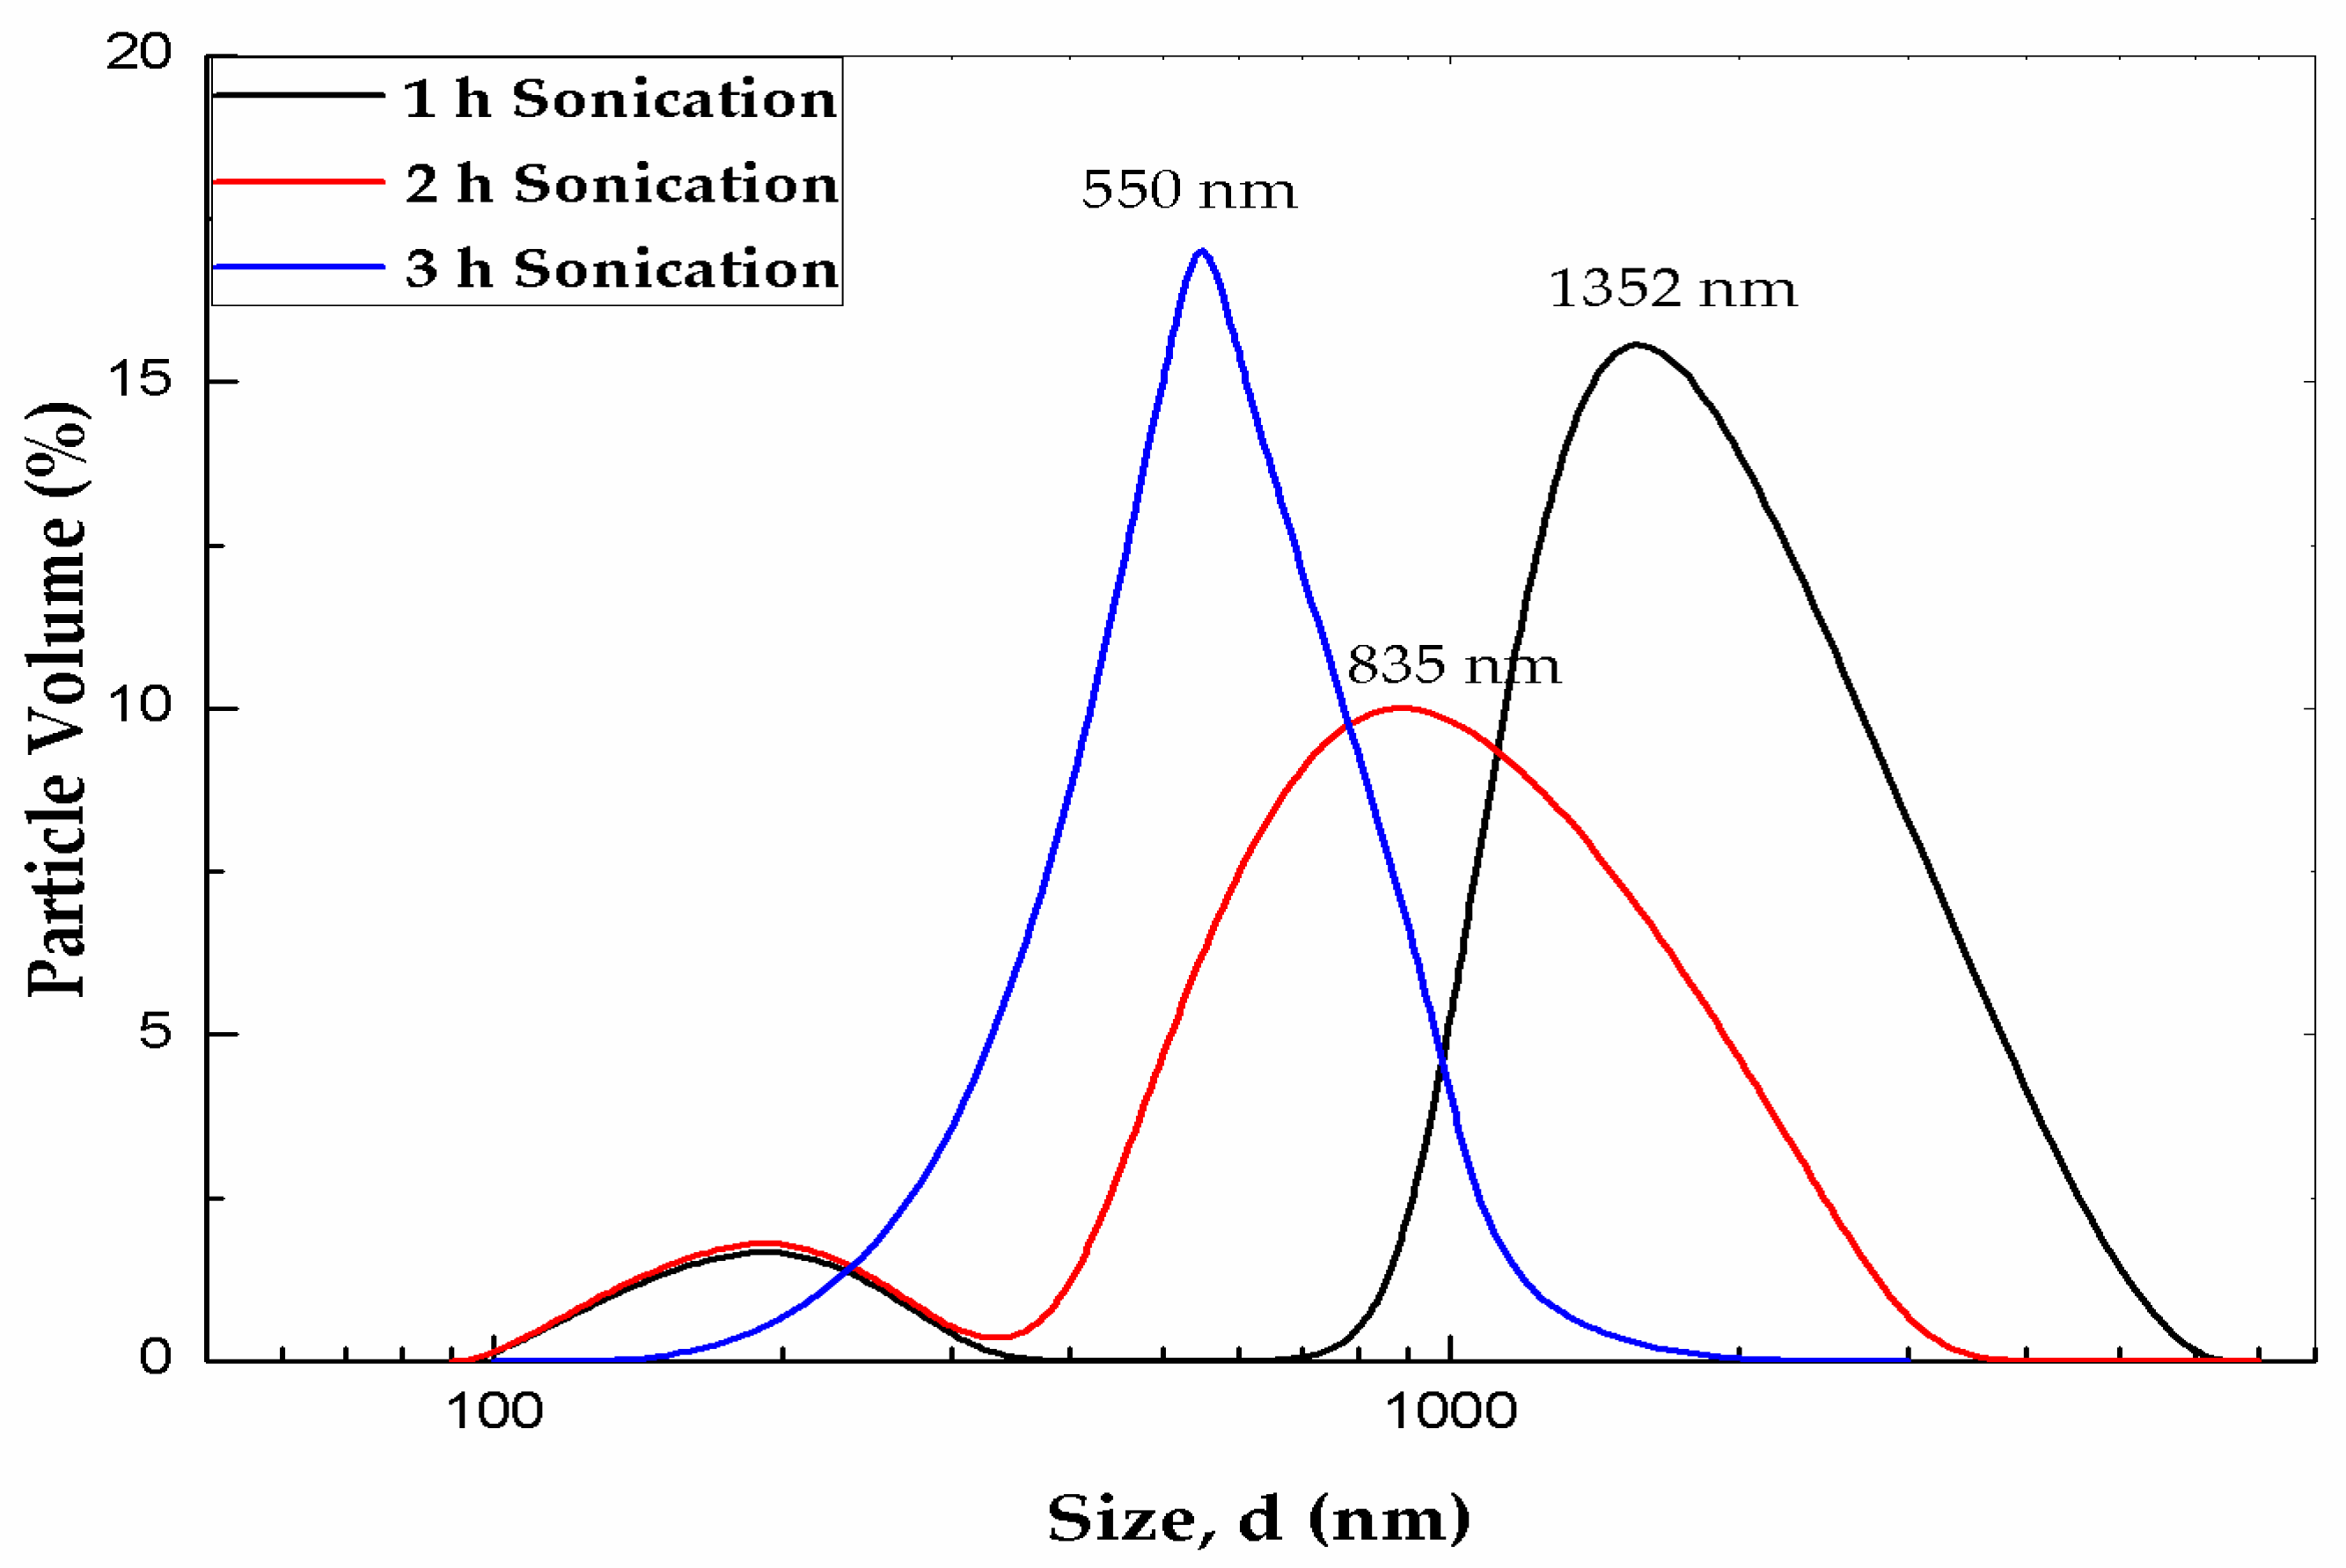
3.5.2. Particle Size Analysis
3.5.3. Zeta Potential Analysis
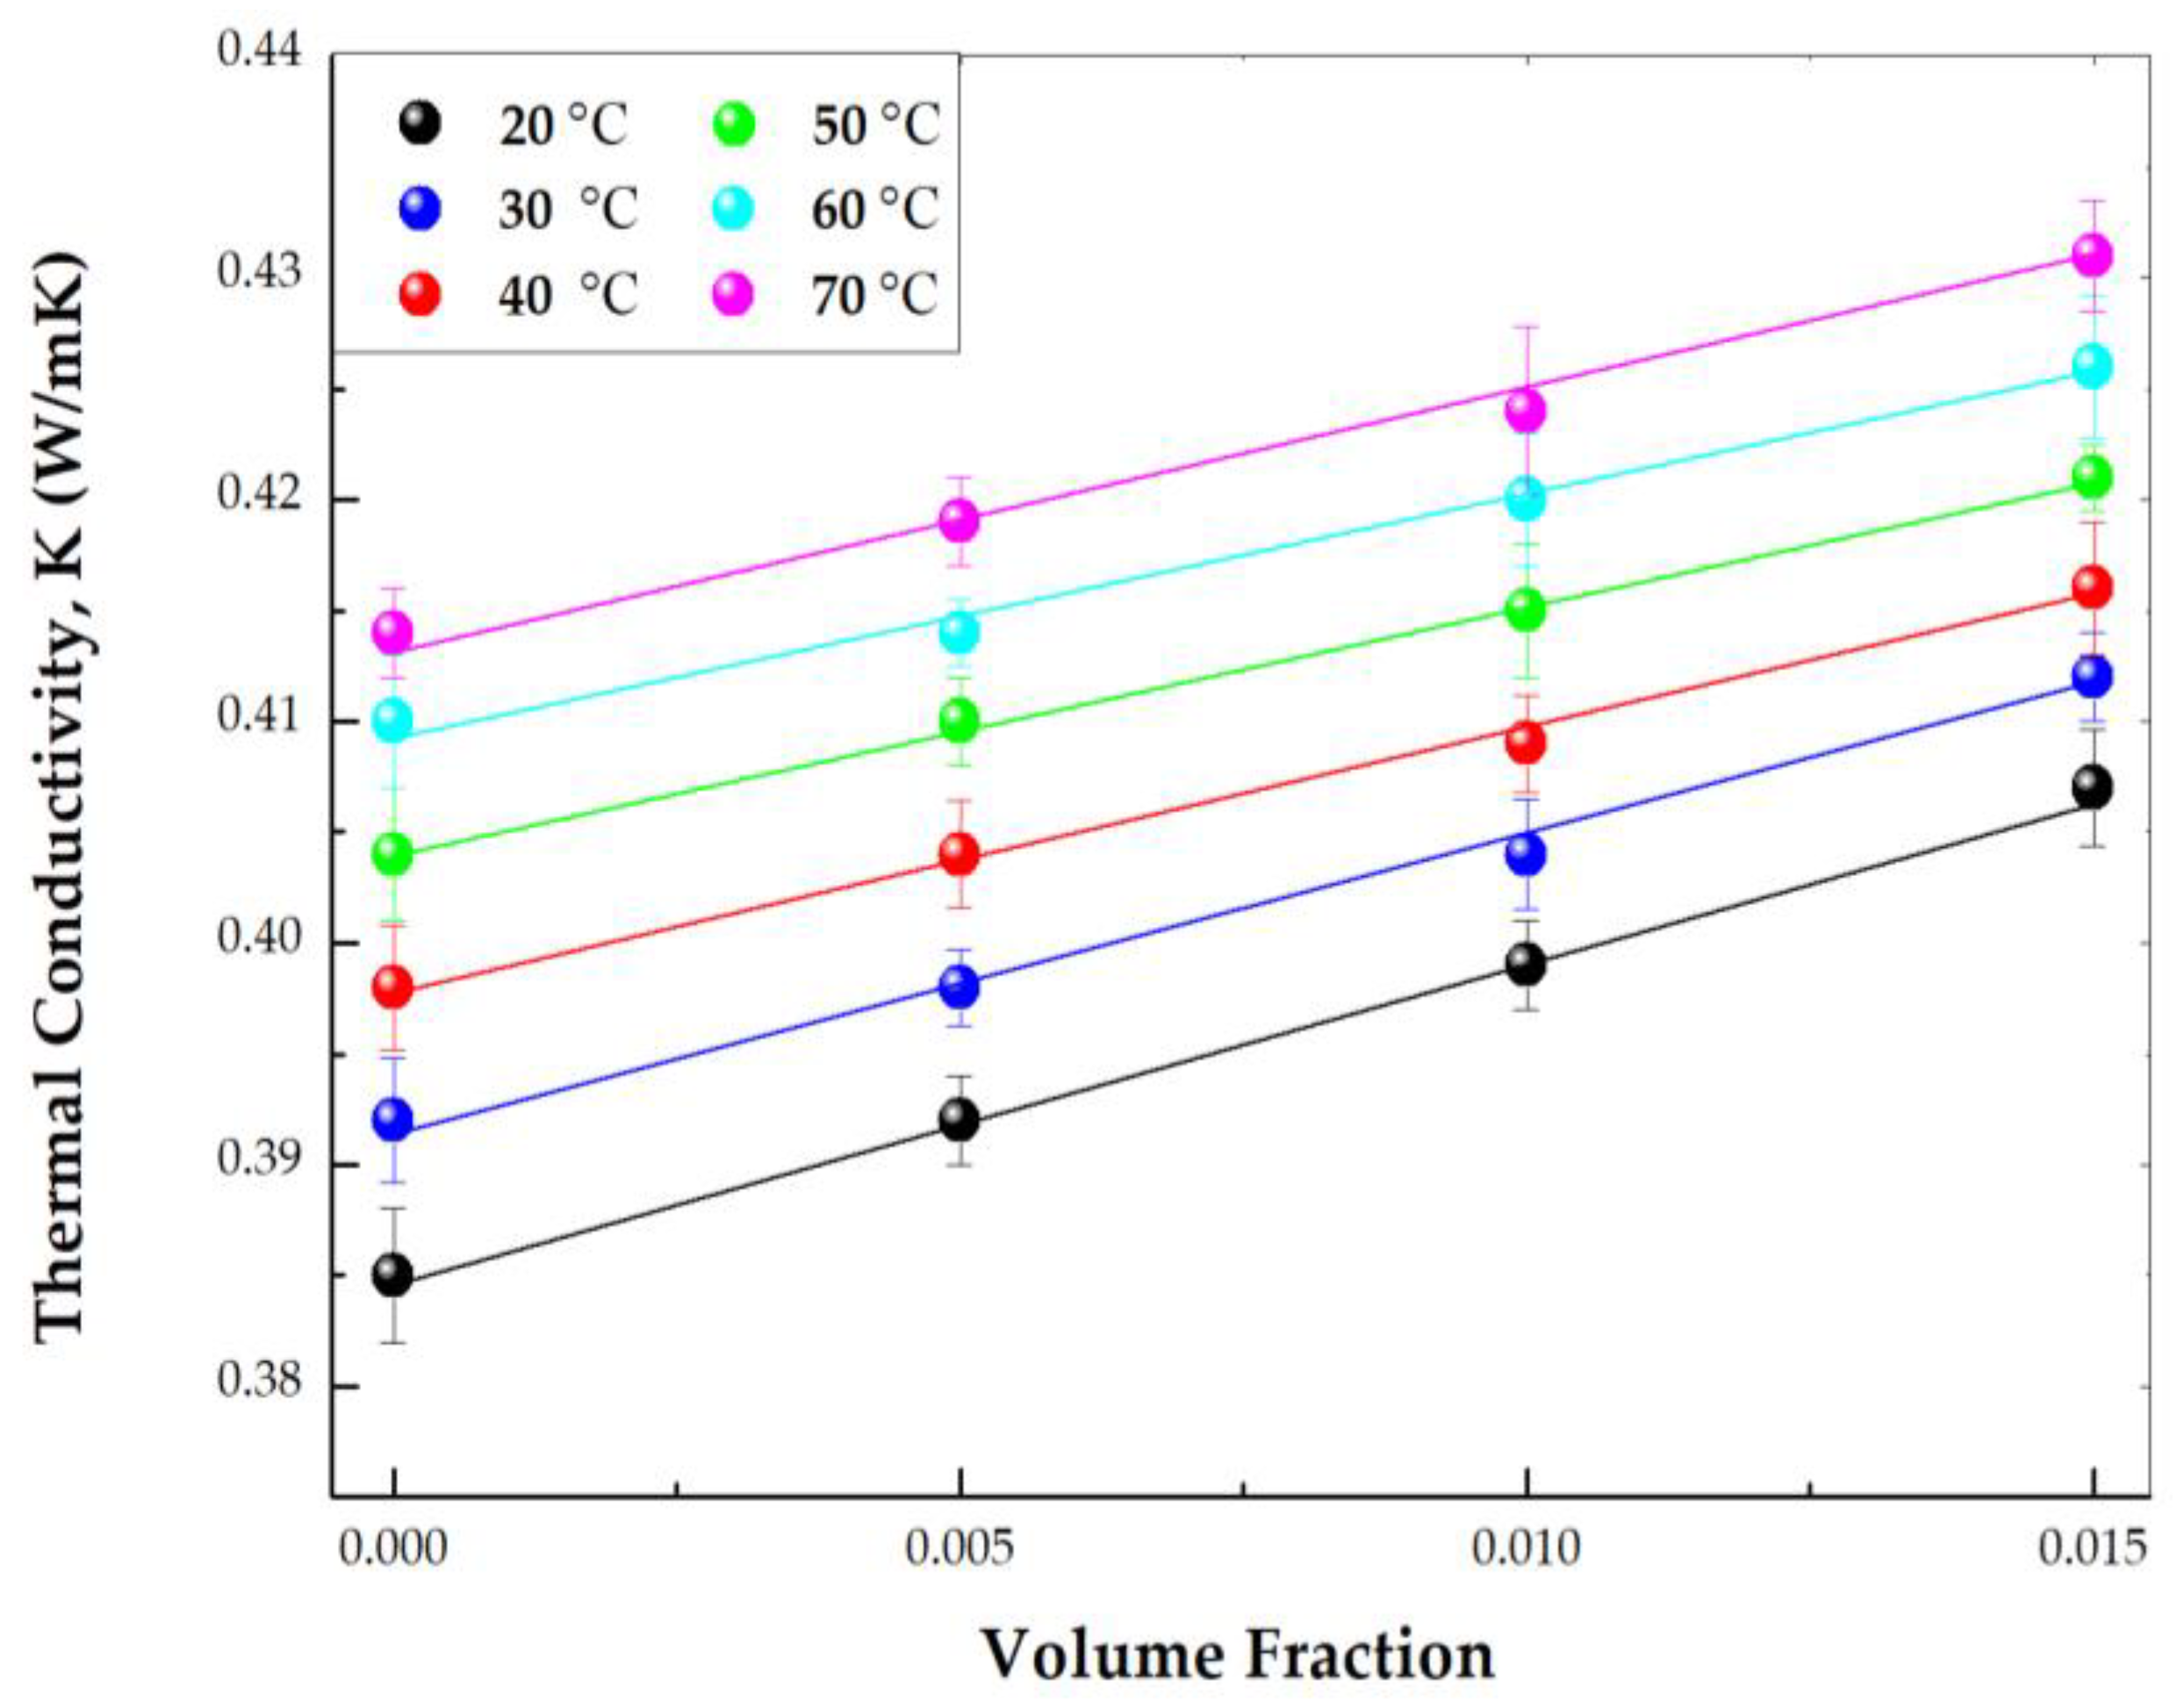
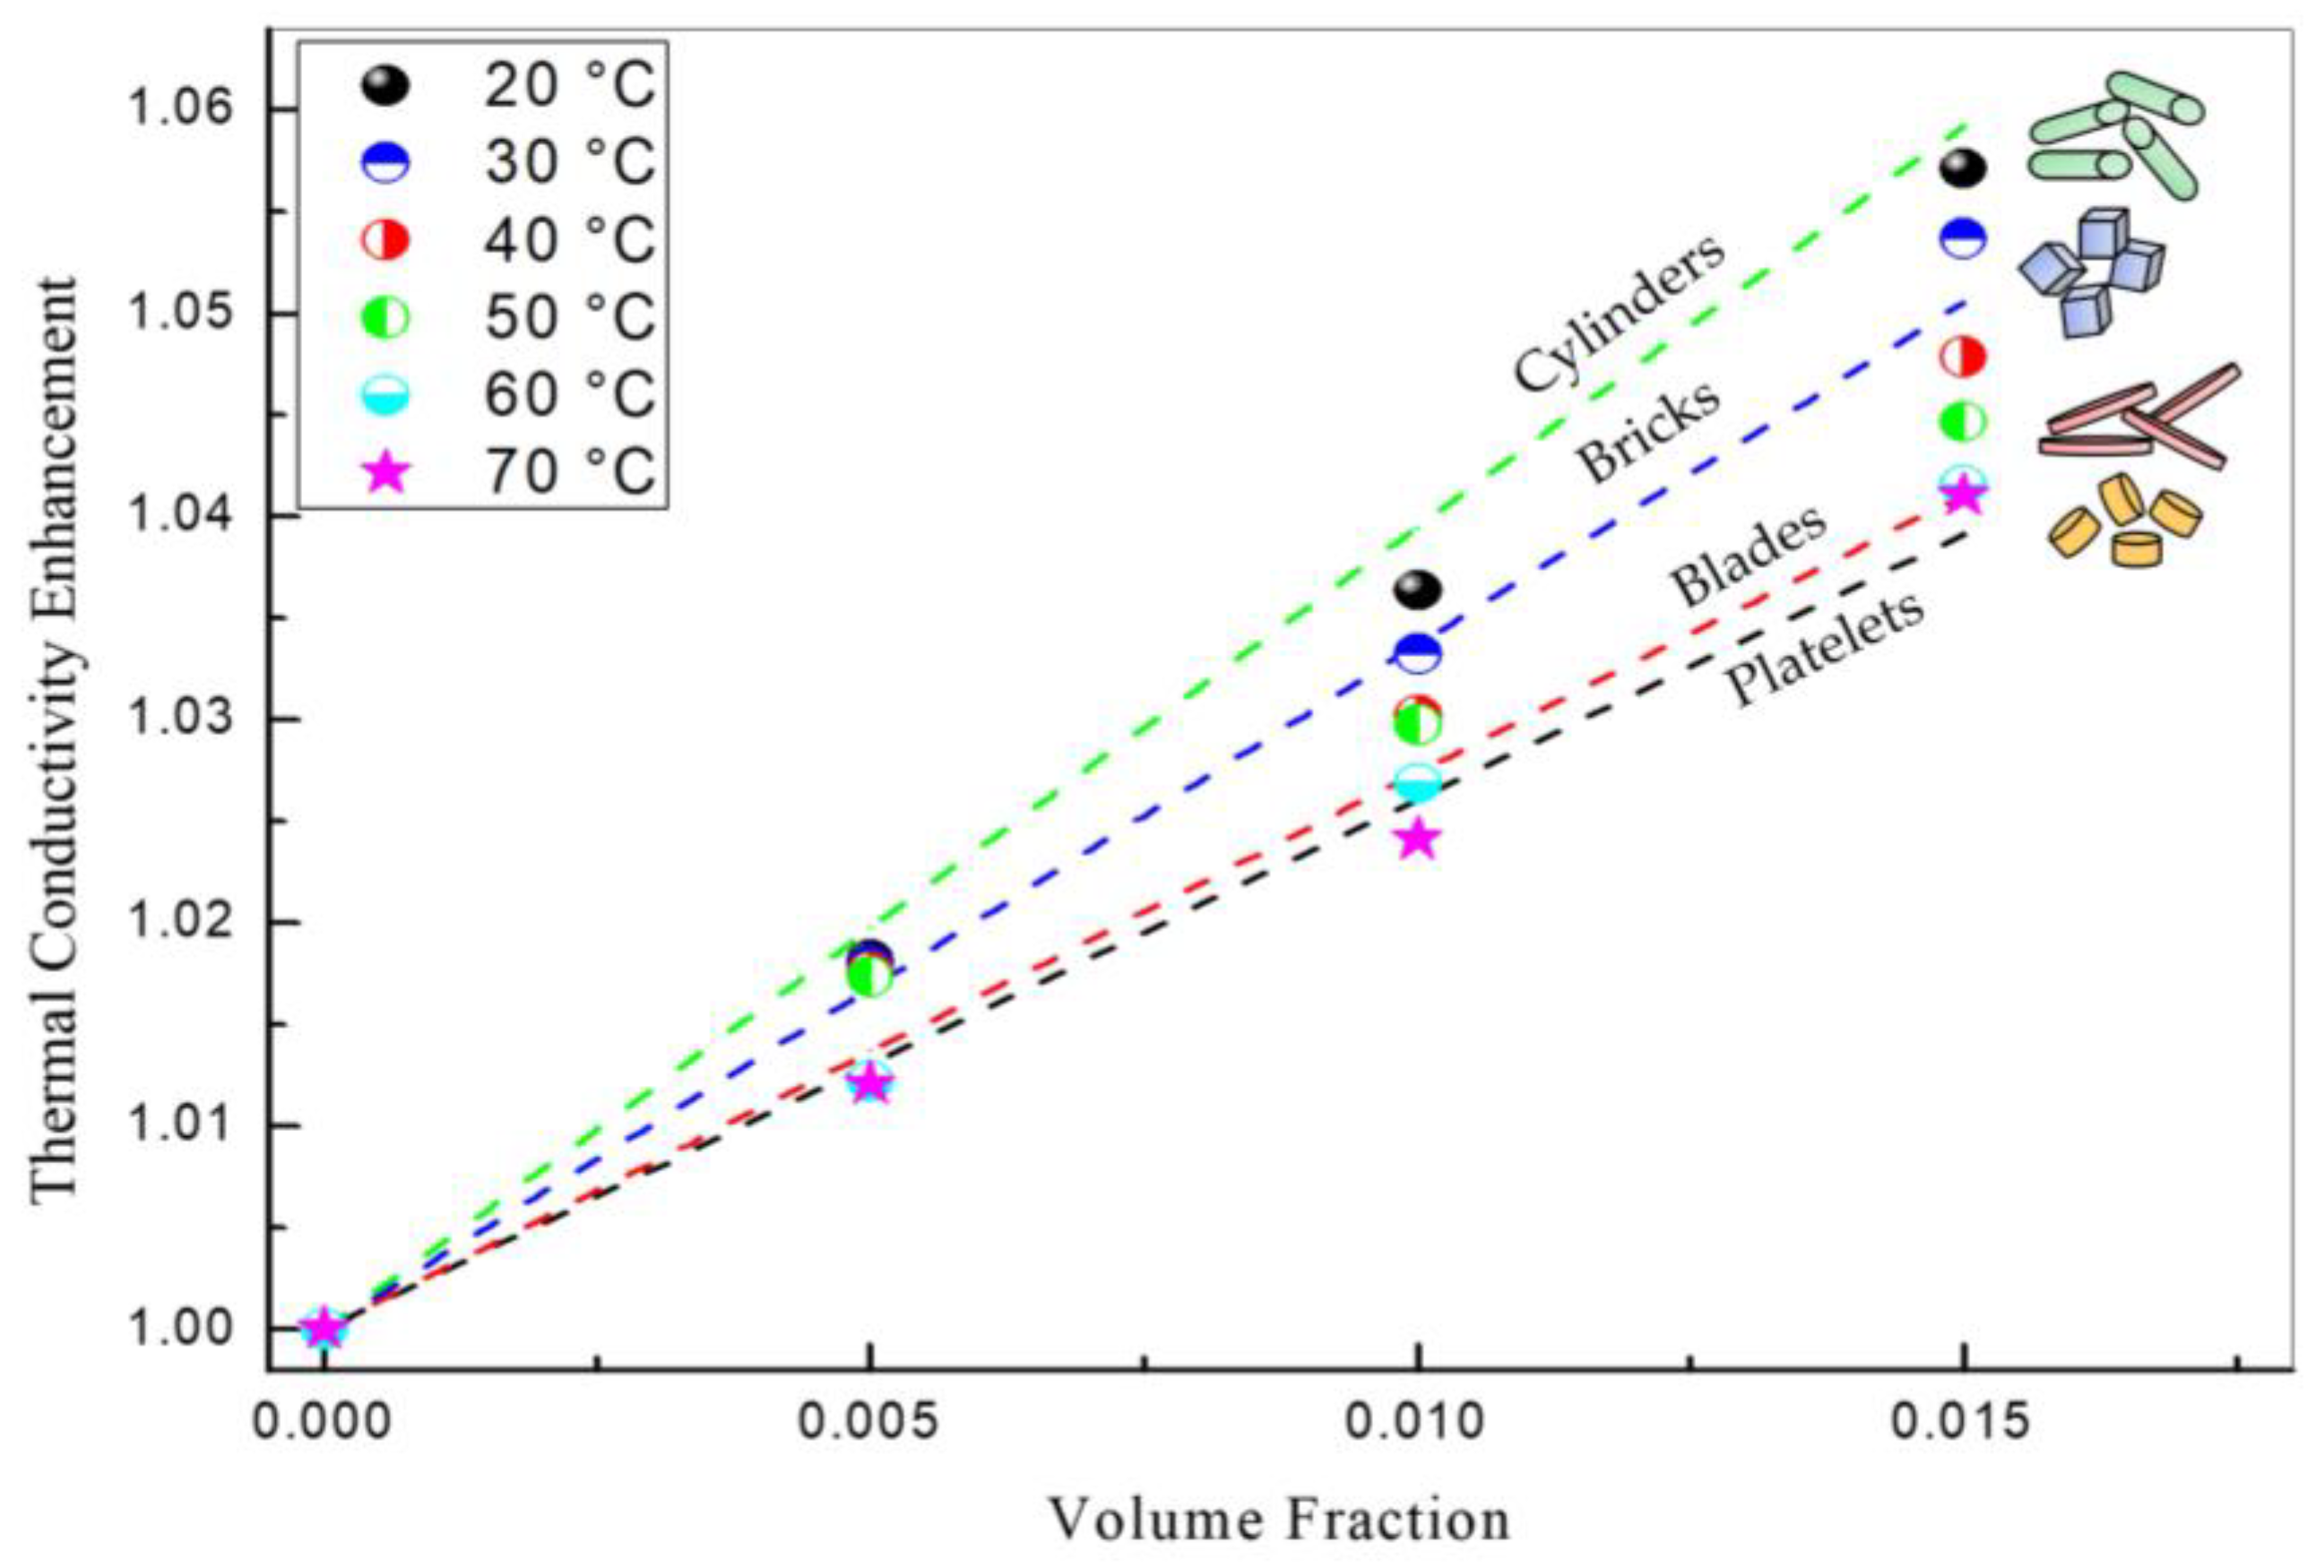
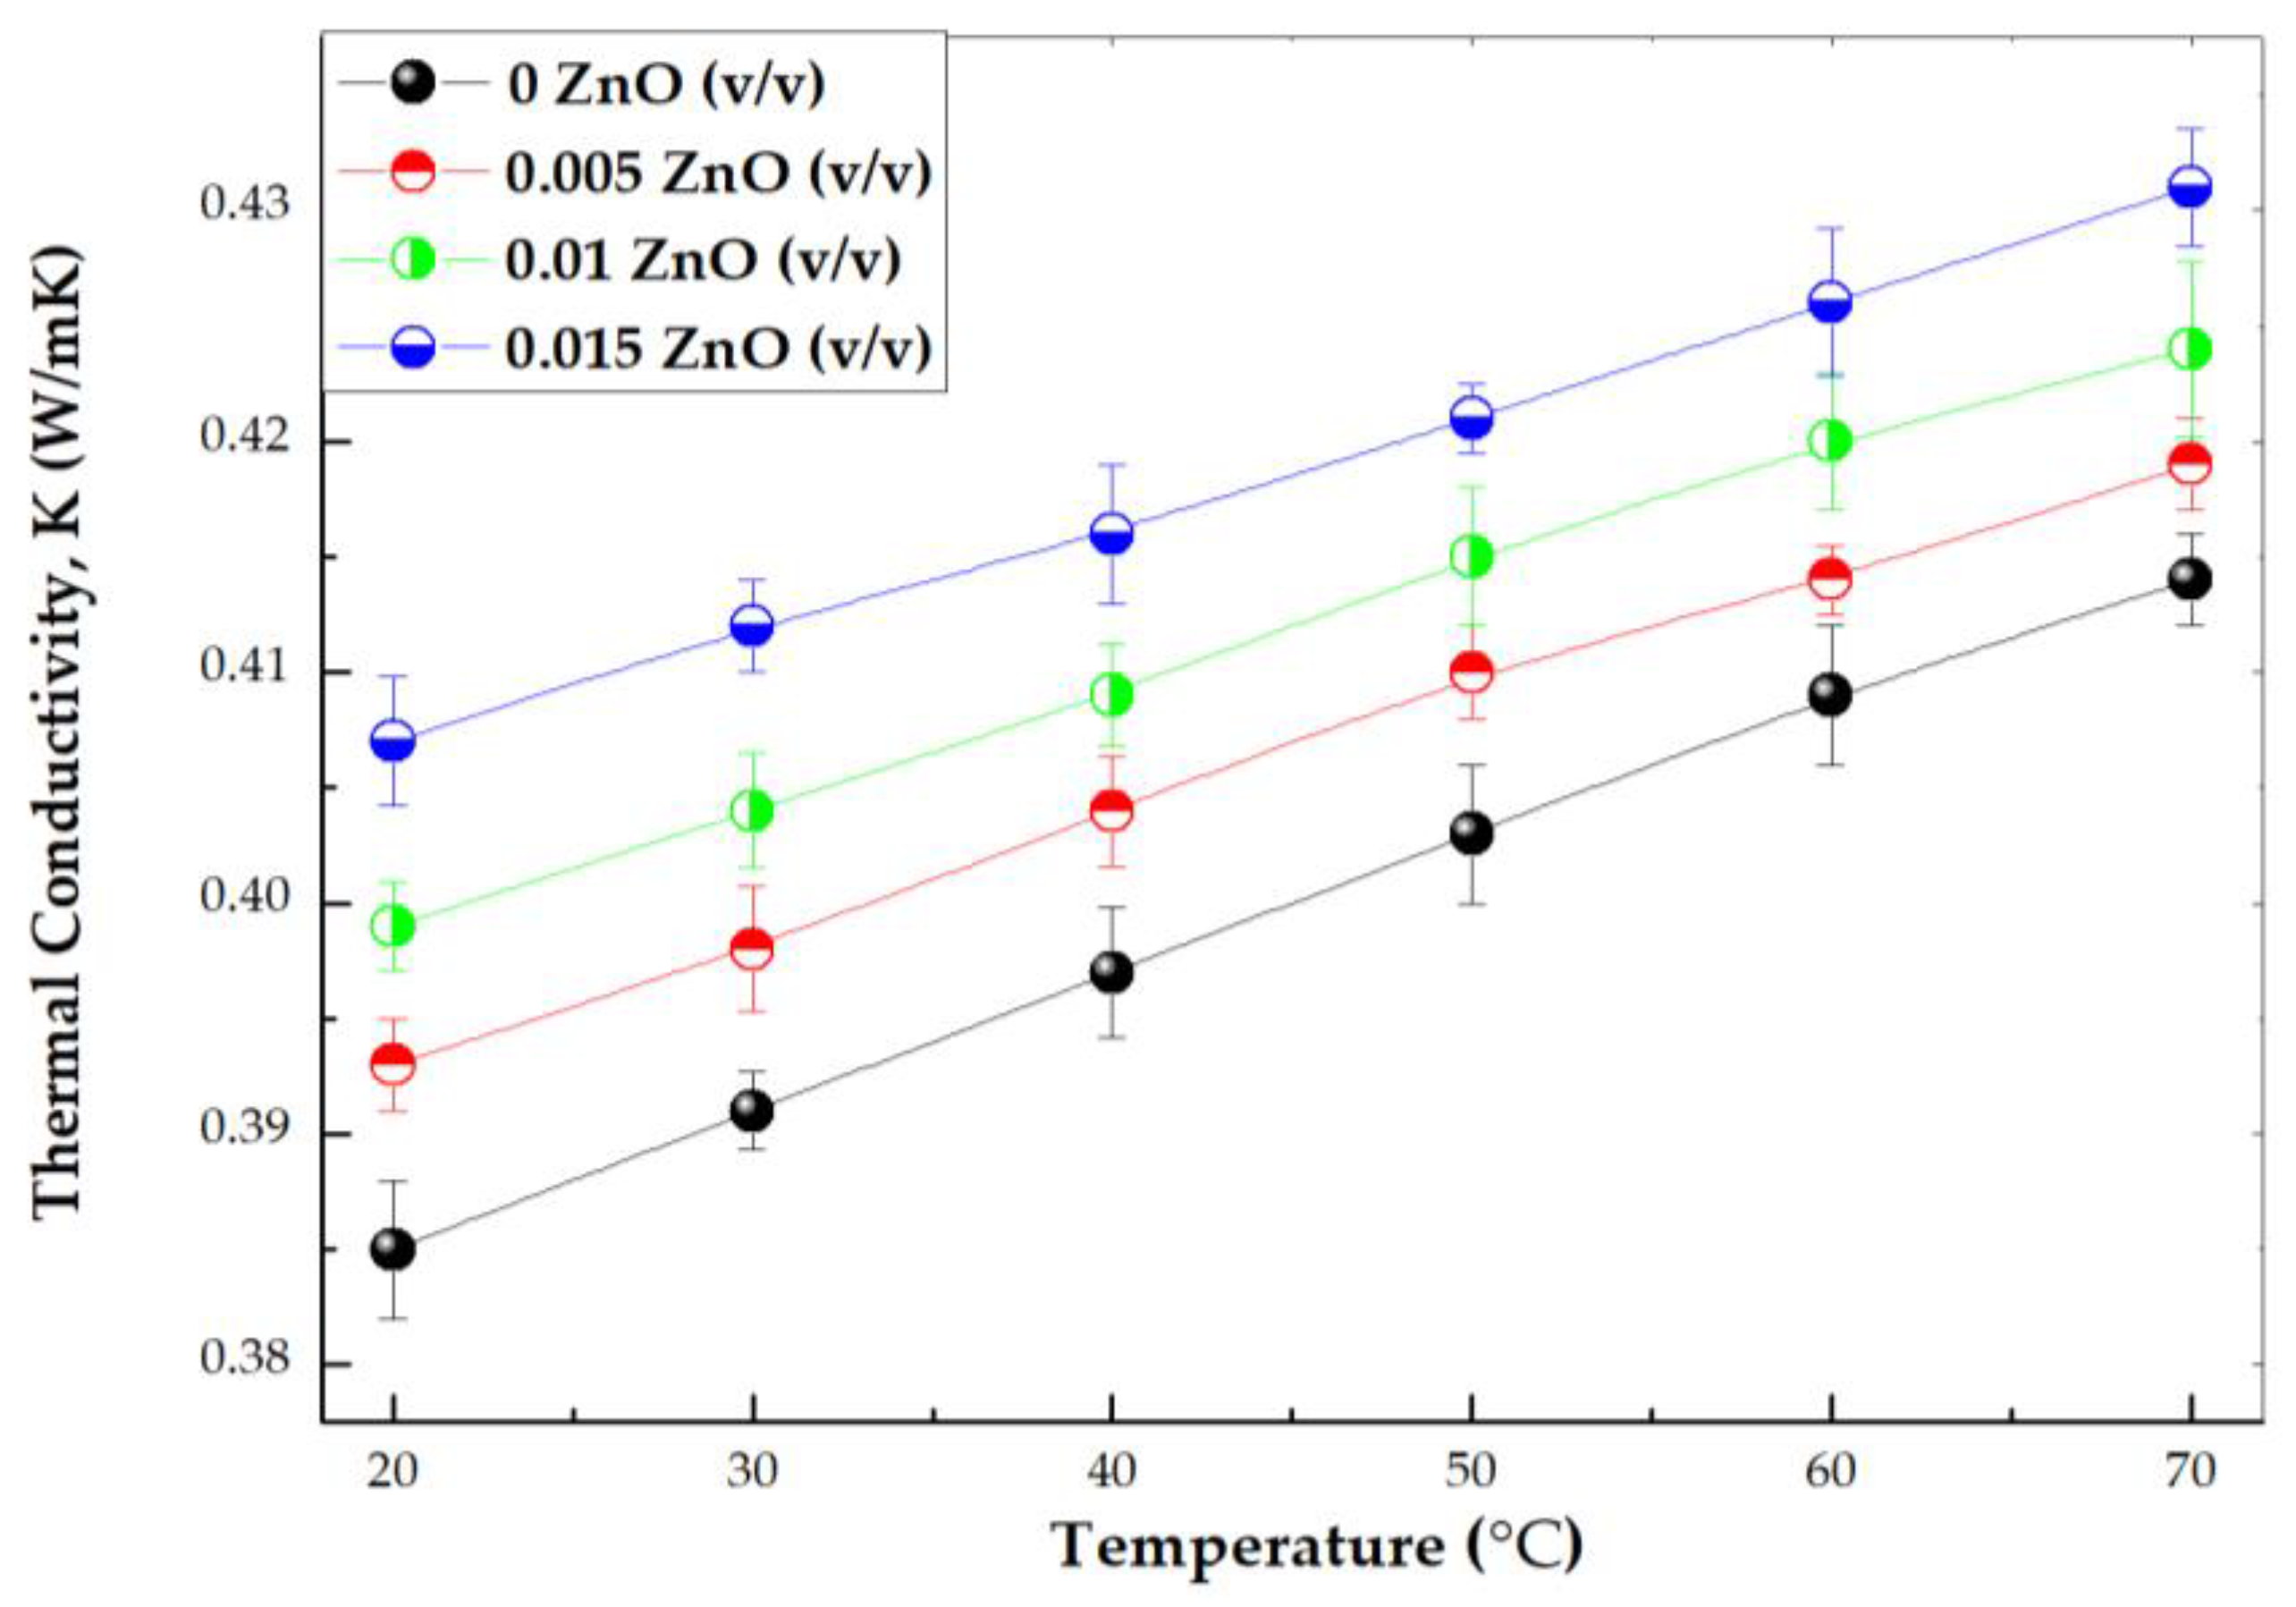
3.6. Thermal Conductivity
4. Conclusions
Author Contributions
Funding
Institutional Review Board Statement
Informed Consent Statement
Data Availability Statement
Acknowledgments
Conflicts of Interest
Nomenclature
| D | average crystallite size (m) |
| W | mass (kg) |
| K | Scherrer constant |
| nm | nanometer |
| T | temperature (°C) |
| R2 | adjustment coefficient |
| Greek symbols | |
| λ | wavelength (m) |
| 𝜌 | density (kg/m3) |
| 𝜙 | volume concentration (%) |
| 𝛽 | full width at half maximum intensity of the peak (m) |
| θ | Bragg’s angle |
| ζ | zeta potential (mV) |
| k0 | thermal conductivity of base fluid (W/m·K) |
| knf | thermal conductivity of nanofluid (W/m·K) |
| Ck | thermal conductivity enhancement coefficient |
| Rk | Kapitza resistance (m2·K/W) |
| lk | thermal resistance length (nm) |
| f | surface particle/volume particle |
| Subscripts | |
| PG | propylene glycol |
| W | water |
| NPs | nanoparticles |
| bf | base fluid |
| Zn2+ | zinc ion |
| P | platelets |
| Br | bricks |
| Bl | blades |
| C | cylinders |
References
- Milanese, M.; Micali, F.; Colangelo, G.; de Risi, A. Experimental Evaluation of a Full-Scale HVAC System Working with Nanofluid. Energies 2022, 15, 2902. [Google Scholar] [CrossRef]
- Colangelo, G.; Raho, B.; Milanese, M.; de Risi, A. Numerical Evaluation of a Hvac System Based on a High-Performance Heat Transfer Fluid. Energies 2021, 14, 3298. [Google Scholar] [CrossRef]
- Levin, M.L.; Miller, M.A. Maxwell’s “Treatise on Electricity and Magnetism”. Sov. Phys. Uspekhi 1981, 24, 904–913. [Google Scholar] [CrossRef]
- Colangelo, G.; Diamante, N.F.; Milanese, M.; Starace, G.; de Risi, A. A Critical Review of Experimental Investigations about Convective Heat Transfer Characteristics of Nanofluids under Turbulent and Laminar Regimes with a Focus on the Experimental Setup. Energies 2021, 14, 6004. [Google Scholar] [CrossRef]
- Heris, S.Z.; Shokrgozar, M.; Poorpharhang, S.; Shanbedi, M.; Noie, S.H. Experimental Study of Heat Transfer of a Car Radiator with CuO/Ethylene Glycol-Water as a Coolant. J. Dispers. Sci. Technol. 2014, 35, 677–684. [Google Scholar] [CrossRef]
- Colangelo, G.; Favale, E.; Milanese, M.; de Risi, A.; Laforgia, D. Cooling of Electronic Devices: Nanofluids Contribution. Appl. Therm. Eng. 2017, 127, 421–435. [Google Scholar] [CrossRef]
- Sarafraz, M.M.; Safaei, M.R.; Tian, Z.; Goodarzi, M. Nano-Suspension in a Compact Heat Exchanger. Energies 2019, 12, 17. [Google Scholar]
- Kulkarni, D.P.; Vajjha, R.S.; Das, D.K.; Oliva, D. Application of Aluminum Oxide Nanofluids in Diesel Electric Generator as Jacket Water Coolant. Appl. Therm. Eng. 2008, 28, 1774–1781. [Google Scholar] [CrossRef]
- Huminic, G.; Huminic, A. Application of Nanofluids in Heat Exchangers: A Review. Renew. Sustain. Energy Rev. 2012, 16, 5625–5638. [Google Scholar] [CrossRef]
- Mert, S.; Yasar, H.; Durmaz, U.; Topuz, A.; Yeter, A.; Engin, T. An experimental study on cooling performance of a car radiator using al2o3-ethylene glycol/water nanofluid. Therm. Sci. 2021, 25, 801–809. [Google Scholar] [CrossRef]
- Satti, J.R.; Das, D.K.; Ray, D.R. Measurements of Densities of Propylene Glycol-Based Nanofluids and Comparison with Theory. J. Therm. Sci. Eng. Appl. 2016, 8, 021021. [Google Scholar] [CrossRef]
- Topuz, A.; Engin, T.; Alper Özalp, A.; Erdoğan, B.; Mert, S.; Yeter, A. Experimental Investigation of Optimum Thermal Performance and Pressure Drop of Water-Based Al2O3, TiO2 and ZnO Nanofluids Flowing inside a Circular Microchannel. J. Therm. Anal. Calorim. 2018, 131, 2843–2863. [Google Scholar] [CrossRef]
- Suganthi, K.S.; Rajan, K.S. A Formulation Strategy for Preparation of ZnO-Propylene Glycol-Water Nanofluids with Improved Transport Properties. Int. J. Heat Mass Transf. 2014, 71, 653–663. [Google Scholar] [CrossRef]
- Li, H.; Wang, L.; He, Y.; Hu, Y.; Zhu, J.; Jiang, B. Experimental Investigation of Thermal Conductivity and Viscosity of Ethylene Glycol Based ZnO Nanofluids. Appl. Therm. Eng. 2014, 88, 363–368. [Google Scholar] [CrossRef]
- Gan, Y.Y.; Ong, H.C.; Ling, T.C.; Zulkifli, N.W.M.; Wang, C.T.; Yang, Y.C. Thermal Conductivity Optimization and Entropy Generation Analysis of Titanium Dioxide Nanofluid in Evacuated Tube Solar Collector. Appl. Therm. Eng. 2018, 145, 155–164. [Google Scholar] [CrossRef]
- Hemmat Esfe, M.; Esfandeh, S. Rheological Behavior of CuO/EG:W (20:80 v/v) Nanofluid from a Thermal Perspective. J. Therm. Anal. Calorim. 2019, 135, 61–72. [Google Scholar] [CrossRef]
- Sundar, L.S.; Singh, M.K.; Sousa, A.C.M. Thermal Conductivity of Ethylene Glycol and Water Mixture Based Fe3O4 Nanofluid. Int. Commun. Heat Mass Transf. 2013, 49, 17–24. [Google Scholar] [CrossRef]
- Syam Sundar, L.; Venkata Ramana, E.; Singh, M.K.; De Sousa, A.C.M. Viscosity of Low Volume Concentrations of Magnetic Fe3O4 Nanoparticles Dispersed in Ethylene Glycol and Water Mixture. Chem. Phys. Lett. 2012, 554, 236–242. [Google Scholar] [CrossRef]
- Esfahani, M.A.; Toghraie, D. Experimental Investigation for Developing a New Model for the Thermal Conductivity of Silica/Water-Ethylene Glycol (40–60%) Nanofluid at Different Temperatures and Solid Volume Fractions. J. Mol. Liq. 2017, 232, 105–112. [Google Scholar] [CrossRef]
- Selvaraj, V.; Krishnan, H. Synthesis of Graphene Encased Alumina and Its Application as Nanofluid for Cooling of Heat-Generating Electronic Devices. Powder Technol. 2020, 363, 665–675. [Google Scholar] [CrossRef]
- Nawaz, S.; Babar, H.; Ali, H.M.; Sajid, M.U.; Janjua, M.M.; Said, Z.; Tiwari, A.K.; Syam Sundar, L.; Li, C. Oriented Square Shaped Pin-Fin Heat Sink: Performance Evaluation Employing Mixture Based on Ethylene Glycol/Water Graphene Oxide Nanofluid. Appl. Therm. Eng. 2022, 206, 118085. [Google Scholar] [CrossRef]
- Shahsavani, E.; Afrand, M.; Kalbasi, R. Experimental Study on Rheological Behavior of Water–Ethylene Glycol Mixture in the Presence of Functionalized Multi-Walled Carbon Nanotubes: A Novel Correlation for the Non-Newtonian Nanofluid. J. Therm. Anal. Calorim. 2018, 131, 1177–1185. [Google Scholar] [CrossRef]
- Sundar, L.S.; Singh, M.K.; Sousa, A.C.M. Experimental Thermal Conductivity and Viscosity of Nanodiamond-Based Propylene Glycol and Water Mixtures. Diam. Relat. Mater. 2016, 69, 49–60. [Google Scholar] [CrossRef]
- Zhang, L.; Jiang, Y.; Ding, Y.; Daskalakis, N.; Jeuken, L.; Povey, M.; O’Neill, A.J.; York, D.W. Mechanistic Investigation into Antibacterial Behaviour of Suspensions of ZnO Nanoparticles against E. Coli. J. Nanoparticle Res. 2010, 12, 1625–1636. [Google Scholar] [CrossRef]
- Zhang, L.; Jiang, Y.; Ding, Y.; Povey, M.; York, D. Investigation into the Antibacterial Behaviour of Suspensions of ZnO Nanoparticles (ZnO Nanofluids). J. Nanoparticle Res. 2007, 9, 479–489. [Google Scholar] [CrossRef]
- Qasim, M.; Sajid Kamran, M.; Ammar, M.; Ali Jamal, M.; Yasar Javaid, M. Heat Transfer Enhancement of an Automobile Engine Radiator Using ZnO Water Base Nanofluids. J. Therm. Sci. 2020, 29, 1010–1024. [Google Scholar] [CrossRef]
- Khatak, P.; Jakhar, R.; Kumar, M. Enhancement in Cooling of Electronic Components by Nanofluids. J. Inst. Eng. Ser. C 2015, 96, 245–251. [Google Scholar] [CrossRef]
- Roguai, S.; Djelloul, A. Structural, Microstructural and Photocatalytic Degradation of Methylene Blue of Zinc Oxide and Fe-Doped ZnO Nanoparticles Prepared by Simple Coprecipitation Method. Solid State Commun. 2021, 334–335, 114362. [Google Scholar] [CrossRef]
- Xu, L.; Hu, Y.L.; Pelligra, C.; Chen, C.H.; Jin, L.; Huang, H.; Sithambaram, S.; Aindow, M.; Joesten, R.; Suib, S.L. ZnO with Different Morphologies Synthesized by Solvothermal Methods for Enhanced Photocatalytic Activity. Chem. Mater. 2009, 21, 2875–2885. [Google Scholar] [CrossRef]
- Ferrão, P.; Al, K.; Awad, S. Synthesis of ZnO Nanopowders By Using Sol-Gel and Studying Their Structural and Electrical Properties at Different Temperature. Energy Procedia 2017, 119, 565–570. [Google Scholar]
- ElFaham, M.M.; Mostafa, A.M.; Mwafy, E.A. The Effect of Reaction Temperature on Structural, Optical and Electrical Properties of Tunable ZnO Nanoparticles Synthesized by Hydrothermal Method. J. Phys. Chem. Solids 2021, 154, 110089. [Google Scholar] [CrossRef]
- Awad, M.A.; Ibrahim, E.M.M.; Ahmed, A.M. Synthesis and Thermal Stability of ZnO Nanowires. J. Therm. Anal. Calorim. 2014, 117, 635–642. [Google Scholar] [CrossRef]
- Yudha, C.S.; Hutama, A.P.; Rahmawati, M.; Widiyandari, H.; Nursukatmo, H.; Nilasary, H.; Oktaviano, H.S.; Purwanto, A. Synthesis and Characterization of Zno from Thermal Decomposition of Precipitated Zinc Oxalate Dihydrate as an Anode Material of Li-Ion Batteries. Energies 2021, 14, 5980. [Google Scholar] [CrossRef]
- Pauzi, N.; Zain, N.M.; Yusof, N.A.A. Gum Arabic as Natural Stabilizing Agent in Green Synthesis of ZnO Nanofluids for Antibacterial Application. J. Environ. Chem. Eng. 2020, 8, 103331. [Google Scholar] [CrossRef]
- Thema, F.T.; Manikandan, E.; Dhlamini, M.S.; Maaza, M. Green Synthesis of ZnO Nanoparticles via Agathosma betulina Natural Extract. Mater. Lett. 2015, 161, 124–127. [Google Scholar] [CrossRef]
- Davar, F.; Majedi, A.; Mirzaei, A. Green Synthesis of ZnO Nanoparticles and Its Application in the Degradation of Some Dyes. J. Am. Ceram. Soc. 2015, 98, 1739–1746. [Google Scholar] [CrossRef]
- Sorbiun, M.; Shayegan Mehr, E.; Ramazani, A.; Taghavi Fardood, S. Green Synthesis of Zinc Oxide and Copper Oxide Nanoparticles Using Aqueous Extract of Oak Fruit Hull (Jaft) and Comparing Their Photocatalytic Degradation of Basic Violet 3. Int. J. Environ. Res. 2018, 12, 29–37. [Google Scholar] [CrossRef]
- Doan Thi, T.U.; Nguyen, T.T.; Thi, Y.D.; Ta Thi, K.H.; Phan, B.T.; Pham, K.N. Green Synthesis of ZnO Nanoparticles Using Orange Fruit Peel Extract for Antibacterial Activities. RSC Adv. 2020, 10, 23899–23907. [Google Scholar] [CrossRef]
- Nava, O.J.; Soto-Robles, C.A.; Gómez-Gutiérrez, C.M.; Vilchis-Nestor, A.R.; Castro-Beltrán, A.; Olivas, A.; Luque, P.A. Fruit Peel Extract Mediated Green Synthesis of Zinc Oxide Nanoparticles. J. Mol. Struct. 2017, 1147, 1–6. [Google Scholar] [CrossRef]
- Ain Samat, N.; Md Nor, R. Sol-Gel Synthesis of Zinc Oxide Nanoparticles Using Citrus aurantifolia Extracts. Ceram. Int. 2013, 39, S545–S548. [Google Scholar] [CrossRef]
- Bandeira, M.; Giovanela, M.; Roesch-ely, M.; Devine, D.M.; Crespo, S. Green Synthesis of Zinc Oxide Nanoparticles: A Review of the Synthesis Methodology and Mechanism of Formation. Sustain. Chem. Pharm. 2020, 15, 100223. [Google Scholar] [CrossRef]
- Faisal, S.; Jan, H.; Shah, S.A.; Shah, S.; Khan, A.; Akbar, M.T.; Rizwan, M.; Jan, F.; Wajidullah; Akhtar, N.; et al. Green Synthesis of Zinc Oxide (ZnO) Nanoparticles Using Aqueous Fruit Extracts of Myristica Fragrans: Their Characterizations and Biological and Environmental Applications. ACS Omega 2021, 6, 9709–9722. [Google Scholar] [CrossRef]
- Gargouri, B.; Ammar, S.; Verardo, V.; Besbes, S.; Segura-Carretero, A.; Bouaziz, M. RP-HPLC–DAD-ESI-TOF–MS based strategy for new insights into the qualitative and quantitative phenolic profile in Tunisian industrial Citrus Limon by-product and their antioxidant activity. Eur. Food Res. Technol. 2017, 243, 2011–2024. [Google Scholar] [CrossRef]
- Azizi, S.; Mohamad, R.; Shahri, M.M. Green Microwave-Assisted Combustion Synthesis of Zinc Oxide Nanoparticles with Citrullus colocynthis (L.) Schrad: Characterization and Biomedical Applications. Molecules 2017, 22, 301. [Google Scholar] [CrossRef]
- Aladpoosh, R.; Montazer, M. The Role of Cellulosic Chains of Cotton in Biosynthesis of ZnO Nanorods Producing Multifunctional Properties: Mechanism, Characterizations and Features. Carbohydr. Polym. 2015, 126, 122–129. [Google Scholar] [CrossRef]
- Chan, Y.Y.; Pang, Y.L.; Lim, S.; Chong, W.C. Facile Green Synthesis of ZnO Nanoparticles Using Natural-Based Materials: Properties, Mechanism, Surface Modification and Application. J. Environ. Chem. Eng. 2021, 9, 105417. [Google Scholar] [CrossRef]
- Sultana, F.; Barman, J.; Kalita, M. Biogenic Synthesis of ZnO Nanoparticles Using Polygonum Chinense Leaf Extract and Their Antibacterial Activity. Int. J. Nanotechnol. Appl. 2017, 11, 155–165. [Google Scholar]
- Kumar, P.; Mathpal, M.C.; Inwati, G.K.; Ghosh, S.; Kumar, V.; Roos, W.D.; Swart, H.C. Optical and Surface Properties of Zn Doped CdO Nanorods and Antimicrobial Applications. Colloids Surf. A Physicochem. Eng. Asp. 2020, 605, 125369. [Google Scholar] [CrossRef]
- Surendra, B.S.; Swamy, M.M.; Shamala, T.; Rao, S.; Sowmy shree, A.S.; Mallikarjuna swamy, C.; Pramila, S. Development of Enhanced Electrochemical Sensor and Antimicrobial Studies of ZnO NPs Synthesized Using Green Plant Extract. Sens. Int. 2022, 3, 100176. [Google Scholar] [CrossRef]
- Rueden, C.T.; Schindelin, J.; Hiner, M.C.; DeZonia, B.E.; Walter, A.E.; Arena, E.T.; Eliceiri, K.W. ImageJ2: ImageJ for the next Generation of Scientific Image Data. BMC Bioinform. 2017, 18, 529. [Google Scholar] [CrossRef]
- Ghadimi, A.; Saidur, R.; Metselaar, H.S.C. A Review of Nanofluid Stability Properties and Characterization in Stationary Conditions. Int. J. Heat Mass Transf. 2011, 54, 4051–4068. [Google Scholar] [CrossRef]
- Afzal, A.; Nawfal, I.; Mahbubul, I.M.; Kumbar, S.S. An Overview on the Effect of Ultrasonication Duration on Different Properties of Nanofluids. J. Therm. Anal. Calorim. 2019, 135, 393–418. [Google Scholar] [CrossRef]
- Suganthi, K.S.; Rajan, K.S. Temperature Induced Changes in ZnO-Water Nanofluid: Zeta Potential, Size Distribution and Viscosity Profiles. Int. J. Heat Mass Transf. 2012, 55, 7969–7980. [Google Scholar] [CrossRef]
- Inwati, G.K.; Rao, Y.; Singh, M. In Situ Free Radical Growth Mechanism of Platinum Nanoparticles by Microwave Irradiation and Electrocatalytic Properties. Nanoscale Res. Lett. 2016, 11, 458. [Google Scholar] [CrossRef]
- Bakthavatchalam, B.; Habib, K.; Saidur, R.; Baran, B.; Irshad, K. Comprehensive Study on Nano Fl Uid and Ionano Fl Uid for Heat Transfer Enhancement: A Review on Current and Future Perspective Distilled Water. J. Mol. Liq. 2020, 305, 112787. [Google Scholar] [CrossRef]
- Sajid, M.U.; Ali, H.M. Thermal Conductivity of Hybrid Nanofluids: A Critical Review. Int. J. Heat Mass Transf. 2018, 126, 211–234. [Google Scholar] [CrossRef]
- Timofeeva, E.V.; Routbort, J.L.; Singh, D.; Timofeeva, E.V.; Routbort, J.L.; Singh, D. Particle Shape Effects on Thermophysical Properties of Alumina Nanofluids Particle. J. Appl. Phys. 2013, 106, 014304. [Google Scholar] [CrossRef]
- Nandihalli, N.; Mori, T.; Kleinke, H. Effect of Addition of SiC and Al2O3 Refractories on Kapitza Resistance of Antimonide-Telluride. AIP Adv. 2018, 8, 095009. [Google Scholar] [CrossRef]
- Olorunyolemi, T.; Birnboim, A.; Carmel, Y.; Carl, O., Jr.; Lloyd, I.K.; Smith, S.; Campbell, R. Thermal Conductivity of Zinc Oxide: From Green to Sintered State. J. Am. Ceram. Soc. 2002, 85, 1249–1253. [Google Scholar] [CrossRef]
- Prasher, R.; Bhattacharya, P.; Phelan, P.E. Thermal Conductivity of Nanoscale Colloidal Solutions (Nanofluids). Phys. Rev. Lett. 2005, 94, 025901. [Google Scholar] [CrossRef]
- Milanese, M.; Iacobazzi, F.; Colangelo, G.; Risi, A. An Investigation of Layering Phenomenon at the Liquid—Solid Interface in Cu and CuO Based Nanofluids. Int. J. Heat Mass Transf. 2016, 103, 564–571. [Google Scholar] [CrossRef]


| Temperature (°C) | Ck | f (nm−1) | lk (nm) | Rk (m2 K/W) | Shape | ||
|---|---|---|---|---|---|---|---|
| 20 | 3.79 ± 0.09 | 5.68 | −1.89 | 0.475 | 3.97 | 4.727 × 10⁻⁹ | 0.73C + 0.27Br |
| 30 | 3.53 ± 0.13 | 4.71 | −1.18 | 0.295 | 4.01 | 4.773 × 10⁻⁹ | 0.27C + 0.73Br |
| 40 | 3.12 ± 0.14 | 7.35 | −4.23 | 1.089 | 3.89 | 4.626 × 10⁻⁹ | 0.71Br + 0.29Bl |
| 50 | 2.93 ± 0.13 | 8.67 | −5.47 | 1.43 | 3.83 | 4.56 × 10⁻⁹ | 0.6Br + 0.4Bl |
| 60 | 2.79 ± 0.08 | 13.65 | −10.86 | 3.042 | 3.57 | 4.248 × 10⁻⁹ | 0.08Br + 0.92Bl |
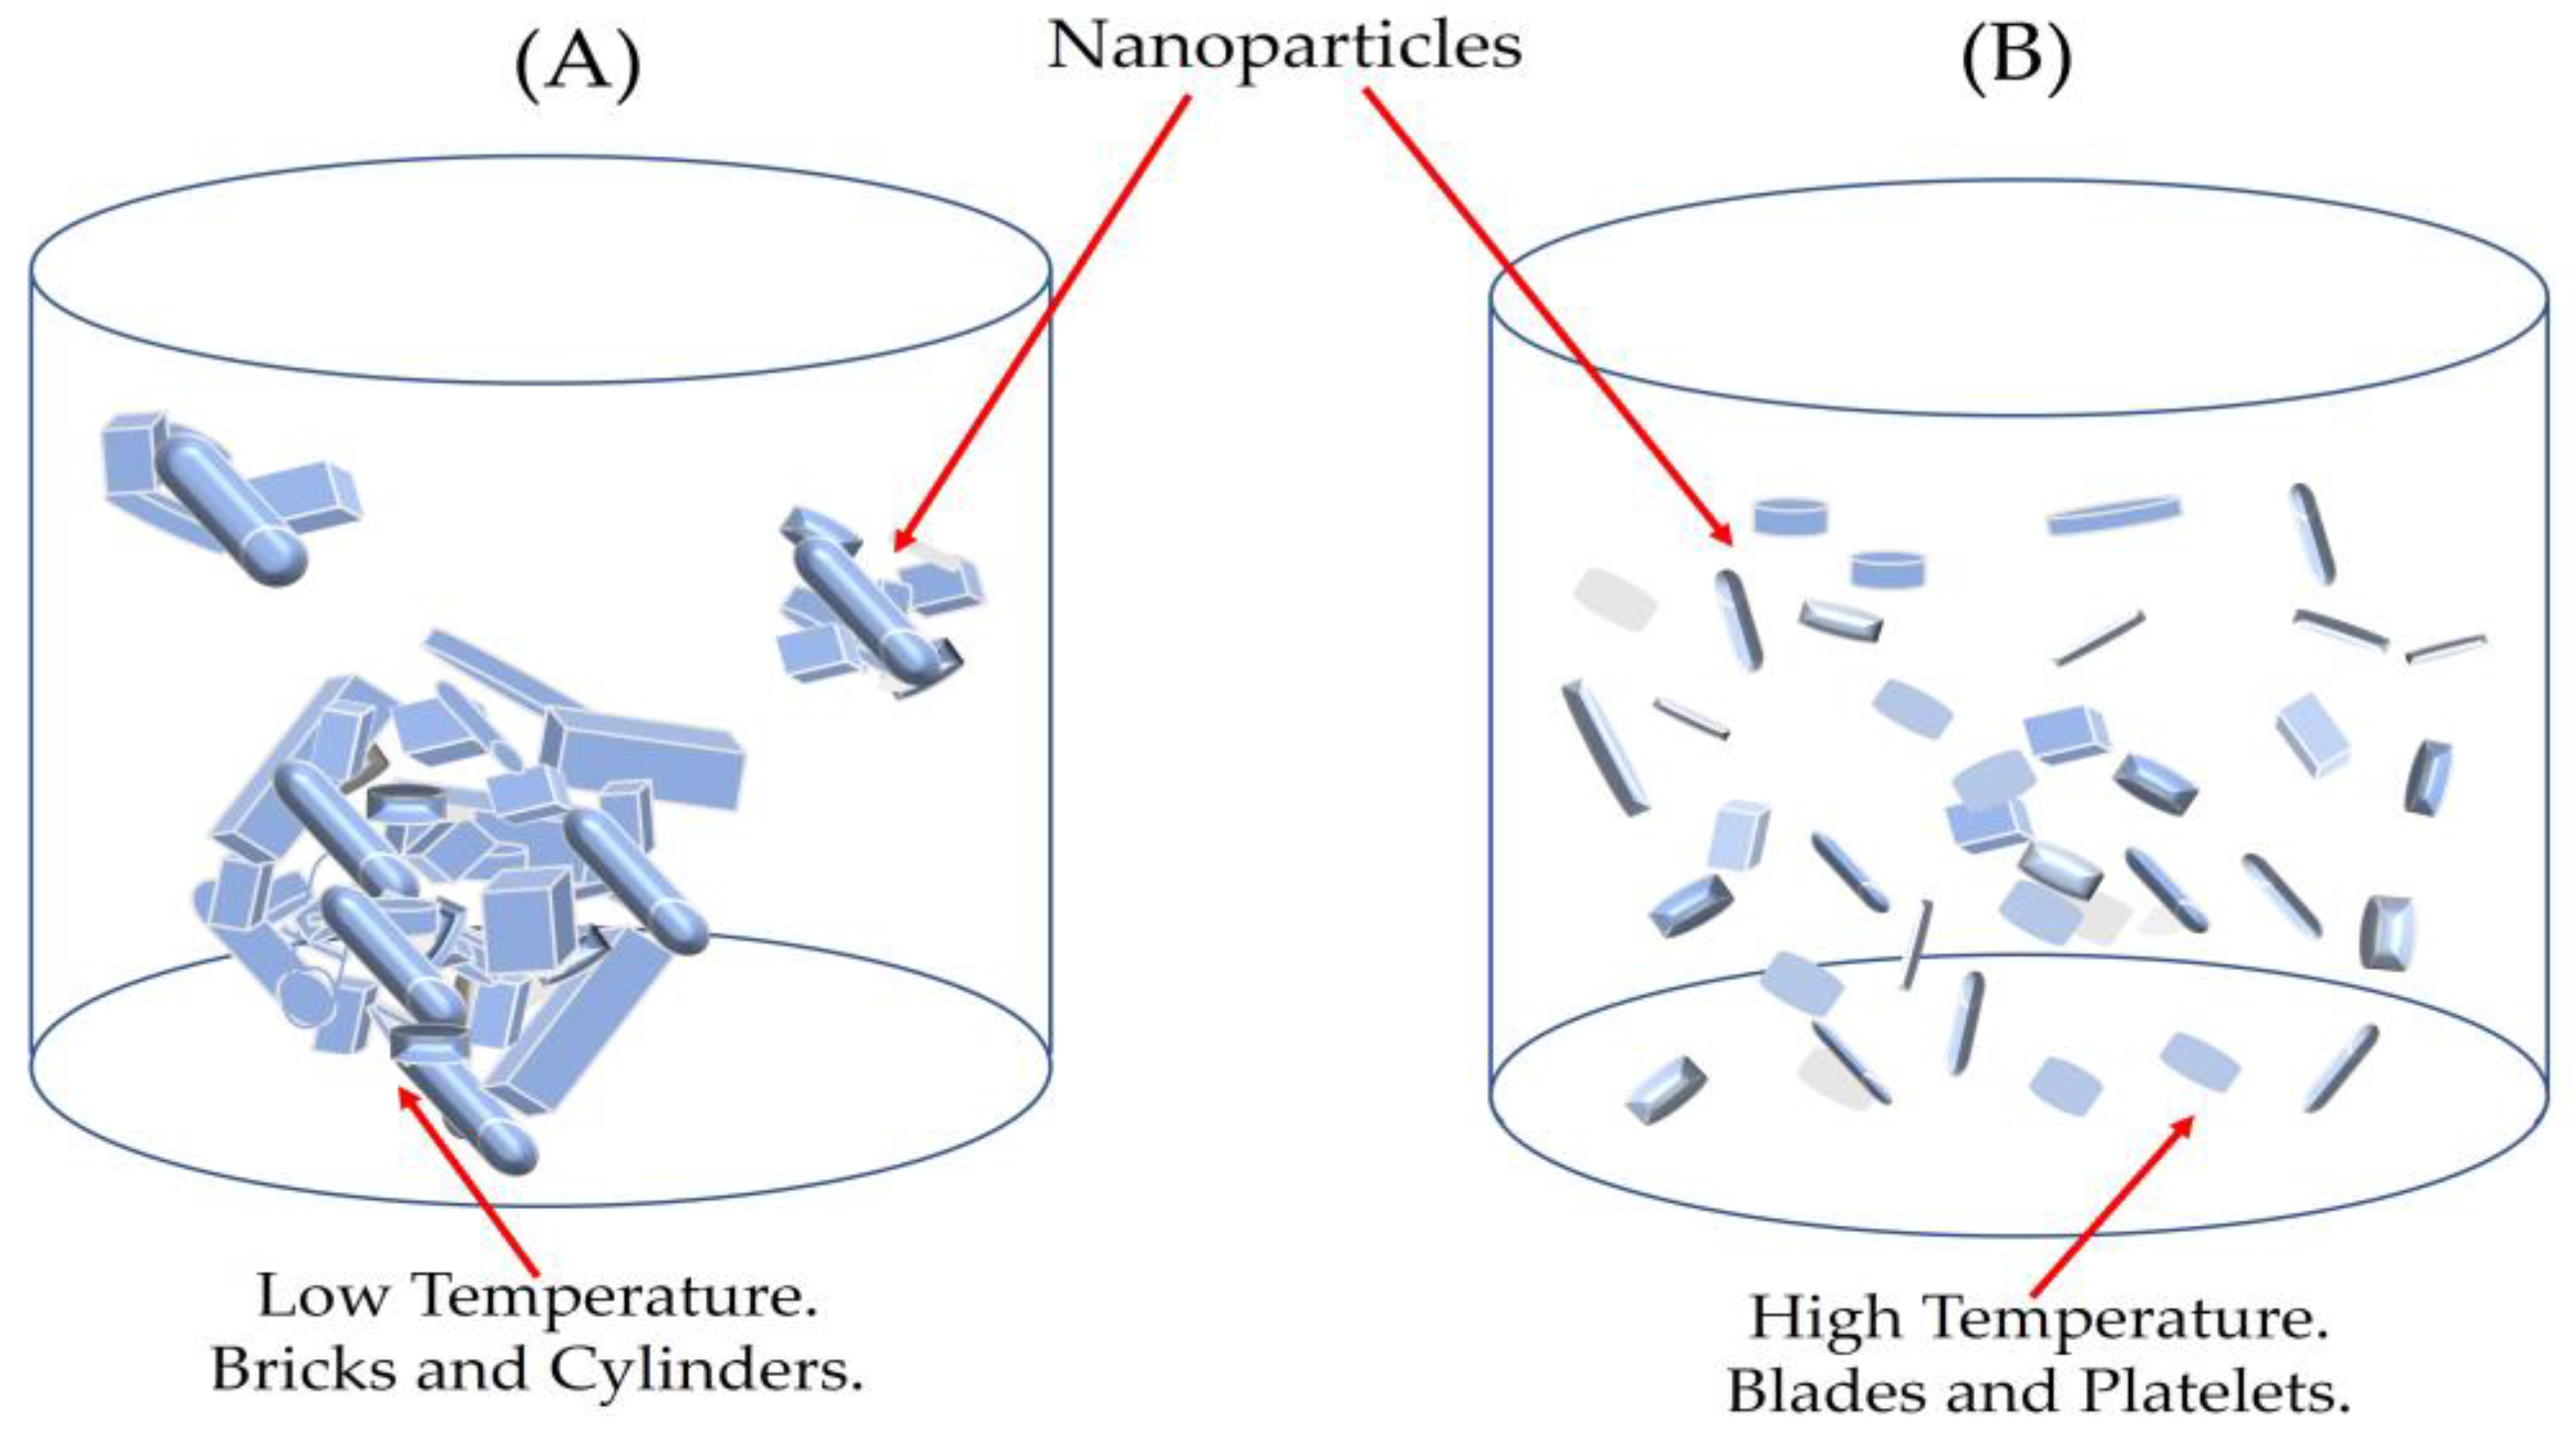
| 70 | 2.69 ± 0.14 | 12.39 | −9.70 | 2.862 | 3.39 | 4.04 × 10⁻⁹ | 0.6Bl + 0.4P |
Disclaimer/Publisher’s Note: The statements, opinions and data contained in all publications are solely those of the individual author(s) and contributor(s) and not of MDPI and/or the editor(s). MDPI and/or the editor(s) disclaim responsibility for any injury to people or property resulting from any ideas, methods, instructions or products referred to in the content. |
© 2023 by the authors. Licensee MDPI, Basel, Switzerland. This article is an open access article distributed under the terms and conditions of the Creative Commons Attribution (CC BY) license (https://creativecommons.org/licenses/by/4.0/).
Share and Cite
Jebali, M.; Colangelo, G.; Gómez-Merino, A.I. Green Synthesis, Characterization, and Empirical Thermal Conductivity Assessment of ZnO Nanofluids for High-Efficiency Heat-Transfer Applications. Materials 2023, 16, 1542. https://doi.org/10.3390/ma16041542
Jebali M, Colangelo G, Gómez-Merino AI. Green Synthesis, Characterization, and Empirical Thermal Conductivity Assessment of ZnO Nanofluids for High-Efficiency Heat-Transfer Applications. Materials. 2023; 16(4):1542. https://doi.org/10.3390/ma16041542
Chicago/Turabian StyleJebali, Meriem, Gianpiero Colangelo, and Ana Isabel Gómez-Merino. 2023. "Green Synthesis, Characterization, and Empirical Thermal Conductivity Assessment of ZnO Nanofluids for High-Efficiency Heat-Transfer Applications" Materials 16, no. 4: 1542. https://doi.org/10.3390/ma16041542