


New Butyroside D from Argan Press Cake Possess Anti-Melanogenesis Effect via MITF Downregulation in B16F10 and HEM Cells
 ,
,  , , and
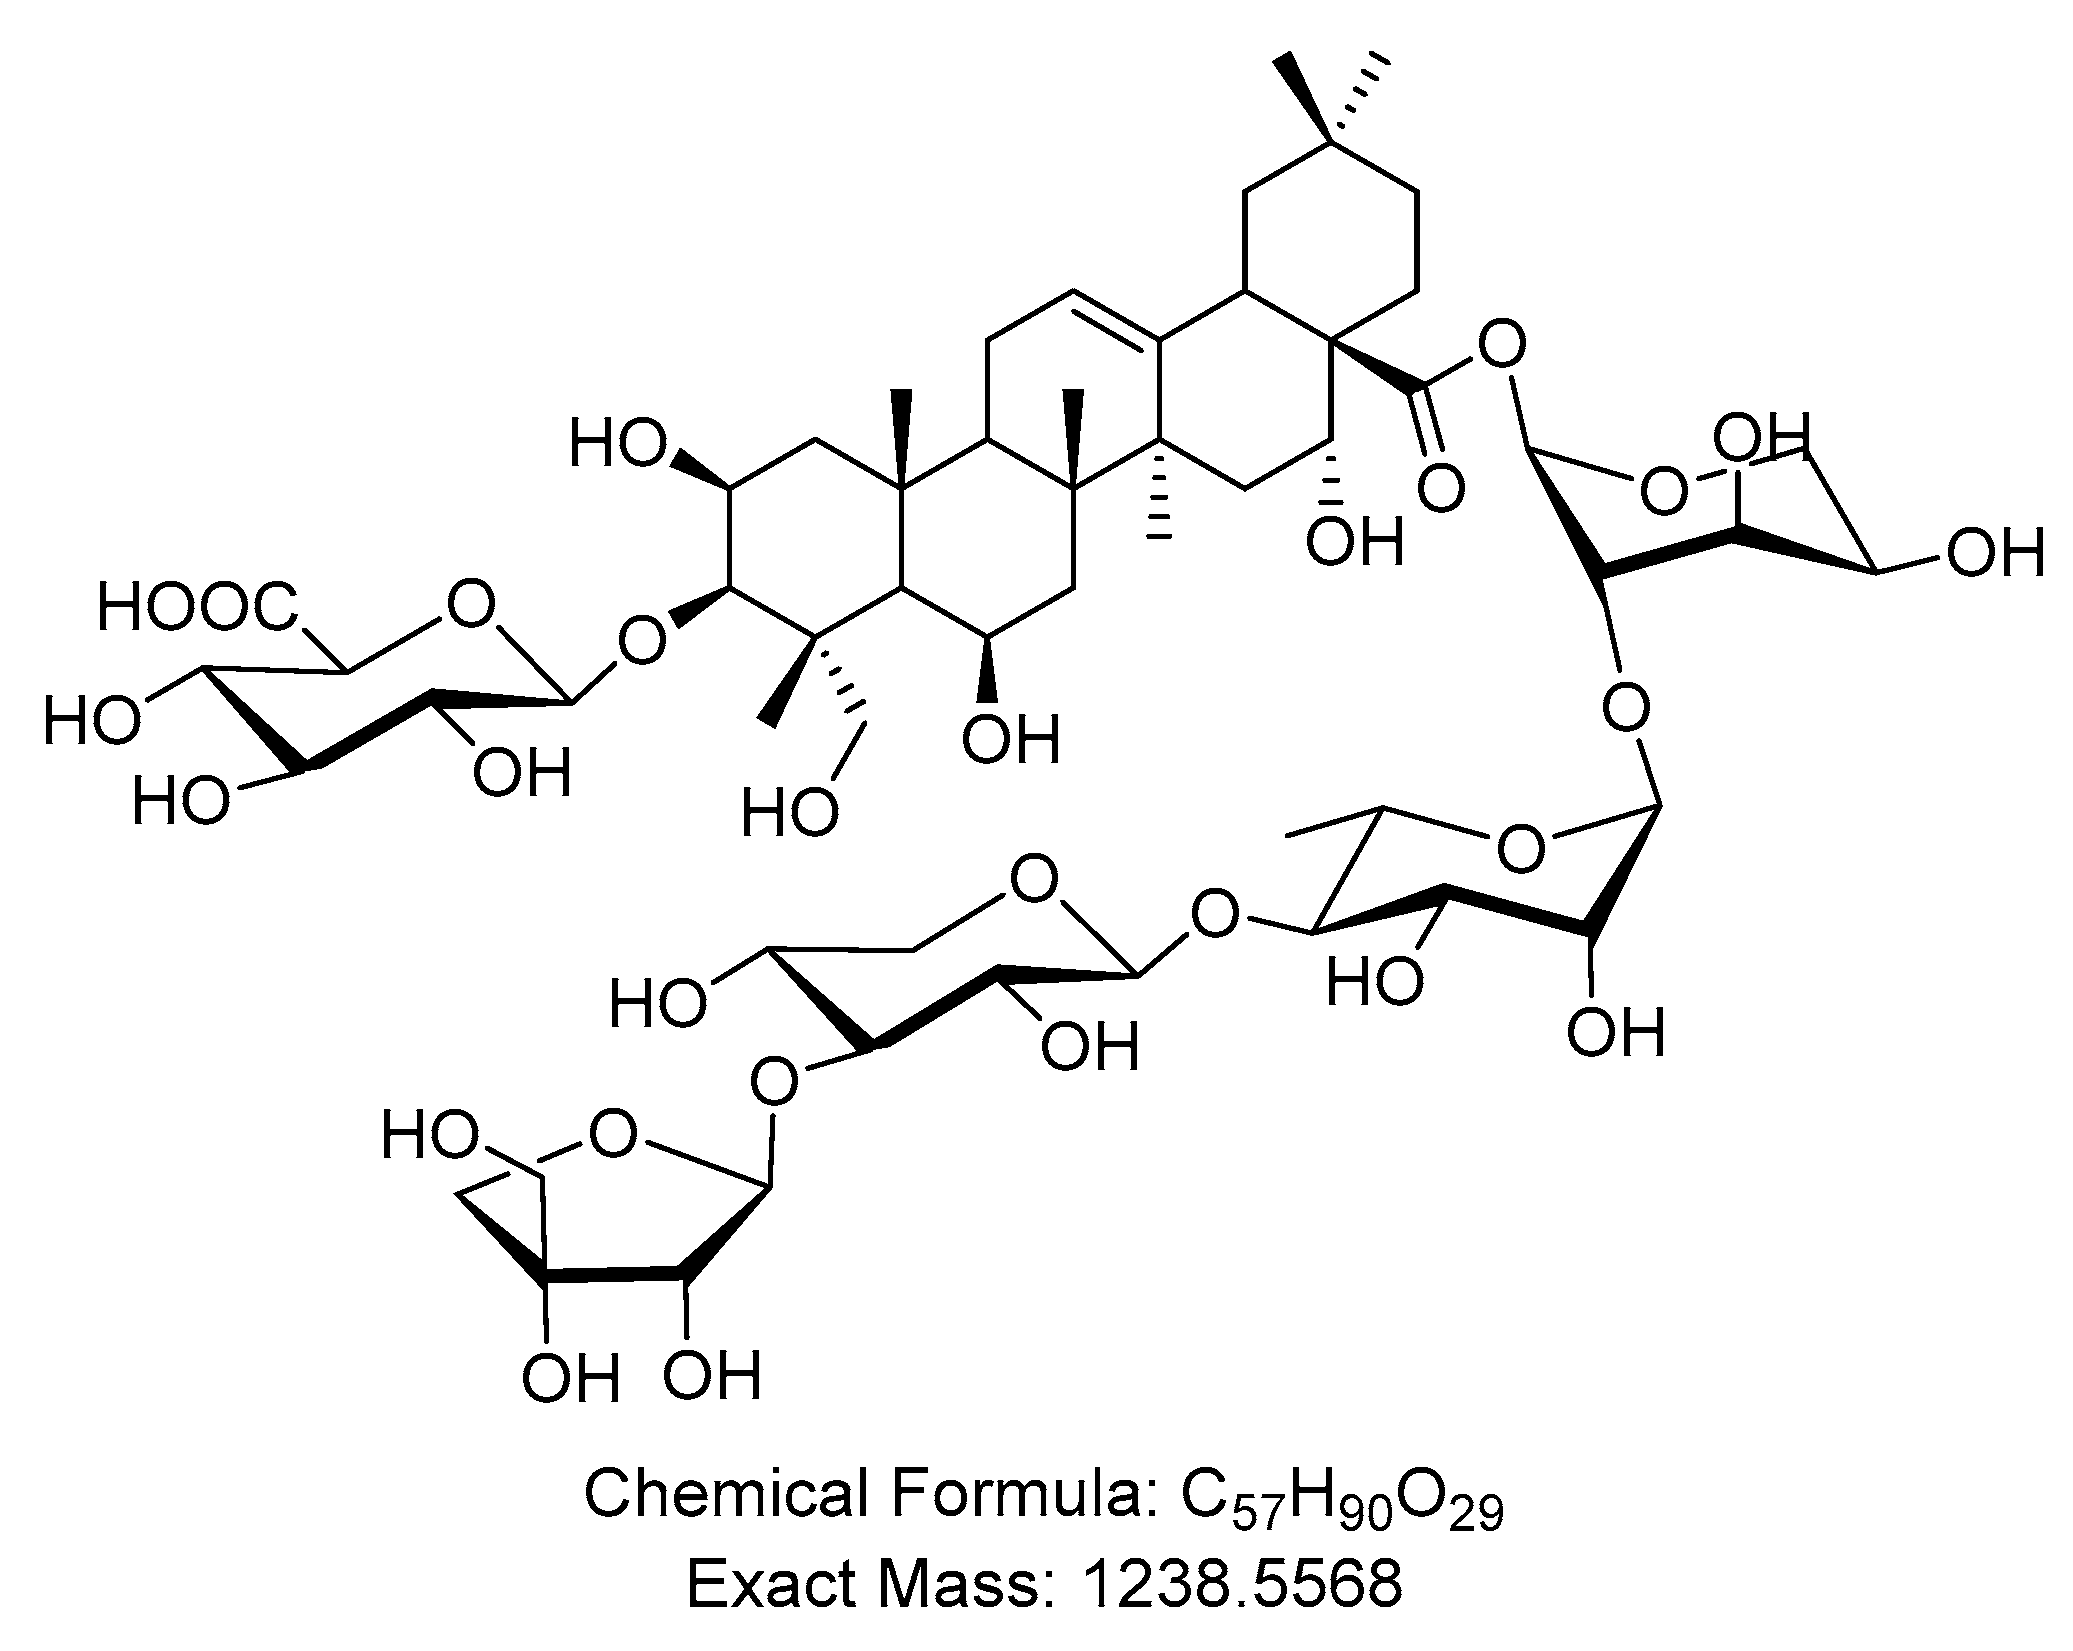
Abstract
:1. Introduction
2. Results
2.1. Butyroside D Structure Identification
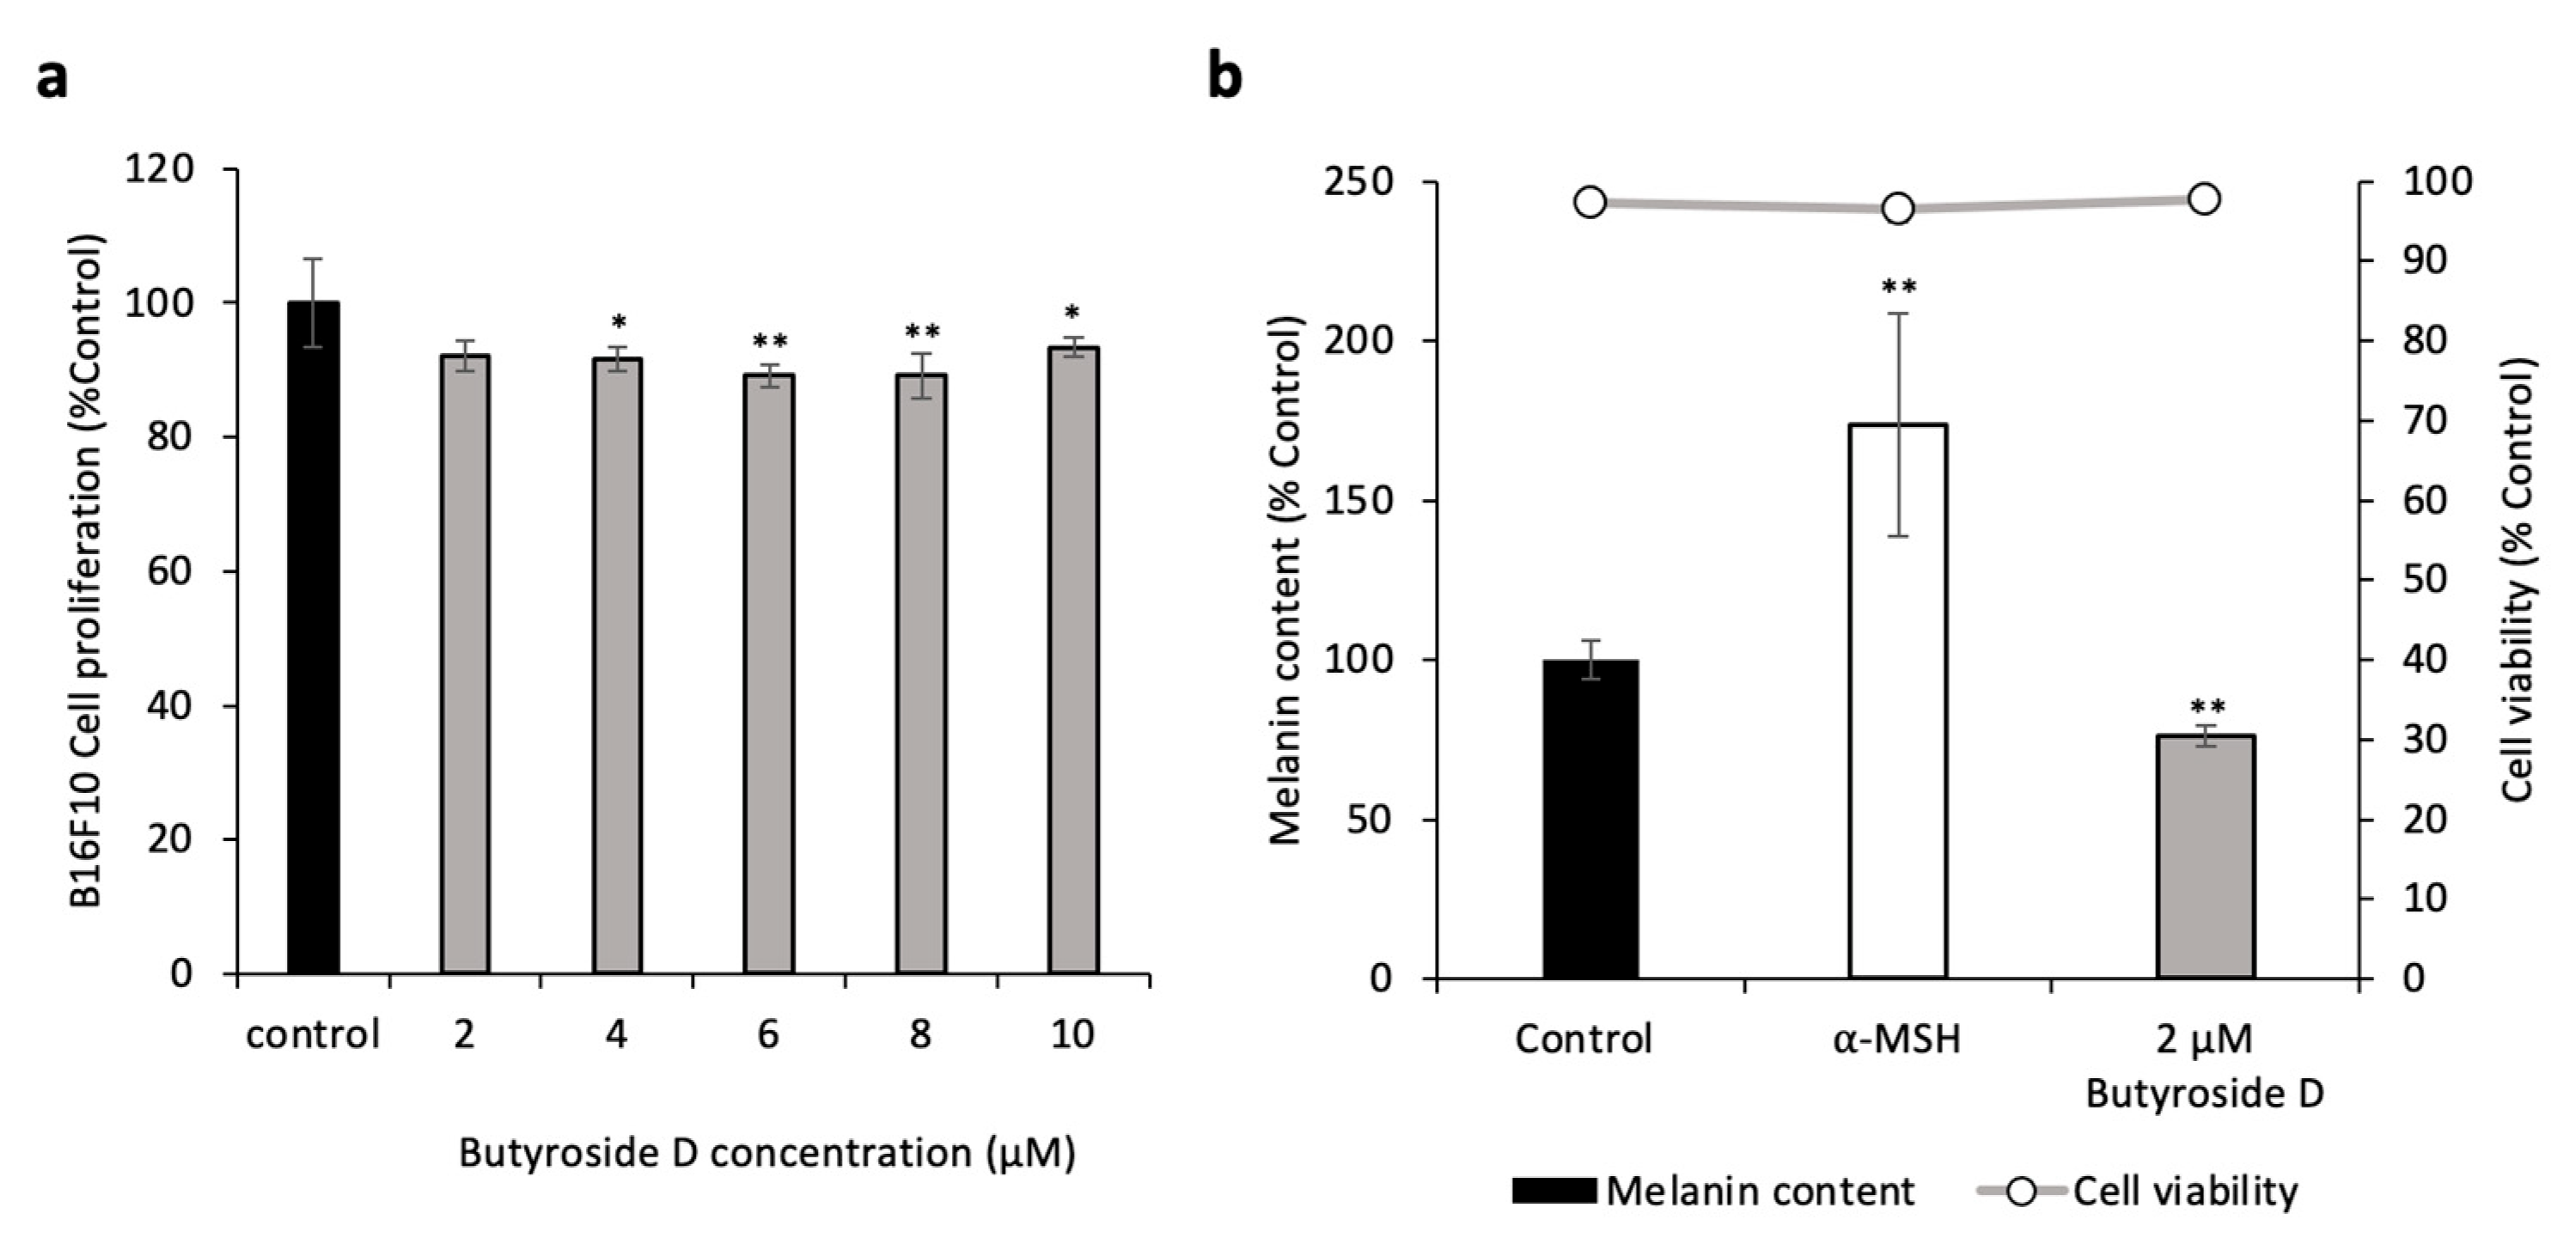
2.2. Butyroside D Did Not Show a Cytotoxic Effect in B16F10
2.3. Butyroside D Reduced the Melanin Content in B16F10
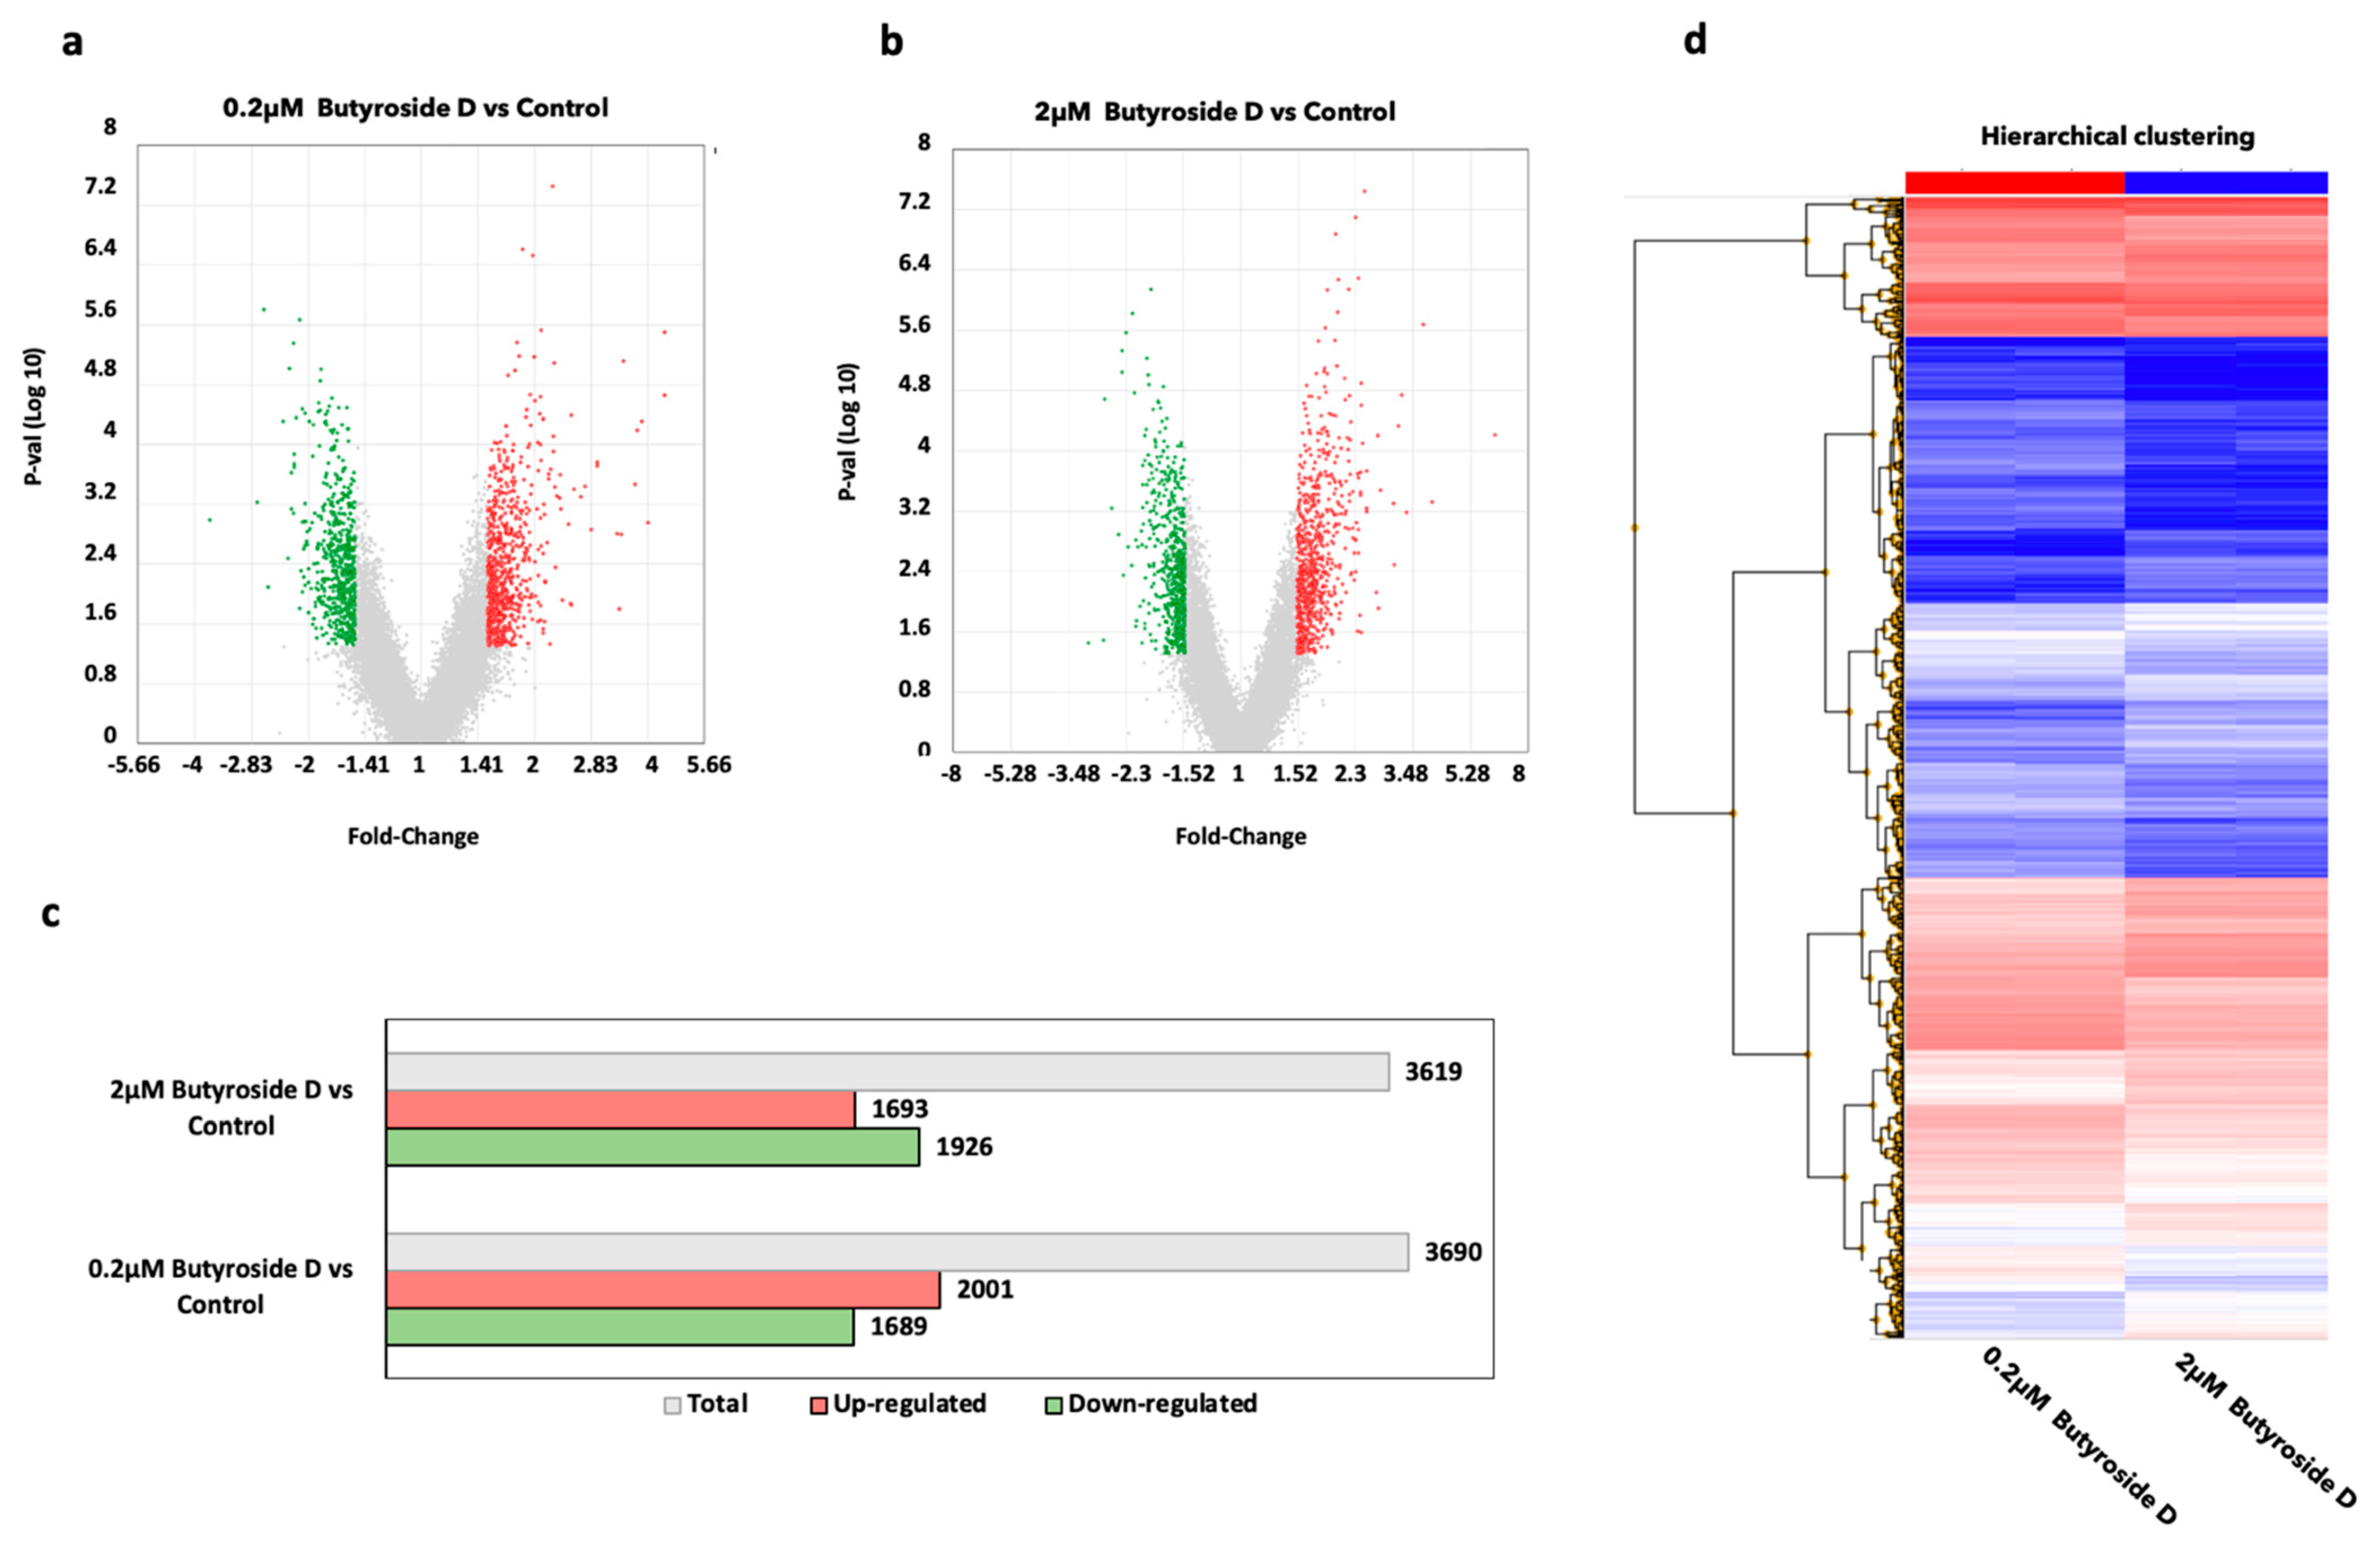
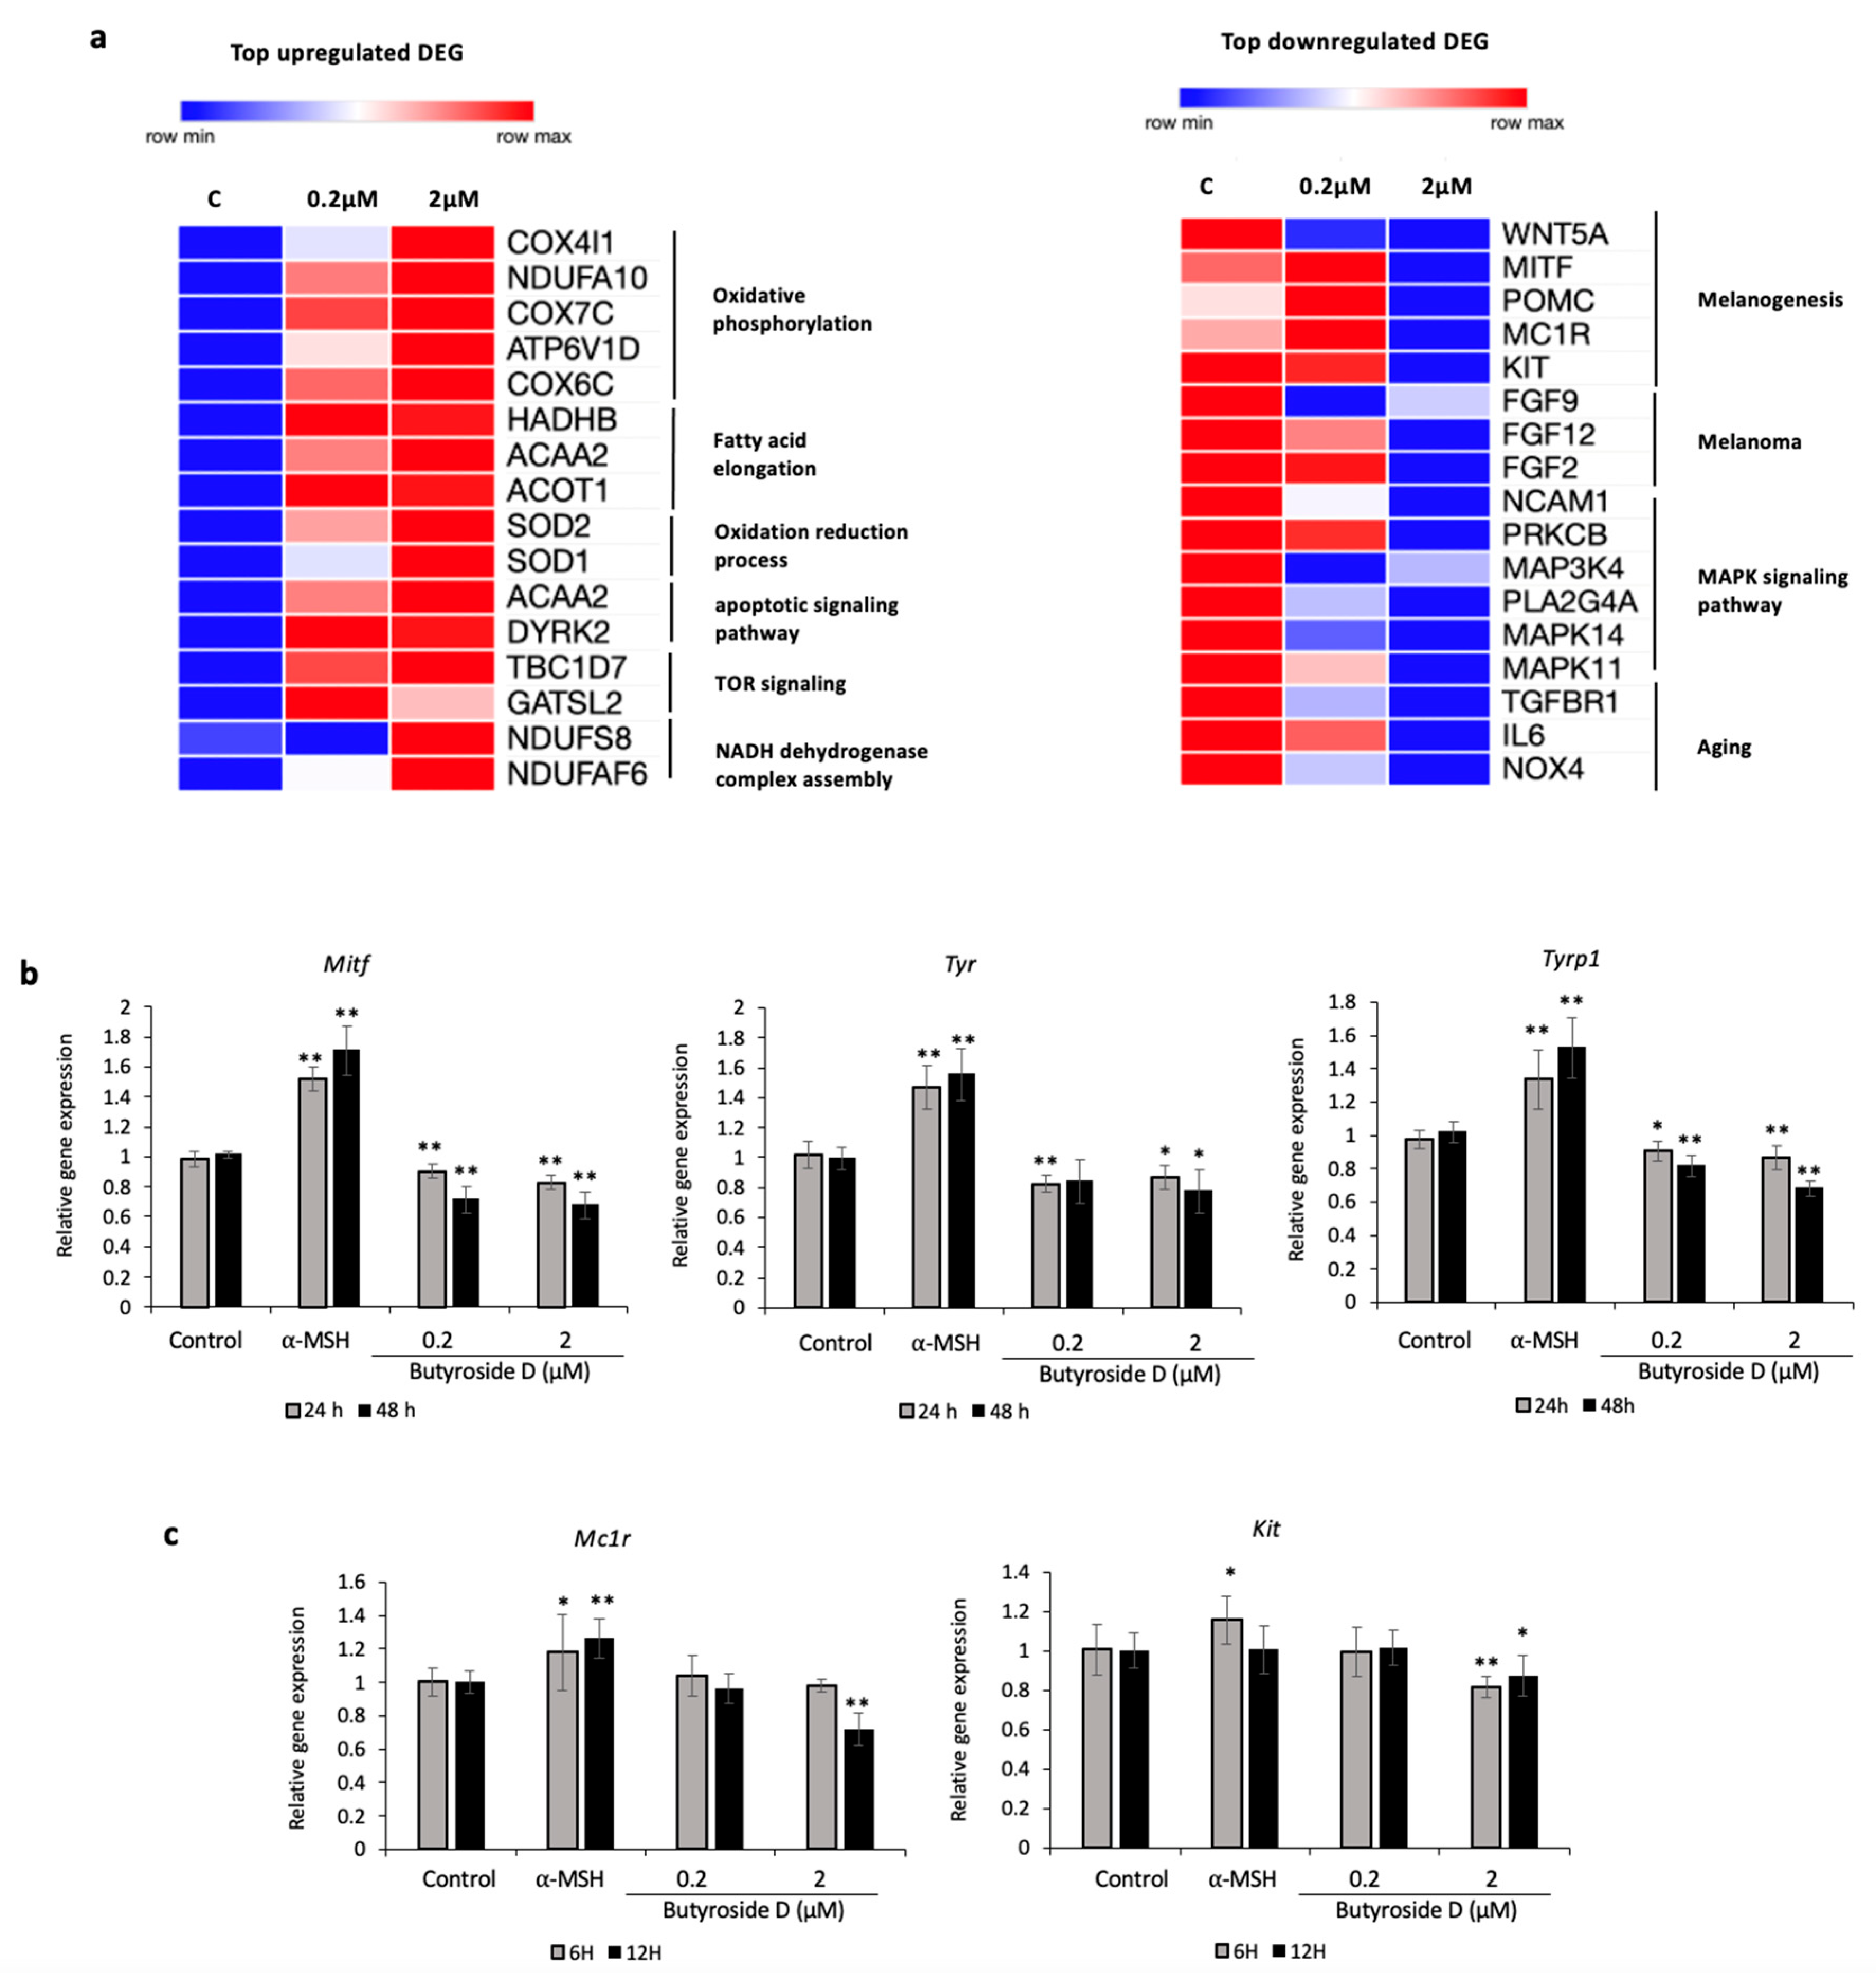
2.4. Global Gene Profiling Analysis of Butyroside D in B16F10 Cells
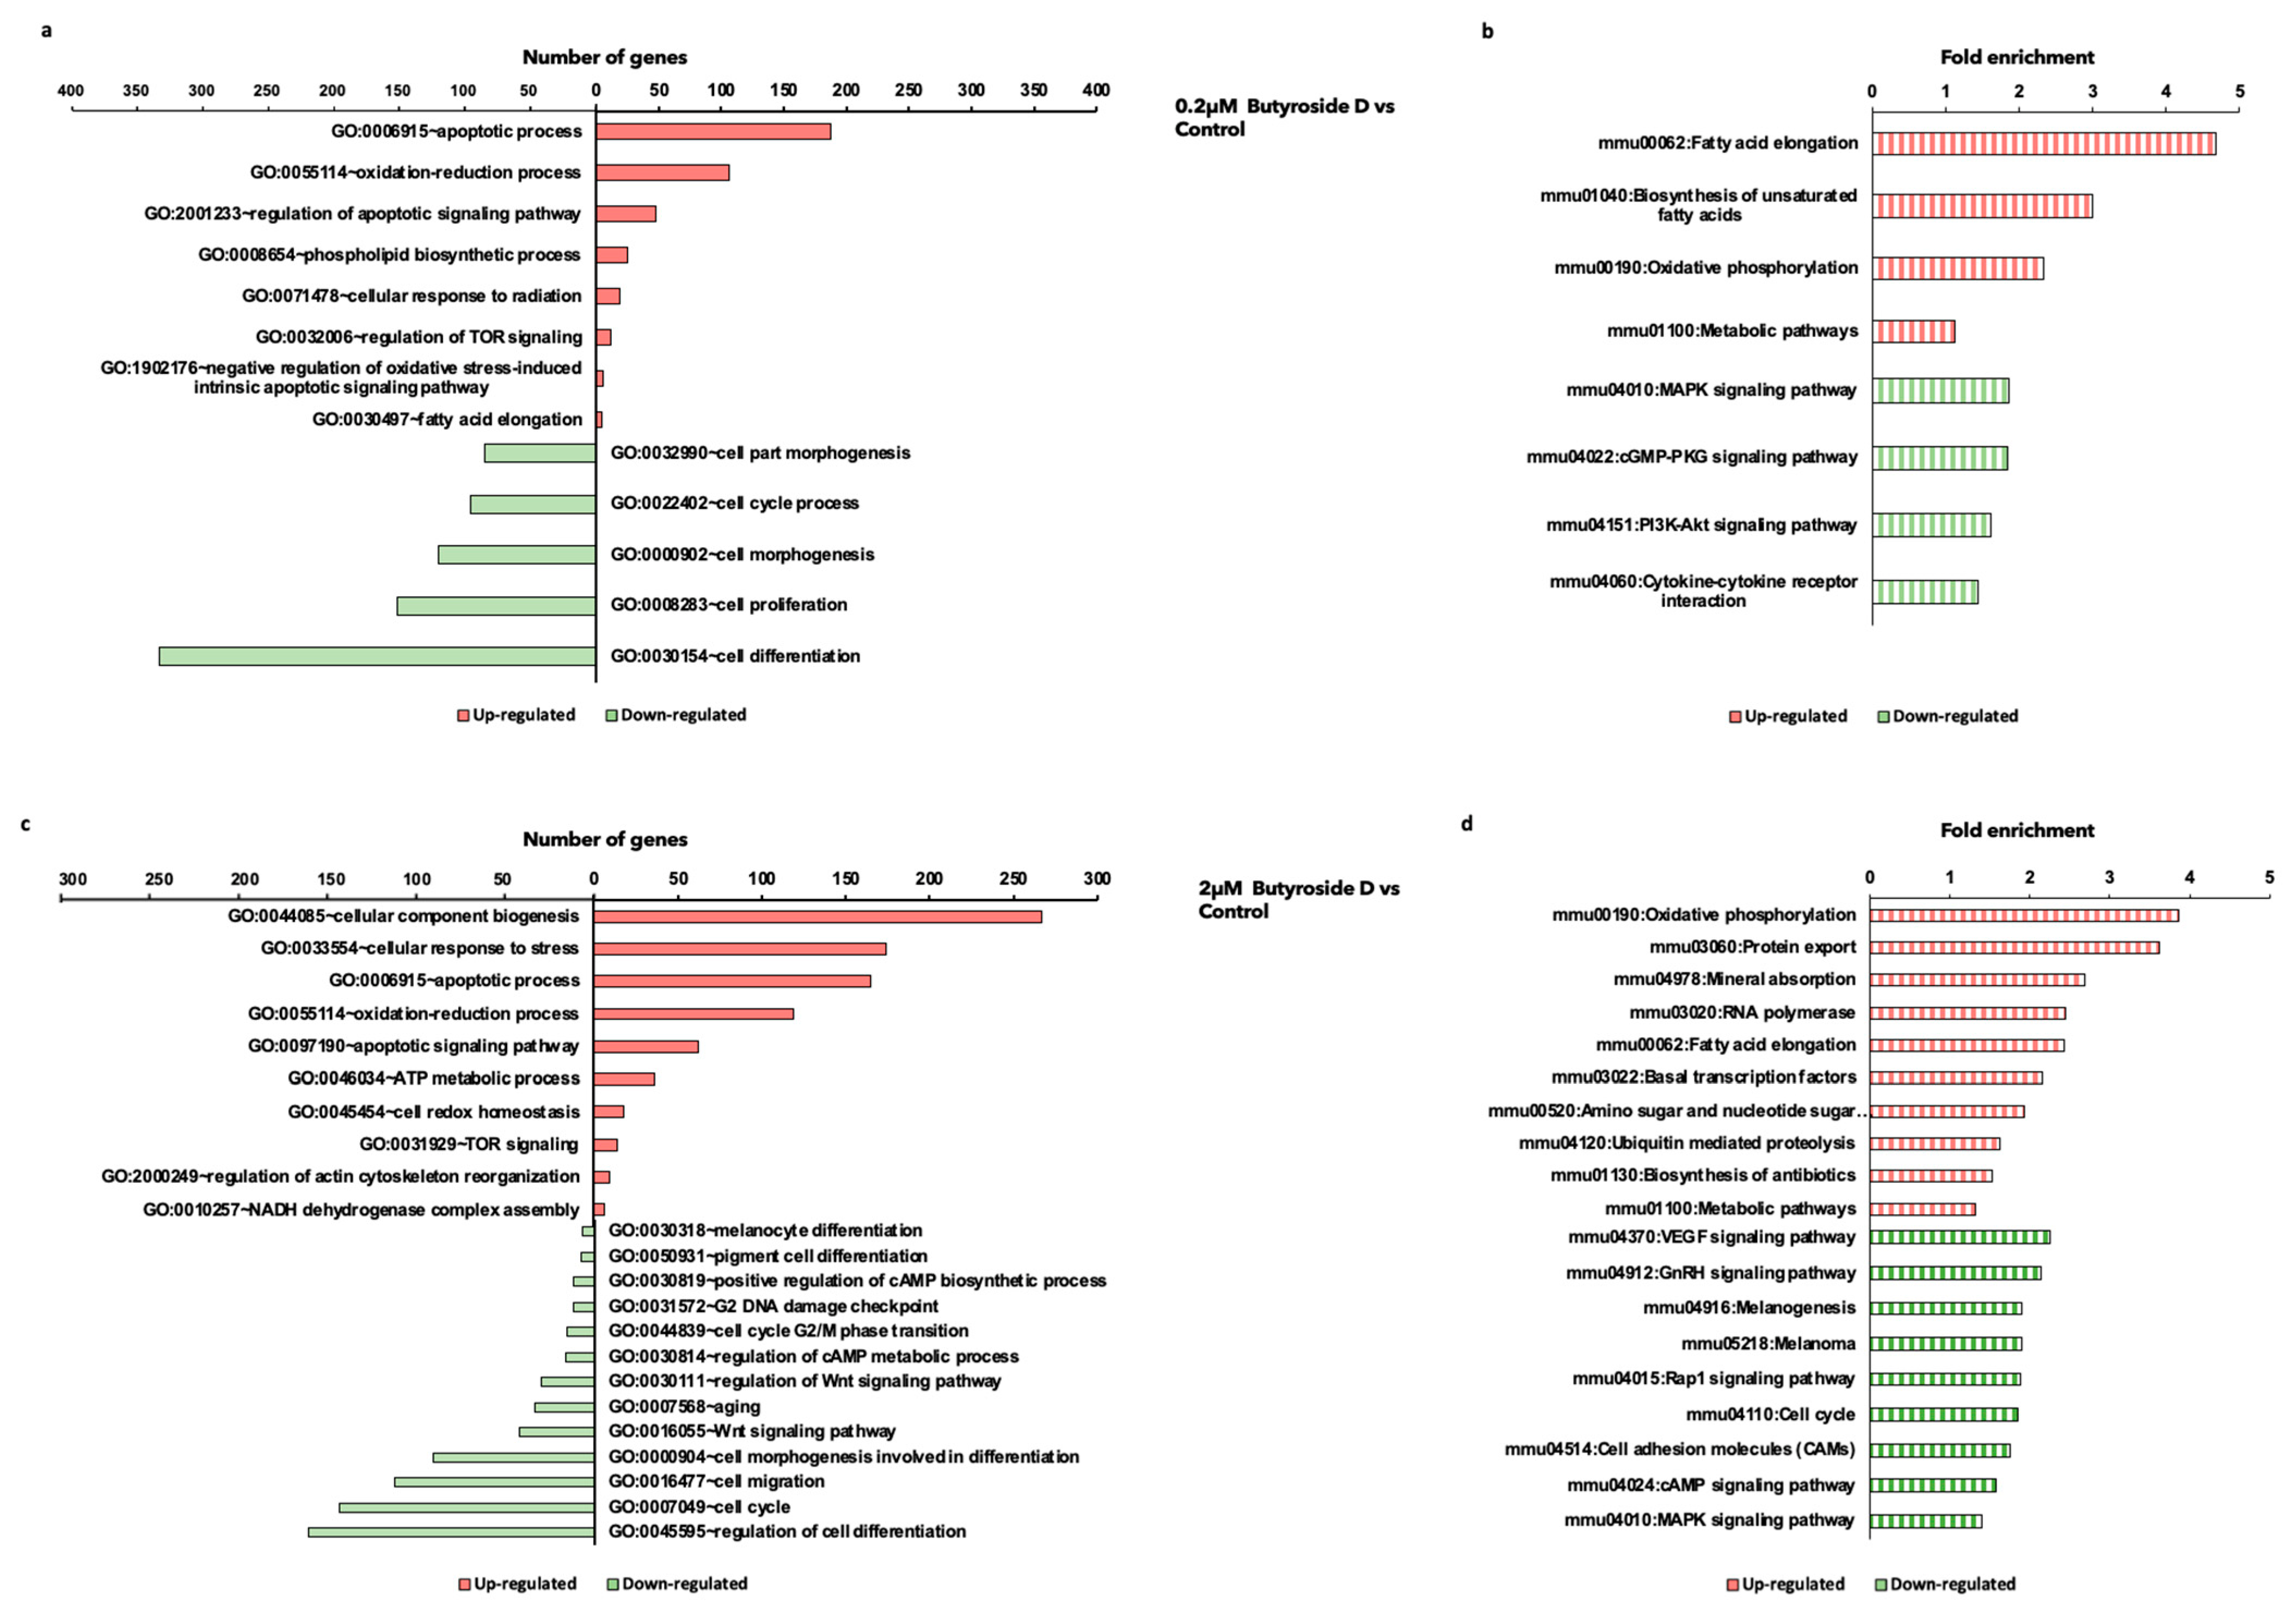
2.5. Butyroside D Downregulated Melanogenesis-Associated Genes in B16F10 Cells
2.6. Butyroside D Upregulated Oxidative Phosphorylation and Fatty Acid Elongation Associated GO and KEGG Pathways
2.7. Classification of DEGs Regulated by Butyroside D
2.8. Validation Assay of the Effect of Butyroside D on Melanogenesis Downregulation in B16F10 Cells
2.9. Effect of Butyroside D on Melanogenesis Downregulation in α-MSH Induced HEM Cells
3. Discussion
4. Materials and Methods
4.1. Plant Material
4.2. General Experimental Procedures
4.3. Butyroside D Extraction and Isolation Procedures
4.4. Cell Culture
4.5. Cell Proliferation Assay
4.6. Melanin Quantification
4.7. RNA Extraction
4.8. DNA Microarray
4.9. Real-Time Reverse Transcription Polymerase Chain Reaction (RT-PCR) Analysis
4.10. Statistical Analysis
Supplementary Materials
Author Contributions
Funding
Institutional Review Board Statement
Informed Consent Statement
Data Availability Statement
Conflicts of Interest
References
- Bonaventure, J.; Domingues, M.J.; Larue, L. Cellular and molecular mechanisms controlling the migration of melanocytes and melanoma cells. Pigment. Cell Melanoma Res. 2013, 26, 316–325. [Google Scholar] [CrossRef] [PubMed]
- Sviderskaya, E.V.; Hill, S.P.; Balachandar, D.; Barsh, G.S.; Bennett, D.C. Agouti signaling protein and other factors modulating differentiation and proliferation of immortal melanoblasts. Dev. Dyn. 2001, 221, 373–379. [Google Scholar] [CrossRef] [PubMed]
- Videira, I.F.D.S.; Moura, D.F.L.; Magina, S. Mechanisms Regulating Melanogenesis. An. Bras. Dermatol. 2013, 88, 76–83. [Google Scholar] [CrossRef] [PubMed]
- Maranduca, M.A.; Branisteanu, D.; Serban, D.N.; Branisteanu, D.C.; Stoleriu, G.; Manolache, N.; Serban, I.L. Synthesis and physiological implications of melanic pigments (Review). Oncol. Lett. 2019, 17, 4183–4187. [Google Scholar] [CrossRef] [Green Version]
- Marks, M.S.; Seabra, M. The melanosome: Membrane dynamics in black and white. Nat. Rev. Mol. Cell Biol. 2001, 2, 738–748. [Google Scholar] [CrossRef]
- Yamaguchi, Y.; Brenner, M.; Hearing, V.J. The Regulation of Skin Pigmentation. J. Biol. Chem. 2007, 282, 27557–27561. [Google Scholar] [CrossRef] [Green Version]
- Lv, J.; Yang, Y.; Jia, B.; Li, S.; Zhang, X.; Gao, R. The Inhibitory Effect of Curcumin Derivative J147 on Melanogenesis and Melanosome Transport by Facilitating ERK-Mediated MITF Degradation. Front. Pharmacol. 2021, 12, 783730. [Google Scholar] [CrossRef]
- Pillaiyar, T.; Namasivayam, V.; Manickam, M.; Jung, S.-H. Inhibitors of Melanogenesis: An Updated Review. J. Med. Chem. 2018, 61, 7395–7418. [Google Scholar] [CrossRef]
- Halaban, R.; Patton, R.S.; Cheng, E.; Svedine, S.; Trombetta, E.S.; Wahl, M.L.; Ariyan, S.; Hebert, D.N. Abnormal Acidification of Melanoma Cells Induces Tyrosinase Retention in the Early Secretory Pathway. J. Biol. Chem. 2002, 277, 14821–14828. [Google Scholar] [CrossRef] [Green Version]
- Yoo, J. Differential diagnosis and management of hyperpigmentation. Clin. Exp. Dermatol. 2022, 47, 251–258. [Google Scholar] [CrossRef]
- Kobayashi, T.; Urabe, K.; Winder, A.; Jiménez-Cervantes, C.; Imokawa, G.; Brewington, T.; Solano, F.; Garcia-Borron, J.C.; Hearing, V. Tyrosinase related protein 1 (TRP1) functions as a DHICA oxidase in melanin biosynthesis. EMBO J. 1994, 13, 5818–5825. [Google Scholar] [CrossRef]
- Pillaiyar, T.; Manickam, M.; Jung, S.-H. Recent development of signaling pathways inhibitors of melanogenesis. Cell Signal. 2017, 40, 99–115. [Google Scholar] [CrossRef]
- Natarajan, V.T.; Ganju, P.; Ramkumar, A.; Grover, R.; Gokhale, R.S. Multifaceted pathways protect human skin from UV radiation. Nat. Chem. Biol. 2014, 10, 542–551. [Google Scholar] [CrossRef]
- D’Mello, S.A.N.; Finlay, G.J.; Baguley, B.C.; Askarian-Amiri, M.E. Signaling Pathways in Melanogenesis. Int. J. Mol. Sci. 2016, 17, 1144. [Google Scholar] [CrossRef] [Green Version]
- Brenner, M.; Hearing, V.J. The Protective Role of Melanin Against UV Damage in Human Skin. Photochem. Photobiol. 2008, 84, 539–549. [Google Scholar] [CrossRef] [Green Version]
- Jang, J.Y.; Kim, H.N.; Kim, Y.R.; Choi, W.Y.; Choi, Y.H.; Shin, H.K.; Choi, B.T. Partially purified components of Nardostachys chinensis suppress melanin synthesis through ERK and Akt signaling pathway with cAMP down-regulation in B16F10 cells. J. Ethnopharmacol. 2011, 137, 1207–1214. [Google Scholar] [CrossRef]
- Kwon, T.-R.; Oh, C.T.; Bak, D.-H.; Kim, J.H.; Seok, J.; Lee, J.H.; Lim, S.H.; Yoo, K.H.; Kim, B.J.; Kim, H. Effects on skin of Stichopus japonicus viscera extracts detected with saponin including Holothurin A: Down-regulation of melanin synthesis and up-regulation of neocollagenesis mediated by ERK signaling pathway. J. Ethnopharmacol. 2018, 226, 73–81. [Google Scholar] [CrossRef]
- Lee, J.Y.; Cho, Y.-R.; Park, J.H.; Ahn, E.-K.; Jeong, W.; Shin, H.S.; Kim, M.-S.; Yang, S.H.; Oh, J.S. Anti-melanogenic and anti-oxidant activities of ethanol extract of Kummerowia striata: Kummerowia striata regulate anti-melanogenic activity through down-regulation of TRP-1, TRP-2 and MITF expression. Toxicol. Rep. 2018, 6, 10–17. [Google Scholar] [CrossRef]
- Taarji, N.; Bouhoute, M.; Melanie, H.; Hafidi, A.; Kobayashi, I.; Neves, M.; Tominaga, K.; Isoda, H.; Nakajima, M. Stability characteristics of O/W emulsions prepared using purified glycyrrhizin or a non-purified glycyrrhizin-rich extract from liquorice root (Glycyrrhiza glabra). Coll. Surf. A Physicochem. Eng. Asp. 2020, 614, 126006. [Google Scholar] [CrossRef]
- Lee, K.W.; Kim, M.; Lee, S.H.; Kim, K.D. The Function of Autophagy as a Regulator of Melanin Homeostasis. Cells 2022, 11, 2085. [Google Scholar] [CrossRef]
- Taarji, N.; Bouhoute, M.; Fainassi, F.; Hafidi, A.; Kobayashi, I.; Neves, M.A.; Tominaga, K.; Isoda, H.; Nakajima, M. Interfacial and emulsifying properties of purified glycyrrhizin and non-purified glycyrrhizin-rich extracts from liquorice root (Glycyrrhiza glabra). Food Chem. 2021, 337, 127949. [Google Scholar] [CrossRef] [PubMed]
- Taarji, N.; Bouhoute, M.; Chafai, Y.; Hafidi, A.; Kobayashi, I.; Neves, M.A.; Tominaga, K.; Isoda, H.; Nakajima, M. Emulsifying Performance of Crude Surface-Active Extracts from Liquorice Root (Glycyrrhiza Glabra). ACS Food Sci. Technol. 2021, 1, 1472–1480. [Google Scholar] [CrossRef]
- Mechqoq, H.; El Yaagoubi, M.; El Hamdaoui, A.; Momchilova, S.; Almeida, J.R.G.D.S.; Msanda, F.; El Aouad, N. Ethnobotany, phytochemistry and biological properties of Argan tree (Argania spinosa (L.) Skeels) (Sapotaceae)—A review. J. Ethnopharmacol. 2021, 281, 114528. [Google Scholar] [CrossRef] [PubMed]
- Bonvicini, F.; Antognoni, F.; Mandrone, M.; Protti, M.; Mercolini, L.; Lianza, M.; Gentilomi, G.A.; Poli, F. Phytochemical analysis and antibacterial activity towards methicillin-resistant Staphylococcus aureus of leaf extracts from Argania spinosa (L.) Skeels. Plant Biosyst. Int. J. Deal. All Asp. Plant Biol. 2017, 151, 649–656. [Google Scholar] [CrossRef]
- Bouhoute, M.; Nakajima, M.; Isoda, H. Design of nanoemulgel using Argania spinosa microfibrillated cellulose and natural emulsifiers foreseeing melanogenesis enhancement. Carbohydr. Polym. 2021, 274, 118632. [Google Scholar] [CrossRef] [PubMed]
- Bouhoute, M.; Taarji, N.; Vodo, S.; Kobayashi, I.; Zahar, M.; Isoda, H.; Nakajima, M.; Neves, M.A. Formation and stability of emulsions using crude extracts as natural emulsifiers from Argan shells. Colloids Surfaces A Physicochem. Eng. Asp. 2020, 591, 124536. [Google Scholar] [CrossRef]
- Makbal, R.; Villareal, M.O.; Gadhi, C.; Hafidi, A.; Isoda, H. Argania Spinosa Fruit Shell Extract-Induced Melanogenesis via cAMP Signaling Pathway Activation. Int. J. Mol. Sci. 2020, 21, 2539. [Google Scholar] [CrossRef] [Green Version]
- Villareal, M.O.; Kume, S.; Bourhim, T.; Bakhtaoui, F.Z.; Kashiwagi, K.; Han, J.; Gadhi, C.; Isoda, H. Activation of MITF by Argan Oil Leads to the Inhibition of the Tyrosinase and Dopachrome Tautomerase Expressions in B16 Murine Melanoma Cells. Evidence-Based Complement. Altern. Med. 2013, 2013, 340107. [Google Scholar] [CrossRef] [Green Version]
- Bourhim, T.; Villareal, M.O.; Gadhi, C.; Hafidi, A.; Isoda, H. Depigmenting effect of argan press-cake extract through the down-regulation of Mitf and melanogenic enzymes expression in B16 murine melanoma cells. Cytotechnology 2018, 70, 1389–1397. [Google Scholar] [CrossRef]
- Bouhoute, M.; Taarji, N.; De Oliveira Felipe, L.; Habibi, Y.; Kobayashi, I.; Zahar, M.; Isoda, H.; Nakajima, M.; Neves, M.A. Microfibrillated cellulose from Argania spinosa shells as sustainable solid particles for O/W Pickering emulsions. Carbohydr. Polym. 2021, 251, 116990. [Google Scholar] [CrossRef]
- Taarji, N.; Vodo, S.; Bouhoute, M.; Khalid, N.; Hafidi, A.; Kobayashi, I.; Neves, M.A.; Isoda, H.; Nakajima, M. Preparation of monodisperse O/W emulsions using a crude surface-active extract from argan by-products in microchannel emulsification. Coll. Surf. A Physicochem. Eng. Asp. 2020, 585, 124050. [Google Scholar] [CrossRef]
- Chafchaouni-Moussaoui, I.; Charrouf, Z.; Guillaume, D. Triterpenoids from Argania spinosa: 20 Years of Research. Nat. Prod. Commun. 2013, 8, 43–46. [Google Scholar] [CrossRef] [Green Version]
- El Adib, S.; Aissi, O.; Charrouf, Z.; Ben Jeddi, F.; Messaoud, C. Argania spinosavar.muticaand var.apiculata:Variation of Fatty-Acid Composition, Phenolic Content, and Antioxidant andα-Amylase-Inhibitory Activities among Varieties, Organs, and Development Stages. Chem. Biodivers. 2015, 12, 1322–1338. [Google Scholar] [CrossRef]
- Ezzahra, F.; Bousta, D.; Imtara, H.; Lahrichi, A.; Elhabbani, R.; El, G.; Al, O.; Saleh, A.; Parvez, M.K.; Grafov, A.; et al. Chemical Composition and Anti-Urolithiatic Activity of Extracts from Argania Spinosa (L.) Skeels Press-Cake and Acacia Senegal (L.) Willd. Molecules 2022, 27, 3973. [Google Scholar]
- Henry, M.; Kowalczyk, M.; Maldini, M.; Piacente, S.; Stochmal, A.; Oleszek, W. Saponin Inventory from Argania spinosa Kernel Cakes by Liquid Chromatography and Mass Spectrometry. Phytochem. Anal. 2013, 24, 616–622. [Google Scholar] [CrossRef]
- Li, X.C.; Liu, Y.Q.; Yang, C.R.; Nigam, S.K.; Misra, G. Triterpenoid Saponins from Madhuca Butyracea. Phytochemistry 1994, 37, 827–829. [Google Scholar] [CrossRef]
- Chung, S.; Lim, G.J.; Lee, J.Y. Quantitative analysis of melanin content in a three-dimensional melanoma cell culture. Sci. Rep. 2019, 9, 780. [Google Scholar] [CrossRef] [Green Version]
- Cichorek, M.; Wachulska, M.; Stasiewicz, A.; Tymińska, A. Skin melanocytes: Biology and development. Adv. Dermatol. Allergol. 2013, 1, 30–41. [Google Scholar] [CrossRef]
- Haddad, M.M.; Xu, W.; Medrano, E.E. Aging in Epidermal Melanocytes: Cell Cycle Genes and Melanins. J. Investig. Dermatol. Symp. Proc. 1998, 3, 36–40. [Google Scholar] [CrossRef] [Green Version]
- Jeong, H.-S.; Lee, S.H.; Yun, H.-Y.; Baek, K.J.; Kwon, N.S.; Park, K.-C.; Kim, D.-S. Involvement of mTOR signaling in sphingosylphosphorylcholine-induced hypopigmentation effects. J. Biomed. Sci. 2011, 18, 55. [Google Scholar] [CrossRef] [Green Version]
- Lin, J.Y.; Fisher, D.E. Melanocyte biology and skin pigmentation. Nature 2007, 445, 843–850. [Google Scholar] [CrossRef] [PubMed]
- Shibahara, S.; Yasumoto, K.-I.; Amae, S.; Udono, T.; Watanabe, K.-I.; Saito, H.; Takeda, K. Regulation of Pigment Cell-Specific Gene Expression by MITF. Pigment Cell Res. 2000, 13, 98–102. [Google Scholar] [CrossRef] [PubMed]
- Branquinho, M.S.; Silva, M.B.; Silva, J.C.; Sales, M.C.; Barros, S.B.; Maria-Engler, S.S.; Campa, A. A 2D and 3D melanogenesis model with human primary cells induced by tyrosine. J. Biol. Methods 2020, 7, e134. [Google Scholar] [CrossRef] [PubMed]
- Cooksey, C.J.; Garratt, P.J.; Land, E.J.; Pavel, S.; Ramsden, C.A.; Riley, P.A.; Smit, N.P.M. Evidence of the Indirect Formation of the Catecholic Intermediate Substrate Responsible for the Autoactivation Kinetics of Tyrosinase. J. Biol. Chem. 1997, 272, 26226–26235. [Google Scholar] [CrossRef] [PubMed] [Green Version]
- Smit, N.; Vicanova, J.; Pavel, S. The Hunt for Natural Skin Whitening Agents. Int. J. Mol. Sci. 2009, 10, 5326–5349. [Google Scholar] [CrossRef]
- Guo, J.; Ma, X.; Bouffard, F.; Zhang, S.Y. A Novel multi-fruit acids formula design on molecular basis for skin brightening via a system biology approach. J. Cosmet. Dermatol. 2022. [Google Scholar] [CrossRef]
- Davis, E.C.; Callender, V.D. Postinflammatory Hyperpigmentation A Review of the Epidemiology, Clinical Features, and Treatment Options in Skin of Color. J. Clin. Aesthetic Dermatol. 2010, 3, 20–31. [Google Scholar]
- Kim, J.S.; Seo, Y.C.; No, R.H.; Lee, H.Y. Improved cosmetic activity by optimizing the Lithospermum erythrorhizon extraction process. Cytotechnology 2015, 67, 51–65. [Google Scholar] [CrossRef] [Green Version]
- Pillaiyar, T.; Manickam, M.; Namasivayam, V. Skin whitening agents: Medicinal chemistry perspective of tyrosinase inhibitors. J. Enzym. Inhib. Med. Chem. 2017, 32, 403–425. [Google Scholar] [CrossRef] [Green Version]
- Fuller, B.B.; Drake, M.A.; Spaulding, D.T.; Chaudhry, F. Downregulation of Tyrosinase Activity in Human Melanocyte Cell Cultures by Yohimbine. J. Investig. Dermatol. 2000, 114, 268–276. [Google Scholar] [CrossRef] [Green Version]
- Riley, P.A. Melanin. Int. J. Bioochem. Cell Biol. 1997, 29, 1235–1239. [Google Scholar] [CrossRef]
- Slommsk, A. POMC Gene Expression in Mouse and Hamster Melanoma Cells. FEBS Lett. 1991, 291, 165–168. [Google Scholar]
- Slominski, A.; Wortsman, J.; Luger, T.; Paus, R.; Solomon, S. Corticotropin Releasing Hormone and Proopiomelanocortin Involvement in the Cutaneous Response to Stress. Physiol. Rev. 2000, 80, 979–1020. [Google Scholar] [CrossRef]
- Bertolotto, C.; Busca, R.; Ballotti, R.; Ortonne, J. L’AMP cyclique est un régulateur de la pigmentation de la peau. Med./Sci. 2001, 17, 177. [Google Scholar] [CrossRef]
- Gonzalez, G.A.; Montminy, M.R. Cyclic AMP stimulates somatostatin gene transcription by phosphorylation of CREB at serine 133. Cell 1989, 59, 675–680. [Google Scholar] [CrossRef]
- Khaled, M.; Larribere, L.; Bille, K.; Ortonne, J.-P.; Ballotti, R.; Bertolotto, C. Microphthalmia Associated Transcription Factor Is a Target of the Phosphatidylinositol-3-Kinase Pathway. J. Investig. Dermatol. 2003, 121, 831–836. [Google Scholar] [CrossRef] [Green Version]
- Wu, L.-C.; Lin, Y.-Y.; Yang, S.-Y.; Weng, Y.-T.; Tsai, Y.-T. Antimelanogenic effect of c-phycocyanin through modulation of tyrosinase expression by upregulation of ERK and downregulation of p38 MAPK signaling pathways. J. Biomed. Sci. 2011, 18, 74. [Google Scholar] [CrossRef] [Green Version]
- Su, T.R.; Lin, J.J.; Tsai, C.C.; Huang, T.K.; Yang, Z.Y.; Wu, M.O.; Zheng, Y.Q.; Su, C.C.; Wu, Y.J. Inhibition of Melanogenesis by Gallic Acid: Possible Involvement of the PI3K/Akt, MEK/ERK and Wnt/β-Catenin Signaling Pathways in B16F10 Cells. Int. J. Mol. Sci. 2013, 14, 20443–20458. [Google Scholar] [CrossRef] [Green Version]
- Dorsky, R.I.; Raible, D.W.; Moon, R.T. Direct regulation of nacre, a zebrafish MITF homolog required for pigment cell formation, by the Wnt pathway. Genes Dev. 2000, 14, 158–162. [Google Scholar] [CrossRef]
- Slominski, A.; Kim, T.-K.; Brożyna, A.; Janjetovic, Z.; Brooks, D.; Schwab, L.; Skobowiat, C.; Jóźwicki, W.; Seagroves, T. The role of melanogenesis in regulation of melanoma behavior: Melanogenesis leads to stimulation of HIF-1α expression and HIF-dependent attendant pathways. Arch. Biochem. Biophys. 2014, 563, 79–93. [Google Scholar] [CrossRef] [Green Version]
- Slominski, R.M.; Sarna, T.; Płonka, P.M.; Raman, C.; Brożyna, A.A.; Slominski, A.T. Melanoma, Melanin, and Melanogenesis: The Yin and Yang Relationship. Front. Oncol. 2022, 12, 842496. [Google Scholar] [CrossRef] [PubMed]
- Yamada, T.; Hasegawa, S.; Inoue, Y.; Date, Y.; Yamamoto, N.; Mizutani, H.; Nakata, S.; Matsunaga, K.; Akamatsu, H. Wnt/β-Catenin and Kit Signaling Sequentially Regulate Melanocyte Stem Cell Differentiation in UVB-Induced Epidermal Pigmentation. J. Investig. Dermatol. 2013, 133, 2753–2762. [Google Scholar] [CrossRef] [PubMed] [Green Version]
- Hu, S.; Chen, Y.; Zhao, B.; Yang, N.; Chen, S.; Shen, J.; Bao, G.; Wu, X. KIT is involved in melanocyte proliferation, apoptosis and melanogenesis in the Rex Rabbit. PeerJ 2020, 8, e9402. [Google Scholar] [CrossRef] [PubMed]
- Lan, W.J.; Wang, H.Y.; Lan, W.; Wang, K.Y. Geniposide Enhances Melanogenesis by Stem Cell Factor/c-Kit Signalling in Norepinephrine-Exposed Normal Human Epidermal Melanocyte. Basic Clin. Pharmacol. Toxicol. 2008, 103, 88–93. [Google Scholar] [CrossRef]
- García-Borrón, J.C.; Abdel-Malek, Z.; Jiménez-Cervantes, C. MC1R, the cAMP pathway, and the response to solar UV: Extending the horizon beyond pigmentation. Pigment. Cell Melanoma Res. 2014, 27, 699–720. [Google Scholar] [CrossRef] [Green Version]
- Slominski, A.; Tobin, D.J.; Shibahara, S.; Wortsman, J. Melanin pigmentation in mammalian skin and its hormonal regulation. Physiol. Rev. 2004, 84, 1155–1228. [Google Scholar] [CrossRef]
- Wen, K.C.; Chang, C.S.; Chien, Y.C.; Wang, H.W.; Wu, W.C.; Wu, C.S.; Chiang, H.M. Tyrosol and Its Analogues Inhibit Alpha-Melanocyte-Stimulating Hormone Induced Melanogenesis. Int. J. Mol. Sci. 2013, 14, 23420–23440. [Google Scholar] [CrossRef] [Green Version]
- An, J.J.; Rhee, Y.; Kim, S.H.; Kim, D.M.; Han, D.H.; Hwang, J.H.; Jin, Y.J.; Cha, B.S.; Baik, J.H.; Lee, W.T.; et al. Peripheral Effect of α-Melanocyte-stimulating Hormone on Fatty Acid Oxidation in Skeletal Muscle. J. Biol. Chem. 2007, 282, 2862–2870. [Google Scholar] [CrossRef] [Green Version]
- Lee, J.H.; Jang, J.Y.; Park, C.; Kim, B.W. Curcumin suppresses α-melanocyte stimulating hormone-stimulated melanogenesis in B16F10 cells. Int. J. Mol. Med. 2010, 26, 101–106. [Google Scholar] [CrossRef]


Publisher’s Note: MDPI stays neutral with regard to jurisdictional claims in published maps and institutional affiliations. |
© 2022 by the authors. Licensee MDPI, Basel, Switzerland. This article is an open access article distributed under the terms and conditions of the Creative Commons Attribution (CC BY) license (https://creativecommons.org/licenses/by/4.0/).
Share and Cite
Bouhoute, M.; Amen, Y.; Bejaoui, M.; Mizushima, A.K.O.; Shimizu, K.; Isoda, H. New Butyroside D from Argan Press Cake Possess Anti-Melanogenesis Effect via MITF Downregulation in B16F10 and HEM Cells. Int. J. Mol. Sci. 2022, 23, 16021. https://doi.org/10.3390/ijms232416021
Bouhoute M, Amen Y, Bejaoui M, Mizushima AKO, Shimizu K, Isoda H. New Butyroside D from Argan Press Cake Possess Anti-Melanogenesis Effect via MITF Downregulation in B16F10 and HEM Cells. International Journal of Molecular Sciences. 2022; 23(24):16021. https://doi.org/10.3390/ijms232416021
Chicago/Turabian StyleBouhoute, Meryem, Yhiya Amen, Meriem Bejaoui, Aprill Kee Oliva Mizushima, Kuniyoshi Shimizu, and Hiroko Isoda. 2022. "New Butyroside D from Argan Press Cake Possess Anti-Melanogenesis Effect via MITF Downregulation in B16F10 and HEM Cells" International Journal of Molecular Sciences 23, no. 24: 16021. https://doi.org/10.3390/ijms232416021