Article

A Rising Role for Decentralized Solar Minigrids in Integrated Rural Electrification Planning? Large-Scale, Least-Cost, and Customer-Wise Design of Grid and Off-Grid Supply Systems in Uganda

by
Andrés González-García
1,2,*,
Pedro Ciller
1,
Stephen Lee
2,
Rafael Palacios
1,2,
Fernando de Cuadra García
1 and
José Ignacio Pérez-Arriaga
1,2
1
Instituto de Investigación Tecnológica, Universidad Pontificia Comillas (IIT-Comillas), 28015 Madrid, Spain
2
Massachusetts Institute of Technology (MIT), Cambridge, MA 02139, USA
*
Author to whom correspondence should be addressed.
Energies 2022, 15(13), 4517; https://doi.org/10.3390/en15134517
Submission received: 10 May 2022 / Revised: 11 June 2022 / Accepted: 13 June 2022 / Published: 21 June 2022

Abstract

:
Increasing Uganda’s low electrification rate is one of the country’s major challenges. Power service is essential to achieve socioeconomic development and poverty reduction, especially in rural areas. This paper shows the advantages of using an integrated (grid and off-grid) electrification model with high geospatial, temporal, and customer-class granularity as the Reference Electrification Model (REM). In universal electrification strategies, REM will help better ascertain the role of minigrids, jointly with grid extension, solar kits, and stand-alone systems. REM has been applied to the Southern Service Territory (SST) to determine the least-cost mix of electrification modes—grid extension, off-grid minigrids, and standalone systems—that satisfies the hourly demand requirements of each customer—residential, commercial, or industrial—considering its individual location. REM incorporates the existing grid layout, the hourly solar local profile, and the catalogs of actual components for network and generation designs. The paper shows that minigrids can provide grid-like service at a significantly lower cost in many circumstances and to a considerable extent. Therefore, minigrid strategies should play a more important role in electrification planning, both transitorily and on a permanent basis, particularly when the central grid suffers from frequent and prolonged blackouts.

1. Introduction and State of the Art

Uganda’s National Electrification Strategy (NES) objective is to achieve universal access by 2030 [1]. Currently, around 24% of the households are connected to the national grid, 23% own a Solar Kit (SK) or lantern, and 3% own a Solar Home System (SHS). According to NES: “Achieving universal access in Uganda will involve the massive expansion of both on-grid access, through densification, intensification and grid expansions, as well as off-grid access through the development of minigrids and the expansion of stand-alone solar energy systems”.
There are operational minigrids in Uganda [2], primarily solar/battery hybrid grids, but their numbers are presently negligible compared to other electrification modes (19 existing minigrids, mostly solar and hydro-powered, and 61 more under construction). However, the NES has estimated that in 2030, by using GEOSIM village-level analysis [3], the least-cost electrification solution would include around 2700 solar minigrids with some 234 thousand customers (2% of the total customer base).
The datasets and methodology proposed here do not entirely coincide with the ones used to develop the NES. Therefore, our findings and recommendations cannot be directly compared to the NES’s conclusions but based on our results, we have concluded that the role of minigrids is likely underestimated. In this paper, we study the most cost-effective technologies for universal access in Uganda’s Southern Service Territory, modeling customer-wise grid and off-grid designs using the Reference Electrification Model [4], and we have focused particularly on the role of minigrids. This paper is based on and updates the work we originally developed for the Promotion of Minigrids for Rural Electrification project (Pro Mini-Grids) by the Deutsche Gesellschaft für Internationale Zusammenarbeit (German Agency for International Cooperation, GIZ). For that project, we conducted an electrification masterplan analysis for this Service Territory [5], in cooperation with the Ministry of Energy and Mineral Demand (MEMD, and the Electricity Regulatory Authority (ERA) of Uganda. The project is co-financed by the German Federal Ministry for Economic Cooperation and Development (BMZ) under the German Climate Technology Initiative (DKTI), the European Union (EU) and the Government of Uganda through the Rural Electrification Programme (REP) of the MEMD. The project is implemented by the MEMD, REP, ERA and GIZ. Up to 42 minigrids will be installed, of which 28 will be in Northern Uganda and 14 in Southern Uganda.
The impact of electrification has been thoroughly studied, especially in this last decade, in the context of achieving the Sustainable Development Goal 7 of Access to Affordable and Sustainable Energy for All [6,7,8] and also as an enabler for the achievement of other development goals [9,10,11,12,13,14,15,16,17,18,19,20,21].
The extent of the contribution of minigrids to the electrification challenge and their nexus with the grid [22,23,24,25,26,27,28,29,30,31,32,33] is still an open question among decision-makers in many countries. The first considered option is always grid extension, although in many developing countries is not viable because of the dire financial situation of distribution companies. The emergence of low-cost distributed generation for off-grid minigrids and standalone systems offers an efficient and technically possible alternative. However, the minigrid option involves dealing with new actors, technologies, business models, regulatory and policy frameworks, values, and cultural, environmental, and human factors [23,26].
In this paper, we focus on the determination of the efficient geospatial frontier between grid extension, minigrids, and standalone systems. The Reference Electrification Model [4], developed jointly by the Universidad Pontificia Comillas Institute for Research in Technology and the Massachusetts Institute of Technology, was selected from a limited number of master planning tools available for this purpose. REM supports decision-making on which technology to use to electrify any given area through least-cost techno-economic modeling. It allows for pondering quantitatively the impact of a variety of policy objectives, such as different demand targets or scenarios for domestic, productive, or community uses, reduction or full displacement of off-grid diesel generation, and share of penetration of solar kits. It also considers user-defined assumptions or expectations, such as demand growth, cost of different generation technologies, use of different distribution catalogs or standards, financial costs of different supply models, efficiencies in billing and Operation and Maintenance (O&M) and expenses. Finally, it takes into account the geospatial layout of non-electrified customers and the existing infrastructure, using highly granular data to calculate the most efficient solutions.
REM operates with a very high spatial resolution (individual customer location, topographic characteristics, and restrictions), customer-wise demand (hourly demand per customer type), and temporal definition (hourly dispatch). It is also highly granular in generation components, medium and low voltage distribution catalog, calculates network designs optimizing the power flow and losses at every line trench, connects every building, and includes hourly solar profiles when optimizing the generation of off-grid systems. To the best of our knowledge, no rural electrification planning tool considers the same level of modeling detail as REM [34]. REM incorporates electrical constraints and topographical features of the terrain [35] when optimizing the network layout of minigrids and grid extensions. The model simulates the hourly dispatch of off-grid systems when optimizing their generation designs [36], considering the impact of seasonality and accounting for the non-served energy. REM has been already applied in the electrification master plans of Rwanda [37], Mozambique [38], Indonesia [39], Ecuador [40], Colombia [41], Pakistan [42], and Bolivia [43].
Other planning tools also address the large-scale electrification of underserved regions [34,44]. Still, none operates at the building level or guarantees the electrical feasibility of networks calculating power flows. Most of these tools use fast approximations based on rules of thumb to obtain the off-grid generation designs. They generally fail to incorporate the impact of supply shortages into the electrification solution.
The Open Source Spatial Electrification Tool (OnSSET) is a widely used tool created by the Royal Institute of Technology (KTH) [45]. OnSSET groups the consumers into raster cells and estimates the least-cost solution by calculating the Levelized Cost of Electricity (LCOE) of each cell and comparing among several electrification alternatives. One of the main advantages of OnSSET is that it benefits from Geographical Information Systems (GIS) to provide immediate access to databases that contain crucial information for planning (such as the location of the power grid and rivers, among many other things). OnSSET is a sophisticated tool that has been applied in detail in many countries (e.g., Nigeria [46], Ethiopia [47], and Afghanistan [48], and developed the 96 scenarios included in the Global Electrification Platform [49] of the Energy Sector Management Assistance Program of the World Bank (ESMAP) for 58 countries). Its recent developments include an algorithm that joins nearby cells to form population clusters [50] and the combination of classic optimization techniques and linear regression to estimate the off-grid generation costs [51].
The IntiGIS tool [52] also clumps the buildings into cells and calculates the LCOE of electrification alternatives for each cell to determine the planning solution. IntiGIS is less developed than OnSSET, and there are no recent publications in the literature concerning this tool.
Other tools operate with villages or settlements instead of cells (i.e., the tools represent each village or settlement with a latitude–longitude point). The aggregated demand of each village corresponds to the summation of the individual demands of all the consumers inside. Network Planner is one such tool, and it sizes the generation of minigrids with fast arithmetic rules that do not consider the temporal dispatch of the systems. Network Planner obtains the network layout that connects villages to the existing power grid by applying an iterative algorithm based purely on geometric considerations [53]. Network Planner has been used in several national plans and case studies, for instance, in Ghana [54] and Nigeria [55].
GEOSIM is a planning tool that ranks villages according to several indicators related to health, education, local economy, and distance to other villages. The villages with the highest ranks are classified as Development Poles, and the remaining villages are grouped around them. Finally, GEOSIM estimates the best planning solution by minimizing the LCOE of several electrification alternatives. The GEOSIM tool has been licensed in many countries [3].
Finally, LAPER (Logiciel d’Aide à la Planification d’Électrification Rurale) is a planning tool that also operates with villages [56]. This tool requires the user to introduce an initial network extension that connects the villages to the power grid. Then, LAPER performs cost comparisons to determine if it is worth disconnecting a village from that initial network extension and electrifying it with off-grid alternatives. LAPER was applied in Morocco [57].
This article shows how customer-wise geospatial granularity accurately determines the efficient frontier between grid, minigrids, and standalone systems. By considering the different system-wise technical, operational, business, and social costs of each alternative, REM selects the least-cost choice according to several factors, including customer needs, technologies and business models available, costs of blackouts, and the electrical distribution code, and the regulatory and financial restrictions applicable. Our conclusions show that minigrids could provide grid-like service at a significantly lower cost in many circumstances. They should play a more significant role in universal electrification planning. Some minigrids could be the best supply mode for many years or even permanently in very isolated locations. Others may play an efficient transitory role while demand grows or while the existing central grid suffers from low reliability and yields frequent and prolonged blackouts. This transitory solution will pose a low-cost supply alternative for critical services, productive, community, or other priority clusters of customers. At the same time, decision-makers should make provisions for an eventual later connection to the grid as the situation evolves.
In Section 2, we summarize the bases of the REM modeling and detail briefly the input data gathering, inferencing, and assumption processes. We describe how we determine building locations, network data, energy costs and resources, and the main assumptions and inferences required to model the Southern Service Territory with REM.
In Section 3, we summarize the REM results for the whole territory, considering the input data and assumptions specified for the pivotal (reference) scenario analyzed.
In Section 4, we focus specifically on the minigrid results, analyzing why they are preferred to grid extension in some cases, determining the cost ratio of both alternatives, and analyzing the size of minigrid customer clusters as opposed to village-size oversimplifications.
In Section 5, we see how different assumptions impact and affect the importance of minigrids in the least-cost REM solutions, such as different central grid reliability levels or different demand levels.

2. Methodology

The outputs provided by REM rely on a combination of ground data, calculated assumptions, and strategic decision-making. The tool should be used in close interaction with the lead agency and departments for planning. In this case, all the analysis has been developed in close collaboration with the GIZ team in Uganda, with detailed insights from the MEMD and the collaboration and input of the US National Rural Electric Cooperative Association (NRECA), as a consultant responsible for the elaboration of master electrification plans for the country.

2.1. Minigrids, Standalone Systems, and Network Extension Design: Compared Cost of Supply

The novelty of our approach is the comparison of the cost of electricity supply for three alternatives for the whole territory and down to each customer connection, and according to the demand level and profile for each customer type:
  • Network extension from the national distribution grid, including the Medium Voltage (MV) and Low Voltage (LV) technical and economic network catalog of components, the applicable grid code, and the cost of energy taken from the grid and its reliability of supply;
  • Off-grid minigrids including generation and network design;
  • Standalone systems, either fully-fledged Alternating Current (AC) solar systems or Direct Current (DC) solar kits.
This detailed comparison results in selecting, for each customer or group of customers (cluster), the best (least-cost) supply mode among those three for every scenario modeled.

2.2. Description of the Data Gathering Process

Detailed electrification planning requires a comprehensive set of input parameters and data. The data gathering and pre-processing steps for a case require a significant effort to ensure accurate designs and results. The input data needed by REM is summarized below (please refer to Appendix A. REM Input Data Catalog for a detailed list of the various data required by the model):
  • The study has used existing field data from canvasses developed by GIZ and our tools for satellite imagery processing to overcome the lack of information about the precise location of electrified vs. non-electrified customers.
  • Existing distribution feeders (MV): The MEMD provided a shapefile of the layout of the MV network within the Southern Service Territory of Uganda. The network file was closely analyzed to differentiate between existing and planned lines. On top of this layout, we added the respective voltage level and the energy cost at the distribution feeders. To characterize the frequent blackouts and weak supply in rural areas in Uganda, we included the reliability of each section of the network.
  • Energy resources: The model considers the typical hourly solar irradiance in the SST through a year, using the National Renewable Energy Laboratory’s PVWatts® tool [58] to inform better the possible generation capacity of solar resources, taking into account seasonality, weather and temperature conditions. Additionally, we used an average cost of diesel fuel within the SST for the various minigrids designed. We assumed that the solar resource and the cost of diesel fuel were uniform throughout the SST.
  • Network and minigrid generation catalog: Electrification technologies, including network equipment, such as distribution lines and transformers, PV panels, diesel generators, storage, and power conversion equipment, all have costs and quality specifications that may vary by region. For this study, we have considered mainstream available and affordable components in the region, averaging the expected evolution of their costs until 2030, especially in rapidly evolving technologies such as batteries or solar (We have not considered the emergence of future disruptive technologies, especially anticipated in batteries [59] and solar PV [60,61] for this study. Being a low-margin market, before entering the off-grid sector in developing countries, these technologies will need to mature and become widely available at a low cost).

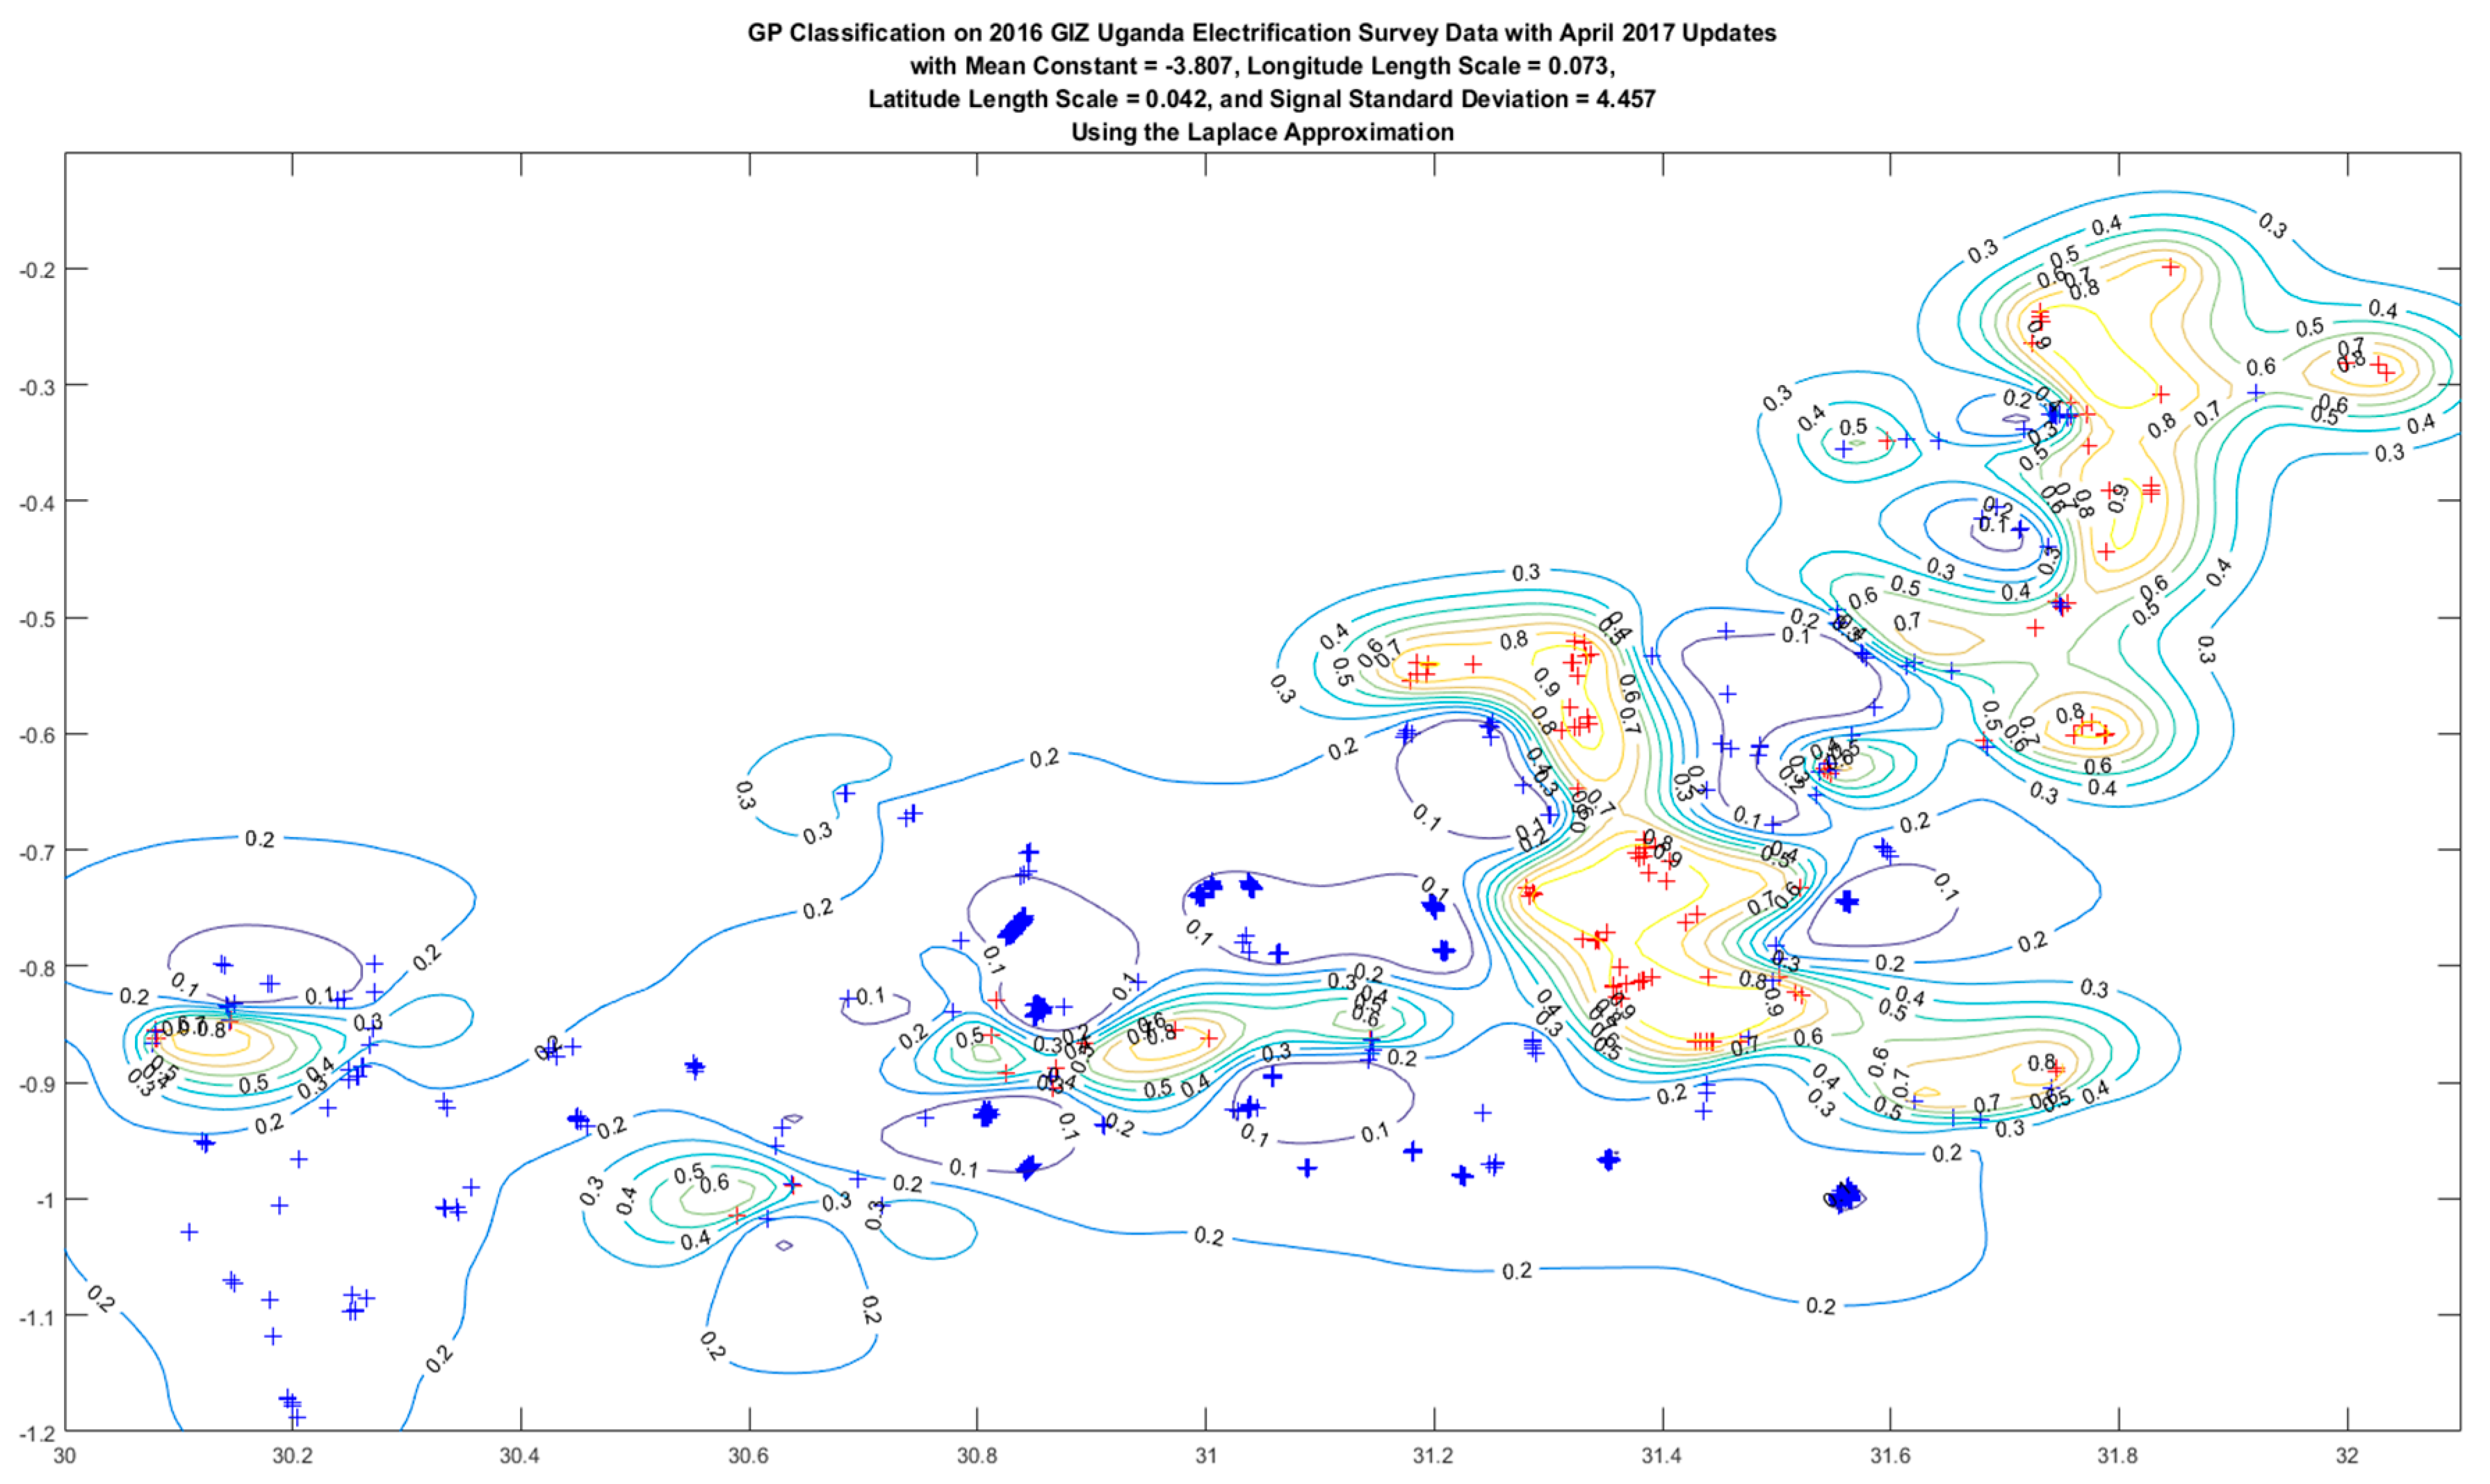
2.3. Building Identification and Electrification Status Estimation

The original buildings’ location information used for the GIZ study, established by identifying rooftops from open-access satellite imagery using our computer vision system (as described in [5]), has been updated for this article. This dataset combines building files from the OpenStreetMap (OSM) data [62] with those from the Open Buildings (OB) set from Google Research [63]. Where building shapes overlapped between the two datasets, we prioritize those from OpenStreetMap because they are manually annotated. We perceive them to be of higher quality than the computer vision-based detection used in Google Research’s buildings. The total number of buildings identified in the Southern Service Territory of 1,014,421 users, including not only residential users (74.5%) but also community users (5.8%) or productive users (19.7%).
The MIT/IIT team performed an electrification status estimation using an inference system based on Gaussian Processes with GIZ’s October 2016 electrification survey for the SST [4,18,64]. GIZ surveyed clusters of 3–10 buildings in geographically distributed areas around the SST, totaling 472 edifices. GIZ also augmented this data with expert knowledge of the local landscape. The MIT/IIT team’s Gaussian Process method exclusively used survey data and inferred electrification probabilities based on spatial correlation. Electrification probabilities were given for every geospatial location in the SST, as shown in Figure 1 and Figure 2.
For modeling purposes, electrification probabilities from the Gaussian Process model were converted to specific building classifications using a probability threshold and Bernoulli trials. Any inferred probability less than 19% was classified as non-electrified. Any inferred probability greater than 19% was subject to a Bernoulli trial with a parameter equal to the electrification probability assigned by the Gaussian Process, scaled to meet National Housing and Population Census 2014 district-level specifications. This scaling process enforced the assignment of 37% electrification in the Masaka district, 15% electrification in Rakai, 11% in Isingiro, and 12% in Ntungamo. These figures are consistent with this most recent census [65].
The original electrified buildings information has been further extrapolated to the OSM and OB datasets used for the present study and updated using nighttime lights [66] processed by Gridfinder to filter fires and reflections and identify electrification targets [67]. This process identified a total of 515,941 electrified buildings in the updated dataset (50.9% electrification rate), which are consistent with previous canvases [68]. All buildings under the nighttime lighting measurement were considered electrified for the purpose of this study. In this region of Uganda, some of those buildings within an illuminated area will still probably miss a connection. However, they are so close to the power supply infrastructure (usually the LV and MV network) that connecting them will simply require a drop line or a very short LV extension, protections, and a meter. Therefore, they are excluded from this paper’s analysis. Figure 3 shows electrified buildings overlaid onto non-electrified buildings for the whole SST.
One of the caveats of nighttime lighting satellite imagery is that it shows evidence only of those areas electrified where nightlights can be visible from outer space. Therefore, nighttime lights’ imagery will not detect electrified areas with no streetlights, dimmed illumination, or frequent curtailment of power supply at night (as it is not uncommon in grid-connected rural areas in developing Africa and Asia). The combined approach used in this article, including merging ground field data and nighttime imagery, provides a more precise determination of the location of already electrified customers.

2.4. Existing Distribution Network (MV and LV) Infrastructure

For each one of the Southern Service Territory Scenarios, REM computes thousands of on-grid/off-grid system alternatives to find the optimal least-cost mix of grid extension systems, minigrids, and standalone systems. The REM benchmarks them by designing in detail each alternative and determining, for each household, the solution that minimizes the social cost (including the cost of non-served energy) for the entire system.
Regarding grid connection, REM designs each network extension system (LV lines, LV/MV transformers, and MV lines), connecting individual customers to the existing (or already planned) MV network layout.
The cost of upstream energy supplied by the central grid at the bulk MV distribution level has been set to USD 0.072/kWh for the Universal Access Least-Cost Scenario (Reference Scenario) as indicated by the MEMD. A higher-energy cost gives rise to many more minigrids and SHS connections. In an ideal cost-of-service framework, this cost of upstream energy will also fund any subsequent upstream reinforcements for generation, transmission, and distribution. The scope of the present paper does not include the specific design of these reinforcements. However, it could be the subject of a more detailed analysis if the topology and load status of the existing grid components (lines and transformers) were known.
The MEMD, NRECA, and GIZ provided technical and economic information for the MV and LV catalog of lines and transformers. Therefore, this study has developed all the additional grid extensions and minigrids according to the same national standards (please refer to Appendix A. REM input data catalog for further details on MV and LV components and characteristics). Components selected for the Reference Scenario were specified, bestowing the best practices and experience of the MEMD, considering that large catalogs with more different choices for LV and MV lines would also represent a logistic challenge for implementation, operation, and management. Therefore, for this paper, low-cost distribution technologies (e.g., SWER lines or two-phase wires that could lower the cost of long-distance distribution lines) have not been considered.
Given the alternative of cost-efficient minigrids, new grid extensions might not need to cover considerable distances to serve all the customers. This paper includes a Full-Grid Extension Scenario designed with REM to benchmark both approaches in the sensitivity analysis.
Where the grid is no longer efficient, REM will choose the least-cost option between grid-compliant minigrids (enabling them to be connected to the grid in the future) and standalone systems. Standalone systems will consist of DC solar kits or grid-like AC systems, depending on the level of expected demand.

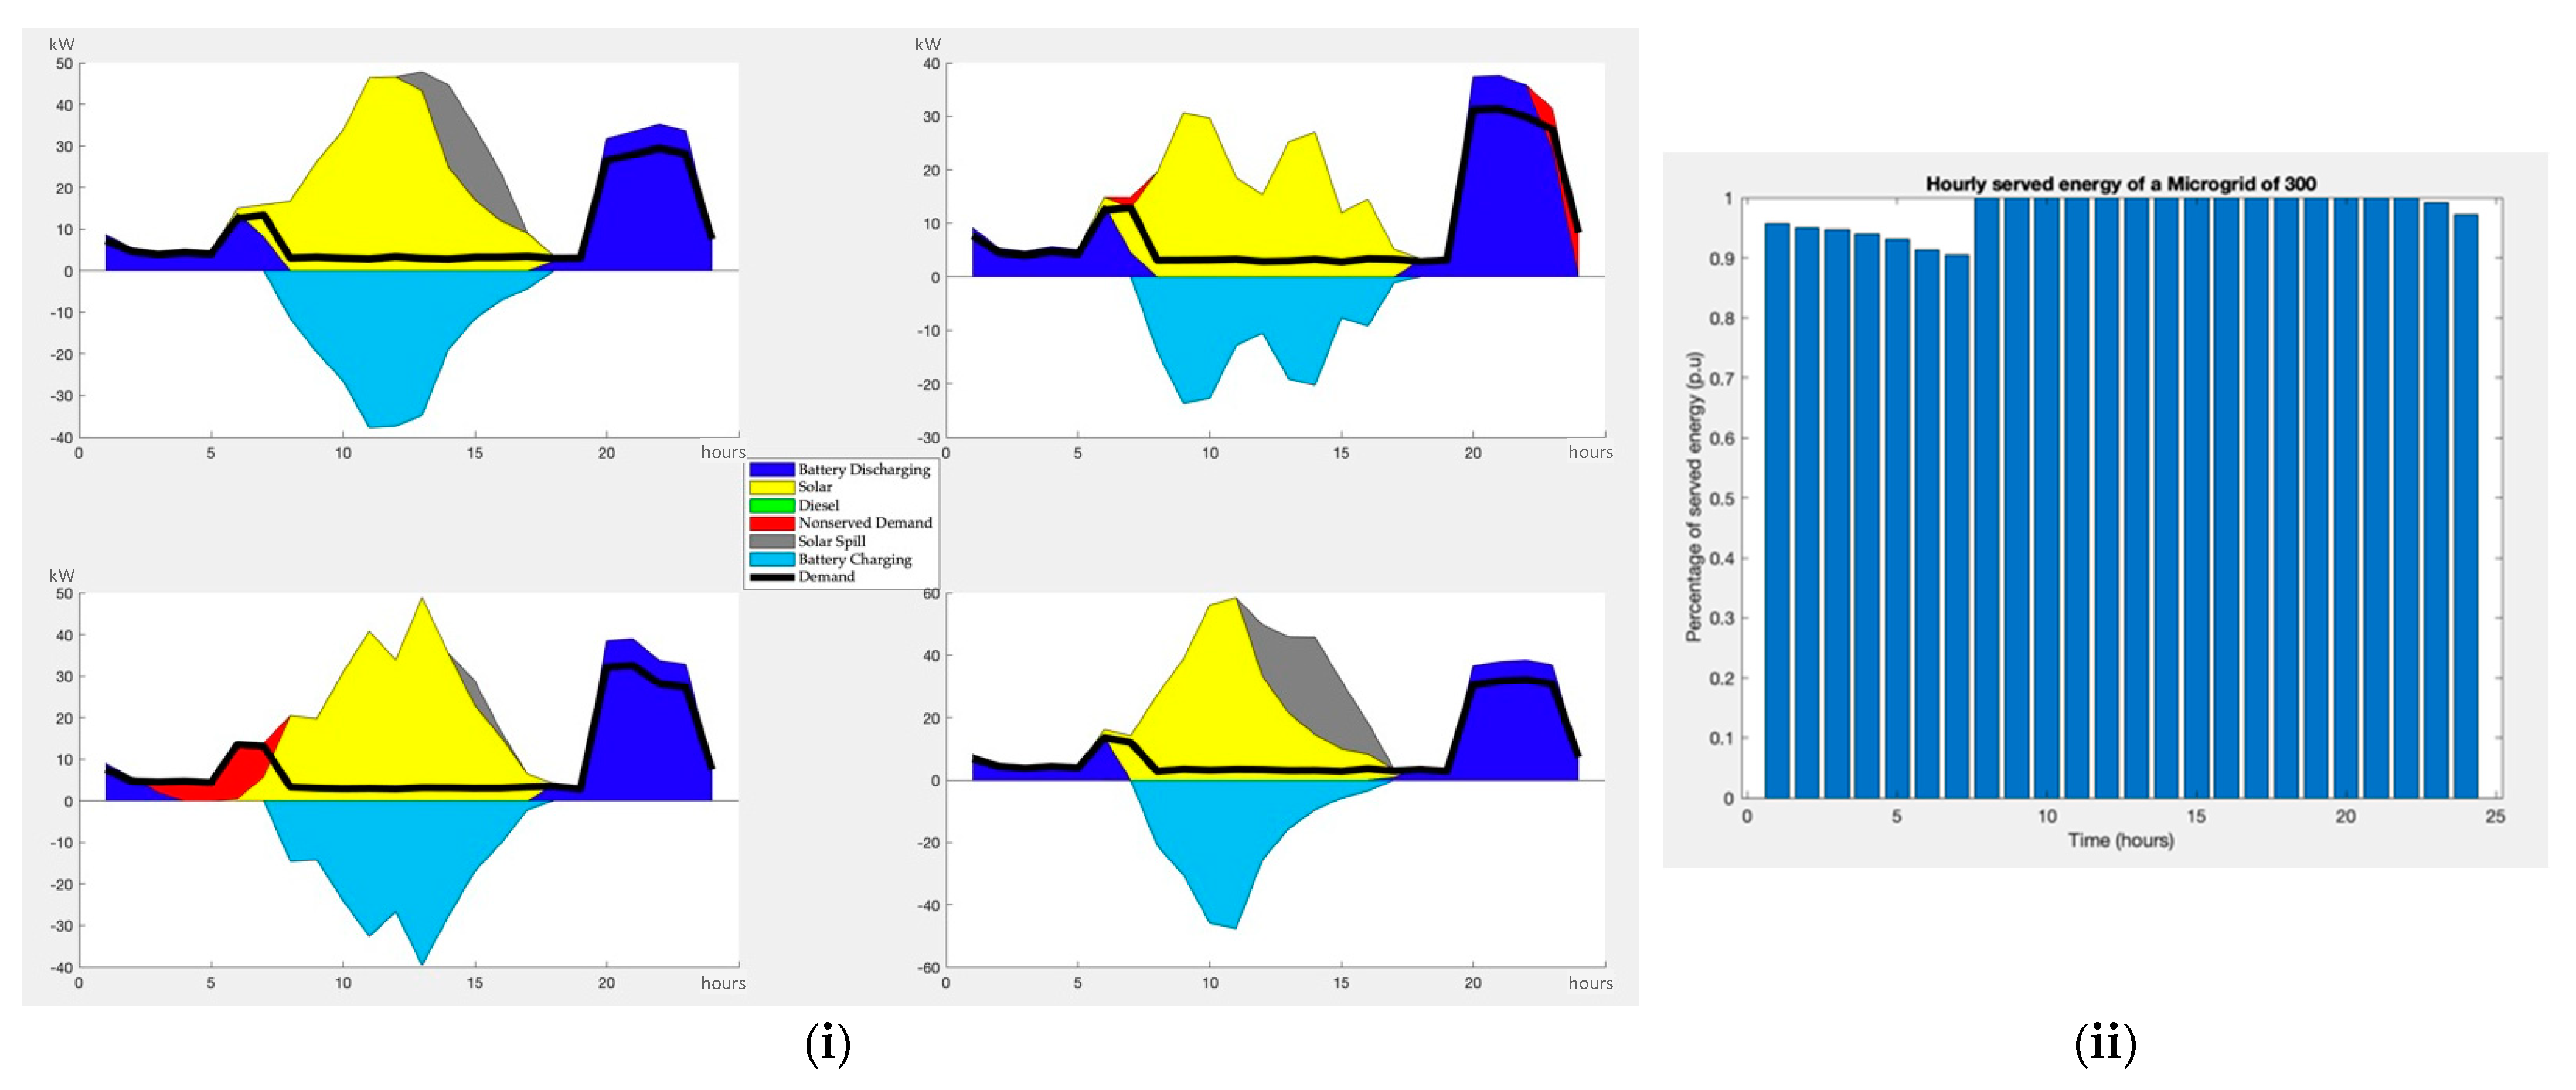
2.5. Off-Grid Generation Catalog and Hybrid PV-Battery-Diesel Design Optimization

The Reference Scenario, detailed later, shows a large share of off-grid electrification in the Southern Service Territory of Uganda (both minigrids and solar home systems). The implementation of more than 900 minigrids will increase the market size for PV panels, batteries, and other off-grid equipment and attract large contractors. Therefore, we expect that the prices will become similar to those of other mid-size international markets with higher volumes of purchases. Per-system costs, such as infrastructure investment (e.g., small control buildings or fuel tanks), are also considered, as well as installation and maintenance labor costs.
REM assumes that each off-grid system has a single centralized generation system. The architecture is flexible, as not all the components are always required. There are alternative architectures, but this one was selected because it can be supported with available off-the-shelf components. It provides AC service, allowing a more straightforward comparison with grid extension designs.
The sizing of each minigrid is optimized considering the hourly solar performance profile, the aggregated customer profiles, and the existing solar, storage, and diesel hybrid generation alternatives. REM performs a simulation using the load following the dispatch strategy for each point in the search space. This strategy meets the demand by using solar energy first, batteries in the second place, and diesel as the last resource. The battery is only charged with solar energy.
The optimization of each generation design includes the evaluation of the different diesel/solar/storage choices to minimize the annuity cost of generation [36]. This design considers the aggregated demand profile for the combination of residential, community, and productive customers in each generation design optimized. It also ponders the lack of reliability (Cost of Non-Served Energy, CNSE), taking into account that some designs will not be able to meet all the expected demand at certain hours of the year.

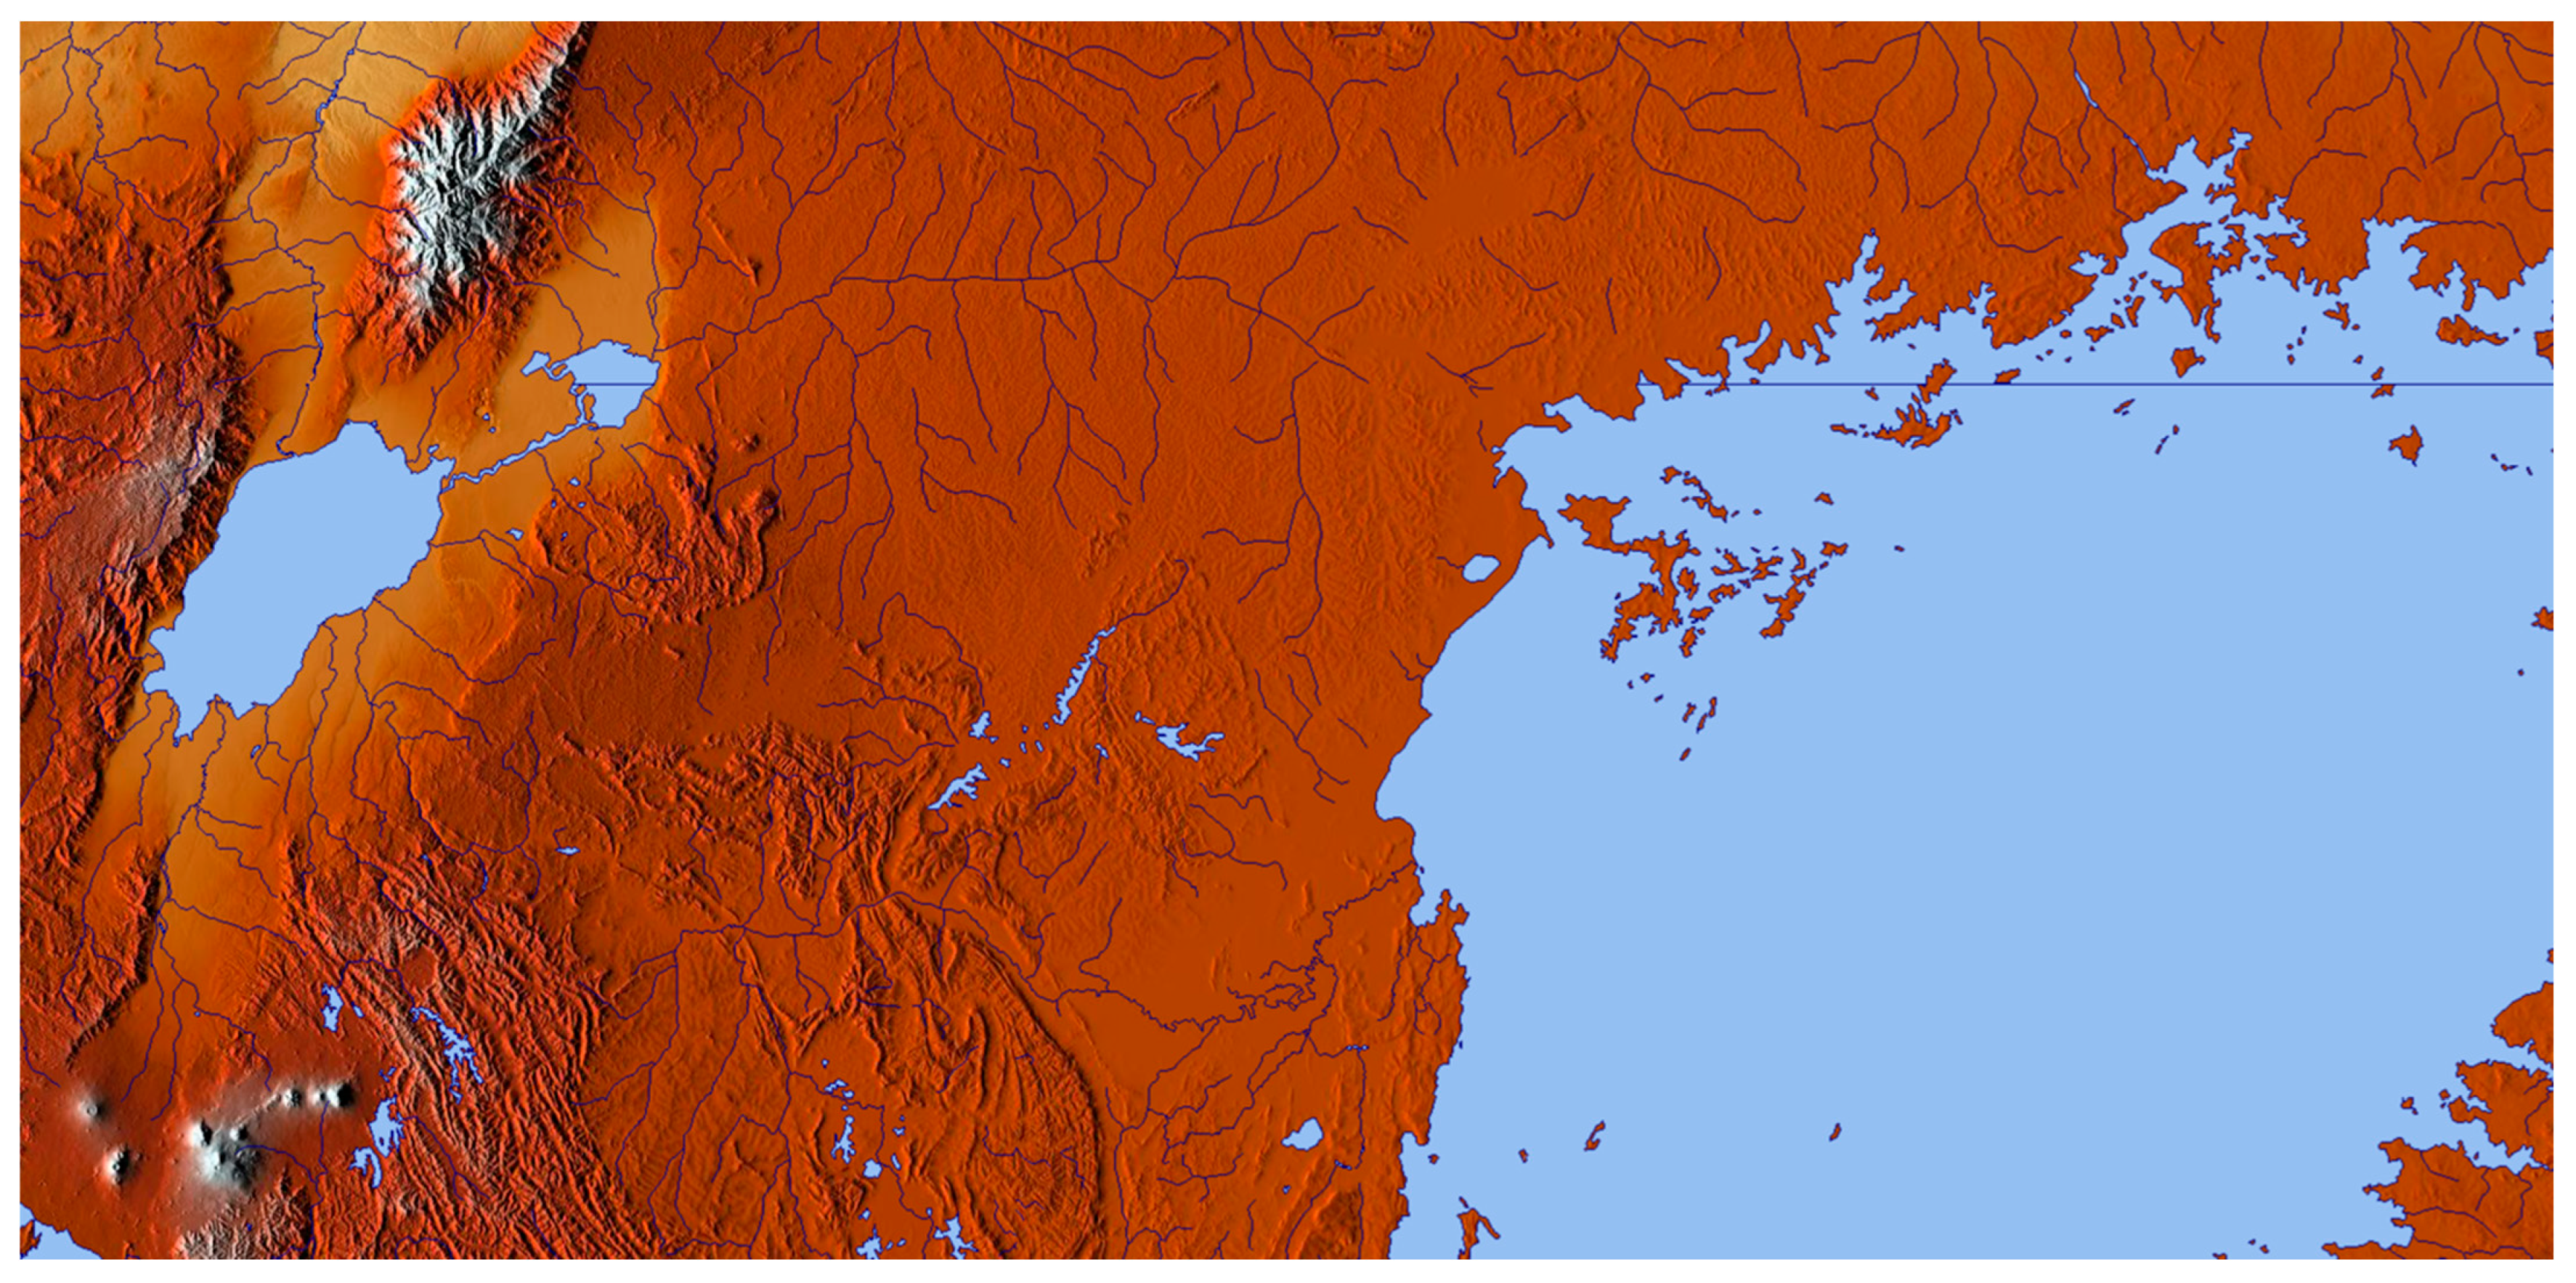
2.6. Topographical Restrictions

There are a number of geographical features considered in our methodology at different moments. First, for the location of households (outside any forbidden areas) and then to determine the cost of generation (solar map of Uganda).
Regarding network design, REM takes into account the slope of the terrain and the location of areas of particular difficulty (rivers, other water bodies, high-risk areas, natural reserves,) which are costlier or even impossible to cross [4,35,69]. Therefore, to decide whether a village should be connected to the central network (including the design of the corresponding connection) or if a minigrid is a better approach, REM will ponder these topographic obstacles. Accurate network design optimizes the layout of the lines, either going over or around hills or mountains (comparing the additional length and cost of these alternative pathways) and avoiding lakes surrounding them when needed, pondering the higher cost of crossing trenches of water bodies. Figure 4 shows the relief and water bodies map of the SST.

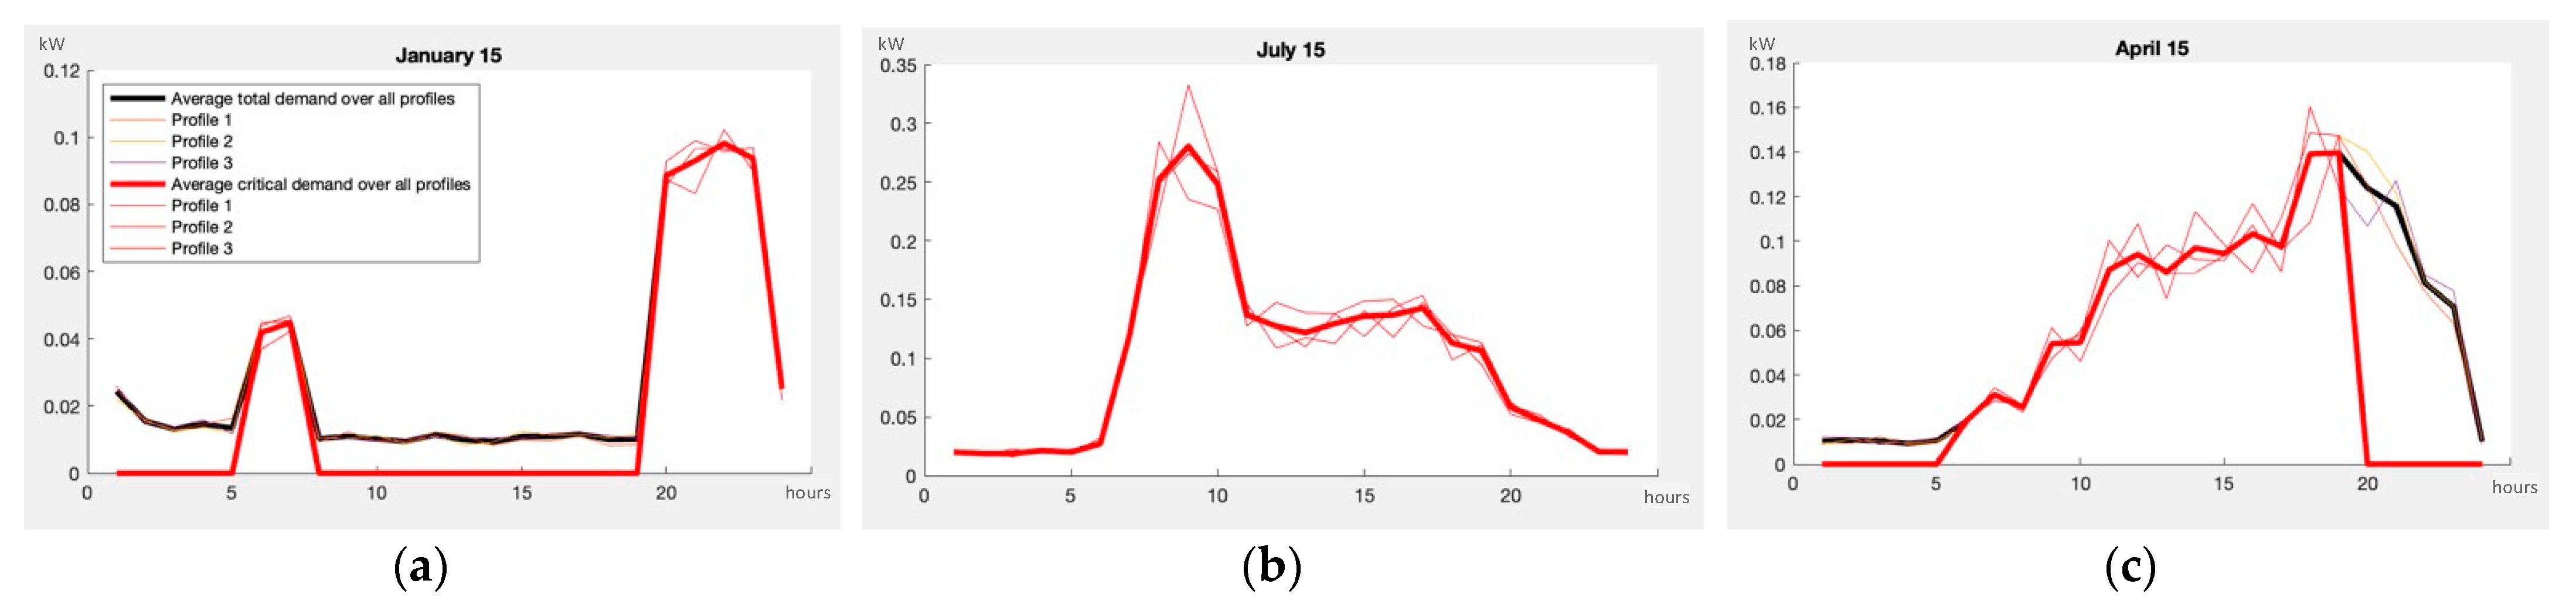
2.7. Customers Demand Characterization and Quality of Service Targets

For this study, we considered three customer types, each one of them with three different hourly profiles across the year. The average consumption data of the three profiles were estimated according to field data provided by GIZ and are shown in Table 1.
The amount of critical energy needs (e.g., domestic morning and evening lights, health centers 24 × 7, or school shifts) and non-critical needs (e.g., after midnight or daytime domestic supply, or non-working hours for productive uses) has been estimated according to the hourly profiles extrapolated from fieldwork at the village of Mutete (Rwanda) [70,71] as can be seen in Figure 5.
It is essential to consider both the reliability of the central network (for the grid-connected customers) and the performance of minigrids and isolated systems (for the off-grid customers). REM can compute different scenarios according to different reliability hypotheses. For the central network, we have analyzed scenarios ranging from the present state of around 85% [72], up to a 97% reliable network, considering that the country will improve from the present status through the necessary investments in central generation, transmission, and distribution reinforcements.
The value of the critical cost of non-served energy (0.75 USD/kWh) was estimated first by considering the current expenditure of residences without electricity on candles, kerosene, and batteries for their needs [73]. This value is also a fair estimation of firms’ expenditure on diesel backup systems, which need to supply around 15% of their energy consumption as a backup for blackouts. This cost per kWh is high because the customers must size their diesel generators according to their peak demand power, even if the gen-set only works a limited amount of time every year. As per not essential (non-critical) demand, our study assumes that leaving demand unserved for domestic uses from midnight until sunrise has a small economic value (USD 0.30/kWh). According to the project’s stakeholders, the population does not have a strong need for power service during nighttime at present.
For small isolated residential customers (consumption expected under 150 Wp), REM will consider a small USD 290 DC Solar Kit, with a 90 Wp solar panel and 40 Ah 12 V (which can supply nearly 64% of the expected demand of these isolated households). The loss of utility of these systems is high compared to grid and minigrid connections,. The value of the cost of non-served energy for DC systems has been set to USD 0.75/kWh (equal to the CNSE for critical demand).
Other input parameters, such as equipment failure rates and technical constraints (e.g., the maximum voltage drop at MV and LV according to the distribution grid code) are included in the techno-economic catalog so the results will comply with the specifications established by the MEMD.
For the Reference Scenario, to determine which customers should probably be off-grid, we assume that the rural network will have improved its reliability from today to 2030, reaching at least 90% of the expected supply.

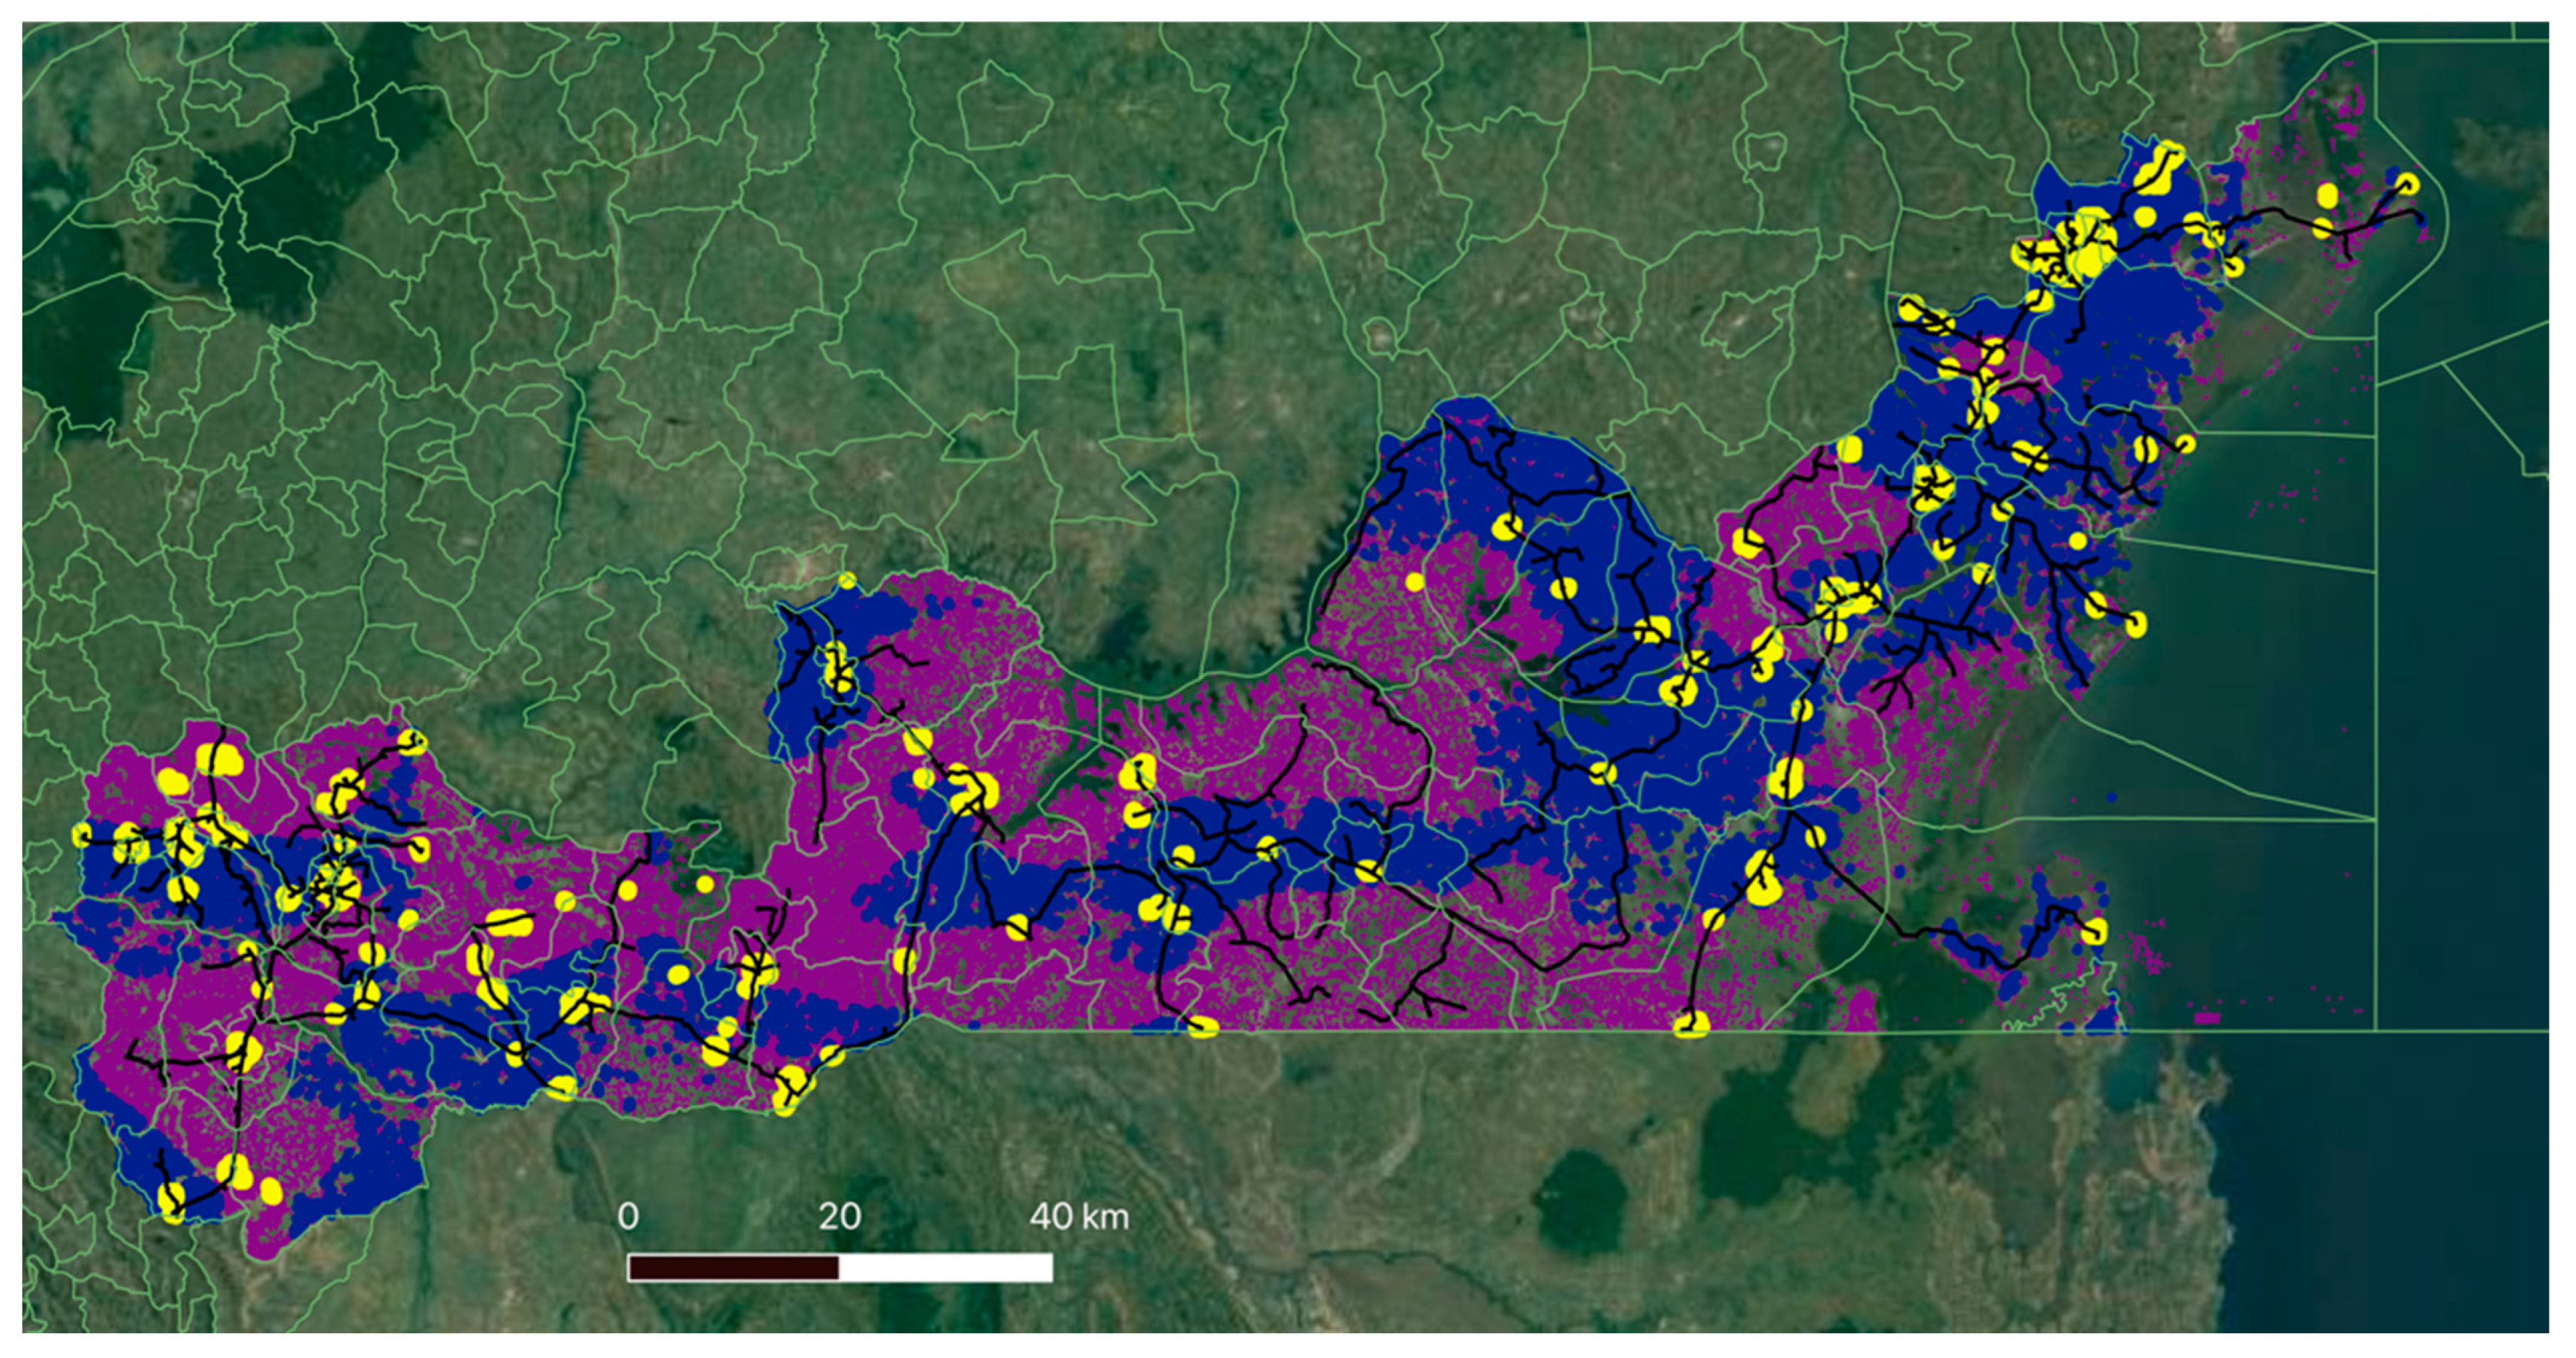
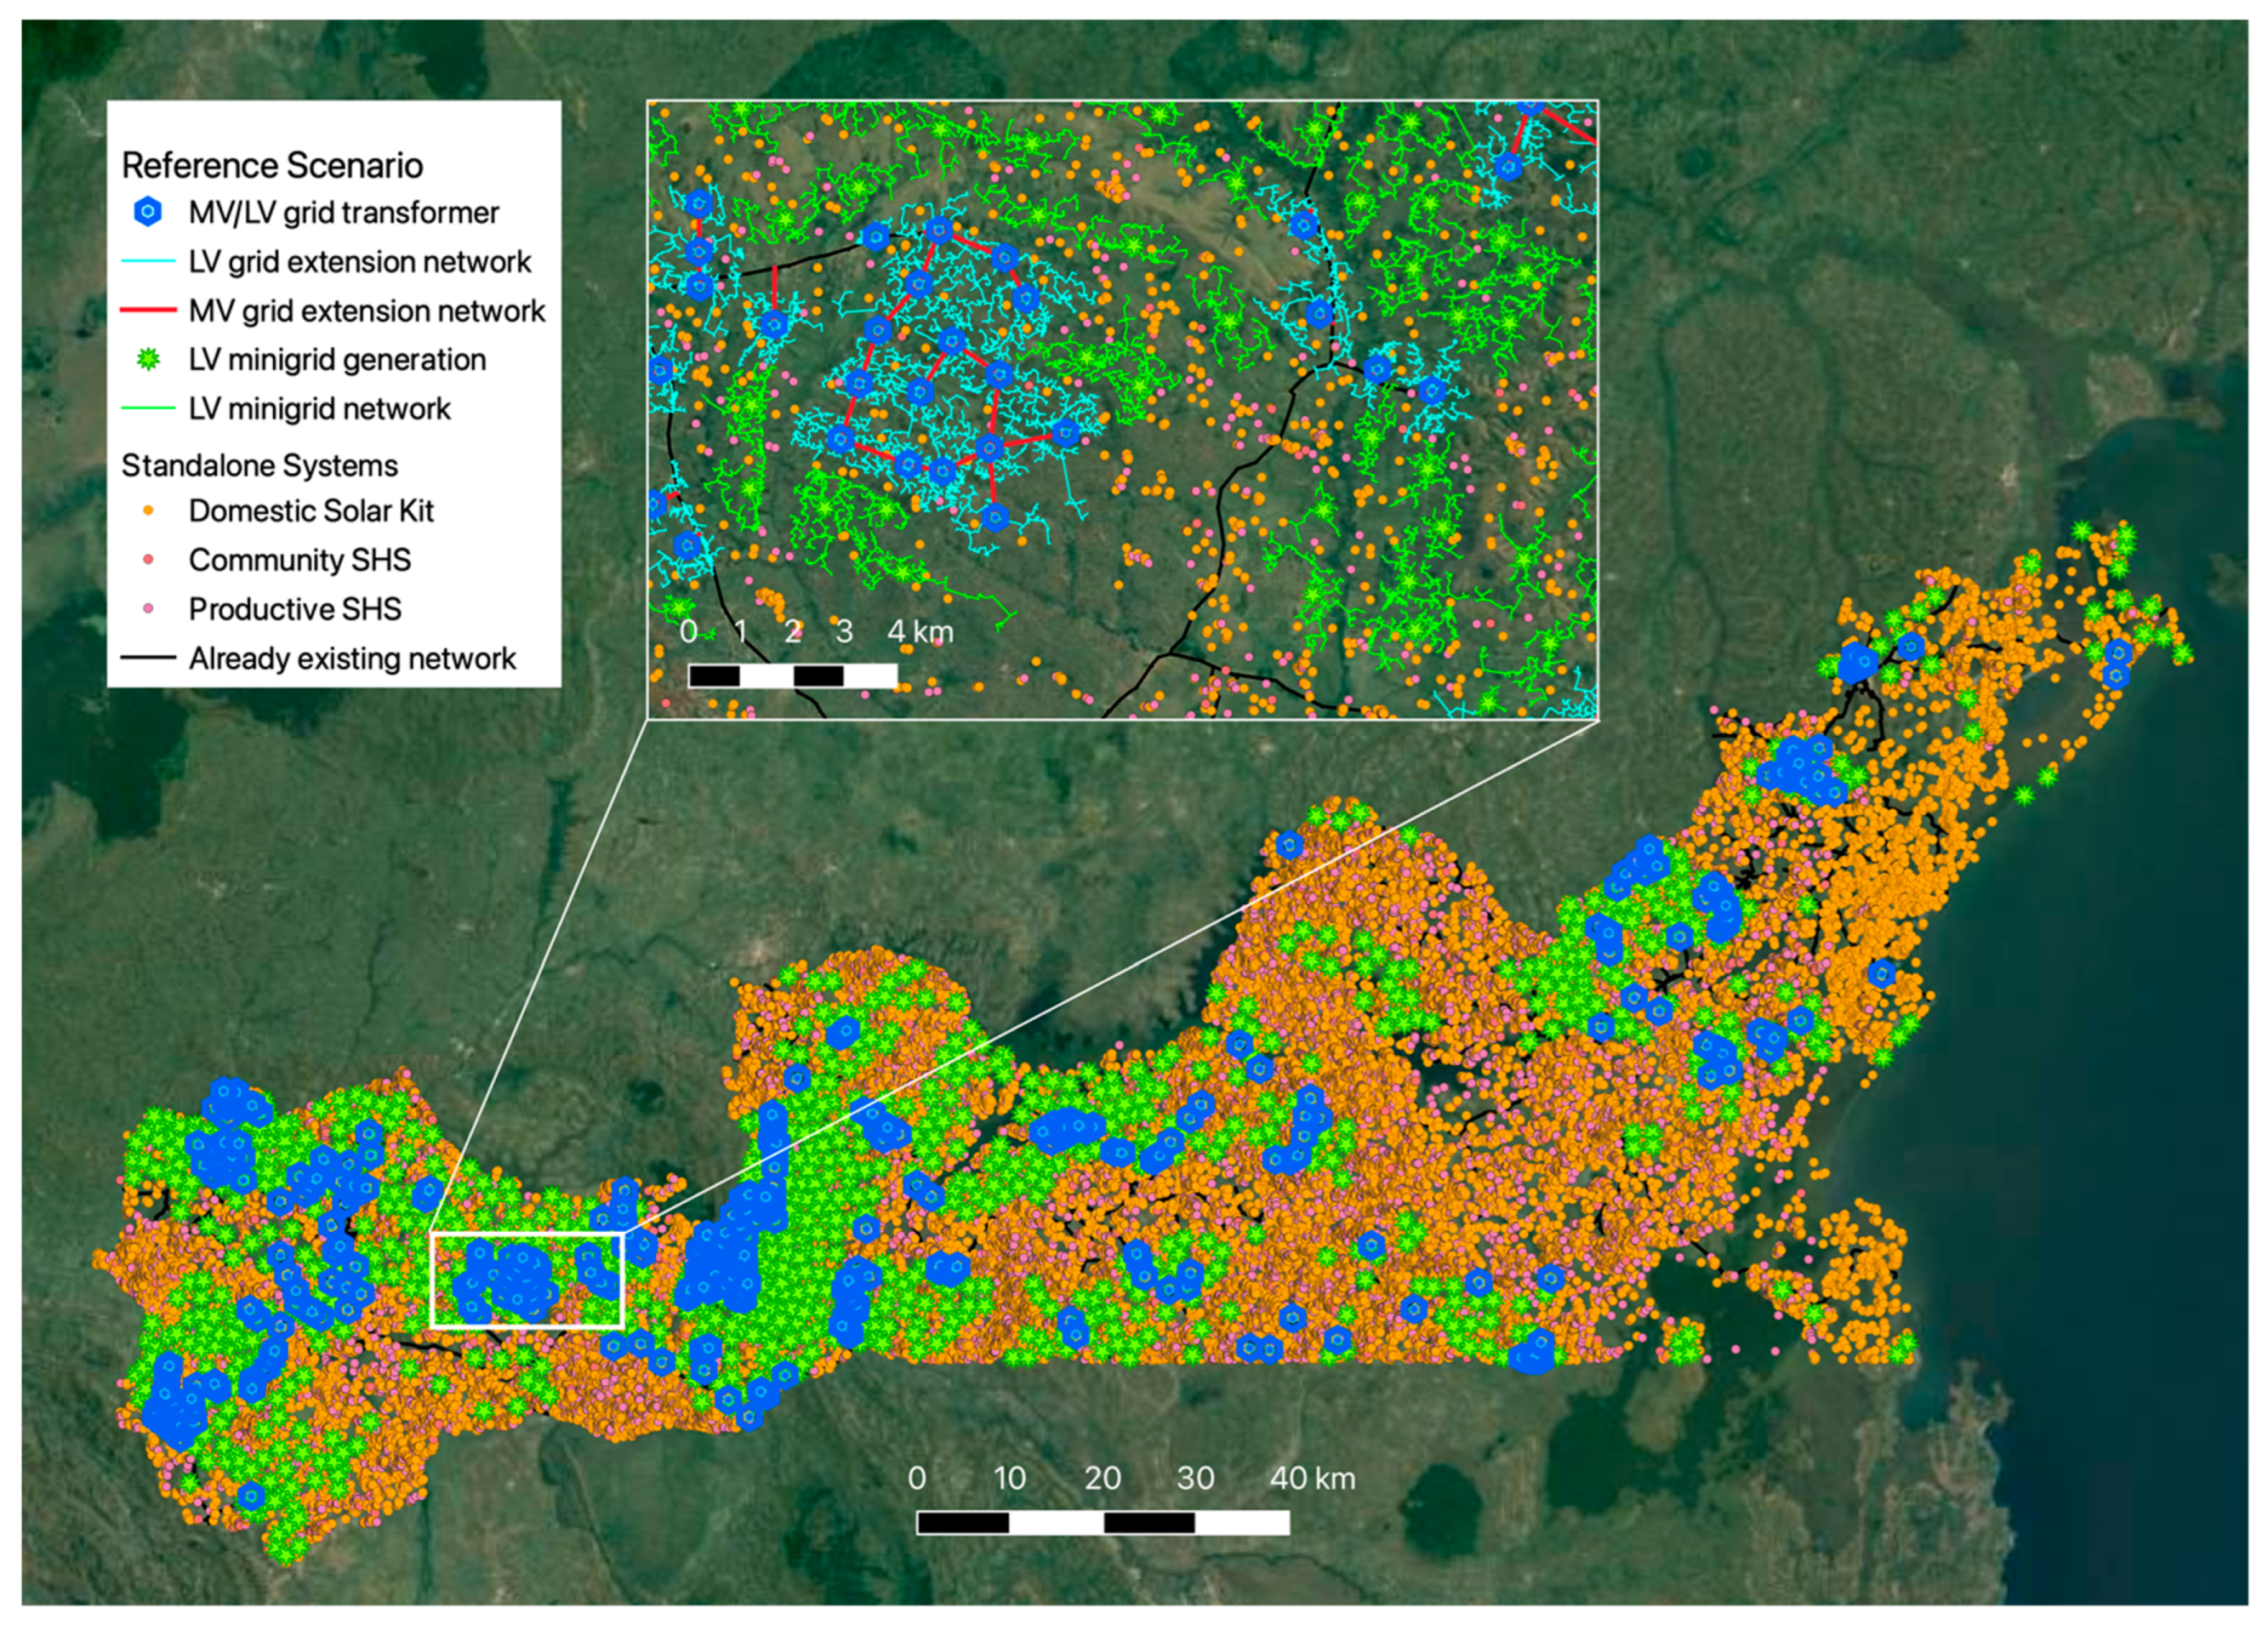
3. Least-Cost Integrated Electrification Plan for the Southern Service Territory: Reference Scenario

The Reference Scenario detailed in this section has been computed for the non-electrified buildings (498,480 loads) in the Southern Service Territory, considering the most probable situation in terms of demand, costs, and grid reliability described before. Figure 6 illustrates REM results for this Reference Scenario, showing the areas (green) where minigrids would be the least-cost option until 2030, as compared to grid extension (blue) and standalone systems (orange, red and pink).

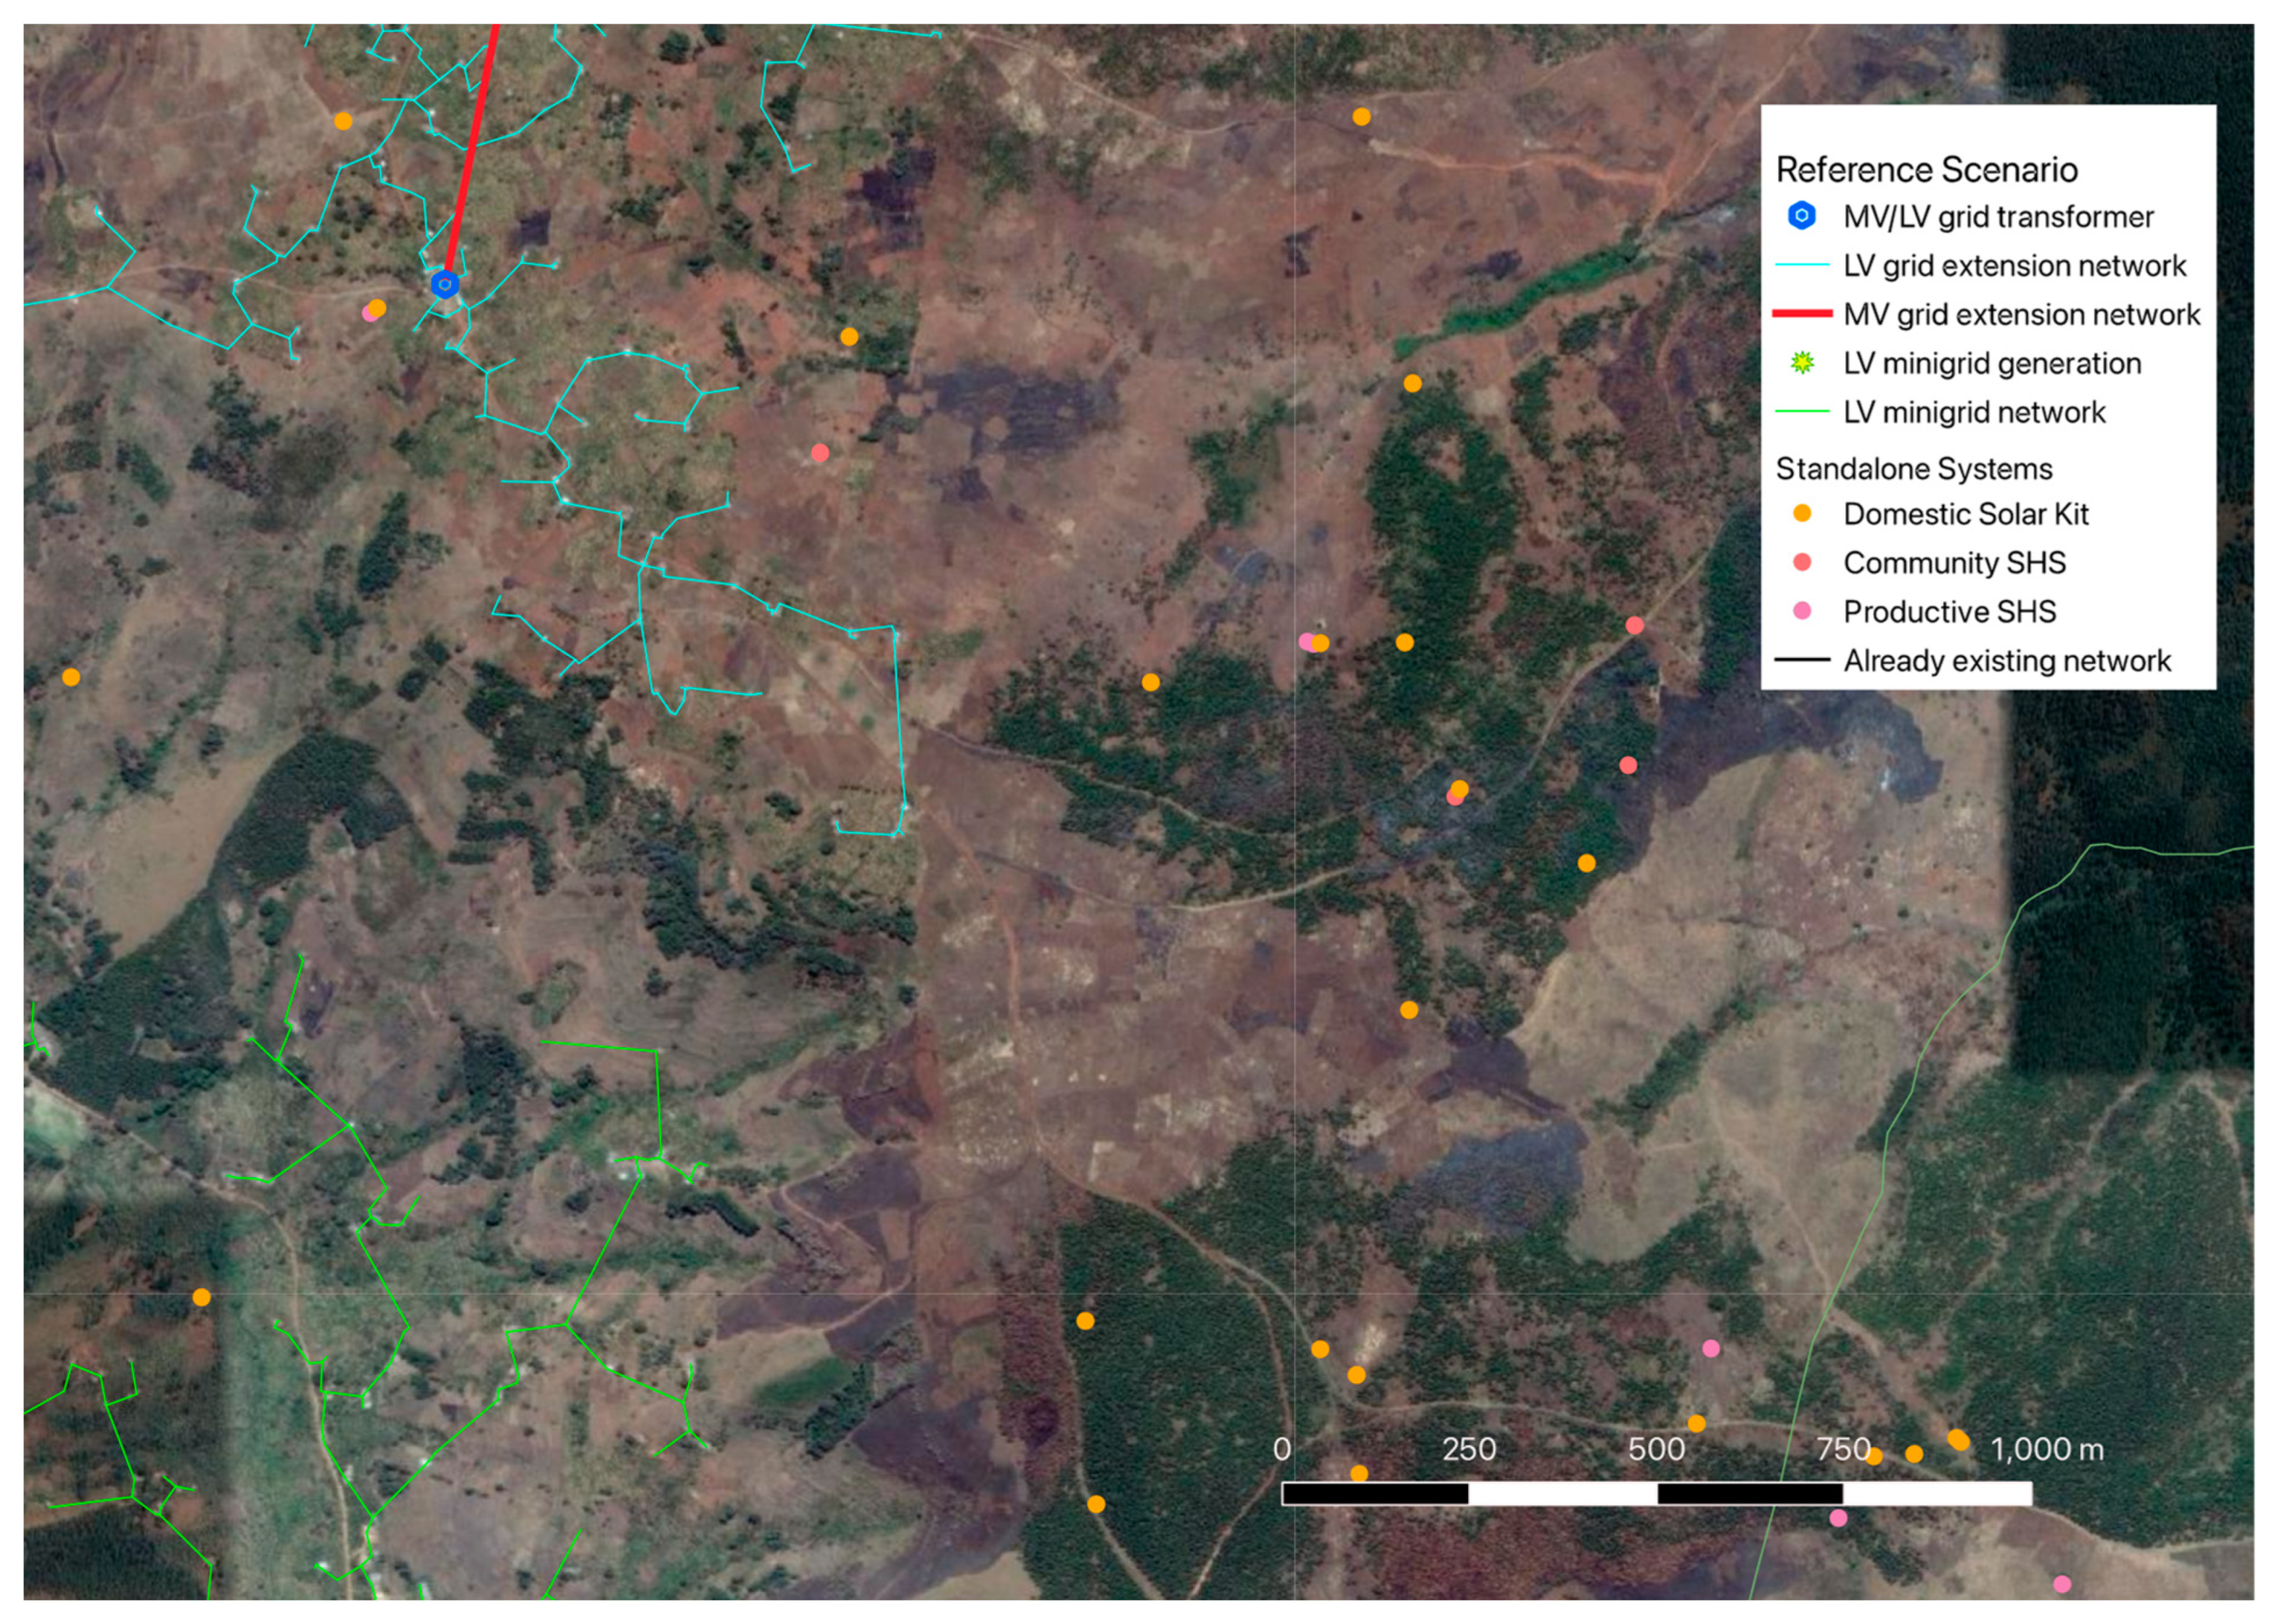
3.1. Description of the Reference Scenario

The least-cost balance for this Reference Scenario ponders the cost of service of grid extension vs. the alternative cost of minigrids and, where appropriate, solar kits or standalone systems. REM calculates the cost of service for any given alternative (evaluated as an annuity in USD/year) considering the following summary data and assumptions (validated by the MEMD):
  • Grid Extension:
    Cost of energy purchased from the grid is USD 0.072/kWh.
    Central reliability: 90%.
    Cost of network investment, operation, preventive, and corrective maintenance, according to the catalog and standards specified by the MEMD.
    Other supply costs: Connection, protections, and meters.
    Administrative costs: billing, fee collection overhead costs incurred by the distribution company: USD 9/year.
    Discount rate: 10%.
  • Minigrids:
    Cost of distributed generation: PV panels, gen-set, electronics, installation, fuel, operation, and maintenance.
    Cost of minigrid network, also including investment, operation, preventive, and corrective maintenance.
    Other supply costs: connections, protections, meters, billing, and others);
    Administrative costs: Medium size minigrid (250 customers): USD 16/year; large size minigrid asymptote at USD 9/year.
    Minimum size allowed: 50 customers.
    Discount rate: 10%.
  • Stand-Alone Systems:
    Cost of purchase of DC Solar Kits, USD 290/solar kit, for loads under 150 Wp. 90 Wp PV, 44 Ah—11.1 V battery.
    Lifetime: 7 years.
    Administrative cost: USD 12/year.
    Discount rate: 15%.
  • Other parameters:
    Social cost of non-served energy. USD 0.75/kWh for critical demand not satisfied and solar kits. USD 0.30/kWh for non-critical demand.
    Algorithm: Grid extension decision taken at customer (building) level, exhaustive configuration, meaning all alternative electrification modes considered for every cluster or buildings inside a cluster.

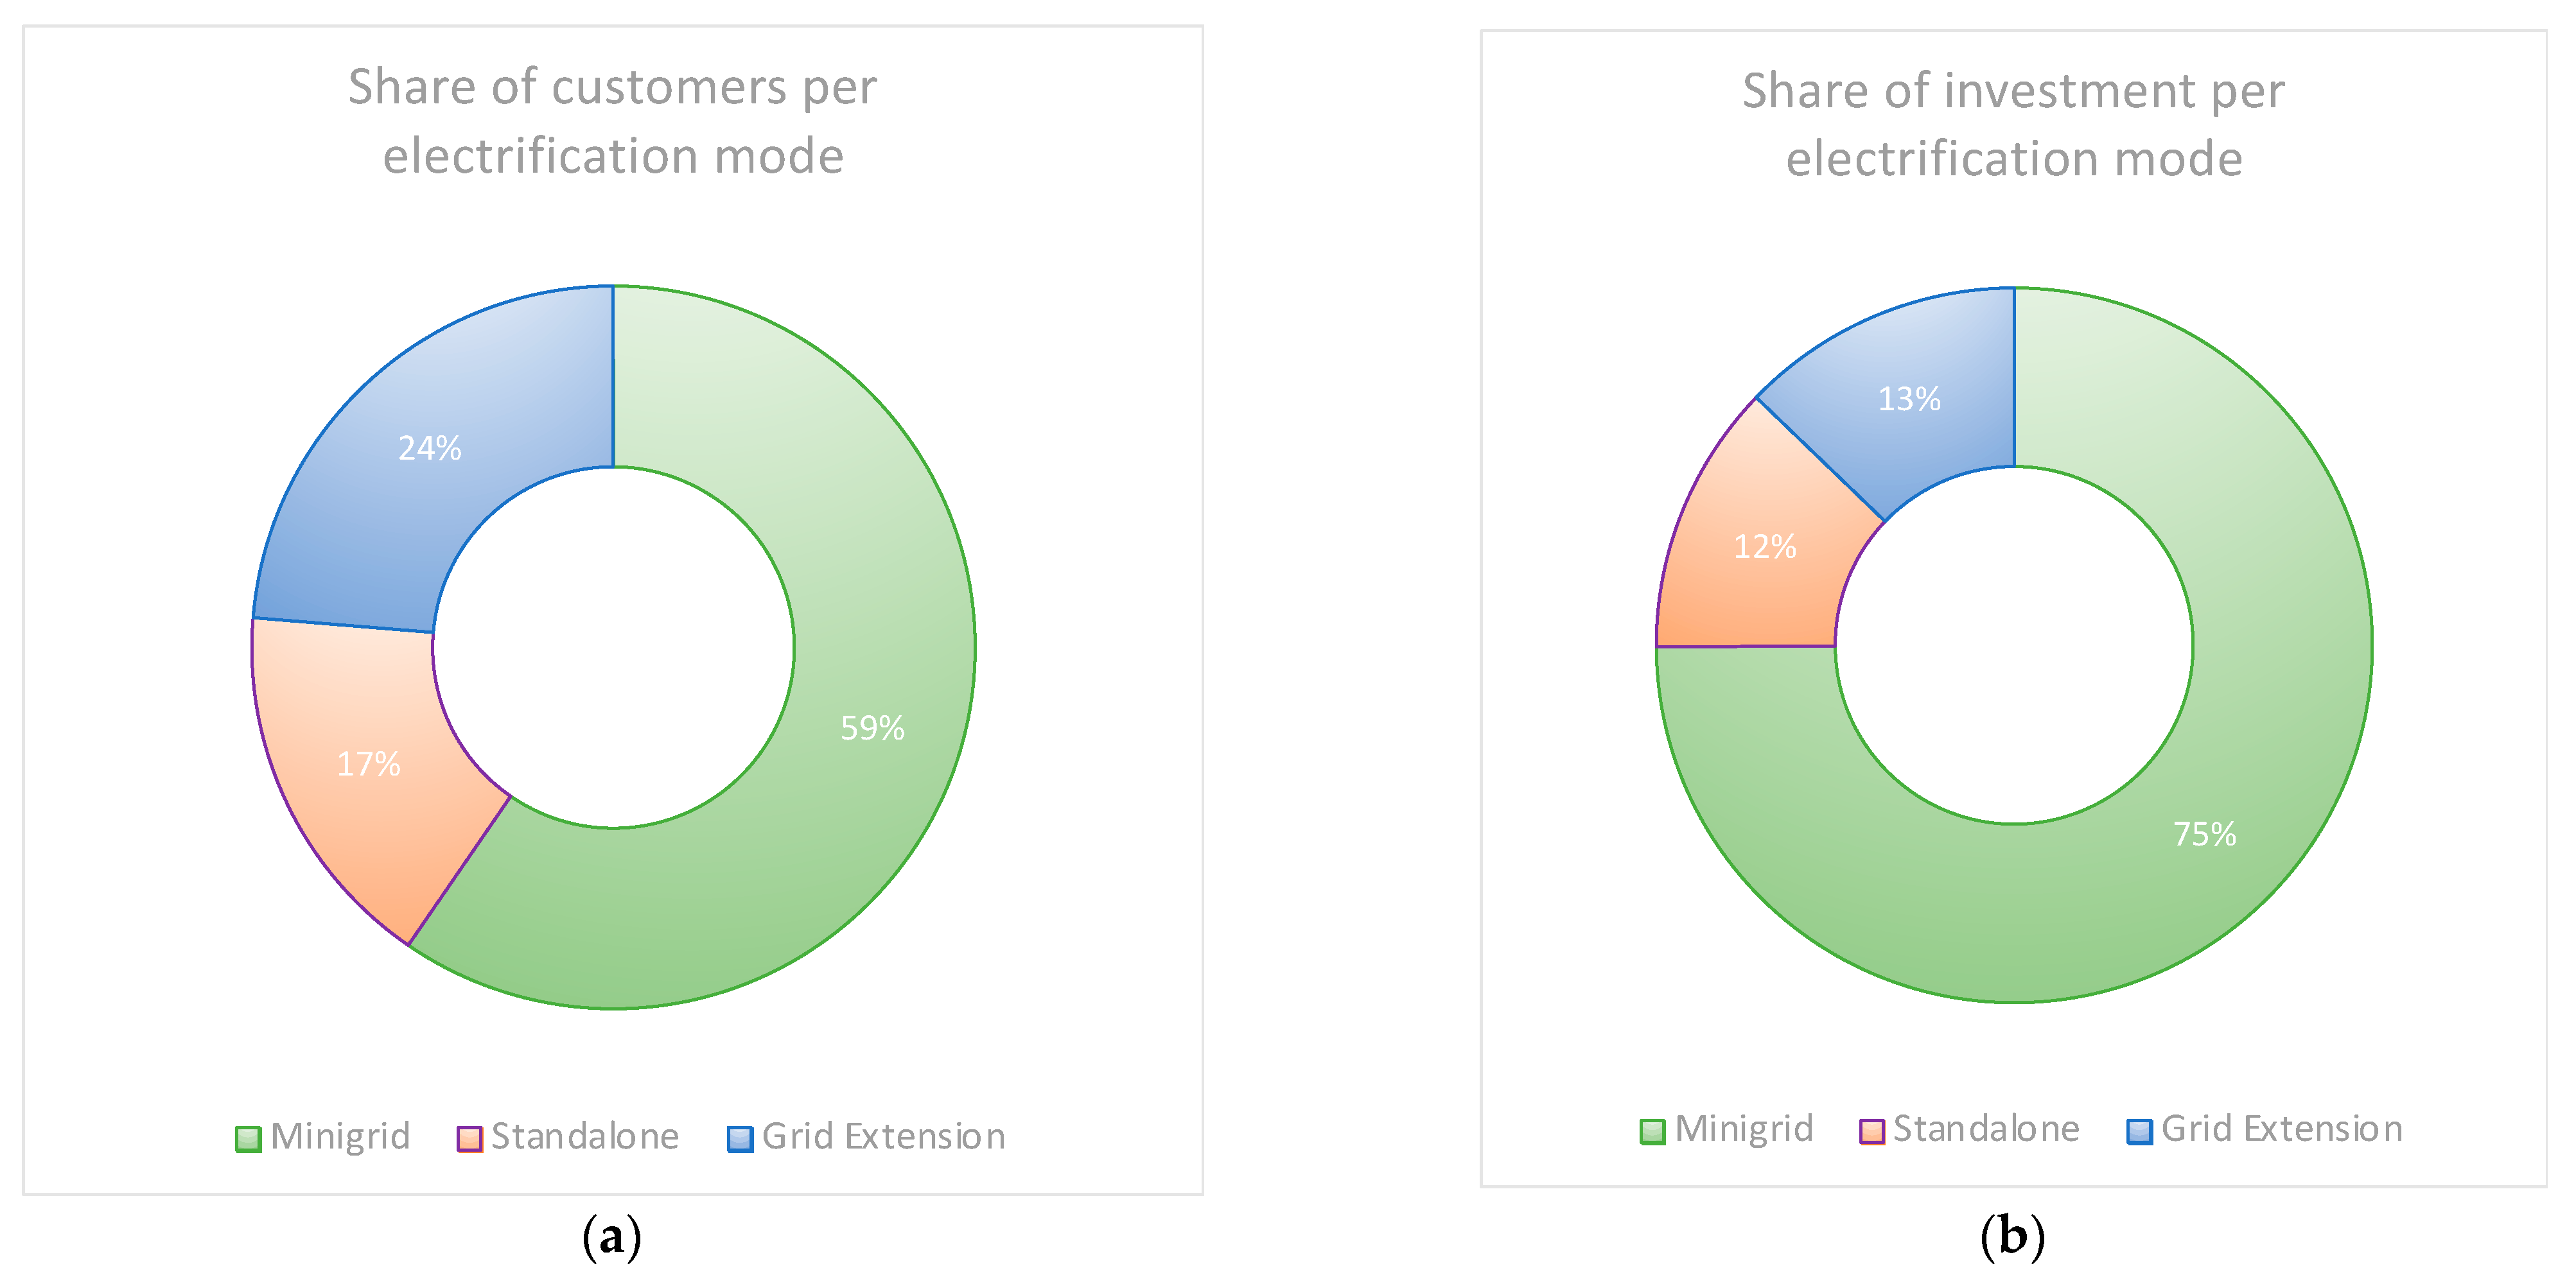
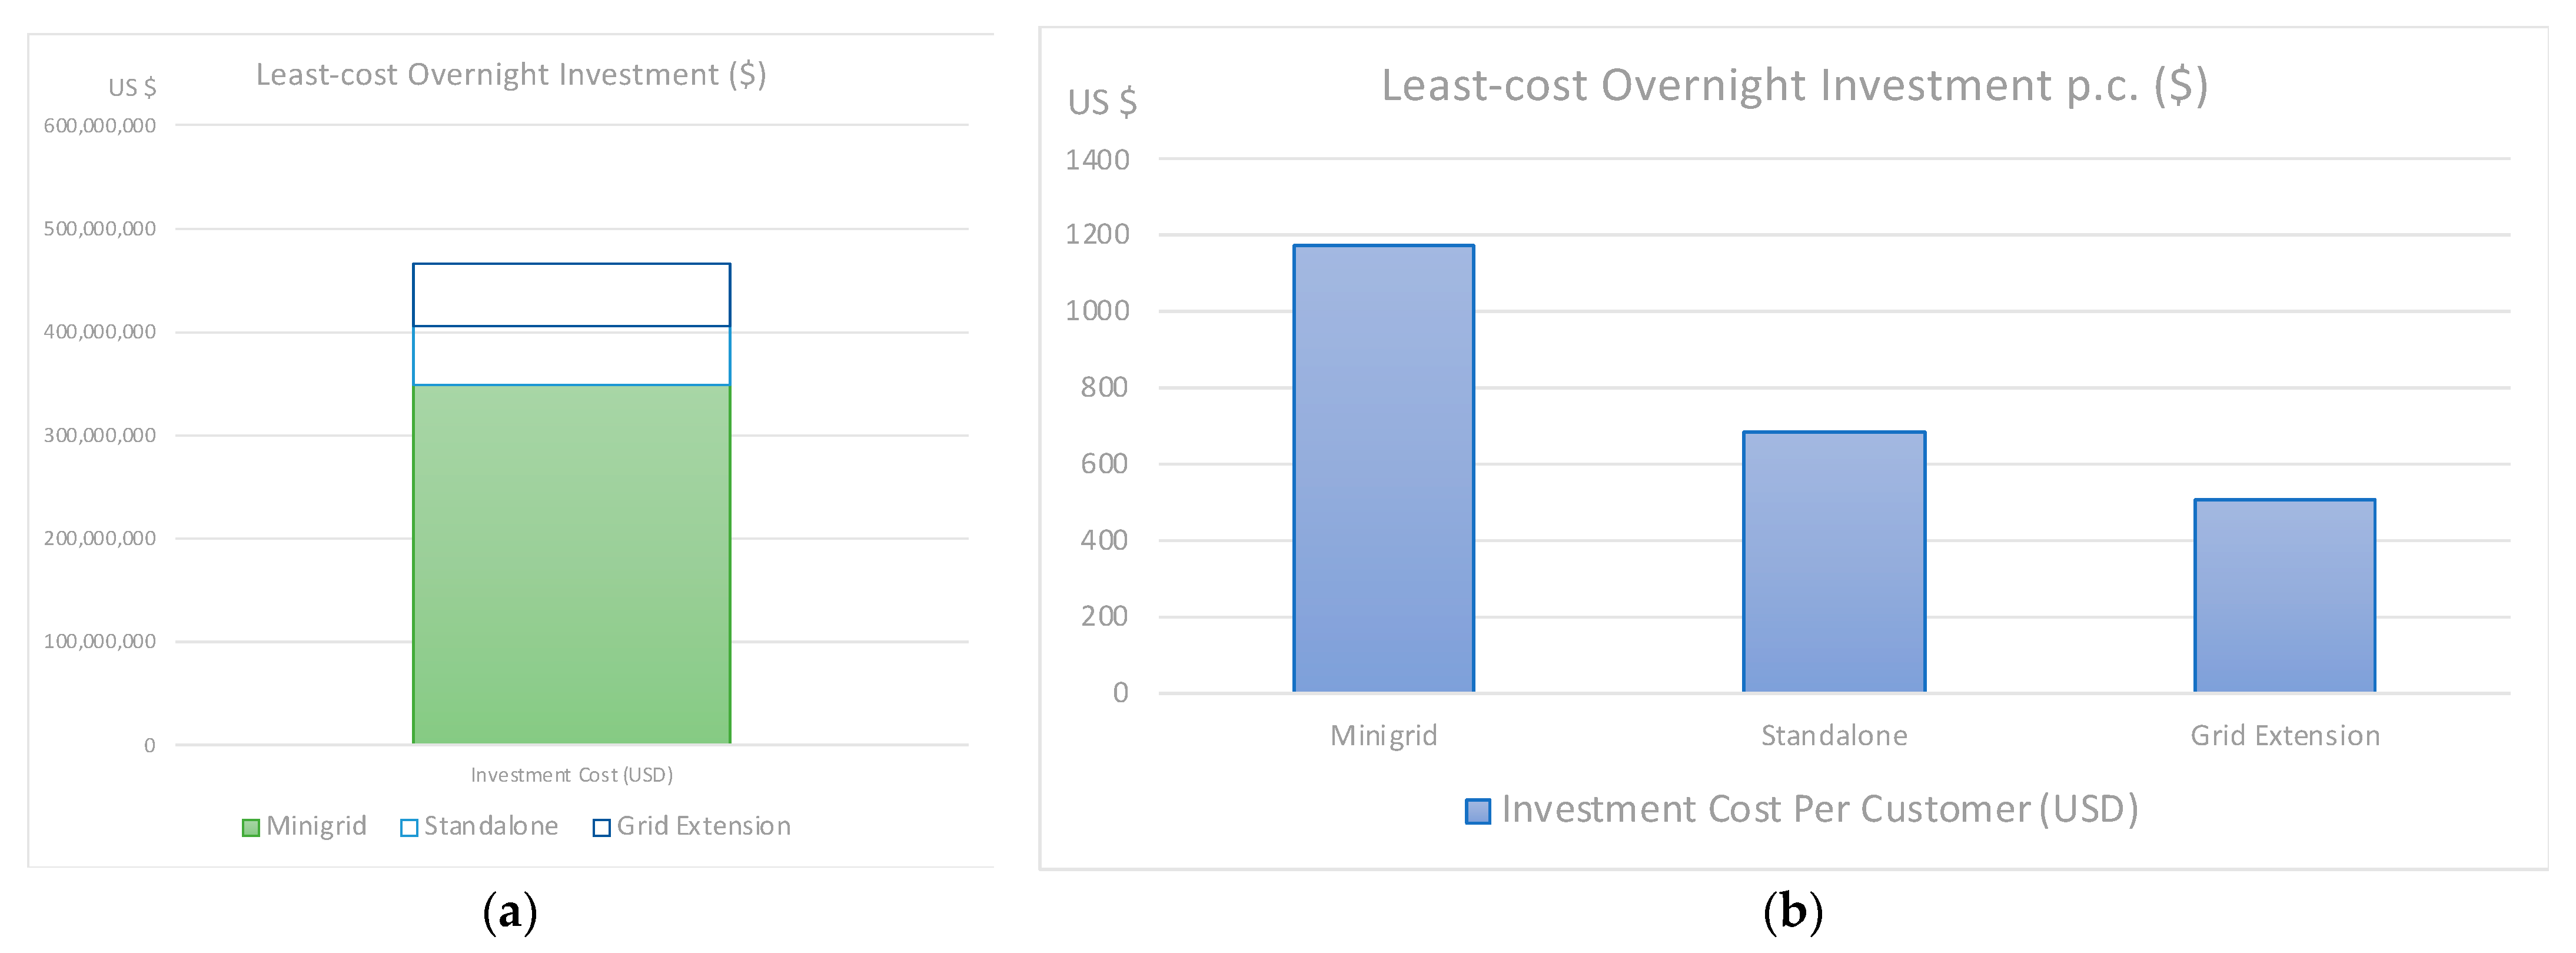
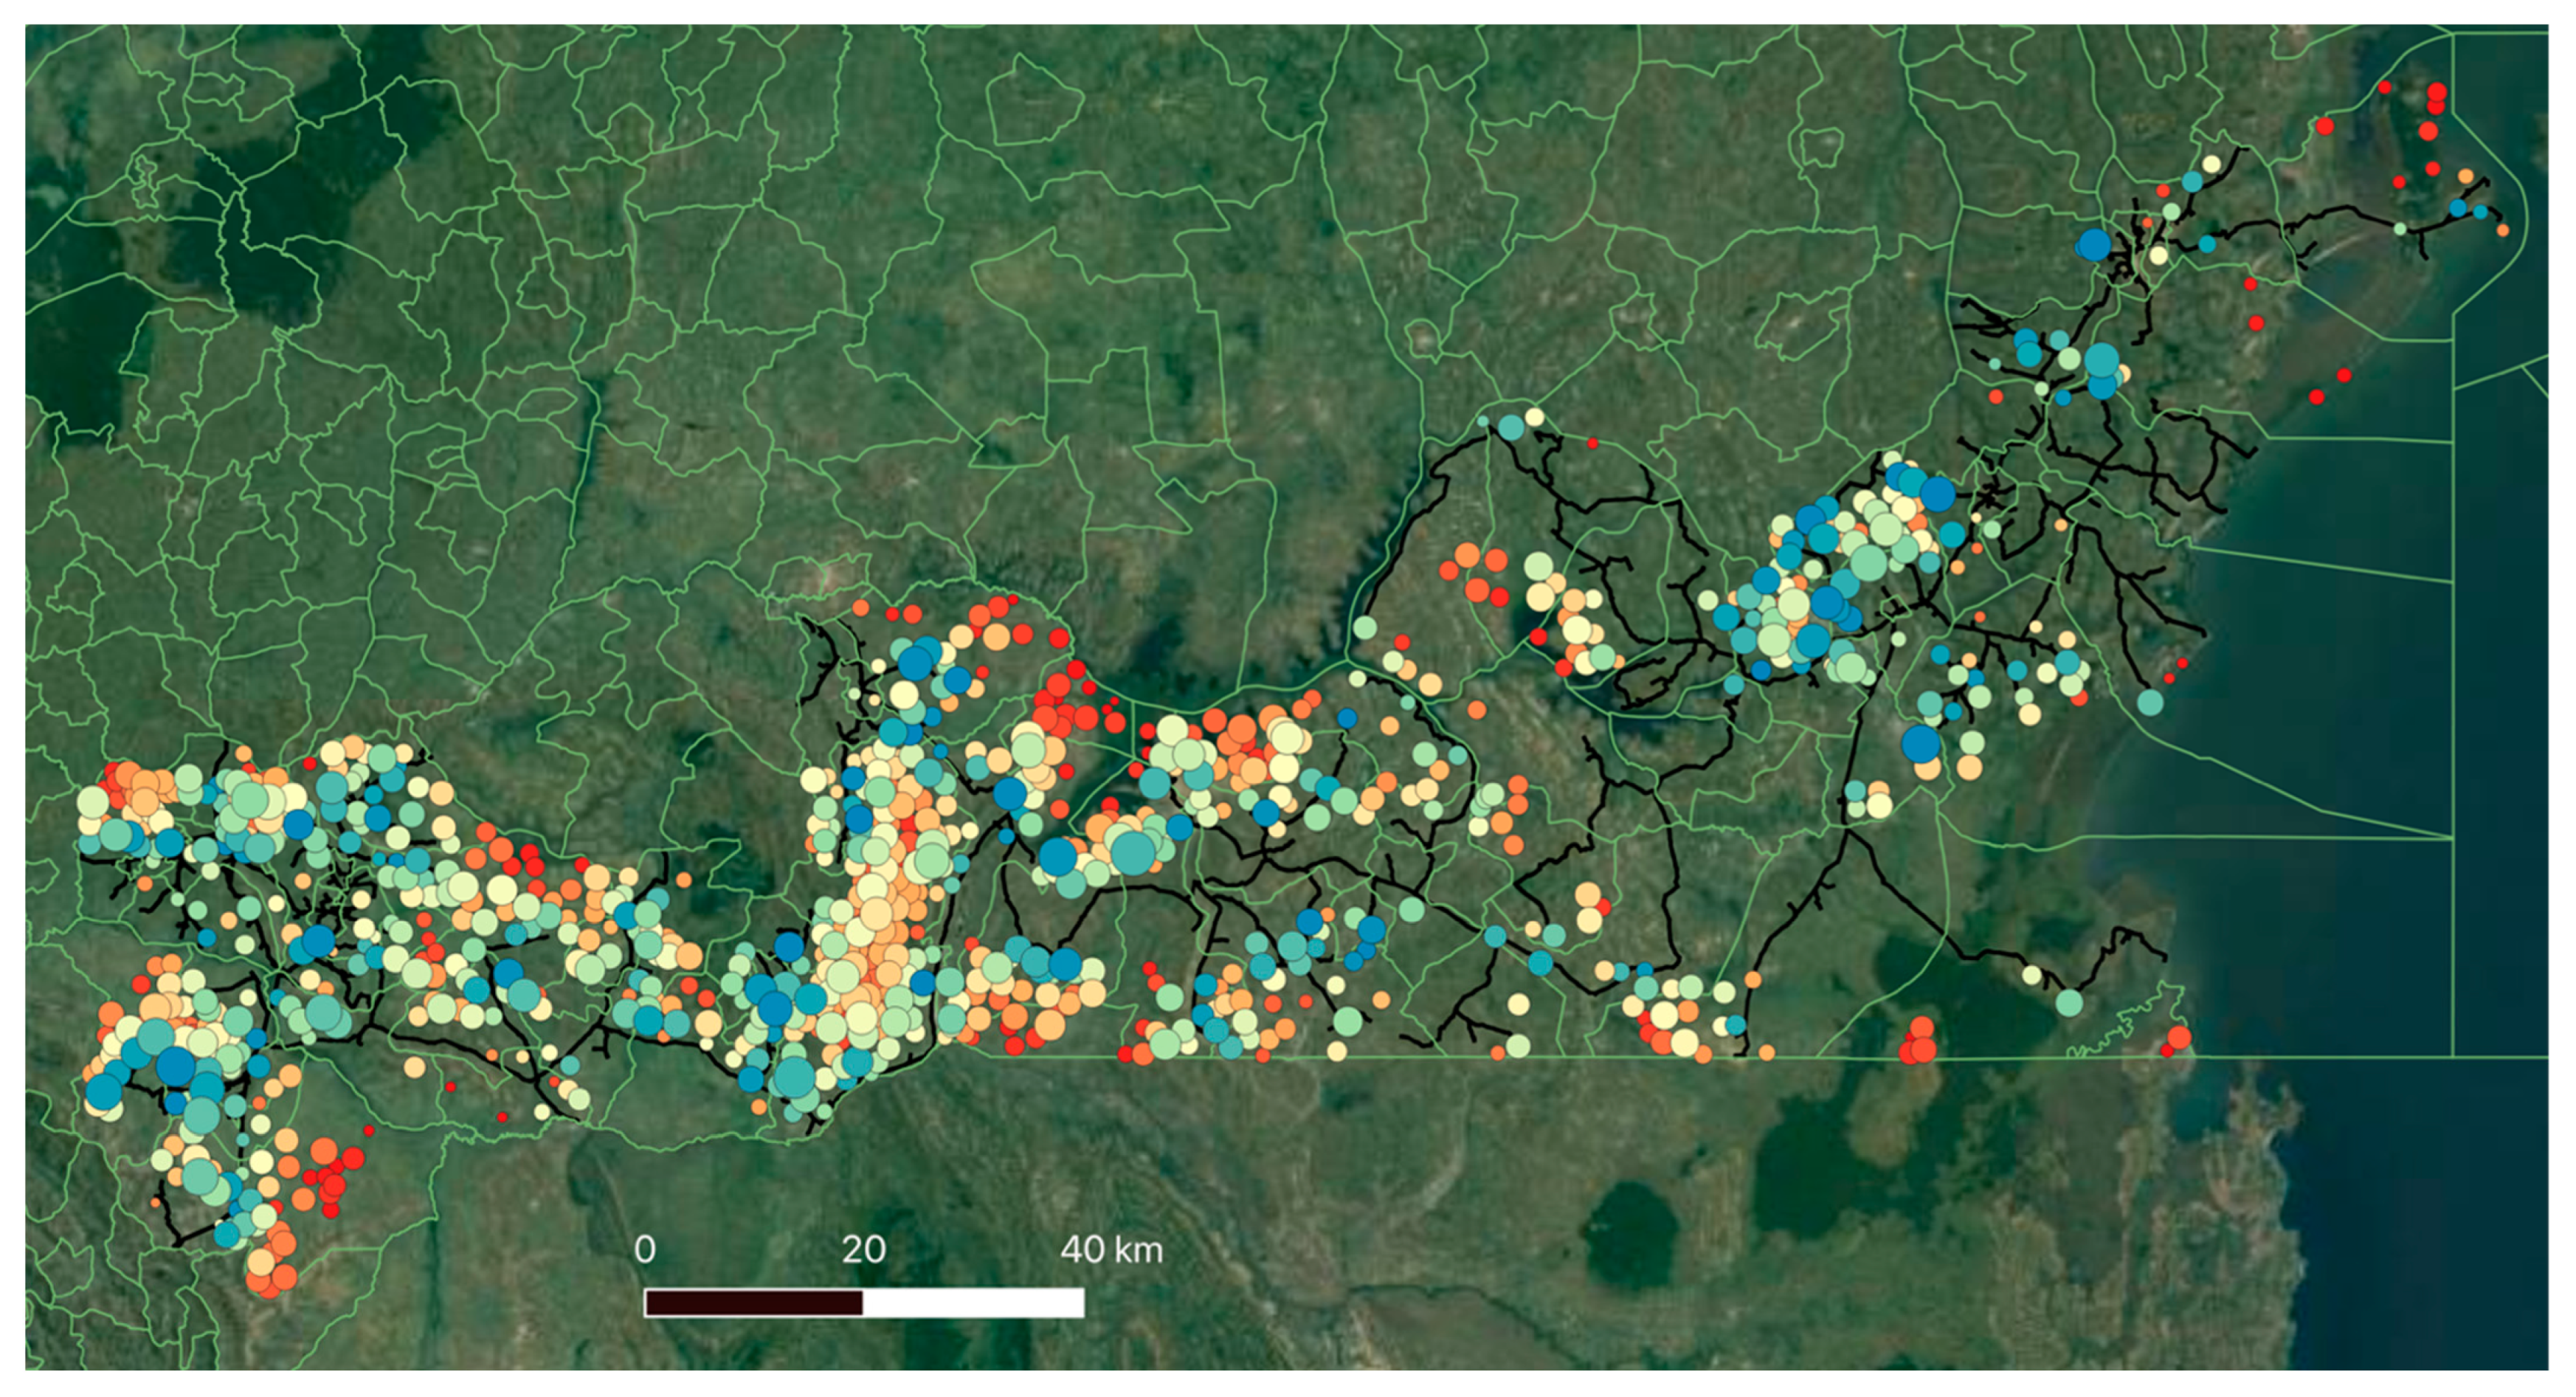
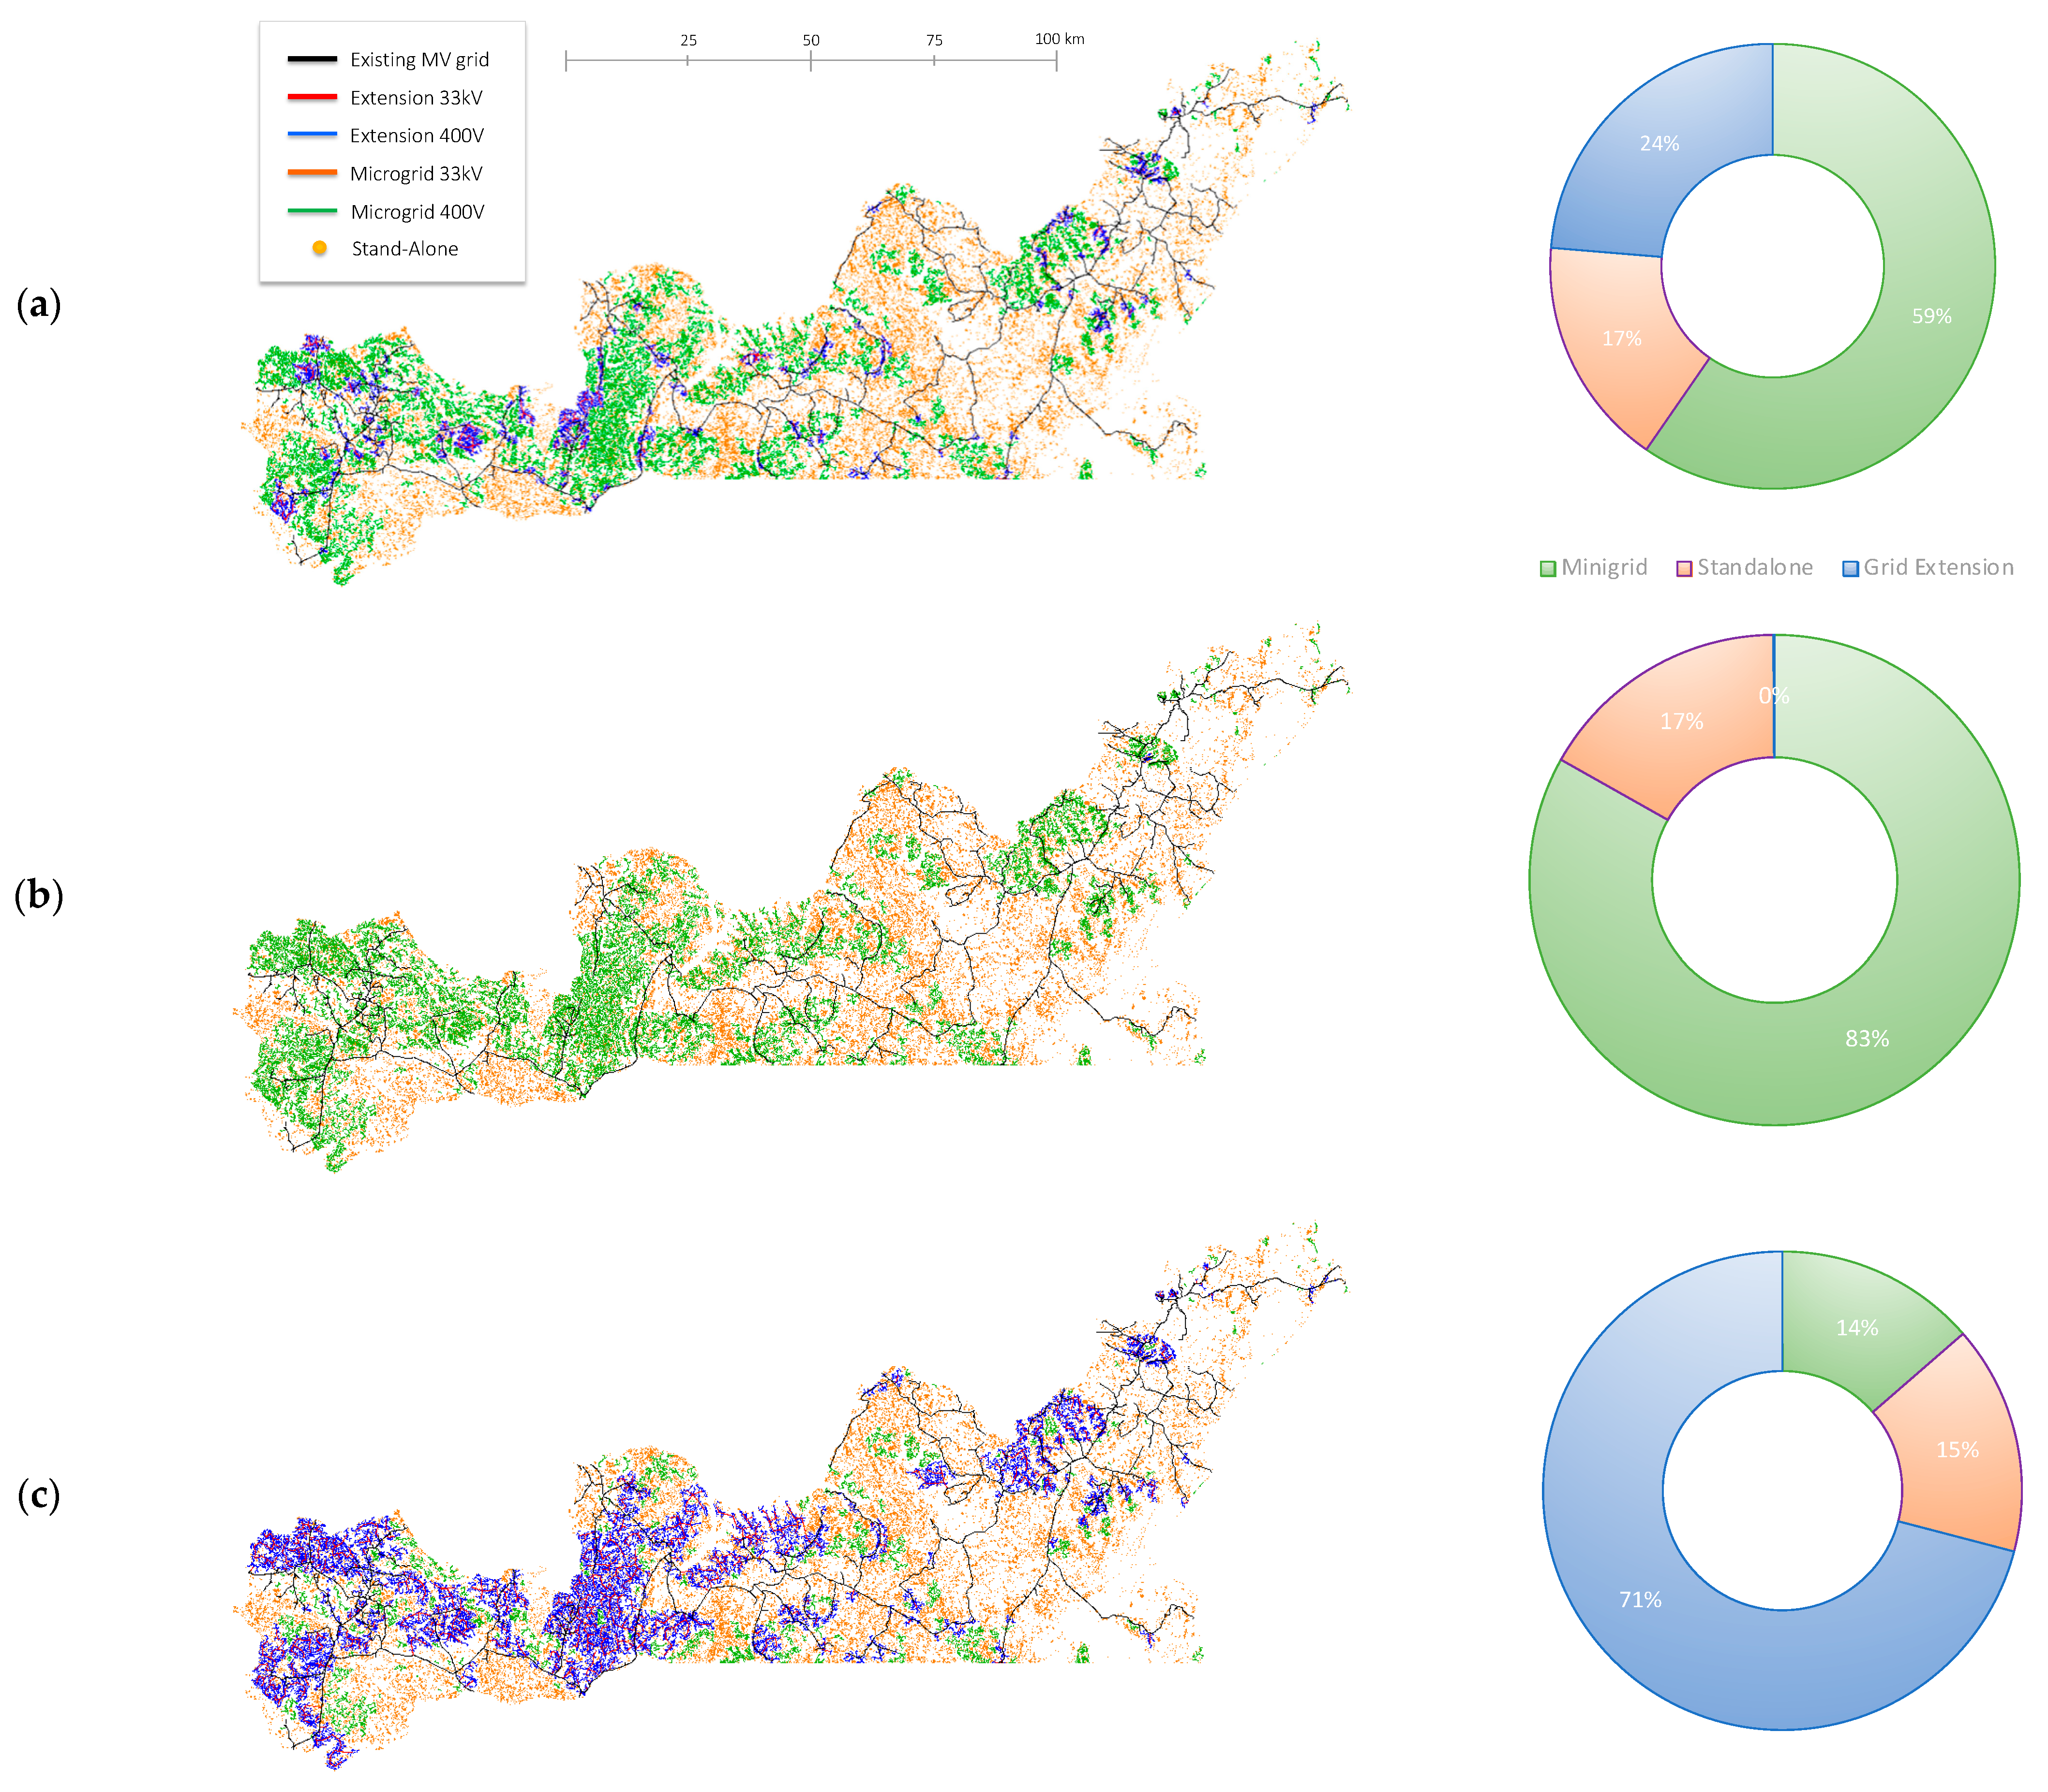
3.2. Reference Scenario Results

The Southern Service Territory is a region with a high population density. The prevalent solution can be expected to be connected either to the central grid (grid extension) or to an isolated minigrid, as can be seen in Figure 7 (The computing time required by REM to model the Reference Scenario was 171 min, using Windows-MATLAB 2020 with 10 parallel processing in a Dell Blade M640 server with Intel Xeon Silver 4116 with 12 cores and 128 Gb RAM. Future work to improve computing time for large-scale scenarios includes optimization of the code to enhance parallel processing and data transfer, and the possibility of cloud computing [74]).
Minigrids represent 59.6% of the customers, exposing that when the central grid is not very reliable (90%), the solution will favor an alternative (minigrid) with a higher quality of service (98.7% in minigrids), with an investment per customer of 1174 USD, and a total overnight investment of USD 349 million. Grid extension is the second preferred electrification mode, with 23.7% of the customer base, an average investment of 505.3 USD per customer, and a total of almost USD 60 million. Finally, customers located too far from each other and village centers represent 16.7% of the population, with an average cost of 685 USD per customer and a total investment of USD 57 million. It is important to note that only residential customers with peak demand below 150 W are supplied in this scenario with a low-cost solar kit (when isolated) which supplies only 67% of their forecasted demand. REM designs a fully-fledged 24 × 7 solar home system for any isolated community or productive customer, with an average cost of USD 1642 and 1030/customer for community and productive loads, respectively.
Table 2 summarizes other central figures associated with each electrification mode, such as the cost of service per unit of energy (USD 0.47/kWh in minigrids, USD 0.41/kWh for grid extension and USD 0.51/kWh for standalone systems). It is clear that, though they are different, they fall around the same magnitude. Another significant result is the added cost of non-served energy. It is negligible for minigrids in this scenario but very relevant both in grid extension (USD 23.46/year per customer, 17.5% of the cost-of-service annuity expressed in the TOTEX) and especially for standalone systems (USD 45.46/year per customer, 30% of TOTEX).
It is important to stress that REM computes the final least cost per customer, including fixed, variable, and social costs. Variable cost includes operation and maintenance (OPEX) of all the electrification modes and, for grid extension, the variable cost of purchasing upstream energy for new grid-connected customers. CNSE value shows the social cost of non-served energy according to the critical and non-critical demand filed to supply by grid extension, minigrids, and standalone systems. Figure 8 shows the aggregate per electrification mode of capital expenditures (CAPEX), operational expenditures (OPEX), upstream energy per customer, and CNSE of the different systems designed for the Reference Scenario. The figure shows how minigrid customers’ annual cost of supply (TOTEX) is, on average, close to the cost of grid-connected customers, 168 vs. 134 USD/customer, only 25% higher. If we include the social cost of non-served energy, these figures become even closer (USD 180.94 vs. 157.58/customer). Please note that even this higher cost is lower than extending the grid to those off-grid customers, as will be further detailed in the following sections.
If we focus on the overnight investment instead of analyzing the annuity of each electrification mode, the balance can be misleading. Figure 9b shows how, although their annuities are similar, as seen in Figure 8, minigrids require more than double the initial investment than grid extension. Minigrids require investing both in generation and network and have little OPEX. In contrast, grid connection has high variable costs (including the upstream purchases of the energy consumed). Figure 9a shows the share of investment effort per electrification mode for the Reference Scenario.

4. The Role of Minigrids in the Universal Access Least-Cost Reference Scenario

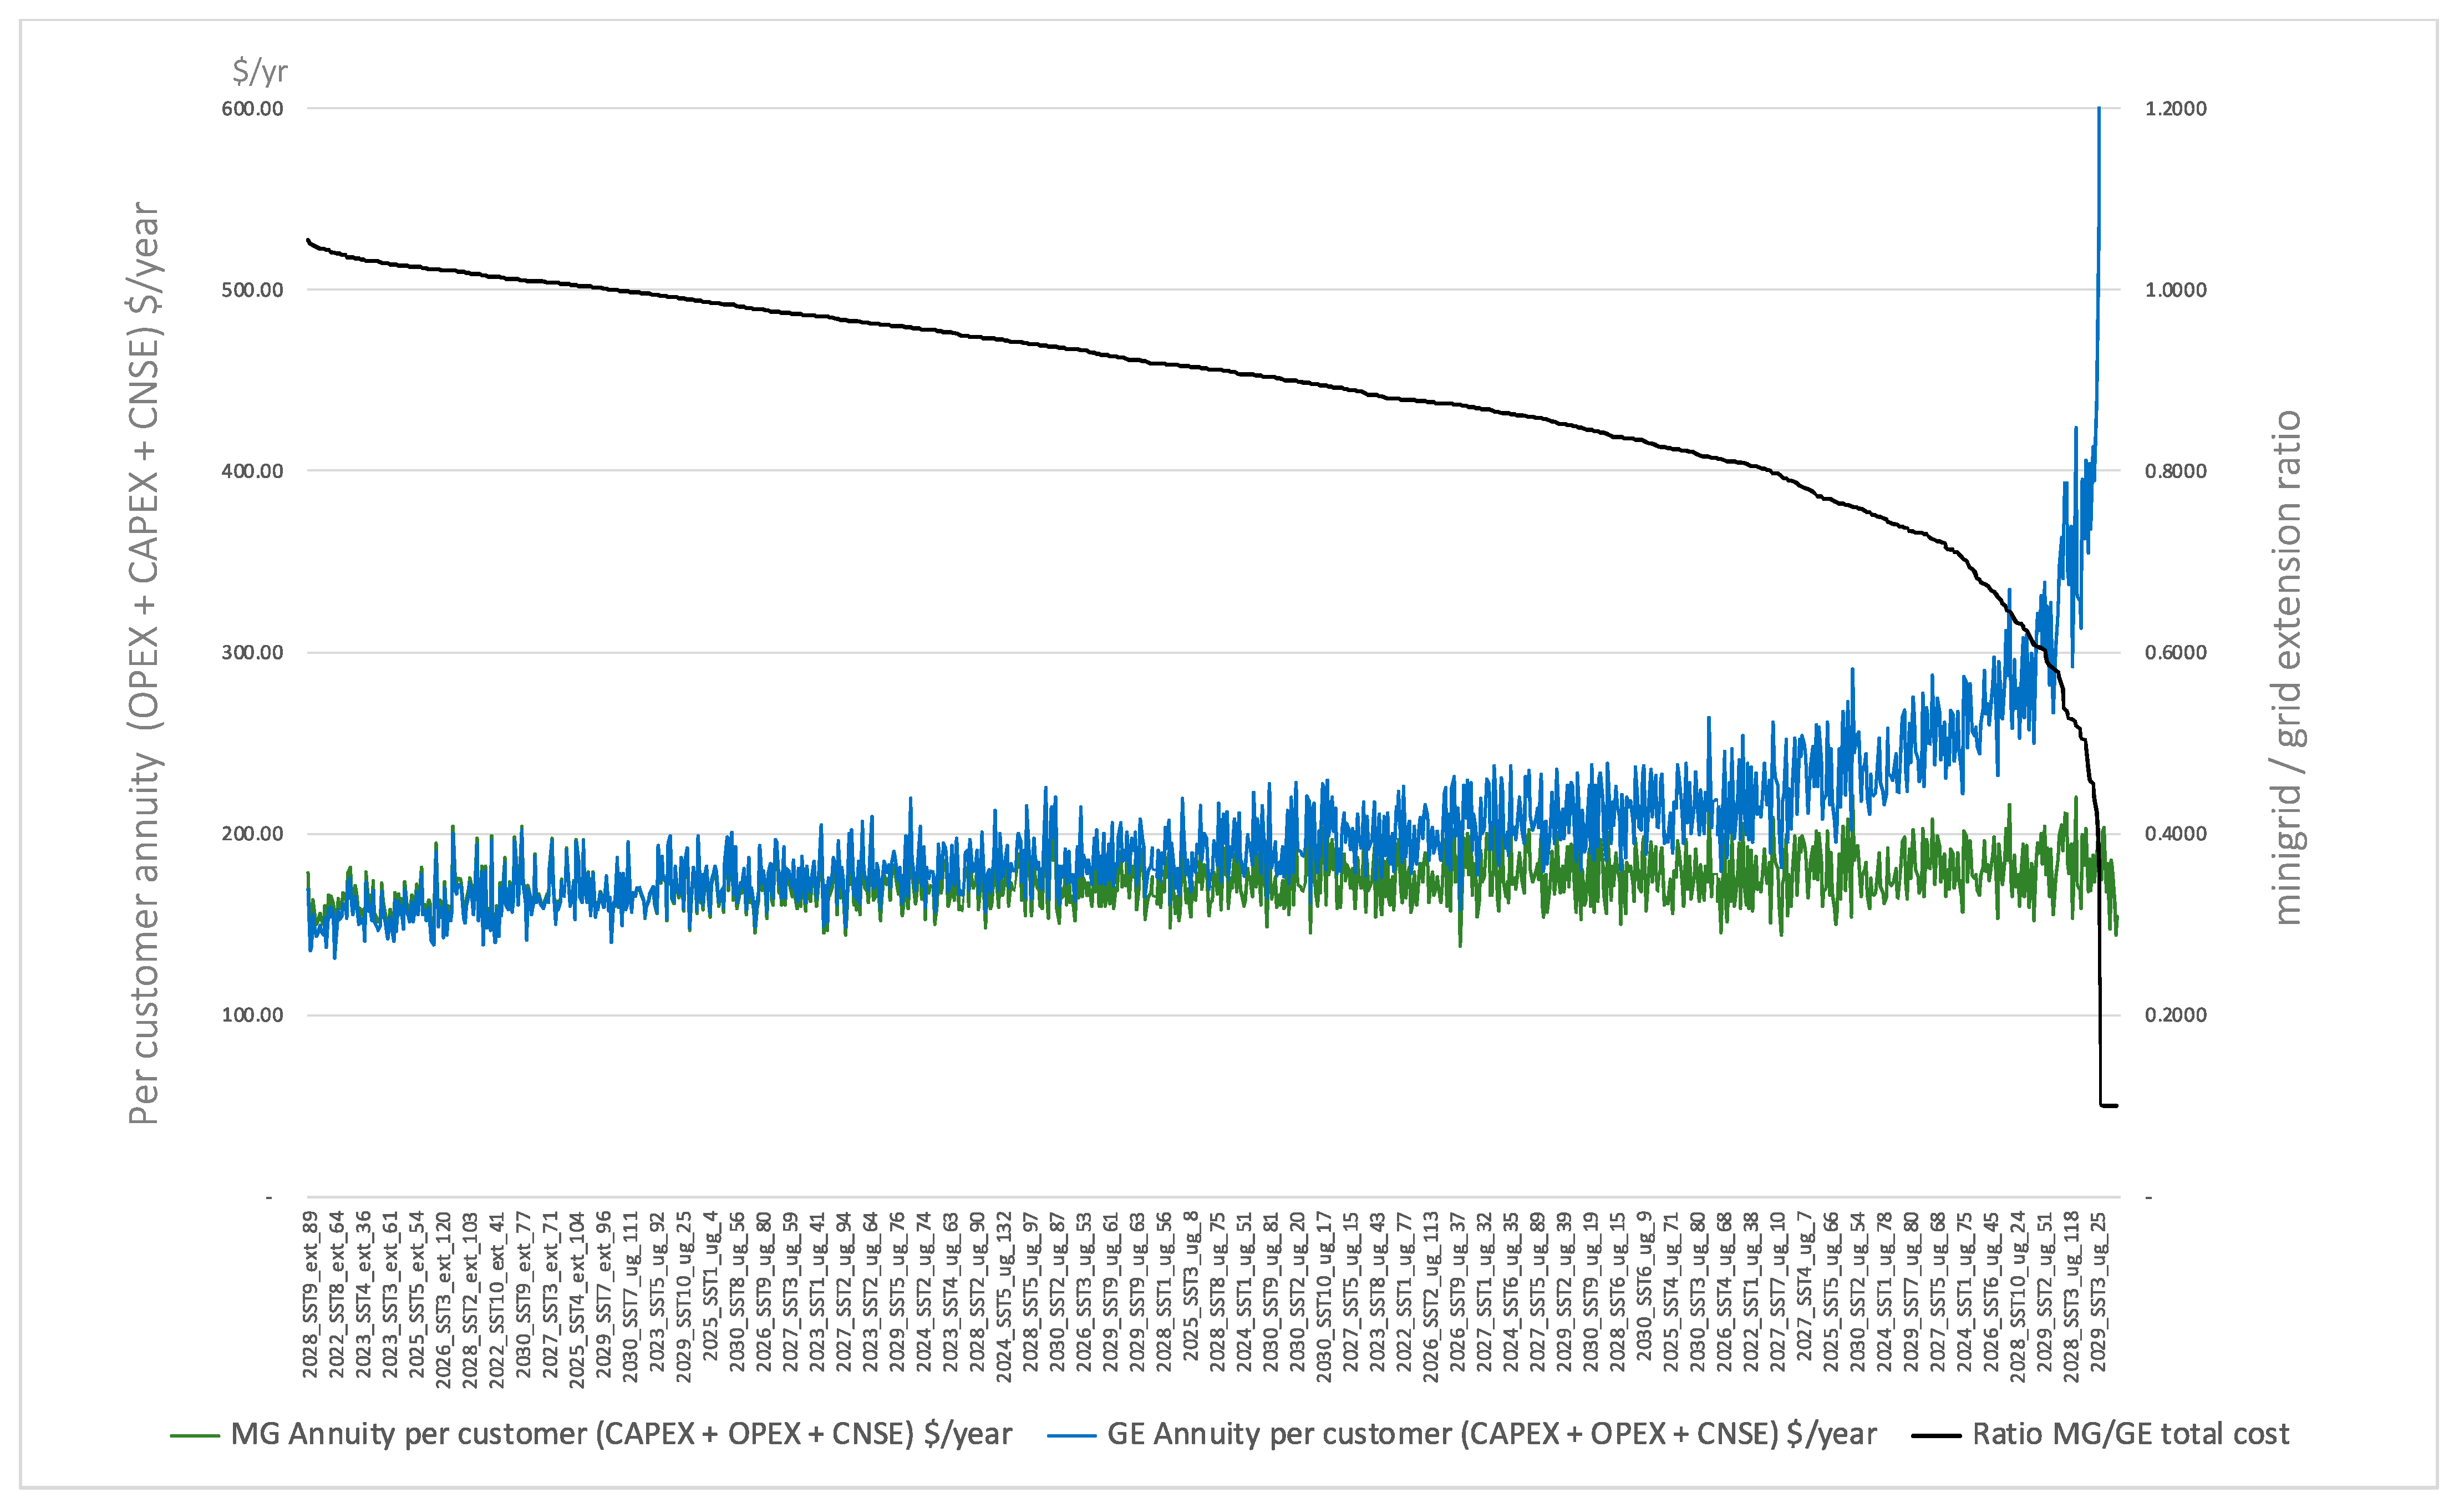
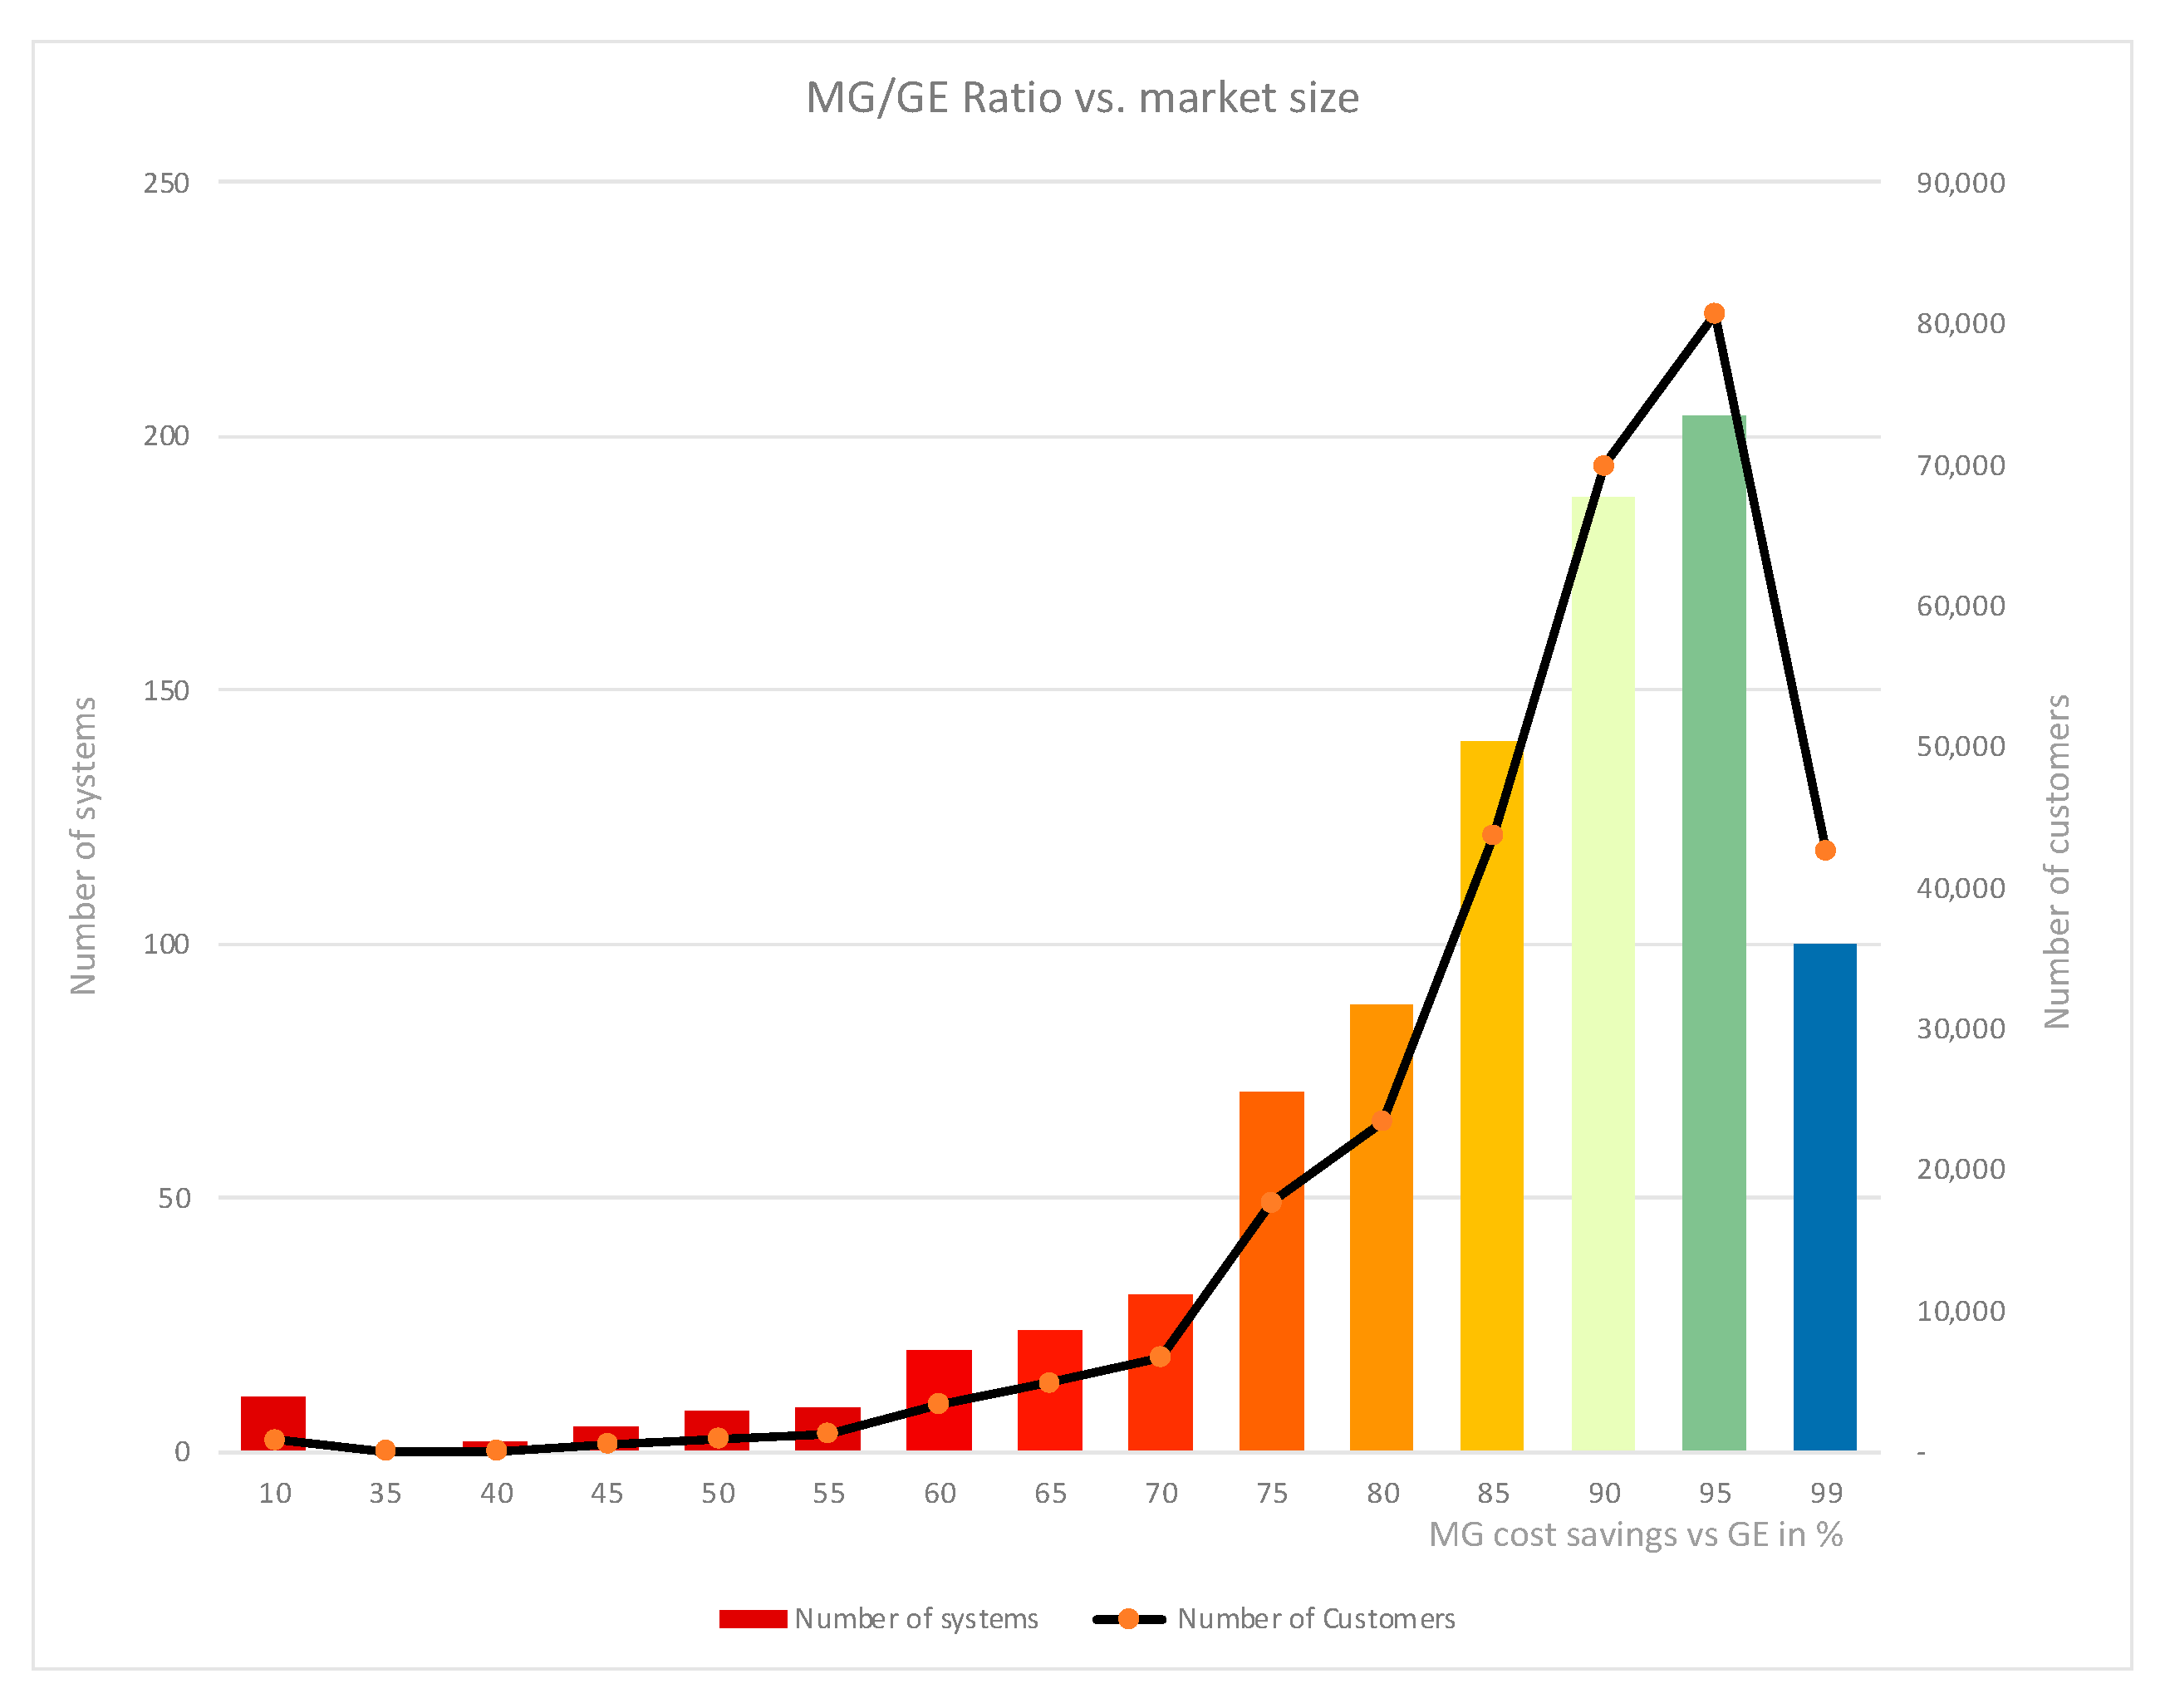
4.1. Determining the Minigrid/Grid-Extension Frontier

The cost of service (CAPEX + OPEX per customer and per energy unit) is not homogeneous for all the systems designed in the Reference Scenario. REM compares the different supply choices and finally decides which is the least-cost option for each customer or cluster of customers.
The total cost of service needs to consider both CAPEX and OPEX, the cost of upstream energy, and the cost of non-served energy. For grid extension, this average annuity of the cost of service is USD 157.58/year per customer. As shown in Figure 10, for all the clusters of customers considered by REM, this cost (blue line) ranges from USD 131.21 up to 535.44/year per customer, four times more, depending on their distance to the grid and the density of customers. As the grid extension cost grows higher, the cost of service of minigrids (green line) becomes more competitive. The average cost of service for minigrids is USD 170.94/year per customer, roughly 8% more than the equivalent cost of grid extensions for the area of study. It ranges from USD 136.49 to 220.99/year per customer. For the Reference Scenario, electrification with minigrids of all these customers (instead of extending the grid) results in a net decrease of the cost of service by 17%, USD 8.7 million/year. The ratio between grid extension (GE) and minigrid (MG) annuity is also shown (black), clarifying the frontier where minigrids become a least-cost option (where the ratio is lower than 1).
As explained above, REM calculates for each minigrid the alternative grid extension design. When the cost difference between options is too significant (when grid extension is more than five times costlier than the equivalent minigrid), REM stops computing the grid extension design. This feature is configurable and has the sole purpose of saving computer power.
Figure 11 shows the location of all the resulting minigrids. The color code follows the MG/GE ratio: Red dots are those minigrids where the cost of service is from twice (50% cheaper) to more than five times (80%) cheaper than the one of the corresponding grid extensions. Orange minigrids range between 1.25 (20% cheaper) and 2 (50% cheaper). Yellows are for MG, where the savings are between 10 and 20%. Green minigrid savings would be from 5 to 10%, while Blue is for those minigrids where the cost of service is between 95% and 99.97% of the cost of the corresponding extension. The size of the circle depicts the number of customers in the minigrid.
The map shows many minigrids where the savings are relevant (red and orange dots). Most are located far from the network, but some of them, smaller in size, can be only a couple of km away from the central grid. If we look at Figure 12, we can see that most of the market (65%) is for those minigrids where the savings in comparison with grid extension are less than 10%. Orange areas lower costs by between 15% and 25% and represent 29% of the market (nearly 85,000 customers). Those minigrids with savings over 25%, up to 90% or higher, are 6% of the customer base (19,000 customers).
It is important to note here that the Southern Service Territory is a densely populated area, where minigrids sizes are not small, and they are not too far from the grid in any case. Figure 13 shows the frequency of minigrid sizes, rounded in multiples of 50 customers. Out of the 902 individual least-cost minigrids designed for the Reference Scenario, with an average size of 329.36 customers/minigrid, the model appears in minigrids around 200 customers, where 126 systems connect over 25,000 customers. The peak of customers for a specific minigrid size appears for systems around 400 customers, which connect over 33,000 customers. In the Southern Service Territory, with almost 300,000 minigrid customers, 78.29% of that market (233,000) are systems between 200 and 600 customers.
The location and quality of the sites selected for minigrids deployment are critical to attract investors and facilitate the good economic viability of the business models applied [30]. As seen above, the distribution of the minigrids over the Southern Service Territory is not homogeneous. Moreover, Figure 14 shows the heat map of minigrid geographical locations. It can help determine areas where the economies of scale of building and operating several minigrids together will help bring down the cost of service. Reducing this cost will help lower the viability gap of the minigrids. It will also decrease the subsidies required to cover the difference between applicable tariffs (or fees), which the customers can afford, and the actual cost of supply.
It is important to remember that, even in least-cost planning, the cost of supply in isolated rural areas (with any electrification mode) is always much higher than in densely populated urban neighborhoods. Any average tariff which includes urban and rural customers will always imply a cross-subsidy between those areas where the actual cost of service is fundamentally different.

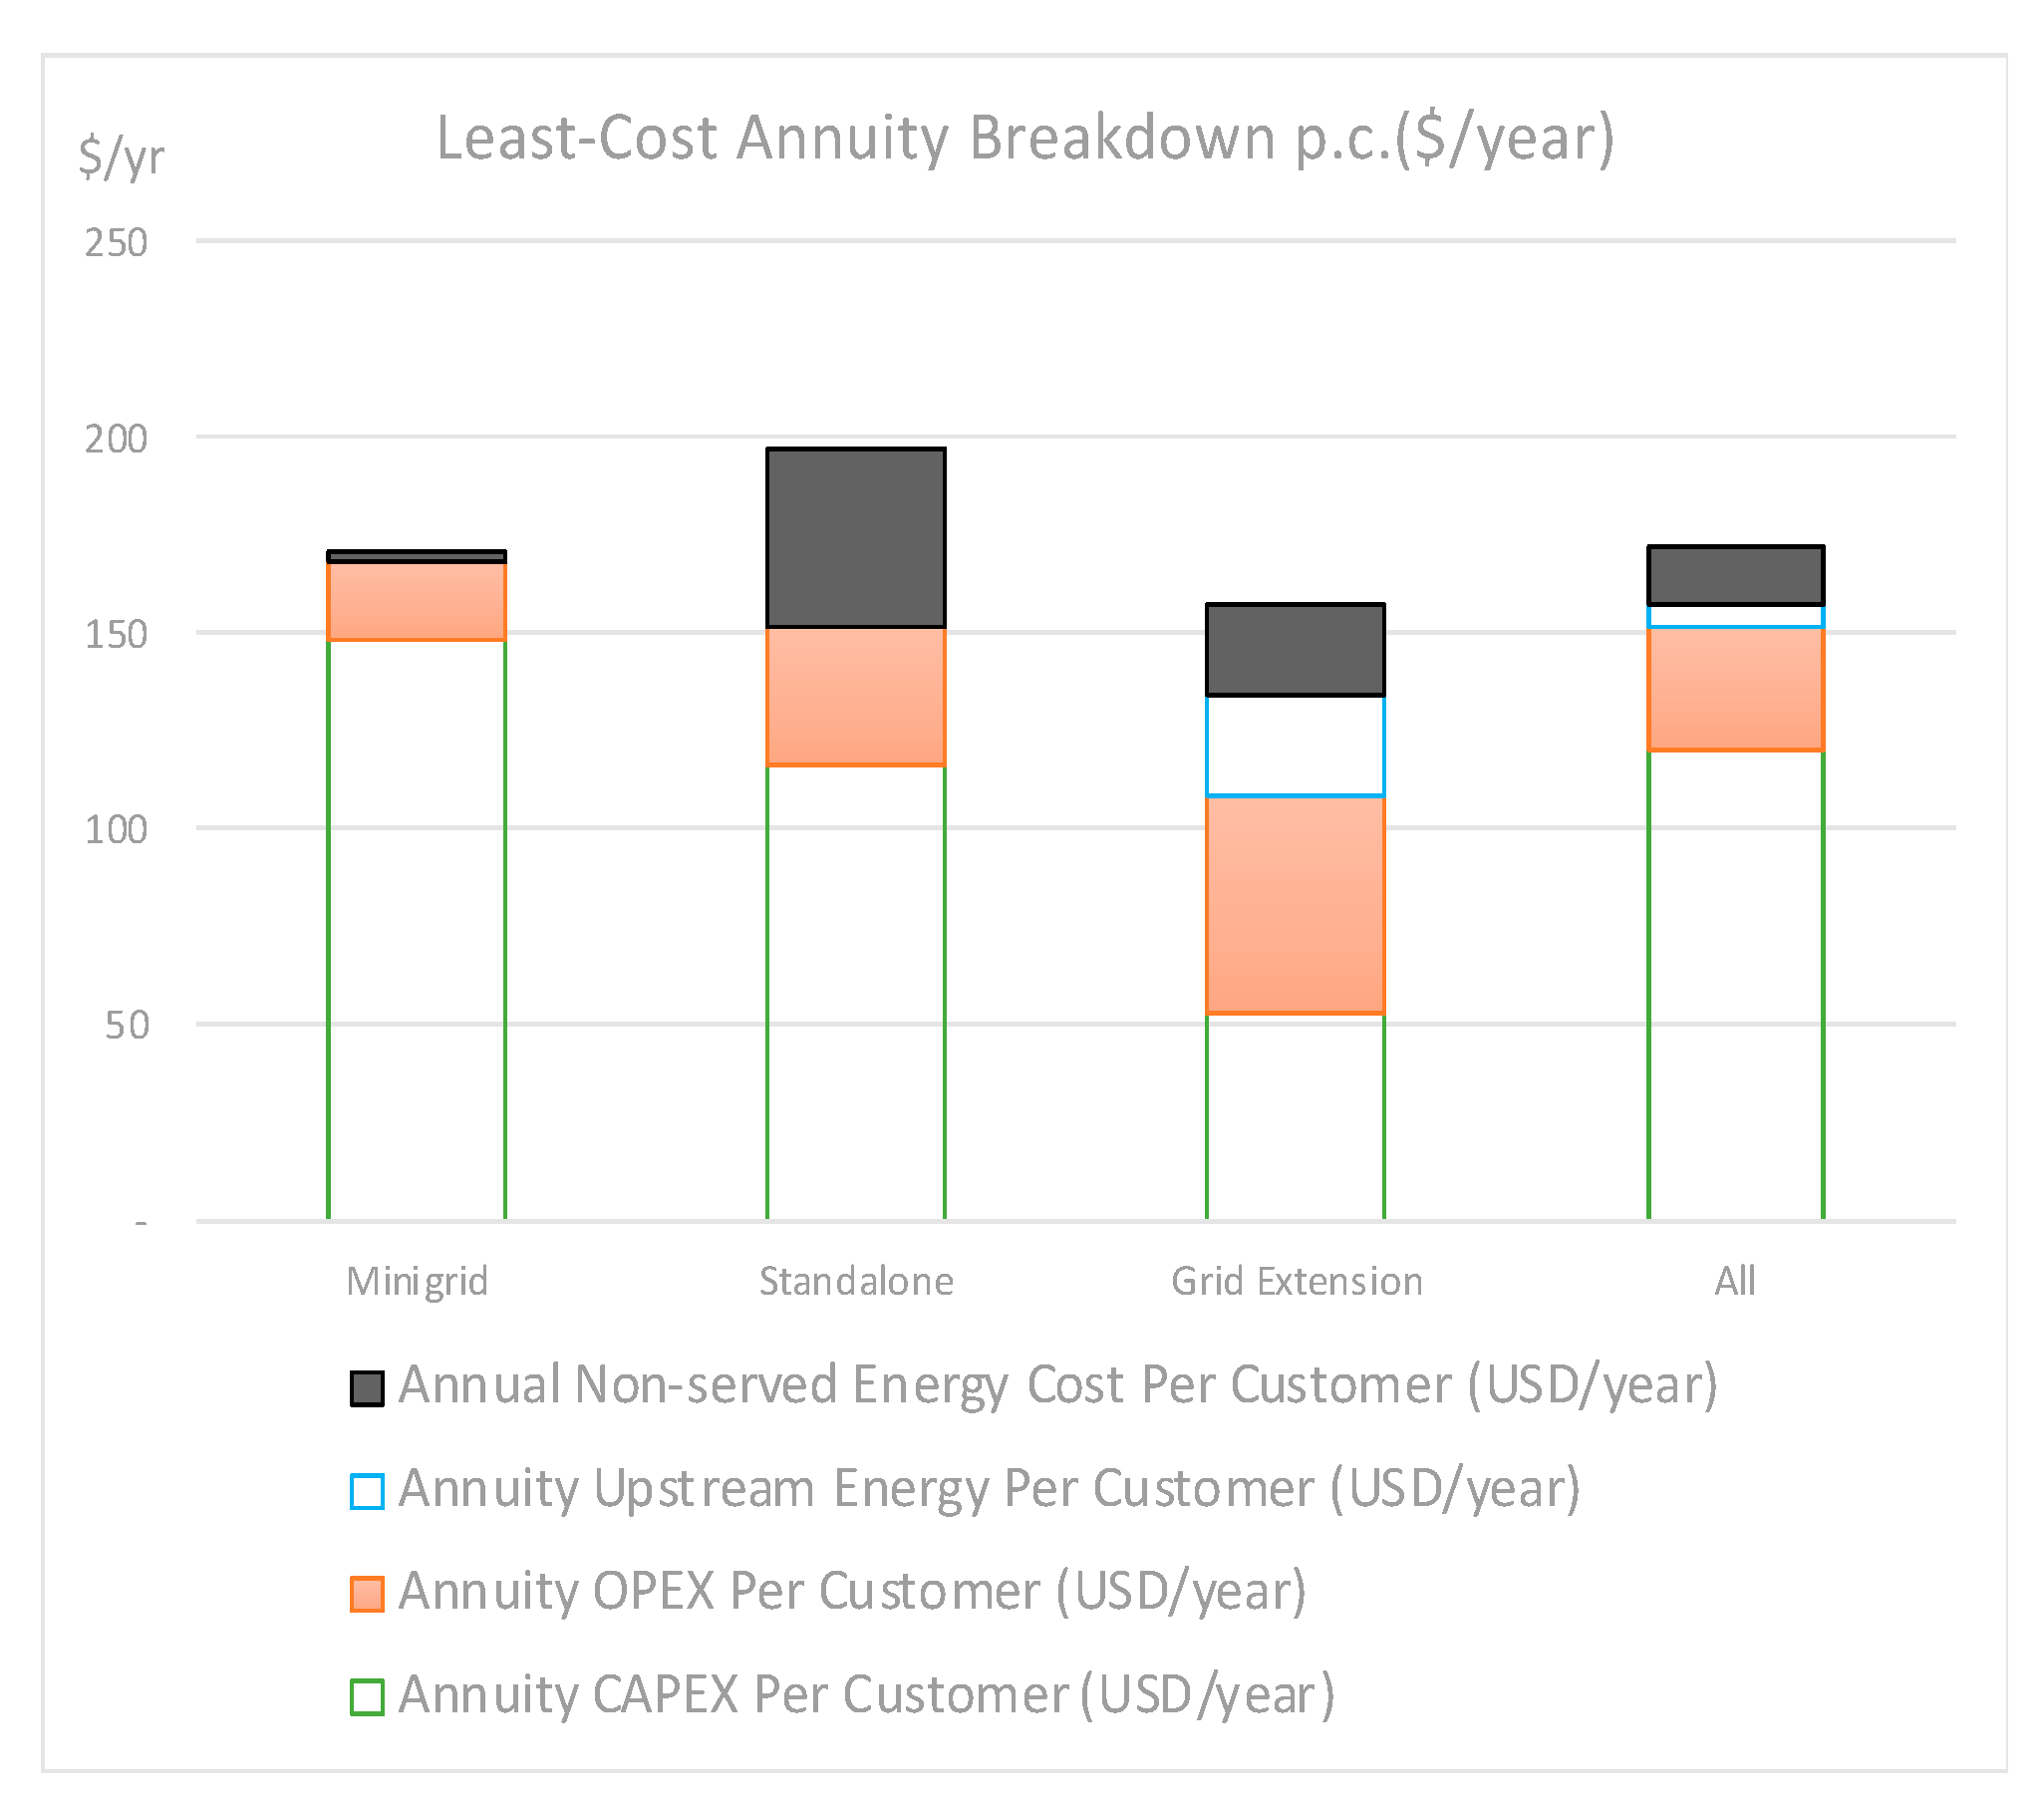
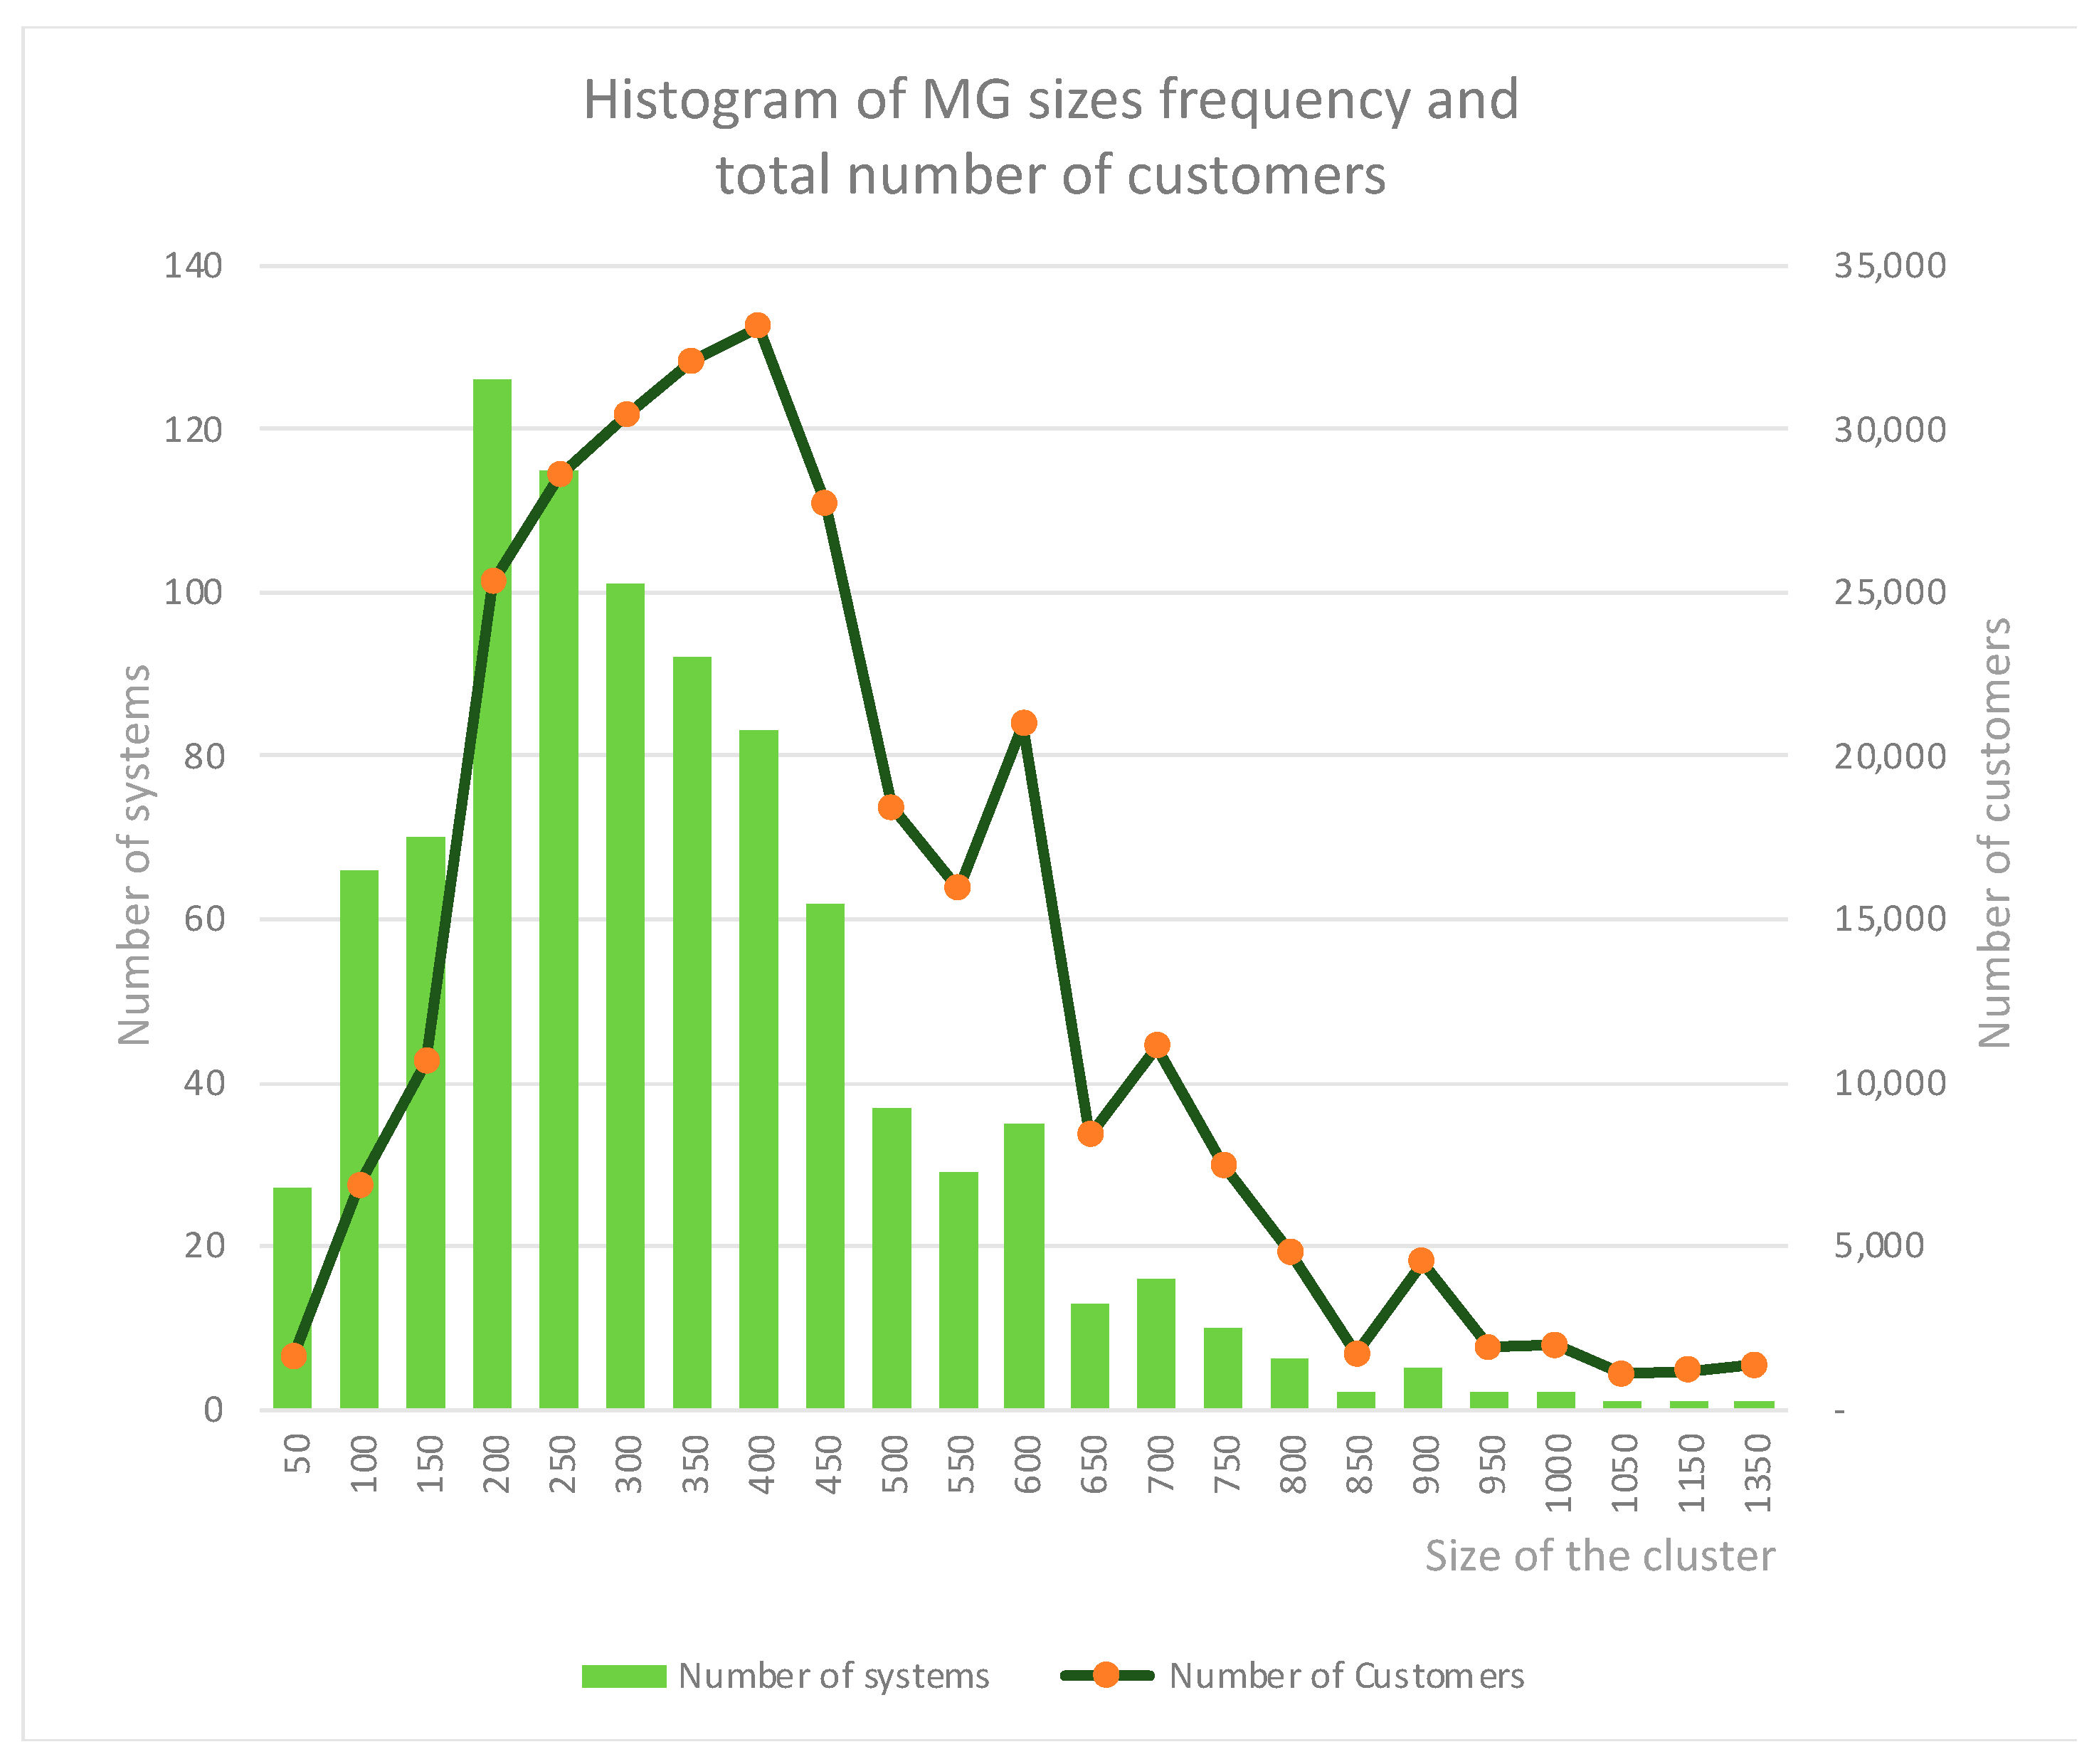
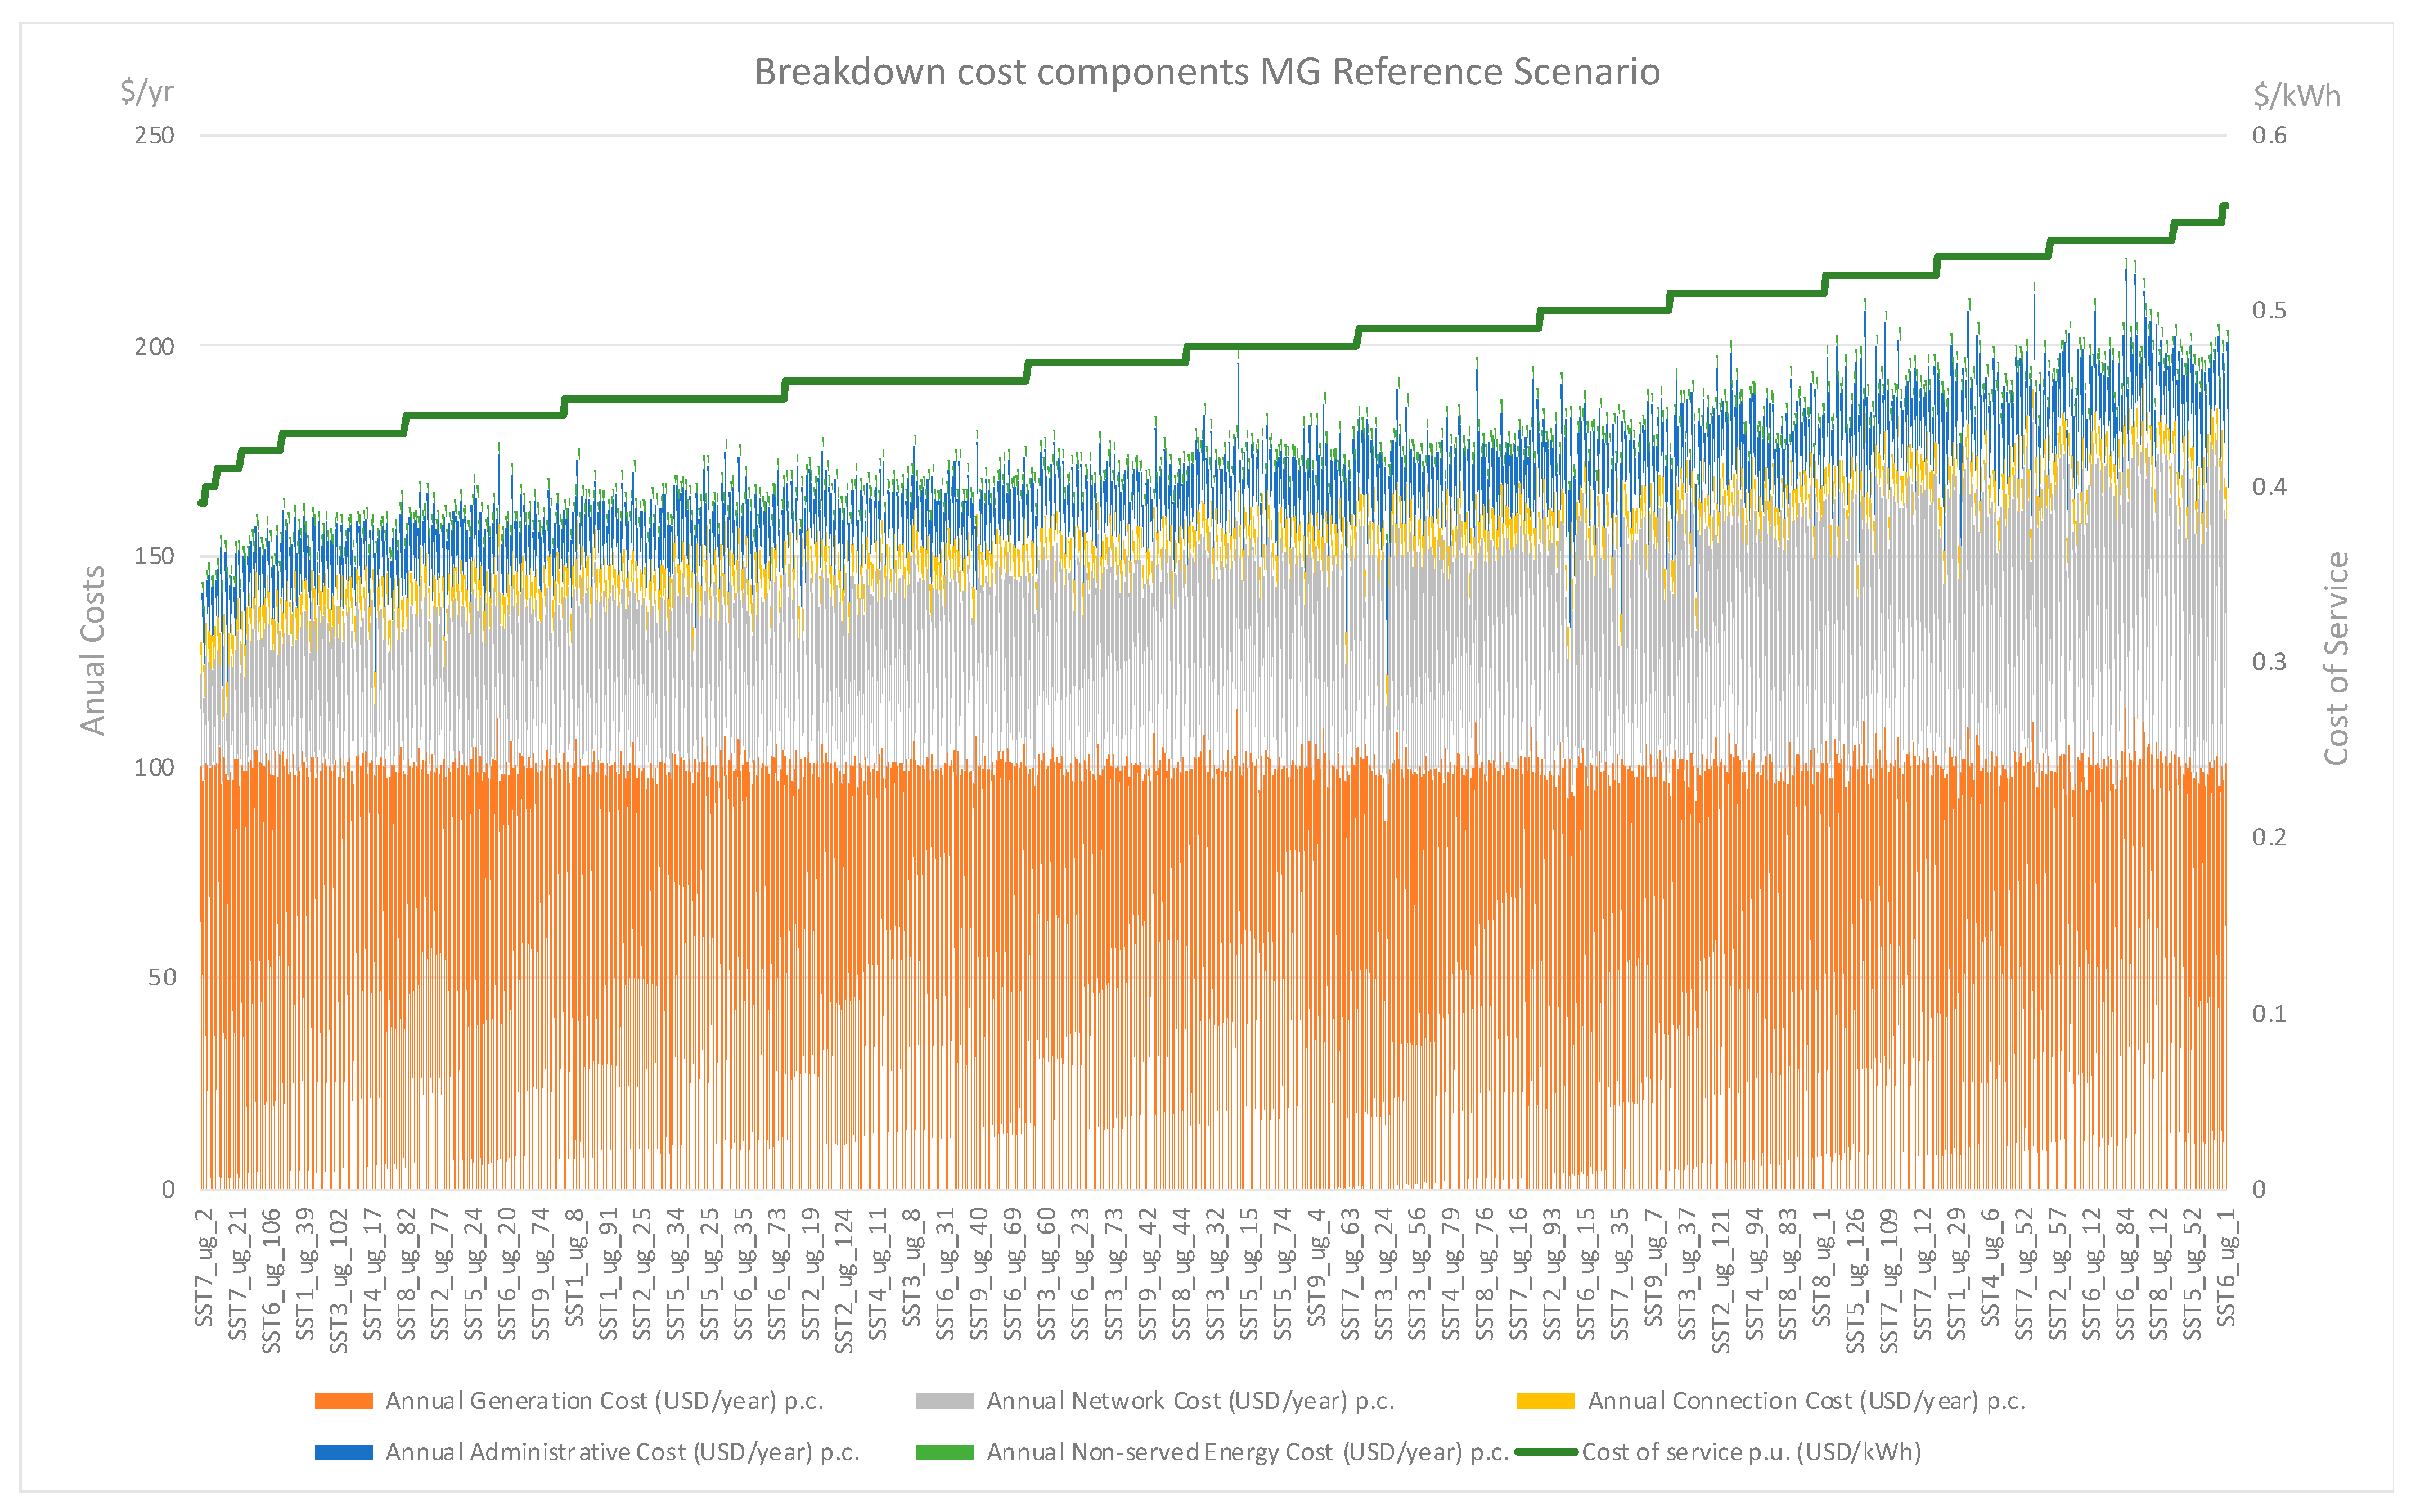
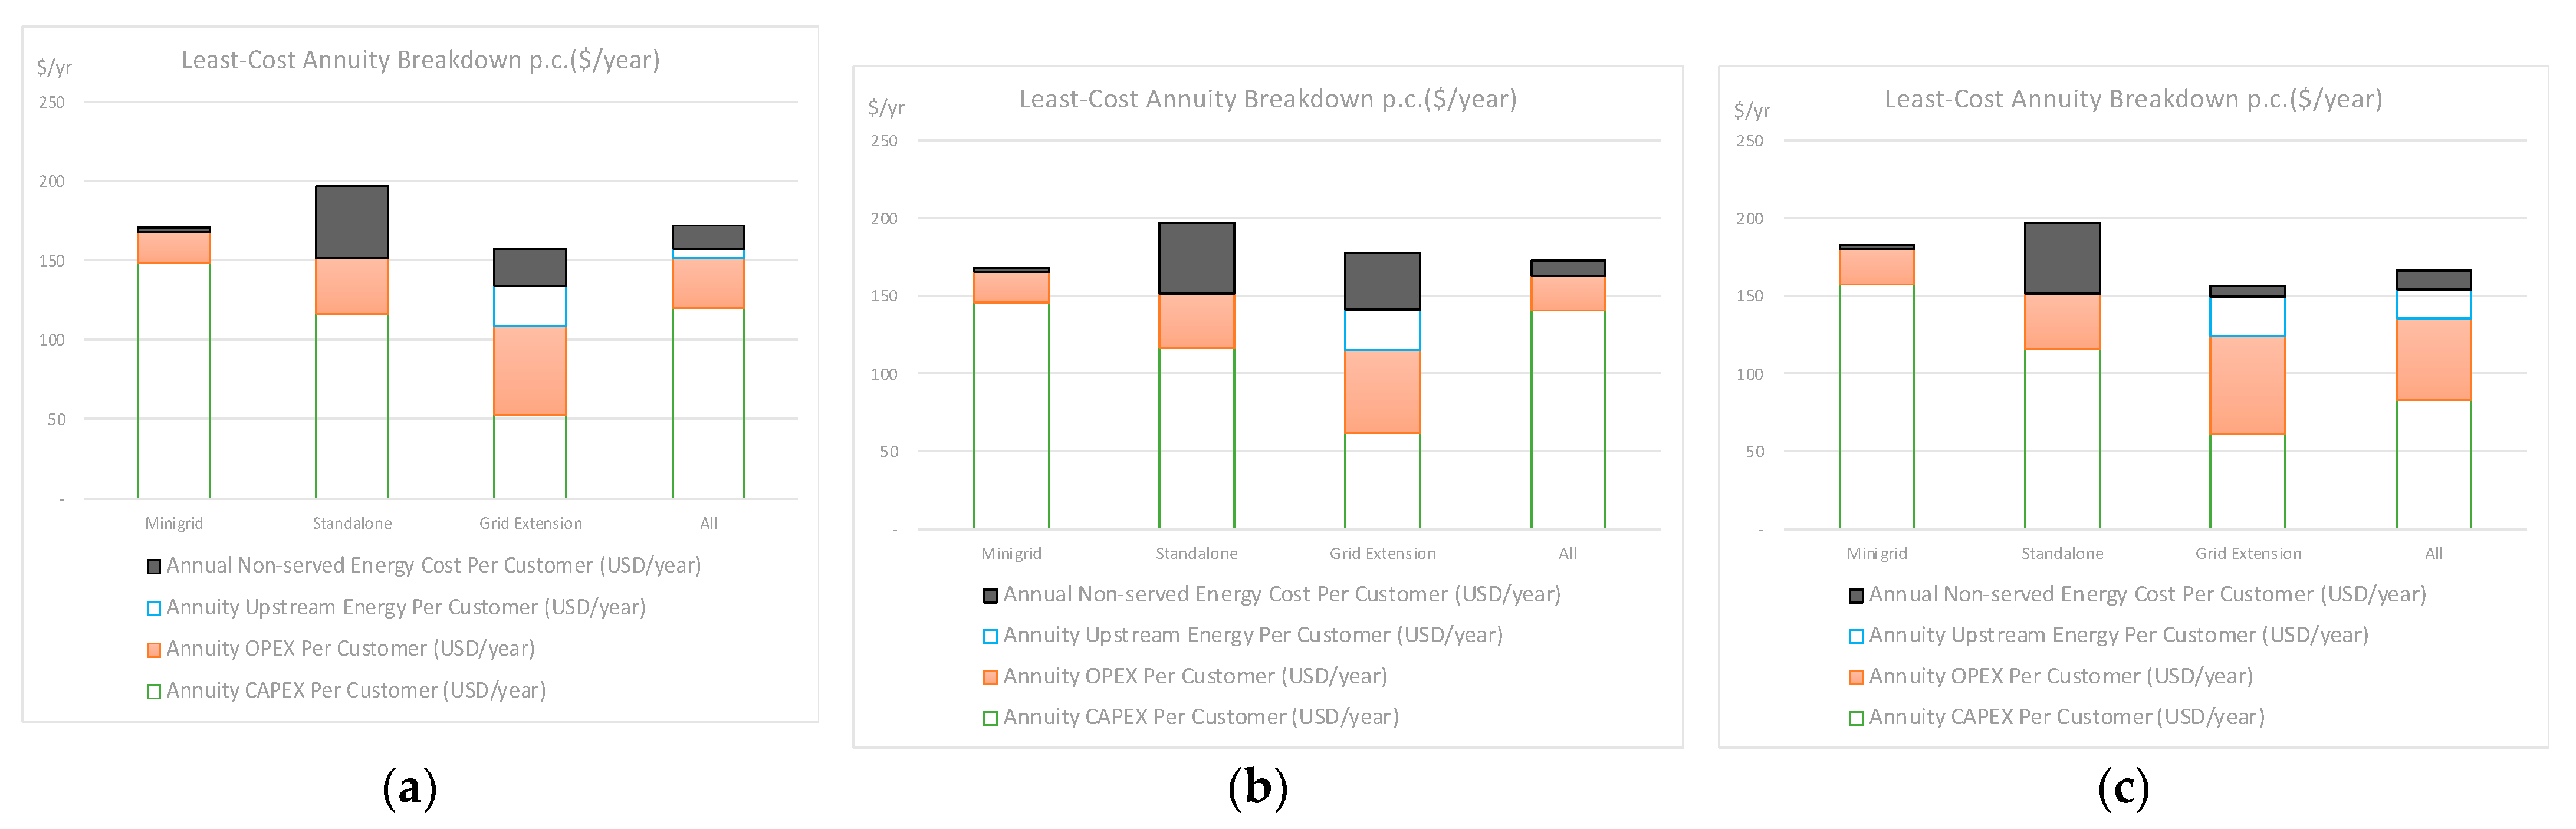
4.2. MiniGrid Portfolio: Break down of the Cost of Service, Investment, and Implementation Pipeline

The average supply cost annuities of 168 USD/year per customer (CAPEX + OPEXs) and 0.46 USD/kWh per unit do not reflect the diversity of systems shown in Figure 15. Starting with those dense villages where the cost of service is as low as 0.34 USD/kWh (where the cost of the network only adds 5 cents per kWh to the generation cost of supply of 0.29 USD/kWh), up to the most disperse minigrid where supply cost per unit is 0.52 USD/kWh.
The main cost component is always the generation cost, ranging from USD 87 to 114/year per customer. The network cost is more volatile and varies from USD 14 to 76/year per customer. The connection cost is USD 7.6/year per customer, and the administrative cost falls between USD 12 and 36/year per customer. Finally, the cost of non-served energy is between USD 2.31 and 3/year per customer.
This system by system cost breakdown, as provided by REM, helps establish the reference financial effort devoted to build, operate, own, or transfer (BOOT) [30] for each minigrid. It provides detailed cost breakdown to calculate the appropriate cost-of-service remuneration for applicable business models, and to determine both the income expected (pondering all the customers connected to each minigrid, their types, and applicable regulated tariff or market fee for service according to their affordability). This allows estimating the need for subsidies and grants for each scenario and the development of detailed financial plans.
To prepare any financial plan, it is necessary to know when the investments are required and when each minigrid (or any other system) becomes operational each year during the electrification period. Figure 16 shows how these different minigrid projects can be sorted according to their efficiency. The investment amounts have been evenly distributed from 2022 to 2030 for their implementation. In this example, two criteria have been used for prioritization. First is the amount of productive and community loads in the minigrid. Second is the efficiency of the investment in terms of the cost of service per customer of the investment.

5. Sensitivity Analysis

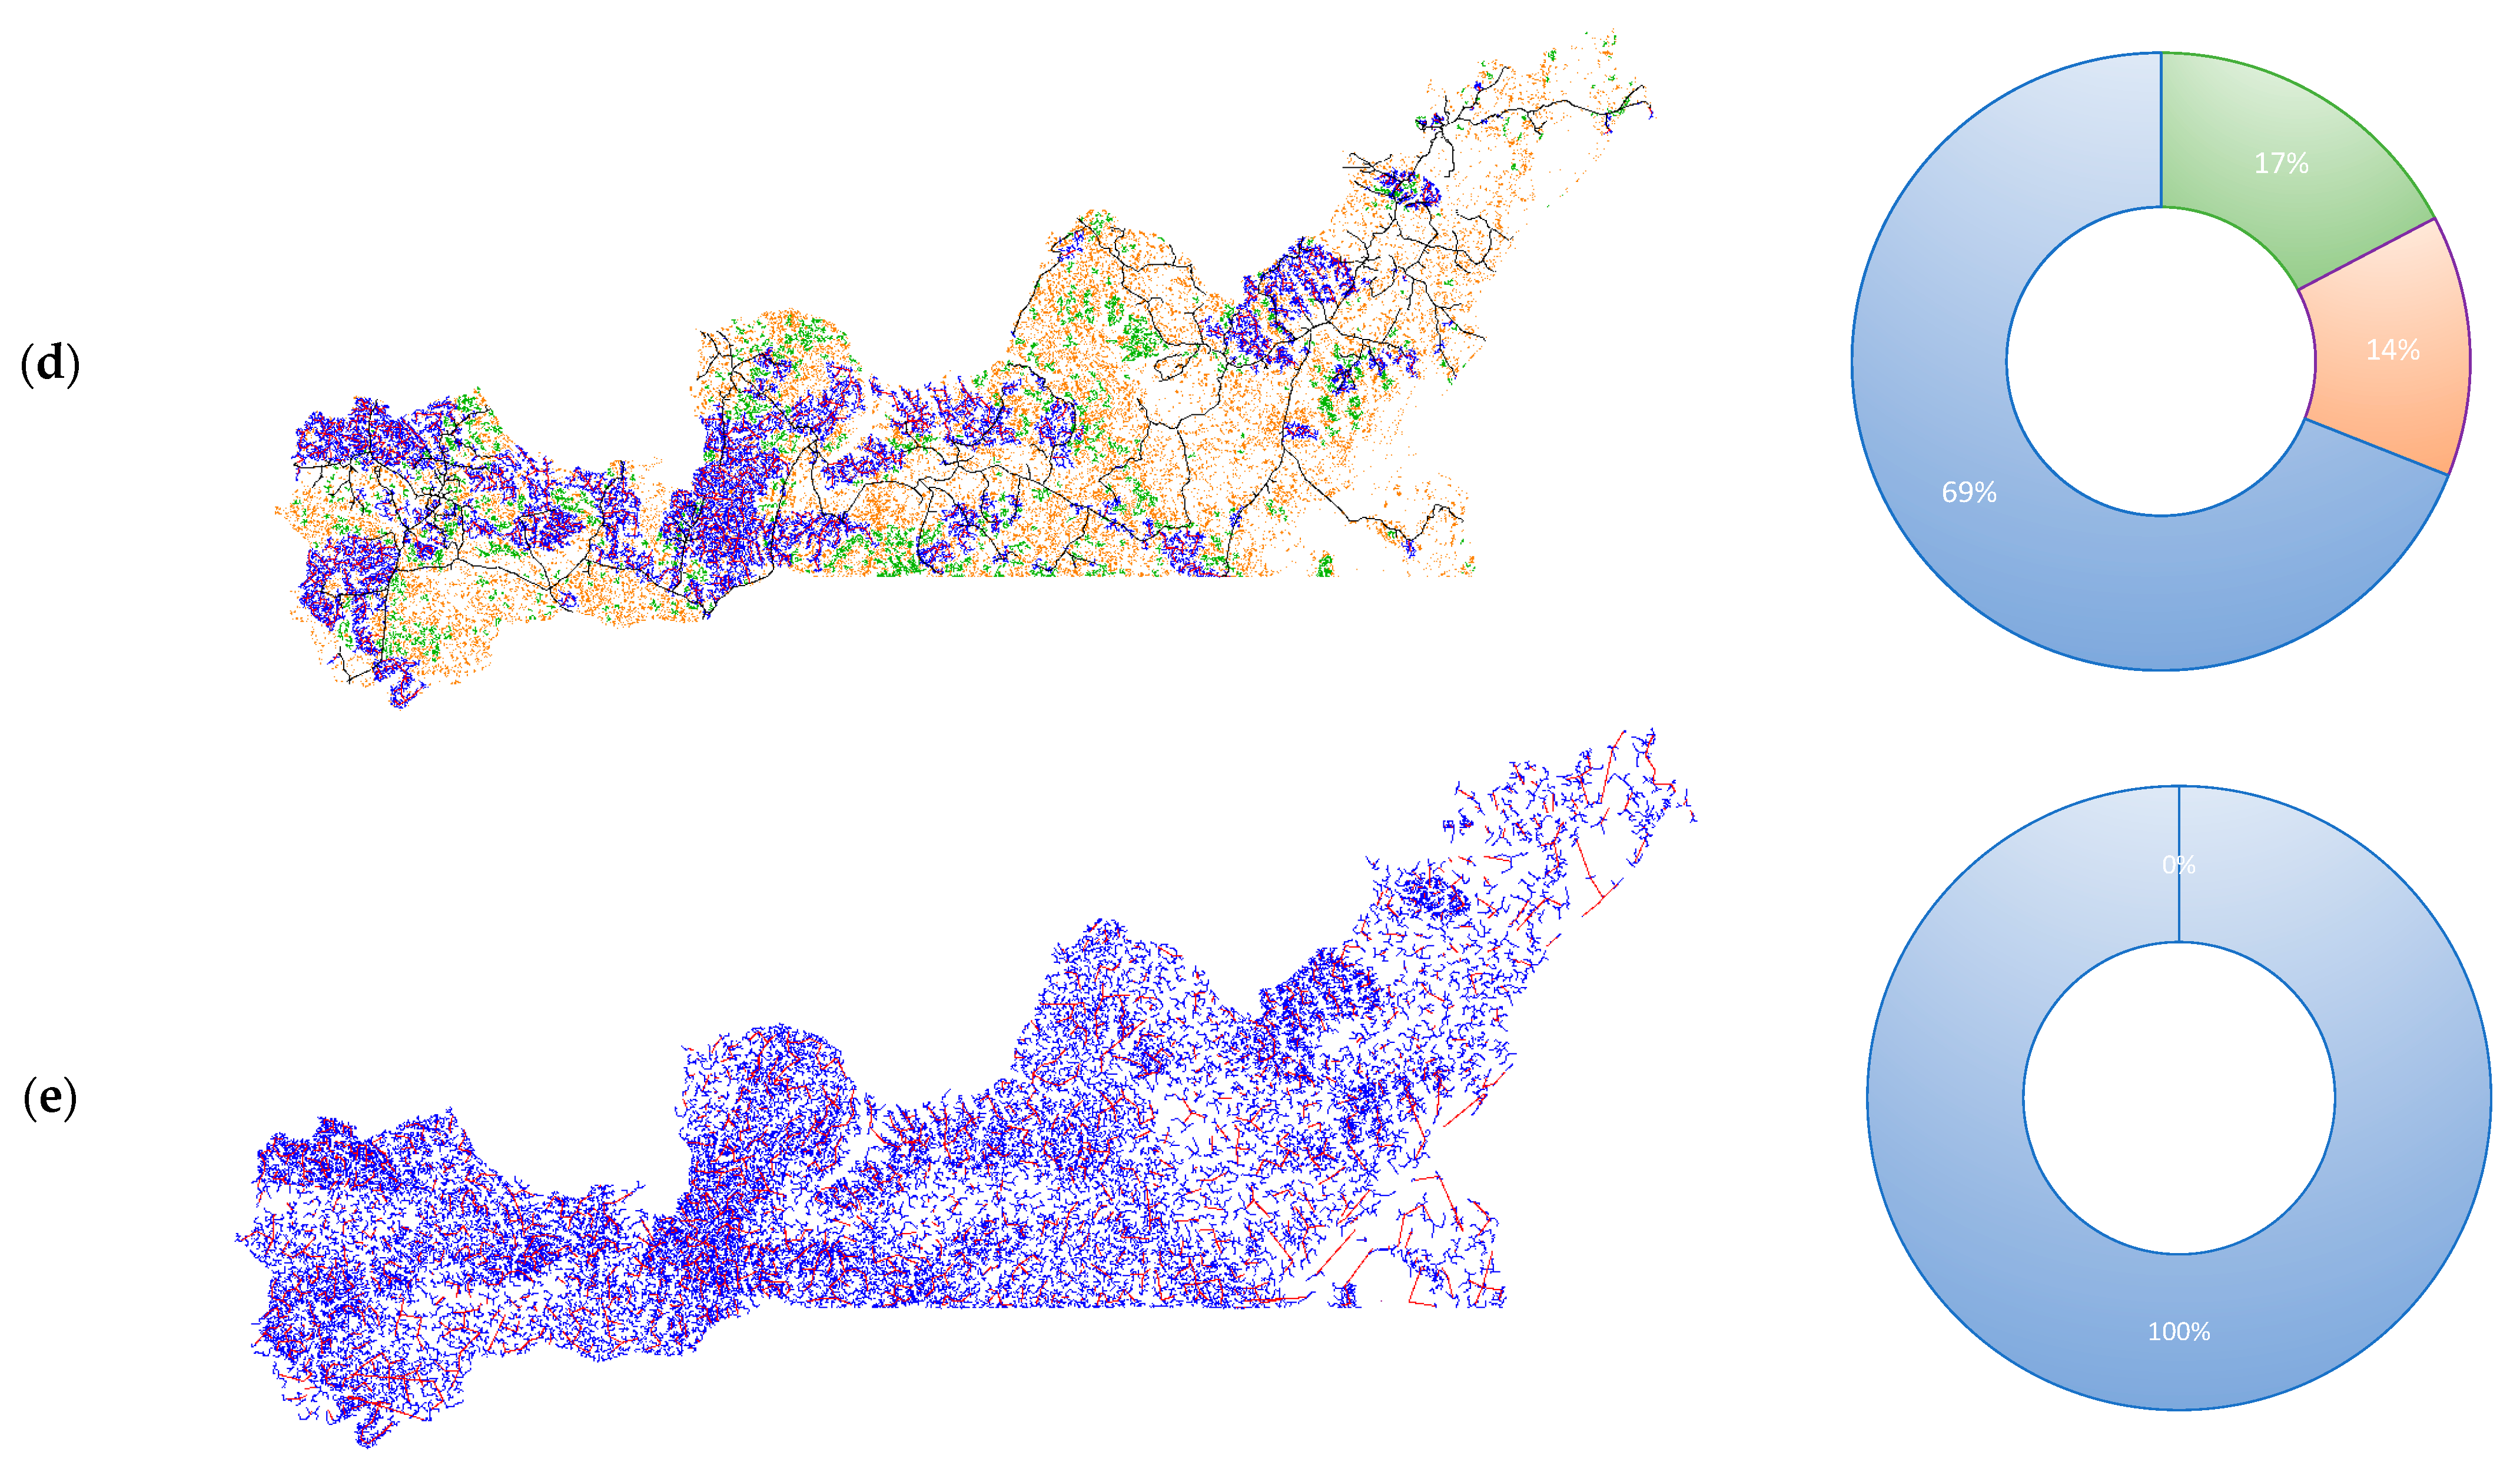
5.1. Assessment of the Impact of the Reliability of the Existing Grid

For this section, to fully acknowledge the trade-off between the different approaches and electrification technologies, we have not considered the topography for this sensitivity scenarios. Figure 17a–c show results for different scenarios. Each one represents both the least-cost systems map and the share of customers per electrification mode. The map shows grid extensions with the existing grid in black, the new MV lines in red, and LV lines in blue. It shows the new LV minigrid lines in green (there are no MV minigrid lines in the REM solutions for these scenarios) and the new standalone systems in orange. The plots use blue for grid extension, green for minigrids and orange for standalone systems. The scenarios are defined as follows:
(a)
Reference Scenario, described in the previous section, assumes that some upstream investments in generation expansion, transmission, and distribution grid reinforcements happen, so reliability reaches 90% in this rural territory;
(b)
85% Grid Reliability Scenario. According to [72,75], this is an estimation of the present average reliability of the grid supply in Uganda and the need for diesel backup by companies that require 24 × 7 services. In this scenario, we assume that no significant improvements will happen before 2030;
(c)
97% Grid Reliability Scenario analyzes what would be the least-cost solution in case upstream investments in the Southern Service Territory manage to get close to total reliability in 2030;
(d)
The average reliability of the minigrids supply in these scenarios remains constant at 98.7% since all the scenarios have the same demand profiles, critical and non-critical periods and uses, and the same catalog of generation components.
Figure 18i shows the energy dispatch of a specific minigrid (26 kWp load, 83 MWh of energy served per year) for 4 sample days of the year. Some areas with non-served energy are visible in red. They correspond to non-critical nighttime periods for daytime productive customers. Consequently, the dispatch shows how some non-served energy appears in the early morning before dawn and partially close to midnight on rainy days. Figure 18ii shows the impact of these periods on the average hourly reliability of this system. Reliability is perfect, 100%, from 8:00 to 23:00, and declines slowly, so at 7:00, it serves 89% of that non-critical demand throughout the year. This figure stresses the importance of the definition of critical and non-critical uses and periods and the determination of the cost of not attending these loads sometimes across the year.
The share of minigrids grows from 59% in (Figure 17a) Reference Scenario to 83% in (Figure 17b), 85% Grid Reliability Scenario. Highly reliable minigrid supply (98.7%) becomes the preferred option for nearly all connected customers, as the grid in this scenario only reaches 0.1% of the customers in (Figure 17b). The share of standalone systems in both scenarios remains almost the same, 16.72% in (Figure 17a) vs. 16.76% in (Figure 17b). This result would point out that while grid extension and minigrids are complementary, the balance between both can be explained by the trade-off between non-served energy cost vs. capital expenses, operation and maintenance, and upstream energy costs of both alternatives.
Inversely, for the 97% Grid Reliability Scenario, the share of minigrids decreases from 59% in (Figure 17a) to 14% in (Figure 17c). As expected, the grid grows from 23.68% to 70.9%, respectively. In this case, the number of standalone systems decreases from 16.72% to 15.49%, showing that a highly reliable grid might still attract some isolated customers around it. Still, in this optimistic scenario, the number of least-cost minigrids is relevant, connecting almost 68,000 customers with grid-like service.
In terms of cost, the average annuity (including CAPEX, OPEX, Upstream Energy, and CNSE) of these three scenarios is very similar (172.89 for the 85% Grid Reliability Scenario, 172.18 for the Reference Scenario, and 166.26 USD/year per customer for 97% Grid Reliability Scenario) as can be seen in Figure 19. CAPEX is less relevant in (Figure 19c) while OPEX and upstream energy costs grow significantly compared to the other two scenarios.

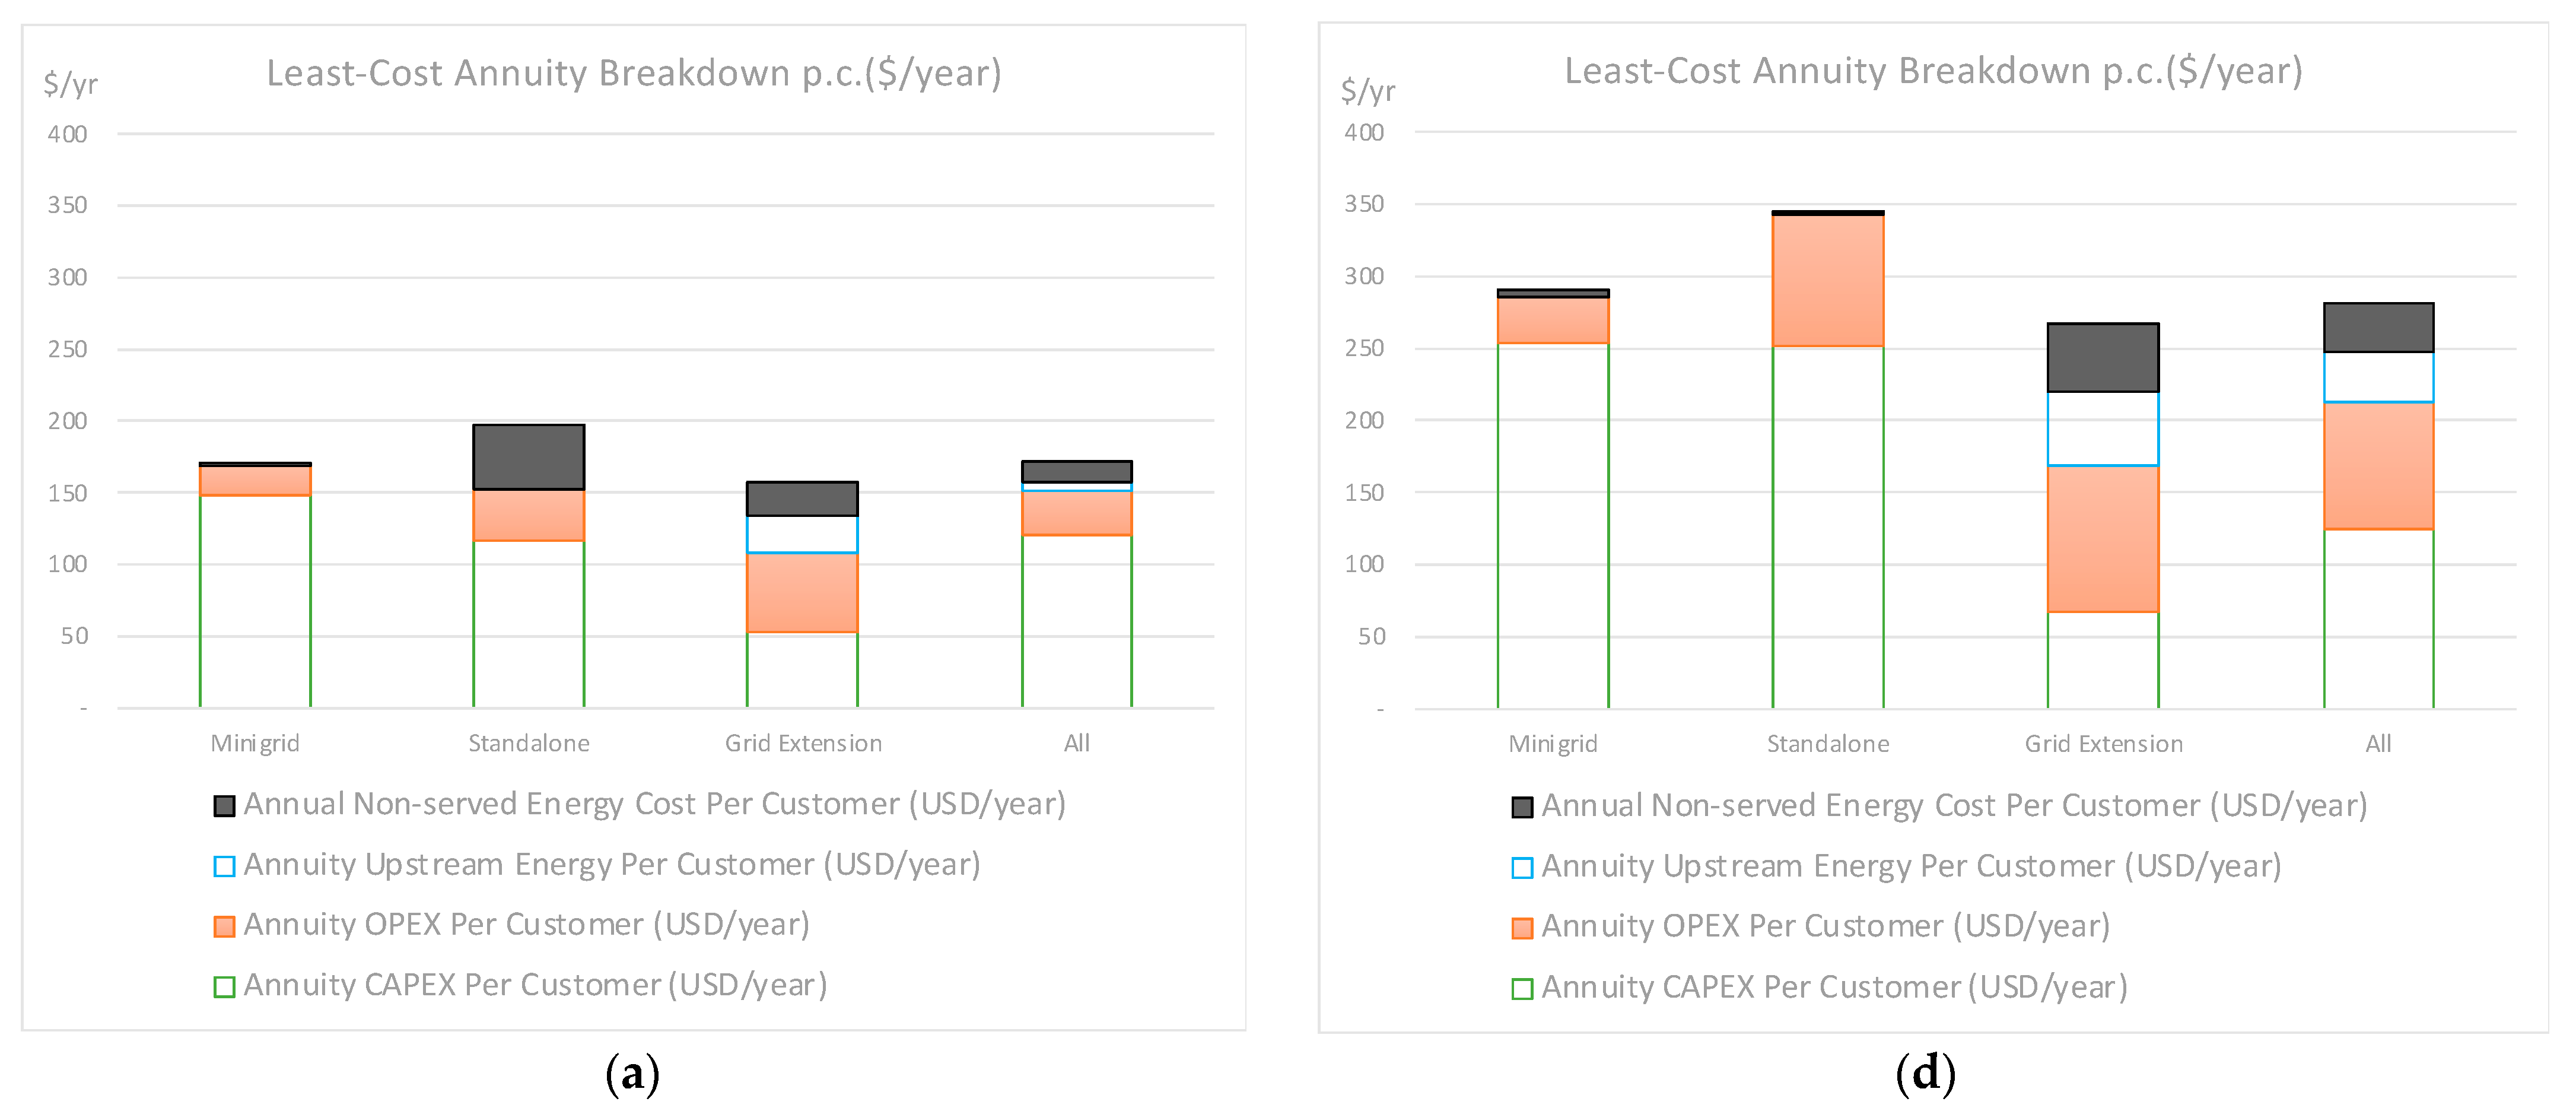
5.2. Assessment of the Impact of a Higher Demand Forecast

Figure 17d vs. Figure 17a shows how doubling the demand expected in 2030 affects the electrification maps and the supply modes mix. Grid extension grows from 23.68% in (Figure 17a) to 68.99% in (Figure 17d), mainly at the expense of minigrids, which fall from 59.6% to 17.32%. Despite this reduction, minigrids continue to represent the preferred least-cost choice for more than 86,000 customers. The impact of doubling the demand in the standalone systems is not so relevant, resulting in a moderate decrease from 16.72% to 13.69%. This result is also consistent with the notion that minigrids and grid extensions cover similar territory. In this case, the trade-off between both can be explained because of larger economies of scale in network investments as demand grows, compared to those, also existing but lesser, in minigrids generation, resulting in a higher weight of grid connections in the Double Demand Scenario.
The cost of service for the Double Demand Scenario grows from USD 172.18/year per customer in Figure 20a to USD 281.54/year per customer in Figure 20d, 63.5%. The cost per unit falls from USD 0.461/kWh to USD 0.368/kWh, as economies of scale increase the efficiency of the grid and minigrid supply by almost 20%. The more significant weight of the grid extension solution also results in a decrease in the relative weight of CAPEX in this solution, while OPEX and upstream energy cost increases, as can be seen in Figure 20.

5.3. Least-Cost Reference Scenario vs. 100% Grid Extension Scenario

As detailed in Section 4, the Reference Scenario finds the least-cost choice of supply mode (extension, minigrid or solar home system) for each customer in the area of study. In the 100% Grid Extension Scenario, Figure 17e, we design the optimal grid extension that reaches every customer in the study area.
Figure 21 shows how the cost of extending the grid (including CAPEX, OPEX, Upstream Energy, and CNSE) to all the customers in this area for (Figure 21e) the 100% Grid Extension Scenario is USD 220.19/year per customer, while (Figure 21a) in the Reference Scenario the cost per customer is USD 172.18/year per customer. It shows how minigrids and standalone systems decrease the total expenditure in supply by 27.9% compared to 100% Grid Extension Scenario.

6. Discussion and Conclusions

Minigrids have a role to play in rural electrification, which might have been traditionally underestimated. Minigrids can provide grid-like service, and in some areas and under certain conditions, their cost of service is lower than the cost of supply extending the main grid or electrification with standalone systems.
The Reference Electrification Model evaluates and designs customer-wise according to their individual location and specific demand curves, the least-cost mix of standalone, minigrid, or grid extension systems to provide electric service with user-defined quality of service. The most critical statement of this paper is that full customer granularity—geographical location, kind of customer, and hourly modeling of supply and demand—is necessary to correctly decide the electrification mode for each individual customer.
Even in high-density rural or peri-urban areas, like the Southern Service Territory of Uganda, and not too far from the existing grid, the cost of decentralized off-grid minigrids can be lower than the cost of grid extension.
One way to visualize the comparison between the costs of electrification with minigrids and grid extension is to compute the ratio between the cost of service (including CAPEX, OPEX, and CNSE) of minigrid supply vs. the equivalent cost (CAPEX, OPEX, upstream energy purchases, and CNSE) of grid extension supply. We conclude that:
  • Minigrids can be several times cheaper than grid extensions, even when they are not too far from the grid. The main drivers for minigrid cost competitiveness are grid reliability, distance to the grid, distance between customers, and low aggregated demand;
  • Large numbers of close-by customers and the existence of anchor loads, as large industrial customers, may justify the extension of the main network over large distances;
  • Even if the cost difference is not significant, minigrids can play a transitory role as demand grows enough to make the grid connection cost-efficient;
  • Grid-compatible minigrids will facilitate the transition between grid and off-grid supply, guaranteeing the permanence of the assets when the grid arrives. Regulatory provisions must be considered to enable this process.
The share of minigrids as the least-cost option changes with each different scenario studied in this paper. Even in a densely populated area like the Southern Service Territory, where the grid is not very far, in the Reference Scenario, we find that minigrids are the best solution for almost 59.6% of the customer base, as compared to 16.7% of standalone systems and 23.7% grid extension.
The cost of service of the least-cost solution for the Reference Scenario is 28% cheaper than extending the grid to every customer and 17% cheaper than extending the grid only to the minigrid customers in relatively dense settlements, setting aside dispersed standalone customers.
Even when the current grid quality of service is very high, minigrids still can represent a significant portion (14%) of the customer base.
Demand is an essential factor in determining the frontier between grid extension and minigrids. As demand grows, more customer clusters must become connected. In our study, even as demand doubles, with 90% grid reliability, minigrids remain the least-cost option for 17% of the customers.
Sensitivity analysis shows that the share of least-cost minigrids is higher when the central grid reliability is low, as in Uganda and many other countries in Sub-Saharan Africa.
Minigrids in the Southern Service Territory are not small. With an average size of nearly 330 customers, 80% of them are between 200 and 600 customers.
From the investors’ point of view, it is preferable that the minigrids are larger and close to one another, since this facilitates the operation and maintenance, reducing the associated costs, thus reducing the need for subsidies or grants to cover the gap between affordable tariffs or negotiated fees and the actual cost.
It is crucial to be able to estimate the cost of service of each one of the minigrids precisely, which varies from 0.34 USD/kWh up to 0.52 USD/kWh in the Reference Scenario. A precise computation of the fixed and variable costs would enable cost-of-service regulation of minigrid supply.
Determination of the cost of service allows the application of the same sound regulatory principles already established for grid extension. Establishing a cost-reflective remuneration of minigrids makes possible to attract private investments at scale; tariff cross-subsidization between urban and rural customers can be used to reduce the gap between affordable regulated tariffs in low-income rural areas and the cost-reflective revenue requirement of minigrids.
REM provides the cost of supply of every on- and off-grid supply system, therefore helping to establish the reference financial effort devoted to building, operating, owning, or transferring each minigrid. Therefore, it also determines the viability gap, and the resulting need for subsidies or grants, allowing the development of detailed financial plans.
The static electrification plan that REM provides (e.g., the least-cost mix of electrification modes in 2030) can be the basis of a year-by-year trajectory of implementation of the solutions over the considered time horizon. This trajectory, with its associated annual costs of investment and operation, is necessary to prepare the financial plan that can make it possible to raise the funds that will pay for the electrification effort.

Author Contributions

Conceptualization and methodology: A.G.-G. and J.I.P.-A.; software: P.C., S.L., A.G.-G., R.P., F.d.C.G. and J.I.P.-A.; validation, formal analysis, and investigation: A.G.-G., P.C., S.L., R.P., F.d.C.G. and J.I.P.-A.; resources and data curation: A.G.-G., P.C. and S.L.; writing—original draft preparation: A.G.-G.; writing—review and editing: A.G.-G., P.C., S.L. and R.P.; F.d.C.G. and J.I.P.-A.; supervision, project administration and funding acquisition: J.I.P.-A. All authors have read and agreed to the published version of the manuscript.

Funding

The origin of this study comes from the project, Promotion of Minigrids for Rural Electrification, funded partially by GIZ contract 81206123.

Data Availability Statement

The data used in this study is detailed in the Working Paper [5] for the initial field data.

Acknowledgments

The authors wish to acknowledge the critical contribution of the GIZ team in the development of this analysis. Thanks are given primarily to Ashley Wearne for his leadership, and Moses Kakooza and Diego Pérez López for their tireless dedication. We also want to thank the global team of the Universal Energy Access laboratory at MIT and IIT-Comillas, especially Rob Stoner, Doug Ellman, Clara Pérez-Andújar, Vivian Li, Turner Cotterman, Claudio Vergara, and Carlos Mateo, for their support and inspiration throughout the project.

Conflicts of Interest

The authors declare no conflict of interest. The GIZ funded the initial development of this study and helped provide links with the Government of Uganda and other electrification stakeholders in the country to collect the data required for the analyses. They had no influence in the interpretation and analyses of data, in the writing of the manuscript, or in the decision to publish the results.

Appendix A. REM Input Data Catalog

Appendix A.1. Network Catalog

Table A1. Low-voltage (LV) lines techno-economic characteristics.
NameResistance [ohm/km]Reactance [ohm/km]Rated Current [A]Av. Failure Rate [Failures/(km*a)]Overnight Cost [USD]Predictive Maintenance Cost [USD/(Year*km]Corrective Maintenance Cost [USD/Failure]
UG_LV10.670.20185.000.13314,0002.8427
UG_LV20.350.18317.000.13315,1002.8427
Table A2. Medium-voltage (MV) lines techno-economic characteristics.
NameResistance [ohm/km]Reactance [ohm/km]Rated Current [A]Av. Failure Rate [Failures/(km*a)]Overnight Cost [USD]Predictive Maintenance Cost [USD/(Year*km]Corrective Maintenance Cost
[USD/Failure]
UG_MV10.670.25185.000.13326,000700900
UG_MV20.290.23317.000.13328,000700900
Table A3. Medium-to-low voltage (MV/LV) transformers techno-economic characteristics.
NameInstalled Power (kVA)MV
Voltage
No-Load Losses
(kW)
Short Circuit Resistance on the Low Voltage Side (ohms)Av. Failure Rate
[Failures/a]
Overnight Cost
[USD]
Predictive Maintenance Cost
[USD/Year]
Corrective Maintenance Cost
[USD/Failure]
CTI1_VUG25330.090.061.2691479980.2036475225.80465181
CTI2_VUG50330.1350.0341.87164361589980.2036475225.80465181
CTI3_VUG100330.2950.0202.13133124724680.2036475225.80465181

Appendix A.2. Additional Parameters for the Reference Scenario

  • Cost of wholesale energy for distribution:0.072 USD/kWh
  • Cost of non-served energy for critical uses and solar kits: 0.75 USD/kWh
  • Cost of non-served energy for non-critical uses RCS: 0.30 USD/kWh
  • Discount rate for Grid Extension: 10%
  • Discount rate on Minigrids: 10%
  • Discount rate on Stand-Alone Systems: 15%
  • Years of useful life for distribution network: 40 years
  • Years of useful life for minigrids network: 40 years (grid-compatible)
  • Maximum voltage drop at MV network: 10%
  • Maximum voltage drop at end LV customer: 6%
  • O&M Labor cost: USD 1.5/hr

Appendix A.3. Generation Catalog

Table A4. Solar (PV) panels techno-economic characteristics.
Size (kW)Cost (USD)Life (Years)Installation Costs as Fraction of Panel CostAnnual O&M as a Fraction of Panel CostAnnual O&M Man-HoursAnnual Capacity Loss (p.u.)
0.02102510.0150.007
0.31202510.0150.008
Table A5. Batteries techno-economic characteristics.
Battery NameCost [USD]Energy [kWh]Lifetime Throughput [kWh]SOC (min)Capacity at End of Life (Fraction of Nameplate Energy Capacity)Installation Costs as Fraction of Battery CostAnnual O&M as a Fraction of Battery CostAnnual O&M Man-Hours
Li-Ion Large1,1508.617,0000.20.810.015
Li-Ion Small200.12000.10.810.015
Diesel generators:
  • Only solar minigrids have been considered for the Reference Scenario
Charge controllers:
  • Lifetime [years]: 15
  • Efficiency [p.u.]: 0.95
  • Installation costs as a fraction of charge controller cost: 0.1
  • Annual O&M as a fraction of charge controller cost: 0.01
  • Annual O&M man-hours: 2
Table A6. Charge-controllers techno-economic characteristics.
Costs (USD/kW)481375283215133131
Sizes (kW)0.0540.120.241.443.844.128
Inverters:
  • Lifetime [years]: 15
  • Inverter efficiency [p.u.]: 0.95
  • Rectifier efficiency [p.u.]: 0.9
  • Installation costs as a fraction of charge controller cost: 0.1
  • Annual O&M as a fraction of charge controller cost: 0.01
  • Annual O&M man-hours: 2
Table A7. Inverters techno-economic characteristics.
Costs (USD/kW)927740600500465460450440430420
Sizes (kW)0.150.20.250.311.5561011.4

References

  1. The Republic of Uganda. Ministry of Energy and Mineral Development. National Electrification Strategy for Uganda; Final Strategy Paper; Ministry of Energy and Mineral Development: Kampala, Uganda, 2021; p. 74.
  2. Uganda Off-Grid Energy Market Accelerator UOMA. Off-Grid Energy in Uganda Market Map Market Map 2021: Foreword by the Ministry of Energy and Mineral Development; Uganda Off-Grid Energy Market Accelerator: Kampala, Uganda, 2021; Available online: https://uoma.ug/wp-content/uploads/2021/12/2021-UOMA-market-map-vFinal.pdf (accessed on 9 January 2022).
  3. Innovation Energie Developpement. GEOSIM Projects. 2018. Available online: http://www.geosim.fr/index.php?page=references-en (accessed on 29 April 2018).
  4. Ciller, P.; Ellman, D.; Vergara, C.; Gonzalez-Garcia, A.; Lee, S.J.; Drouin, C.; Brusnahan, M.; Borofsky, Y.; Mateo, C.; Amatya, R.; et al. Optimal Electrification Planning Incorporating On- And Off-Grid Technologies. A Reference Electrification Model (REM). Proc. IEEE 2019, 107, 1872–1905. [Google Scholar] [CrossRef]
  5. Gonzalez-Garcıa, A.; Ciller Cutillas, P.; Lee, S.J.; Palacios, R.; Cotterman, T.; Amatya, R.; Perez-Lopez, D.; Kakooza, M.; Wearne, A.; Stoner, R.; et al. Promotion of Mini-Grids for Rural Electrification in Uganda; Working Paper WP-IIT 20-184A; Instituto de Investigación Tecnológica, Universidad Pontificia Comillas: Madrid, Spain, 2018; Available online: https://www.iit.comillas.edu/publicacion/working_paper/es/423/Promotion_of_mini-grids_for_rural_electrification_in_Uganda (accessed on 4 April 2018).
  6. UNDP. Sustainable Development Goals; UNDP: New York, NY, USA, 2015; Available online: https://sustainabledevelopment.un.org/post2015/transformingourworld/publication (accessed on 18 April 2022).
  7. ESMAP; World Bank; IEA. SE4All Global Tracking Framework; ESMAP/World Bank/IEA: Washington, DC, USA, 2013; Available online: https://www.researchgate.net/publication/281354592_Sustainable_Energy_for_All_Global_Tracking_Framework_2013#fullTextFileContent (accessed on 18 April 2022).
  8. IEA; IRENA; UNSD; World Bank; WHO. Tracking SDG7. The Energy Progress Report 2021; World Bank: Washington, DC, USA, 2021; Available online: https://trackingsdg7.esmap.org/data/files/download-documents/2021_tracking_sdg7_report.pdf (accessed on 15 June 2021).
  9. Pueyo, A.; González, F.; Dent, C.; DeMartino, S. The Evidence of Benefits for Poor People of Increased Renewable Electricity Capacity: Literature Review; Institute for Development Studies Evidence Report 31. Pro-Poor Electricity Provision; IDS: Brighton, UK, 2013. [Google Scholar]
  10. Hutton, G.; Rehfuess, E.; Tediosi, F.; Weiss, S. Evaluation of the Costs and Benefits of Household Energy and Health Interventions at Global and Regional Levels; World Health Organization: Geneva, Switzerland, 2006; Available online: https://www.who.int/publications/i/item/9789241594790 (accessed on 18 April 2022).
  11. Bensch, G.; Kluve, J.; Peters, J. Impacts of rural electrification in Rwanda. J. Dev. Eff. 2011, 3, 567–588. [Google Scholar] [CrossRef]
  12. Colombo, E.; Romeo, F.; Mattarolo, L.; Barbieri, J.; Morazzo, M. An impact evaluation framework based on sustainable livelihoods for energy development projects: An application to Ethiopia. Energy Res. Soc. Sci. 2018, 39, 78–92. [Google Scholar] [CrossRef]
  13. Sovacool, B.K. Deploying off-grid technology to eradicate energy poverty. Science 2012, 338, 47–48. [Google Scholar] [CrossRef]
  14. Energy Access Targets Working Group. More than a Lightbulb: Five Recommendations to Make Modern Energy Access Meaningful for People and Prosperity; Energy Access Targets Working Group: Washington, DC, USA, 2016; Available online: http://www.cgdev.org/publication/more-than-lightbulb-recommendations-modern-energy-meaningful (accessed on 18 April 2022).
  15. Gaunt, C.T. Meeting electrification’s social objectives in South Africa, and implications for developing countries. Energy Policy 2005, 33, 1309–1317. Available online: http://www.sciencedirect.com/science/article/pii/S0301421503003756 (accessed on 7 January 2014). [CrossRef]
  16. Nussbaumer, P.; Nerini, F.F.; Onyeji, I.; Howells, M. Global insights based on the multidimensional energy poverty index (MEPI). Sustainability 2013, 5, 2060–2076. [Google Scholar] [CrossRef] [Green Version]
  17. Khandker, S.R.; Samad, H.A.; Ali, R.; Barnes, D.F. Who Benefits Most from Rural Electrification? Evidence in India: Policy Research Working Papers. Energy J. 2014, 35, 75–96. Available online: http://elibrary.worldbank.org/doi/book/10.1596/1813-9450-6095 (accessed on 22 April 2014). [CrossRef] [Green Version]
  18. Lee, S.J.; Sanchez, E.; Gonzalez-Garcıa, A.; Ciller, P.; Duenas, P.; Taneja, J.; de Cuadra García, F.; Lumbreras, J.; Daly, H.; Stoner, R.; et al. Investigating the Necessity of Demand Characterization and Stimulation for Geospatial Electrification Planning in Developing Countries. In A MIT Center for Energy and Environmental Policy Research Working Paper; MIT: Cambridge, MA, USA, 2019; Available online: https://www.researchgate.net/publication/335662906_Investigating_the_Necessity_of_Demand_Characterization_and_Stimulation_for_Geospatial_Electrification_Planning_in_Developing_Countries (accessed on 18 April 2022).
  19. Arriaga, J.I.P. Tecnologías Para el Desarrollo Humano de las Comunidades Rurales Aisladas; Real Academia de Ingeniería, Madrid, Spain: 2012. Available online: http://www.casadellibro.com/libro-tecnologias-para-el-desarrollo-humano-de-las-comunidades-rurales-aisladas/9788495662446/1967038 (accessed on 12 March 2016).
  20. Peters, J.; Sievert, M. Impacts of rural electrification revisited—The African context. J. Dev. Eff. 2016, 8, 327–345. [Google Scholar] [CrossRef] [Green Version]
  21. Dinkelman, T. The effects of rural electrification on employment: New evidence from South Africa. Am. Econ. Rev. 2011, 101, 3078–3108. [Google Scholar] [CrossRef] [Green Version]
  22. Bhattacharyya, S.C.; Palit, D. A critical review of literature on the nexus between central grid and off-grid solutions for expanding access to electricity in {Sub}-{Saharan} {Africa} and {South} {Asia}. Renew. Sustain. Energy Rev. 2021, 141, 110792. Available online: https://linkinghub.elsevier.com/retrieve/pii/S1364032121000873 (accessed on 2 June 2021). [CrossRef]
  23. González García, A.; Pérez Arriaga, I. Sistemas integrados de suministro eléctrico aislado y conectado a la red: Innovación y gobernanza organizativa para el acceso universal. Econ. Ind. 2018, 101–112. Available online: https://repositorio.comillas.edu/xmlui/handle/11531/27501 (accessed on 18 April 2022).
  24. Come Zebra, E.I.; van der Windt, H.J.; Nhumaio, G.; Faaij, A.P.C. A review of hybrid renewable energy systems in mini-grids for off-grid electrification in developing countries. Renew. Sustain. Energy Rev. 2021, 144, 111036. [Google Scholar] [CrossRef]
  25. Peters, J.; Sievert, M.; Toman, M.A. Rural electrification through mini-grids: Challenges ahead. Energy Policy 2019, 132, 27–31. [Google Scholar] [CrossRef] [Green Version]
  26. Pérez-Arriaga, I.J.; Stoner, R.; Rahnama, R.; Lee, S.J.; Jacquot, G.; González-García, A.; Amatya, R.; Brusnahan, M.; Dueñas, P. A Utility Approach to Accelerate Universal Electricity Access in Less Developed Countries: A Regulatory Proposal; WP-IIT-18-010A; Instituto de Investigación Tecnológica, Universidad Pontificia Comillas: Madrid, Spain, 2018. [Google Scholar]
  27. Alliance for Rural Electrification and USAID. Hybrid Mini-Grids for Rural Electrification: Lessons Learned; Alliance for Rural Electrification and USAID: Brussels, Belgium, 2011.
  28. Bhattacharyya, S.C. Mini-grids for the base of the pyramid market: A critical review. Energies 2018, 11, 813. [Google Scholar] [CrossRef] [Green Version]
  29. Alam, M.; Bhattacharyya, S. Decentralized Renewable Hybrid Mini-Grids for Sustainable Electrification of the Off-Grid Coastal Areas of Bangladesh. Energies 2016, 9, 268. Available online: https://www.mdpi.com/1996-1073/9/4/268 (accessed on 10 November 2016). [CrossRef] [Green Version]
  30. INENSUS. Clean Energy Mini-Grid Policy. Fast Tracking Rural Electrification through Accelerated and Precise Mini-Grid Policy Formulation; INENSUS: Vienna, Austria, 2020; Available online: https://www.unido.org/sites/default/files/files/2021-03/CEMG_Development_Guide_EN.pdf (accessed on 9 January 2022).
  31. Moner-Girona, M.; Bódis, K.; Huld, T.; Kougias, I.; Szabó, S. Universal access to electricity in Burkina Faso: Scaling-up renewable energy technologies. Environ. Res. Lett. 2016, 11. [Google Scholar] [CrossRef]
  32. Antonanzas-Torres, F.; Antonanzas, J.; Blanco-Fernandez, J. State-of-the-Art of Mini Grids for Rural Electrification in West Africa. Energies 2021, 14, 990. Available online: https://www.mdpi.com/1996-1073/14/4/990/htm (accessed on 5 June 2022). [CrossRef]
  33. Knuckles, J. Business models for mini-grid electricity in base of the pyramid markets. Energy Sustain. Dev. 2016, 31, 67–82. [Google Scholar] [CrossRef]
  34. Ciller, P.; Lumbreras, S. Electricity for all: The contribution of large-scale planning tools to the energy-access problem. Renew. Sustain. Energy Rev. 2020, 120, 109624. [Google Scholar] [CrossRef]
  35. Drouin, C. Geospatial Cost Drivers in Computer-aided Electrification Planning: The Case of Rwanda. Master’s Thesis, Massachusetts Institute of Technology, Department of Mechanical Engineering. MIT, Cambridge, MA, USA, 2018. [Google Scholar]
  36. Ciller, P.; de Cuadra, F.; Lumbreras, S. Optimizing Off-Grid Generation in Large-Scale Electrification-Planning Problems: A Direct-Search Approach. Energies 2019, 12, 4634. Available online: https://www.mdpi.com/1996-1073/12/24/4634 (accessed on 12 December 2019). [CrossRef] [Green Version]
  37. IIT-Comillas. Assistance to the Government of Rwanda to Develop a National Electrification Strategy (NES) and Related Investment Plans. 2017. Available online: https://www.iit.comillas.edu/proyectos/mostrar_proyecto.php.es?nombre_abreviado=RwandaNES17 (accessed on 4 April 2018).
  38. IIT-Comillas. Mozambique Geospatial Options Analysis towards Universal Electrification. 2019. Available online: https://www.iit.comillas.edu/proyectos/mostrar_proyecto.php.en?nombre_abreviado=MIT-NEP-MOZAMBIQUE-2018 (accessed on 27 September 2020).
  39. IIT-Comillas. Least-Cost Electrification Plan of Maluku-Papua Region of Indonesia. 2019. Available online: https://www.iit.comillas.edu/proyectos/mostrar_proyecto.php.es?nombre_abreviado=AsianDB_Indonesia (accessed on 19 December 2020).
  40. IIT-Comillas. Development of the Universal Access to Electricity Strategy in Ecuador, Based on a Georreferenced Electricity Access Plan. 2020. Available online: https://www.iit.comillas.edu/proyectos/mostrar_proyecto.php.es?nombre_abreviado=ECUADOR_PAUNE (accessed on 19 December 2020).
  41. IIT-Comillas. Colombia Sustainable Integrated Electrification Planning. Grid and off-Grid Strategies Assessment. 2021. Available online: https://www.iit.comillas.edu/proyectos/mostrar_proyecto.php.es?nombre_abreviado=MIT_RF_Colombia-21 (accessed on 17 September 2021).
  42. IIT-Comillas. Least-Cost Electrification Study and Mini-Grid Portfolio Readiness Assessment for Pakistan. 2021. Available online: https://www.iit.comillas.edu/proyectos/mostrar_proyecto.php.es?nombre_abreviado=PAKISTAN-PAUNE (accessed on 16 April 2022).
  43. IIT-Comillas. Development of the Universal Access to Electricity Strategy in Bolivia, Based on a Geo-Referenced Electricity Access Plan. 2022. Available online: https://www.iit.comillas.edu/proyectos/mostrar_proyecto.php.es?nombre_abreviado=BOLIVIA-PAUNE (accessed on 16 April 2022).
  44. Morrissey, J. Achieving universal electricity access at the lowest cost: A comparison of published model results. Energy Sustain. Dev. 2019, 53, 81–96. Available online: https://linkinghub.elsevier.com/retrieve/pii/S0973082619308440 (accessed on 20 December 2019). [CrossRef]
  45. Mentis, D.; Howells, M.; Rogner, H.; Korkovelos, A.; Arderne, C.; Zepeda, E.; Siyal, S.; Taliotis, C.; Bazilian, M.; De Roo, A.; et al. Lighting the World: The first application of an open source, spatial electrification tool (OnSSET) on Sub-Saharan Africa. Environ. Res. Lett. 2017, 12, 085003. [Google Scholar] [CrossRef]
  46. Mentis, D.; Welsch, M.; Fuso Nerini, F.; Broad, O.; Howells, M.; Bazilian, M.; Rogner, H. A GIS-based approach for electrification planning—A case study on Nigeria. Energy Sustain. Dev. 2015, 29, 142–150. Available online: http://linkinghub.elsevier.com/retrieve/pii/S0973082615000952 (accessed on 15 August 2018). [CrossRef]
  47. Mentis, D.; Andersson, M.; Howells, M.; Rogner, H.; Siyal, S.; Broad, O.; Korkovelos, A.; Bazilian, M. The benefits of geospatial planning in energy access—A case study on Ethiopia. Appl. Geogr. 2016, 72, 1–13. Available online: http://www.sciencedirect.com/science/article/pii/S0143622816300522 (accessed on 27 March 2018). [CrossRef]
  48. Korkovelos, A.; Mentis, D.; Bazilian, M.; Howells, M.; Saraj, A.; Fayez Hotaki, S.; Missfeldt-Ringius, F. Supporting Electrification Policy in Fragile States: A Conflict-Adjusted Geospatial Least Cost Approach for Afghanistan. Sustainability 2020, 12, 777. Available online: https://www.mdpi.com/2071-1050/12/3/777 (accessed on 11 February 2020). [CrossRef] [Green Version]
  49. ESMAP, The World Bank Group. Global Electrification Platform. Available online: https://electrifynow.energydata.info/ (accessed on 9 May 2022).
  50. Korkovelos, A.; Khavari, B.; Sahlberg, A.; Howells, M.; Arderne, C. The Role of Open Access Data in Geospatial Electrification Planning and the Achievement of SDG7. An OnSSET-Based Case Study for Malawi. Energies 2019, 12, 1395. Available online: https://www.mdpi.com/1996-1073/12/7/1395 (accessed on 24 June 2019). [CrossRef] [Green Version]
  51. Peña Balderrama, J.G.; Balderrama Subieta, S.; Lombardi, F.; Stevanato, N.; Sahlberg, A.; Howells, M.; Colombo, E.; Quoilin, S. Incorporating high-resolution demand and techno-economic optimization to evaluate micro-grids into the Open Source Spatial Electrification Tool (OnSSET). Energy Sustain. Dev. 2020, 56, 98–118. Available online: https://linkinghub.elsevier.com/retrieve/pii/S0973082620302180 (accessed on 18 December 2020). [CrossRef]
  52. Pinedo Pascua, I. Intigis: Propuesta Metodológica Para la Evaluación de Alternativas de Electrificación Rural Basada en SIG. Ph.D. Thesis, School of Agricultural Engineering, Universidad Politécnica de Madrid, Madrid, Spain, 2012. (In Spanish). [Google Scholar]
  53. Parshall, L.; Pillai, D.; Mohan, S.; Sanoh, A.; Modi, V. National electricity planning in settings with low pre-existing grid coverage: Development of a spatial model and case study of Kenya. Energy Policy 2009, 37, 2395–2410. Available online: http://linkinghub.elsevier.com/retrieve/pii/S0301421509000561 (accessed on 30 January 2014). [CrossRef]
  54. Kemausuor, F.; Adkins, E.; Adu-Poku, I.; Brew-Hammond, A.; Modi, V. Electrification planning using Network Planner tool: The case of Ghana. Energy Sustain. Dev. 2014, 19, 92–101. Available online: http://linkinghub.elsevier.com/retrieve/pii/S097308261300121X (accessed on 2 May 2014). [CrossRef]
  55. Ohiare, S. Expanding electricity access to all in {Nigeria}: A spatial planning and cost analysis. Energy. Sustain. Soc. 2015, 5, 8. Available online: http://www.energsustainsoc.com/content/5/1/8 (accessed on 18 December 2016). [CrossRef] [Green Version]
  56. Fronius, R.; Gratton, M. Rural Electrification Planning Software (LAPER). In Proceedings of the 16th International Conference and Exhibition on Electricity Distribution (CIRED 2001), Amsterdam, Netherlands, 18–21 June 2001; Available online: http://www.cired.net/publications/cired2001/5_20.pdf (accessed on 16 November 2017).
  57. Soler, R.; Thomas, F.; Dhaiby, N.-E.; Bakri, M. Optimizing the place of PV systems in rural electrification planning in Morocco. In Proceedings of the 3rd World Conference on Photovoltaic Energy Conversion 2003, Osaka, Japan, 11–18 May 2003; Volume 3, pp. 2574–2577. [Google Scholar]
  58. NREL. PVWatts® Calculator. 2017. Available online: http://pvwatts.nrel.gov/ (accessed on 1 April 2022).
  59. Armand, M.; Axmann, P.; Bresser, D.; Copley, M.; Edström, K.; Ekberg, C.; Guyomard, D.; Lestriez, B.; Novák, P.; Petranikova, M.; et al. Lithium-ion batteries—Current state of the art and anticipated developments. J. Power Sources 2020, 479, 228708. [Google Scholar] [CrossRef]
  60. Xi, J.Y.; Jia, R.; Li, W.; Wang, J.; Bai, F.Q.; Eglitis, R.I.; Zhang, H.X. How does graphene enhance the photoelectric conversion efficiency of dye sensitized solar cells? An insight from a theoretical perspective. J. Mater. Chem. A 2019, 7, 2730–2740. Available online: https://pubs.rsc.org/en/content/articlehtml/2019/ta/c8ta06872k (accessed on 4 June 2022). [CrossRef]
  61. Nayak, P.K.; Mahesh, S.; Snaith, H.J.; Cahen, D. Photovoltaic solar cell technologies: Analysing the state of the art. Nat. Rev. Mater. 2019, 4, 269–285. Available online: https://www.nature.com/articles/s41578-019-0097-0 (accessed on 4 June 2022). [CrossRef]
  62. OpenStreetMap Contributors. Planet Dump Retrieved from https://planet.osm.org. OpenStreetMap. 2015. Available online: https://www.openstreetmap.org/ (accessed on 11 April 2022).
  63. Sirko, W.; Kashubin, S.; Ritter, M.; Annkah, A.; Bouchareb, Y.S.E.; Dauphin, Y.; Keysers, D.; Neumann, M.; Cisse, M.; Quinn, J. Continental-Scale Building Detection from High Resolution Satellite Imagery. arXiv 2021, arXiv:2107.12283. Available online: https://arxiv.org/abs/2107.12283v2 (accessed on 19 April 2022).
  64. Lee, S.J. Adaptive Electricity Access Planning. Master’s Thesis, Massachusetts Institute of Technology, Cambridge, MA, USA, 2018. [Google Scholar]
  65. Uganda Bureau of Statistics. The National Population and Housing Census 2014—Main Report; Uganda Bureau of Statistics: Kampala, Uganda, 2016.
  66. Min, B.; Gaba, K.M.; Sarr, O.F.; Agalassou, A. Detection of rural electrification in Africa using DMSP-OLS night lights imagery. Int. J. Remote Sens. 2013, 34, 8118–8141. Available online: https://www.tandfonline.com/doi/abs/10.1080/01431161.2013.833358 (accessed on 19 April 2022). [CrossRef]
  67. Arderne, C.; Zorn, C.; Nicolas, C.; Koks, E.E. Predictive mapping of the global power system using open data. Sci. Data 2020, 7, 19. Available online: https://www.nature.com/articles/s41597-019-0347-4 (accessed on 19 April 2022). [CrossRef]
  68. Uganda Energy Sector GIS Working Group. Electricity Access per Subcounty. UBOS 2016. 2017. Available online: https://uetcl.maps.arcgis.com/apps/View/index.html?appid=9cbf01357d234df5b979e53dfa9aa5c2 (accessed on 27 April 2022).
  69. Amatya, R.; Barbar, M.; Brusnahan, M.; Ciller, P.; de Cuadra, F.; Dueñas, P.; Ellman, D.; González-García, A.; Lee, S.J.; Mateo, C.; et al. Computer-Aided Electrification Planning in Developing Countries: The Reference Electrification Model (REM); Working Paper IIT WP 18 112-A; Instituto de Investigación Tecnológica, Universidad Pontificia Comillas: Madrid, Spain, 2018; Available online: https://www.iit.comillas.edu/publicacion/mostrar_publicacion_working_paper.php.en?id=347 (accessed on 10 April 2019).
  70. Li, V. The Local Reference Electrification Model: Comprehensive Decision-Making Tool for the Design of Rural Microgrids; Massachusetts Institute of Technology: Cambridge, MA, USA, 2016; Available online: https://dspace.mit.edu/handle/1721.1/104828?show=full (accessed on 25 October 2017).
  71. Santos Pérez, F.J. Metodología de Ayuda a la Decisión Para la Electrificación Rural Apropiada en Países en Vías de Desarrollo. Ph.D. Thesis, School of Engineering, Universidad Pontificia Comillas, Madrid, Spain, 2015. (In Spanish). [Google Scholar]
  72. Murphy, P.M.; Twaha, S.; Murphy, I.S. Analysis of the cost of reliable electricity: A new method for analyzing grid connected solar, diesel and hybrid distributed electricity systems considering an unreliable electric grid, with examples in Uganda. Energy 2014, 66, 523–534. [Google Scholar] [CrossRef]
  73. Borofsky, Y. Towards a Transdisciplinary Approach to Rural Electrification Planning for Universal Access in India. Master’s Thesis, Massachusetts Institute of Technology, Cambridge, MA, USA, 2015. Available online: https://dspace.mit.edu/bitstream/handle/1721.1/98731/920874583-MIT.pdf?sequence=1&isAllowed=y (accessed on 10 April 2019).
  74. Javadpour, A.; Wang, G.; Rezaei, S.; Chen, S. Power Curtailment in Cloud Environment Utilising Load Balancing Machine Allocation. In Proceedings of the IEEE SmartWorld, Ubiquitous Intelligence & Computing, Advanced & Trusted Computing, Scalable Computing & Communications, Cloud & Big Data Computing, Internet of People and Smart City Innovation, Guangzhou, China, 8–12 October 2018; pp. 1364–1370. Available online: https://ieeexplore.ieee.org/stamp/stamp.jsp?tp=&arnumber=8560215 (accessed on 4 June 2022). [CrossRef]
  75. Kupzig, N. Power Outages, Firm Productivity, and Generator Ownership in East Africa. J. African Bus. 2022, 1–21. [Google Scholar] [CrossRef]
Figure 1. This image shows a small area of the Southern Service Territory is a sample of the geospatial results of the Reference Electrification Model. The map shows part of a grid extension with an MV/LV transformer, MV and LV lines connecting different customers, part of a minigrid LV line, the location of community and productive standalone solar systems, and several domestic solar kits.
Energies 15 04517 g001
Figure 2. Probabilistic inferences from the MIT/IIT Gaussian process model are shown as a contour plot. Also shown are (blue crosses) non−electrified survey points and (red crosses) electrified survey points.
Energies 15 04517 g002
Figure 3. Electrified buildings estimated with (blue) Gaussian process model and (yellow) nighttime lighting imagery, overlaid on (purple points) non-electrified buildings. Already existing network (black) and sector borders (green) are included.
Energies 15 04517 g003
Figure 4. Uganda—Southern Service Territory main topographical features: water bodies and relief (source: https://maps.for.free.com, accessed on 9 January 2022).
Energies 15 04517 g004
Figure 5. Sample days of hourly demand profile in kWh for (a) Residential (b) Community and (c) Productive customers.
Energies 15 04517 g005
Figure 6. Uganda Southern Service Territory Reference Scenario. Map of Minigrid Generation sites (green), Grid-Extension MV/LV transformers (blue), and Standalone systems (orange for residential DC kits, red for community and pink for productive AC Solar Systems). The inset image shows a smaller region showing MV (red) and LC (blue) grid extension lines, LV (green) minigrid lines.
Energies 15 04517 g006
Figure 7. Share of (a) total customers and (b) overnight investment for the Reference Scenario showing minigrids (green), grid extension (blue) and standalone systems (orange).
Energies 15 04517 g007
Figure 8. CAPEX, OPEX, upstream energy, and CNSE breakdown of the annual cost of supply (annuity in USD/year) per electrification mode.
Energies 15 04517 g008
Figure 9. Total (a) and per customer (b) overnight investment in grid, generation, and connections cost breakdown.
Energies 15 04517 g009
Figure 10. Individual cost of service USD/year) for grid extension (blue) and minigrids (green), and ratio for each cluster of minigrid and grid extension cost (black).
Energies 15 04517 g010
Figure 11. Map of minigrid sites showing the ratio of GE cost vs. MG cost (red MG ratio of 2× to 5×, down to Blue when the ratio is close to ×1). The dot area is proportional to the number of customers in the minigrid. The existing MV network lines are shown in black.
Energies 15 04517 g011
Figure 12. Classification of the minigrid market according to the MG/GE cost of service ratio.
Energies 15 04517 g012
Figure 13. Histogram of frequency of MG and total number of customers per MG size bin.
Energies 15 04517 g013
Figure 14. Heat map of MG and location of service centers for O&M.
Energies 15 04517 g014
Figure 15. Breakdown of individual minigrid costs in the Reference Scenario.
Energies 15 04517 g015
Figure 16. The pipeline of projects (horizontal axis) with accumulated investment (green, right vertical axis) and accumulated connections expected (orange, left vertical axis).
Energies 15 04517 g016
Figure 17. Sensitivity analysis systems map and share of electrification modes for (a) 90% Grid Reliability Reference Scenario; (b) 85% Grid Reliability Scenario; (c) 97% Grid Reliability Scenario; (d) Double Demand Scenario, and (e) 100% Grid Extension Scenario (both (d) and (e) with the reference 90% grid reliability).
Energies 15 04517 g017aEnergies 15 04517 g017b
Figure 18. (i) Energy dispatch of sample days for a minigrid with an aggregated demand of 26 kWp and 83 MWh/year, and (ii) its average hourly reliability through the whole year.
Energies 15 04517 g018
Figure 19. (a) Reference Scenario with 90% Grid Reliability; (b) 85% Grid Reliability Scenario; and (c) 97% Grid Reliability Scenario costs of service breakdown including CAPEX, OPEX, Upstream Energy, and CNSE.
Energies 15 04517 g019
Figure 20. (a) Reference Scenario and (d) Double Demand Scenario cost of service breakdown including CAPEX, OPEX, Upstream Energy and CNSE.
Energies 15 04517 g020
Figure 21. (a) Reference Scenario and (e) 100% Grid Extension Scenario cost of service breakdown including CAPEX, OPEX, Upstream Energy and CNSE.
Energies 15 04517 g021
Table 1. Average annual energy demand per customer type.
Customer TypesEnergy Demand2022 (kWh/year)2030 (kWh/year)
ResidentialNon-critical62.8675.25
Critical158.31189.51
Total221.17264.76
CommunityNon-critical00
Critical696.39833.63
Total696.39833.63
ProductiveNon-critical126.62151.57
Critical307.13367.66
Total433.75319.23
Table 2. Summary of results for the Universal Access Least-Cost Reference Scenario. Share of customers, cost of service (CAPEX and OPEX), cost of non-served energy, investment, and energy supply characteristics per electrification mode.
Results Summary Uganda SST 90GRELMinigridStandaloneGrid
Extension
All
Number of Customers297,08883,363118,029498,480
Fraction of Customers59.60%16.72%23.68%100.00%
Annuity CAPEX Per Customer (USD/year)148.38116.1352.66120.32
Annuity OPEX Per Customer (USD/year)19.9135.6655.9631.08
Annuity Upstream Energy Per Customer (USD/year)--25.506.04
Annuity TOTEX Per Customer (USD/year)168.29151.79134.12157.44
Annual Non-served Energy Cost Per Customer (USD/year)2.6545.4623.4614.74
Total Annuity TOTEX (USD/year)49,996,85012,653,61915,830,02678,480,495
Total Non-served Energy Cost (USD/year)786,2193,789,7882,769,1817,345,188
Fraction of Demand Served (p.u.)98.70%82.80%90.00%94.00%
Cost Per kWh (Total Supply Cost) (USD/kWh)0.46800.51300.40900.4610
Annual Energy (MWh/year)108,218.0029,747.0042,993.00180,958.00
Annual Energy Per Customer (kWh/year)364.26356.84364.26363.02
Investment Cost (USD)348,959,32857,095,26159,645,021465,699,610
Investment Cost Per Customer (USD)1174.60684.90505.34934.24
Publisher’s Note: MDPI stays neutral with regard to jurisdictional claims in published maps and institutional affiliations.

