 Henry Reyer
 Michael Oster
 Dörte Wittenburg
 Eduard Murani
 Siriluck Ponsuksili
 Klaus Wimmers
- 1Genomics Unit, Institute for Genome Biology, Leibniz Institute for Farm Animal Biology, Dummerstorf, Germany
- 2Biomathematics and Bioinformatics Unit, Institute of Genetics and Biometry, Leibniz Institute for Farm Animal Biology, Dummerstorf, Germany
- 3Functional Genome Analysis Unit, Institute for Genome Biology, Leibniz Institute for Farm Animal Biology, Dummerstorf, Germany
- 4Department of Animal Breeding and Genetics, Faculty of Agricultural and Environmental Sciences, University of Rostock, Rostock, Germany
Blood values of calcium (Ca), inorganic phosphorus (IP), and alkaline phosphatase activity (ALP) are valuable indicators for mineral status and bone mineralization. The mineral homeostasis is maintained by absorption, retention, and excretion processes employing a number of known and unknown sensing and regulating factors with implications on immunity. Due to the high inter-individual variation of Ca and P levels in the blood of pigs and to clarify molecular contributions to this variation, the genetics of hematological traits related to the Ca and P balance were investigated in a German Landrace population, integrating both single-locus and multi-locus genome-wide association study (GWAS) approaches. Genomic heritability estimates suggest a moderate genetic contribution to the variation of hematological Ca (N = 456), IP (N = 1049), ALP (N = 439), and the Ca/P ratio (N = 455), with values ranging from 0.27 to 0.54. The genome-wide analysis of markers adds a number of genomic regions to the list of quantitative trait loci, some of which overlap with previous results. Despite the gaps in knowledge of genes involved in Ca and P metabolism, genes like THBS2, SHH, PTPRT, PTGS1, and FRAS1 with reported connections to bone metabolism were derived from the significantly associated genomic regions. Additionally, genomic regions included TRAFD1 and genes coding for phosphate transporters (SLC17A1–SLC17A4), which are linked to Ca and P homeostasis. The study calls for improved functional annotation of the proposed candidate genes to derive features involved in maintaining Ca and P balance. This gene information can be exploited to diagnose and predict characteristics of micronutrient utilization, bone development, and a well-functioning musculoskeletal system in pig husbandry and breeding.
Introduction
In the body, the homeostasis of calcium (Ca) and phosphorus (P) is maintained to ensure appropriate conditions for bone mineralization, energy utilization, nucleic acid synthesis, and signal transduction of each individual cell and the entire organism. Molecular pathways involved in these processes are regulated by numerous factors such as the parathyroid hormone (PTH), vitamin D, fibroblast growth factor 23 (FGF23), and the calcium sensing receptor (CASR). The vitamin D system, for example, is able to alter the transcription rates of thousands of target genes via vitamin D responsive elements (VDRE) located in their respective promoter region (Pike et al., 2010). In addition, other transcription factors like MafB have been identified as involved in the regulation of mineral homeostasis by orchestrating intracellular signaling (Morito et al., 2018). However, especially with regard to P homeostasis, particular mechanisms of sensing and regulation as well as underlying molecules are still unclear (Chande and Bergwitz, 2018).
In pigs of the same age, the Ca and P levels in the blood differ considerably between different breeds or even within breeds, suggesting a genetic contribution to the variability of mineral concentrations (Rodehutscord, 2001; Hittmeier et al., 2006; Just et al., 2018b). However, reliable heritability estimates for the blood values of Ca and P for pigs are not yet available. An initial understanding of the genetics of the Ca and P homeostasis in pigs was demonstrated by Bovo et al. (2016), who were able to identify quantitative trait loci (QTL) for serum Ca on SSC8, 11, 12, and 13 and for P on SSC2 and 7 in an Italian Large White population. The proposed list of candidate genes emphasizes that the drivers of Ca and P homeostasis are in fact partly unknown and that several factors remain to be identified. Consistently, a recent study on the genetic contribution of well-known functional candidate genes on Ca and P homeostasis in pigs showed only a small contribution of these major players to the genetic variance (Just et al., 2018b). Further insights into the role of genetics in the regulation of Ca and P homeostasis can be derived from human studies on kidney health and bone metabolism (reviewed by Lederer, 2014). Specifically, a GWAS for humans with European ancestry revealed several QTL regions containing functional candidate genes such as FGF23, SLC34A1, and CAST, whereby the most prominent SNPs are located in nearby regions representing other genes (Kestenbaum et al., 2010). Notably, the highest significant association of this particular study was identified for ALPL, an alkaline phosphatase that hydrolyzes phosphate compounds at alkaline pH and is involved in bone mineralization (Kestenbaum et al., 2010).
The current GWAS used blood-derived proxies for the Ca and P homeostasis including Ca, inorganic phosphorus (IP), alkaline phosphatase activity (ALP), and the respective Ca/IP ratio. Specifically, ALP represents the total activity of all ALP isoforms in blood and is indicative of endogenous P requirements. The hematological Ca and IP levels as well as the calcium/phosphorus (Ca/P) ratio represent the variation of the strictly regulated mineral balance. In addition, genomic data from pigs were used to estimate genomic heritability and genetic correlations for all analyzed traits. Their availability would be an important prerequisite for assessing the potential of breeding strategies that include (i) the efficient use of Ca and P for bone formation and growth processes, (ii) the prevention of ectopic mineralization of peripheral tissues (hypercalcification), and (iii) the reduction of environmental impacts of livestock farming.
Materials and Methods
Pig Population and Phenotypes
Animal care and sampling were carried out in accordance with the guidelines of the German Law of Animal Protection. All protocols have been approved by the Animal Care Committee of the Leibniz Institute for Farm Animal Biology (FBN). Compliance with all relevant international, national, and/or institutional guidelines for the care and use of animals was ensured.
For this study, 1,053 commercial German Landrace pigs have been raised on standard diets (Gesellschaft für Ernährungsphysiologie, 2006) for fattening pigs. The purebred pigs originated from nine different farms in the area of Mecklenburg-Western Pomerania (Germany) and were fattened either at the Institutes pig farm or in the performance test station Jürgenstorf (Germany). Animals had an average age of 163.8 ± 15.5 days (mean ± SD; individual ages ranged from 127 to 222 days). The population consists of 73 males, 355 females, and 625 castrates, which were sired by 64 boars. Pigs had ad libitum access to feed and water. Pigs were killed by electrical stunning followed by exsanguination in the experimental slaughterhouse of FBN Dummerstorf. At slaughter, liver samples were collected for DNA extraction. Additionally, trunk blood was sampled for serum and plasma preparation. For the first batch of animals (N = 590), IP was measured using heparin plasma. Serum samples were available for the second batch of pigs (N = 463) in which levels of Ca, IP, and ALP were measured. Blood chemistry analyses were performed using commercial available assays on a Fuji Dri-Chem 4000i (FujiFilm, Minato, Japan). Phenotypes were transformed to follow a normal distribution by Johnson SU using JMP Genomics 7.0 (SAS Institute, Cary, NC, United States).
Genotyping and Data Preparation
Based on DNA obtained from liver samples, genotyping of the 1053 animals was performed using the 60k porcine SNP bead chip (Illumina, San Diego, CA, United States). Data files were analyzed using the GenomeStudio software (Illumina, version 2.0.3) for clustering of genotypes and initial quality control (sample call rate >95% and SNP call rate >95%). Afterward, missing values in the genotype matrix were imputed with fastPHASE (Scheet and Stephens, 2006). Settings for imputation included 10 runs of the EM algorithm with 50 iterations each and the scanning for genotype errors option was enabled. Genotype errors were excluded by discarding autosomal SNPs with estimated error rate above 10% (Scheet and Stephens, 2006). SNP sequences of the bead chip were mapped to pig genome assembly 11.1 (accessed on July 13, 2017) using Bowtie2 (version 2.2.6). Markers not mapping to autosomes in the current genome assembly were dropped. Additional filtering of markers was applied at the level of Hardy–Weinberg equilibrium (P > 1 × 10⁻⁶) and, after excluding individuals with missing phenotypes for the corresponding trait, for minor allele frequency (MAF <0.03). In total, the number of markers was reduced from 61,565 to 47,946 (IP; 1049 pigs), 47,302 (Ca; 456 pigs), 47,298 (Ca/P; 455 pigs), and 47,258 (ALP; 439 pigs), respectively.
Estimation of Genetic and Phenotypic Parameters
Bayesian estimates of genomic heritability were obtained with the help of trait-specific univariate models using the R package BGLR version 1.0.5 (Pérez and de Los Campos, 2014). The polygenic effect was included in the model employing the genomic relationship matrix (VanRaden, 2008). Furthermore, models included age of pigs as covariate and, additionally, batch effect for IP. Genetic correlations between traits were analyzed in a bivariate model using the MTM package version 1.0.01. Due to the different total number of animals available for a particular trait, the smallest common overlap in the marker set was used in each trait combination. For both estimation of genomic heritability and genetic correlation, analysis parameters have been set to default values. The output from 200,000 iteration steps was used. Diagnosis of convergence was done using the Gelman–Rubin function applied to additional Markov chains; it is implemented in the coda R package version 0.19-1. The potential scale reduction factor was <1.1, indicating convergence (Gelman and Rubin, 1992). After the first 50,000 iterations were discarded as burn-in phase, the average genomic heritability ± SD and correlation coefficient ± SD were estimated from the remaining iterations. Moreover, phenotypic correlations, expressed as Pearson coefficients, were calculated for the traits transformed to follow a normal distribution as described above.
Genome-Wide Association Study
Both single-locus and multi-locus genome-wide association study (GWAS) approaches were used in this study to identify genomic regions contributing to the genetic variance of blood Ca, IP, and ALP levels and the Ca/P ratio. The single-locus GWAS was performed using a mixed linear model implemented in JMP Genomics 7.0 (SAS Institute). For all traits, the sire was included as a random effect in the model, which not only accounts for relatedness in the population but also controls for environmental factors (farm effect). Additionally, the age of pigs was used as a covariate in the model. The analysis of IP further included batch as fixed effect. Due to the linkage disequilibrium between markers, the analysis of a single locus was not necessarily independent from other loci, which was taken into account by using SimpleM to estimate the number of independent tests (Gao et al., 2008). SimpleM revealed a number of 19,773 independent tests for the entire dataset. Accordingly, significance thresholds were set at 1/19,773 [-log10 (P-value) = 4.30] for suggestive significance and 0.05/19,773 [-log10 (P-value) = 5.60] for genome-wide significance (Lander and Kruglyak, 1995). To investigate model fit, a quantile–quantile (QQ) plot based on the observed P-values was plotted for each trait. Manhattan plot representation of genome-wide results was created with the postGWAS R package (version 1.11-2) (Hiersche et al., 2013). Data for specific genomic regions were visualized using LocusZoom (version 1.3) (Pruim et al., 2010).
The multi-locus GWAS was based on a Bayesian variable selection approach (Bayes B; Meuwissen et al., 2001) implemented in the BGLR package (Pérez and de Los Campos, 2014). In agreement with single-locus GWAS, models included age of pigs as covariate for all traits and batch effect for the analysis of IP and sire. A total of 200,000 cycles of the Gibbs sampler were performed after convergence diagnosis (as described above), with the first 25% of the iterations discarded as a burn-in phase. For the Bayes B algorithm, the prior proportion of non-zero marker effects was set to 0.5% for the analysis of Ca and Ca/P, as previously described (Reyer et al., 2015; Fernando et al., 2017). Based on genomic heritability estimates, which were considerably higher for IP and ALP, the prior proportion of non-zero marker effects was increased to 1% for these traits. In total, 468.2 (IP), 199.0 (Ca), 192.0 (Ca/P), and 433.0 (ALP) markers were considered on average in each cycle of the Gibbs sampler. Other parameters were set to default values. Bayes factors (BFs) were calculated based on the posterior probability of inclusion for each marker and expressed as the quotient between posterior and prior odds ratio (Karkkainen and Sillanpaa, 2012). Markers with a BF > 10 were considered as having decisive evidence according to Jeffreys (1998).
Data Integration and Candidate Genes
Based on the combination of results from single- and multi-locus GWAS, genes were explored in the proximity of significant markers (closest genes in each direction plus their overlapping genes) using the R package postGWAS. To select genes linked to SNPs, linkage disequilibrium (LD) between markers was calculated based on the genotype matrix using the snp2gene function (Hiersche et al., 2013). Those genes were revealed, which were in LD with SNPs significantly associated with a trait. Specifically, genes were considered where the maximum LD between one of the gene-representing SNP and the significantly associated SNP was above 0.6. A window of 1 Mb around the significantly associated SNP was examined. In addition, the 95% confidence interval of a QTL region was estimated using the likelihood approach proposed by Li (2011). The names of genes that belong to these intervals were extracted. Subsequently, all resulting gene names (from proximity and LD analyses and CI intervals) were converted into human orthologous gene identifiers using the biomaRt R package (version 2.34.2). Gene lists were combined for all traits and passed to the ClueGO (v2.5.1) Cytoscape (v3.6.1) plugin for analysis of gene ontology (GO) (Bindea et al., 2009). The following databases were included: GO cellular component, GO molecular function, and REACTOME Pathways (all accessed on June 6, 2018). ClueGO settings were as follows: GO tree interval of 2–8, cutoff of more than or equal to 4 genes and 3% associated genes, and kappa score (κ) = 0.4. GO term enrichment was tested with a two-sided hypergeometric test considering a Benjamini–Hochberg adjusted P-value ≤0.05. In addition, the QTL regions revealed from both GWAS approaches were manually screened for positional (in proximity to highest significantly associated SNPs) and functional (known function related to the trait of interest) candidate genes. Therefore, genomic information and functional annotation of genes were retrieved from Ensembl2 and GeneCards – the human gene database3, respectively (Stelzer et al., 2016).
Results
All traits showed a considerable variation in the examined population of German Landrace pigs (Table 1). Phenotypic correlations between levels of Ca, IP, and ALP were all positive and showed a low to moderate magnitude (Table 2). A high negative phenotypic correlation coefficient was found between IP and Ca/P, while the correlation between Ca and Ca/P was moderate and positive. Almost no correlation was revealed between ALP and Ca/P. Regarding the genetic correlation, values were positive for Ca-IP, IP-ALP, and Ca-Ca/P, whereas correlations for ALP-Ca/P and ALP-Ca were negative (Table 2). The corresponding correlation coefficients showed a low to moderate magnitude. However, high standard deviations of these estimations indicate a high degree of uncertainty. According to the phenotypic level, the highest negative genetic correlation was observed between IP and Ca/P at -0.62. In general, all traits showed a moderate genomic heritability (Table 2). The highest genomic heritability estimates were obtained for ALP (h2 = 0.54) and IP (h2 = 0.42). Estimates for Ca and Ca/P were considerably lower at 0.27.
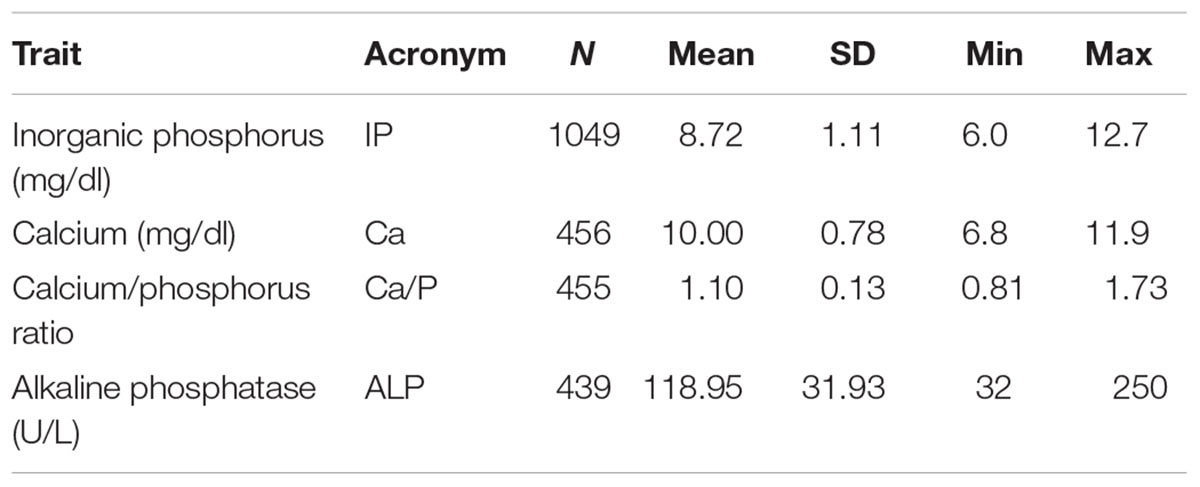
Table 1. Descriptive statistics of blood traits in German Landrace pigs.
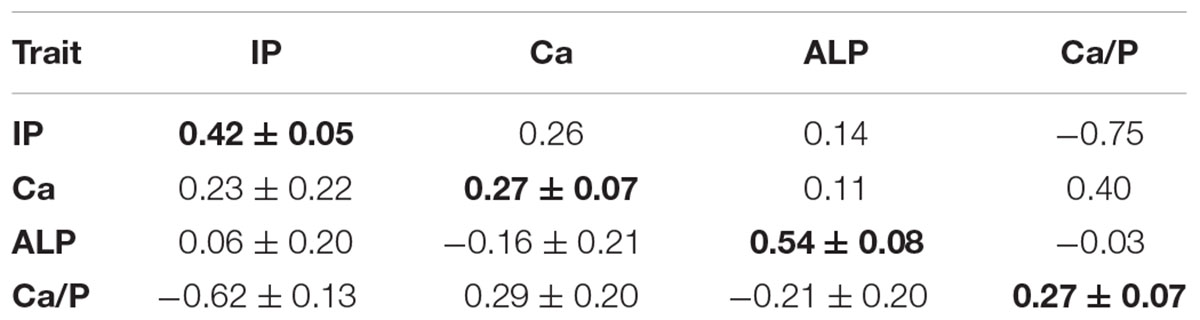
Table 2. Estimates of genetic (below the diagonal) and phenotypic (above the diagonal) correlation coefficients and the genomic heritability (diagonal, bold) for concentrations of IP, Ca, ALP, and Ca/P ratio.
The most promising genomic regions associated with IP were identified on SSC6 and 14 (Table 3). Specifically, the QTL on SSC6 at 110 Mb was commonly indicated by the two GWAS approaches. Genes closest to the highest significantly associated marker, ASGA0090429 (P-value = 5.24, BF = 14.22), are GATA Binding Protein 6 (GATA6) and RB Binding Protein 8 (RBBP8) (Figure 1). ALGA0036329, obtained by multi-locus analysis, showed the highest BF (BF = 27.3) and was also located in this QTL region on SSC6. Single-locus analysis revealed ALGA0077099 (rs80988848) as the highest significantly associated SNP for IP (P-value = 6.24). It mapped to BICD Family Like Cargo Adaptor 1 (BICDL1) at 40.12 Mb on SSC14, whereas the indicated genomic region harbors several putative candidate genes (Supplementary Figure 1). Additionally, the QTL region located on SSC1 between 109.6 and 111.2 Mb was indicated by five significantly associated SNPs, whereas MARC0015485 reached genome-wide significance (P-value = 5.89). The SNP is located between Vacuolar Protein Sorting 13 Homolog C (VPS13C) and RAR Related Orphan Receptor A (RORA).
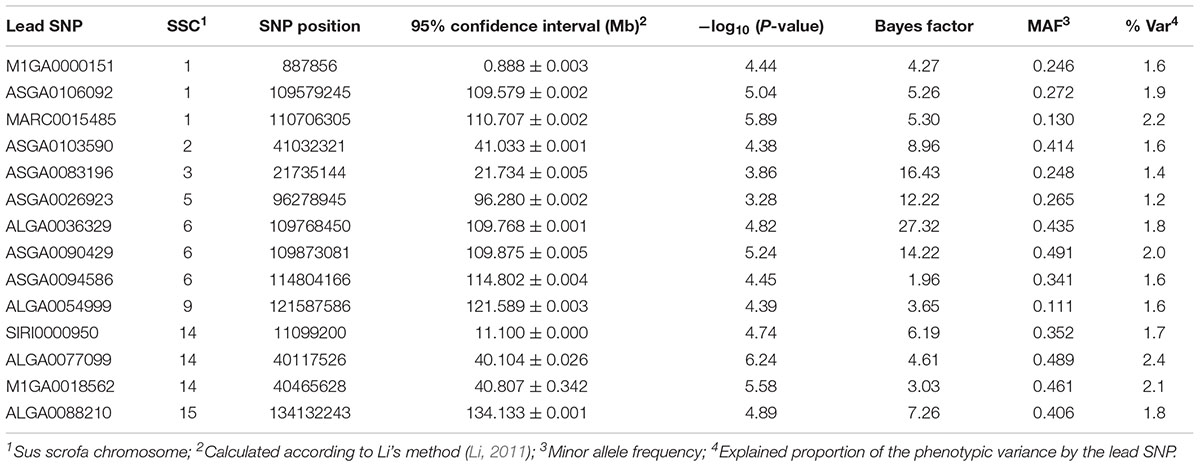
Table 3. Genomic regions and corresponding lead SNPs identified by single- and multi-locus GWAS for levels of IP.
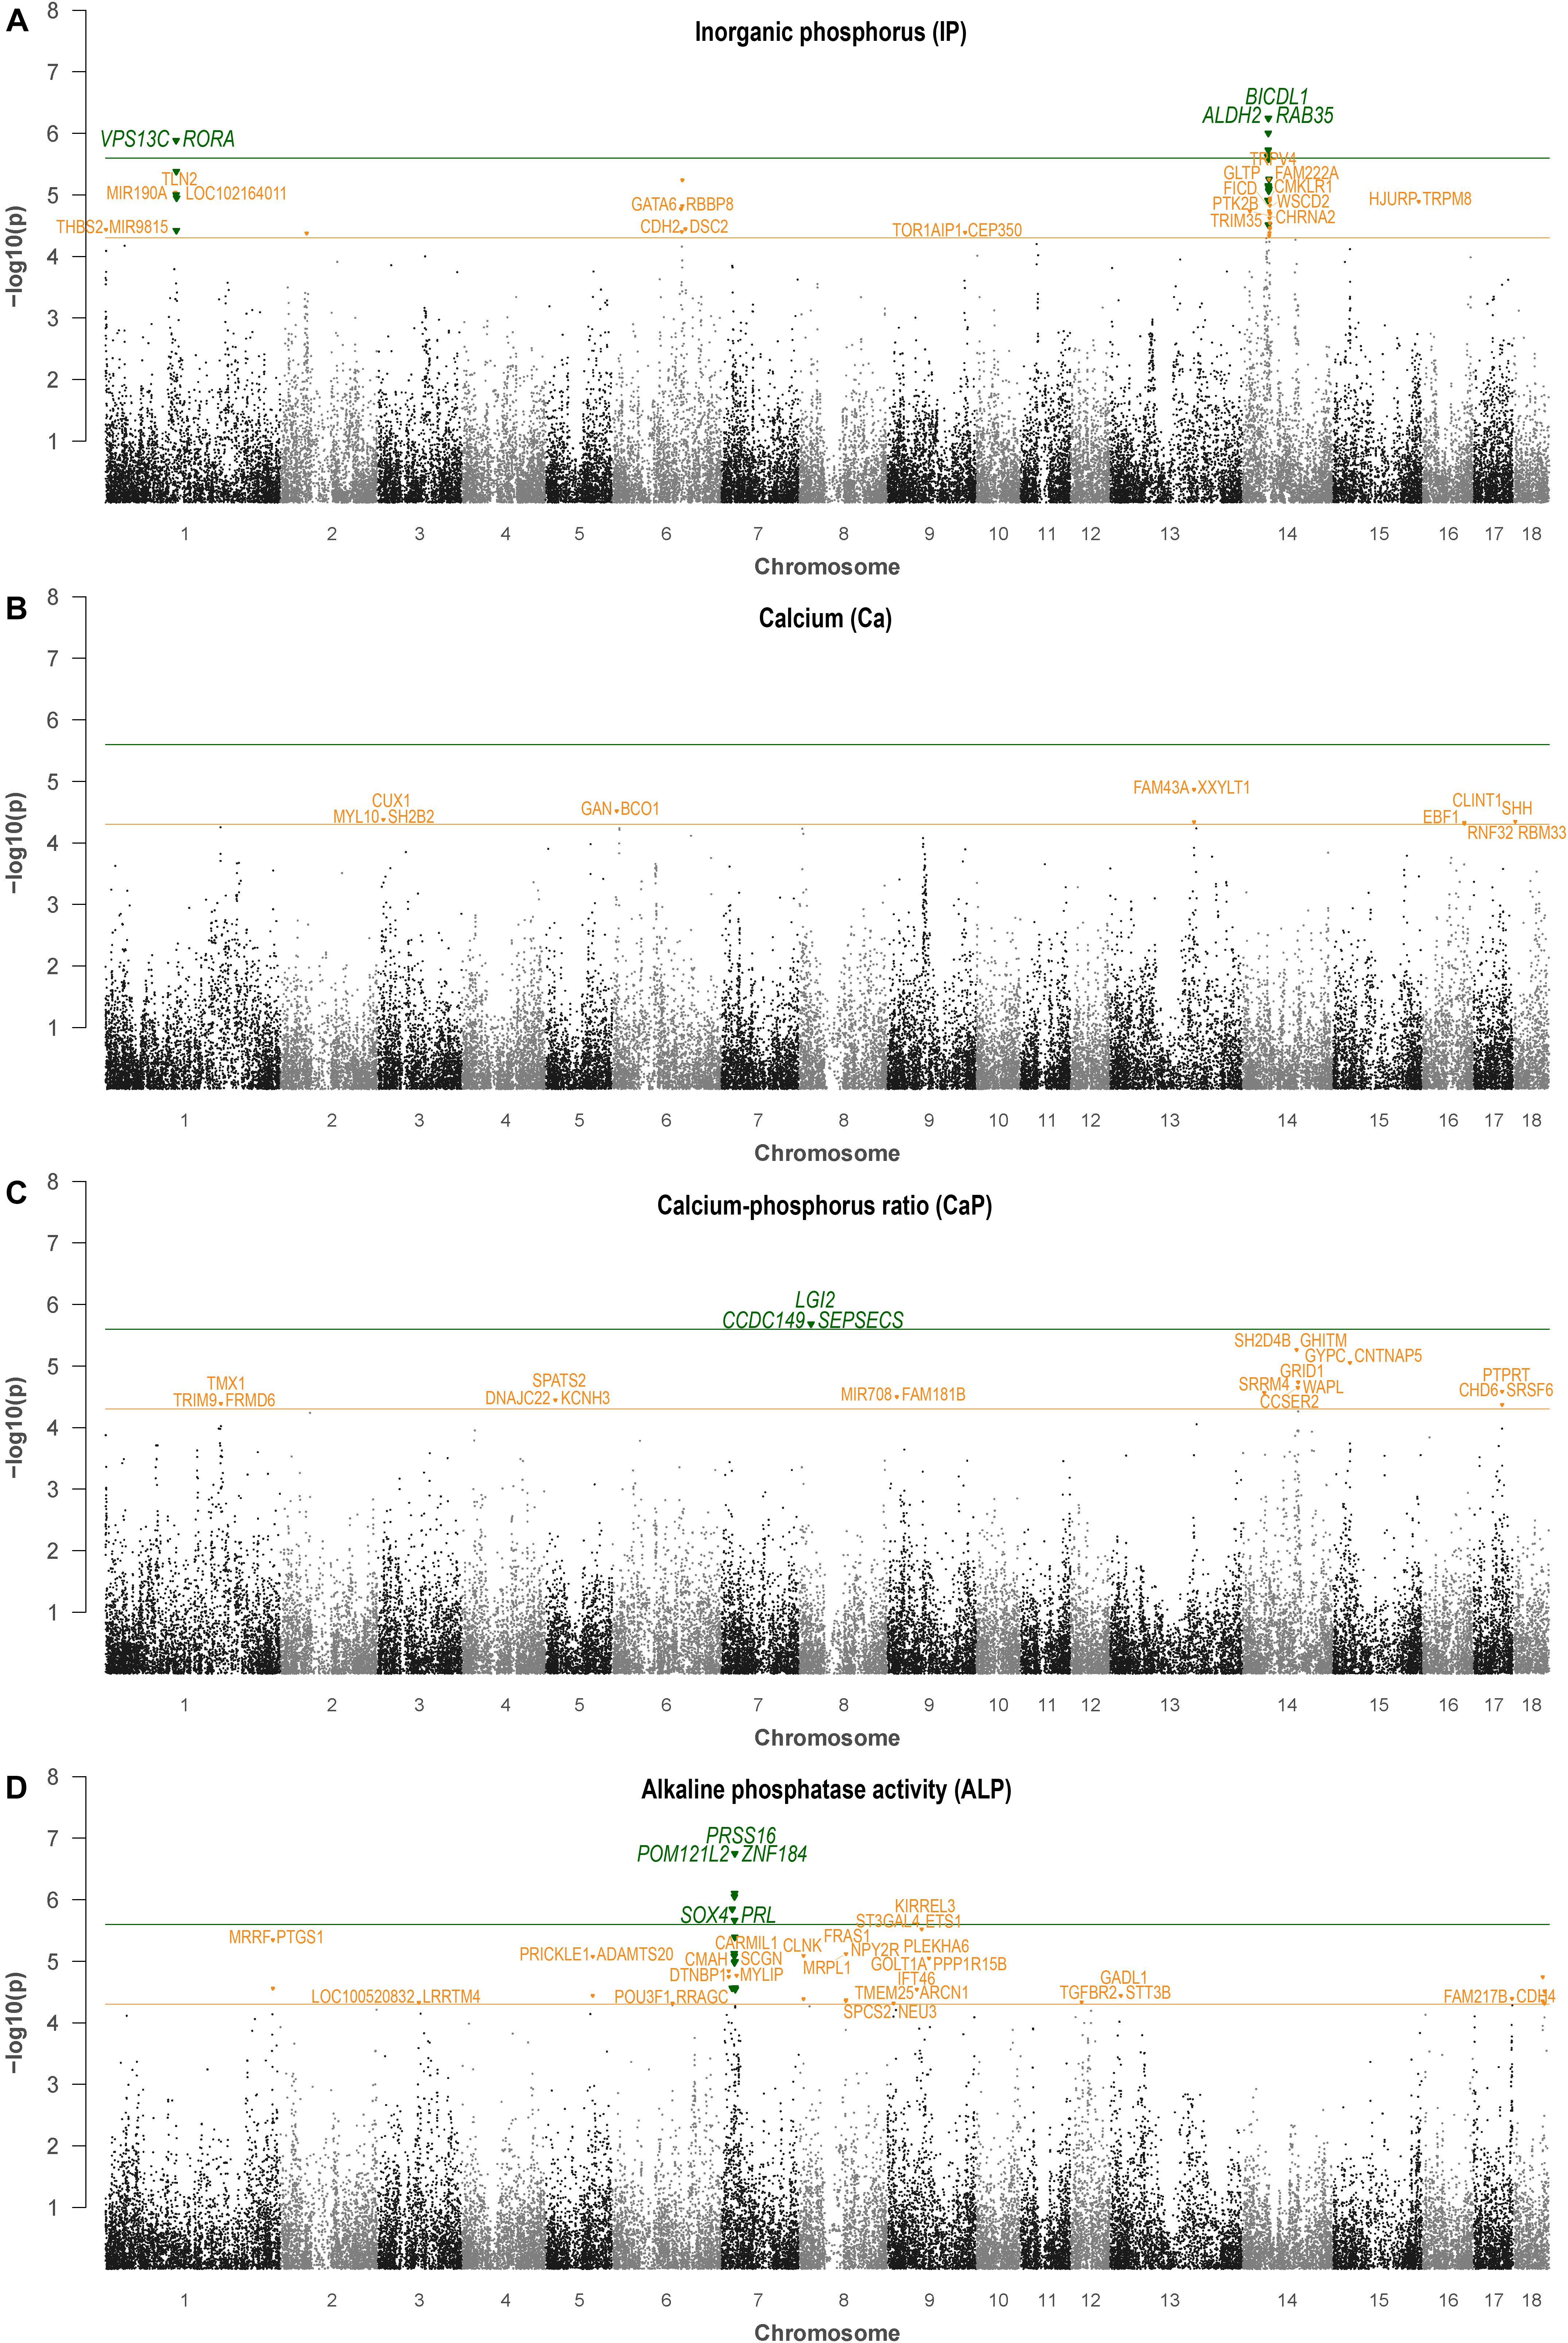
Figure 1. Single-locus association analysis of hematological levels of IP (A), calcium (B), calcium/phosphorus ratio (C), and ALP (D). Orange and green lines indicate suggestive significance and genome-wide significance, respectively. Genes located closest to the lead SNP of a 2-Mb genomic windows are indicated.
For Ca, genomic regions were identified on SSC3, 6, 11, 13, 16, and 18 (Table 4). Exclusively, the QTL on SSC6 at 7 Mb was identified by the two GWAS approaches, with the highest significantly associated SNP, ALGA0104738 (P-value = 4.52, BF = 10.48) located between Gigaxonin (GAN) and Beta-Carotene Oxygenase 1 (BCO). Two additional regions on SSC6, at 10.8 and 11.1 Mb, were indicated by multi-locus analysis bordered by ENSSSCG00000039747 (metalloproteinase inhibitor 1-like) and Contactin Associated Protein Like 4 (CNTNAP4). Three SNPs, which reached the suggestive significant level for association with Ca, were highlighted on SSC13 and indicate Family With Sequence Similarity 43 Member A (FAM43A) and Xyloside Xylosyltransferase 1 (XXYLT1) as positional candidate genes.
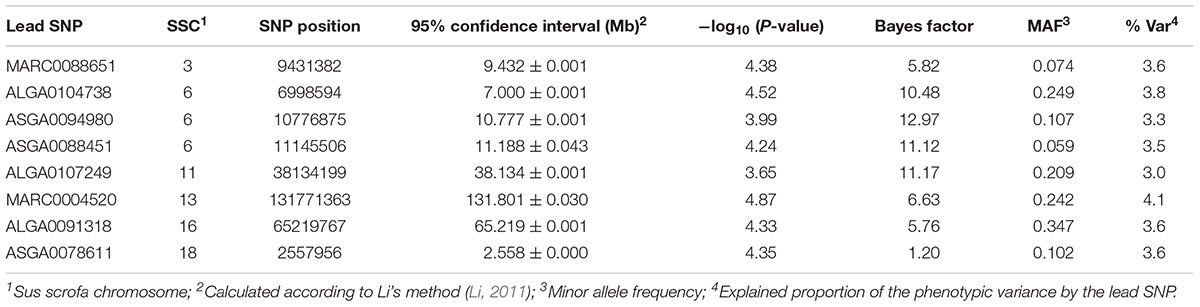
Table 4. Genomic regions and corresponding lead SNPs identified by single- and multi-locus GWAS for serum levels of Ca.
The highest significant association in single-locus analysis for Ca/P was identified on SSC8 (Table 5 and Figure 1). The corresponding SNP ALGA0118376 mapped in intron 6 of Leucine Rich Repeat LGI Family Member 2 (LGI2). Moreover, several significantly associated SNPs were identified on SSC14 at 33 Mb and between 84 and 87 Mb. Respective positional candidate genes are ENSSSCG00000010344 and Glutamate Ionotropic Receptor Delta Type Subunit 1 (GRID1) located around 84.3 and 86.9 Mb. On SSC13, ASGA0056810 showed highest contribution to the genetic variance in multi-locus analysis (BF = 22.4) and mapped in an intronic region of Unc-51 Like Kinase 4 (ULK4). The QTL on SSC17 is indicated by two significantly associated SNP (P-value >4.3, BF > 3) pointing to Protein Tyrosine Phosphatase, Receptor Type T (PTPRT) as candidate.

Table 5. Genomic regions and corresponding lead SNPs identified by single- and multi-locus GWAS for the Ca/P ratio.
SNPs with genome-wide significance in single-locus analysis for ALP were identified on SSC7 at 17.4 and 21.4 Mb (Table 6). Additionally, the region harboring the latter SNP was also indicated by multi-locus analysis. Putative candidate genes located nearby the lead SNPs were SRY-Box 4 (SOX4), prolactin (PRL), POM121 Transmembrane Nucleoporin Like 2 (POM121L2), and Zinc Finger Protein 184 (ZNF184), while the highest significantly associated SNP ALGA0039405 (P-value = 6.75, BF = 17.74) mapped in an intronic region of the Serine Protease 16 gene (PRSS16) (Supplementary Figure 2). Interestingly, in between these QTL at approximately 20.4–20.7 Mb, a cluster of P transporters (SLC17A1–SLC17A3) is located. Further genomic regions with putative effect on ALP were identified at 11.8 and 24.2 Mb also on SSC7. Furthermore, QTL commonly identified by the two GWAS approaches were located on SSC1 (262.4 Mb), SSC5 (74.0 Mb), SSC8 (74.2 Mb), and SSC9 (64.9 Mb). Corresponding positional candidate genes for these QTL are shown in Figure 1. QQ plots for single-locus analyses of all traits are shown in Supplementary Figure 3, which indicate an inflation of P-values. While a similar inflation was observed using a polygenic effect combined with a genomic relationship matrix instead of a sire effect (results not shown), the causal factors for this inflation remain unknown.
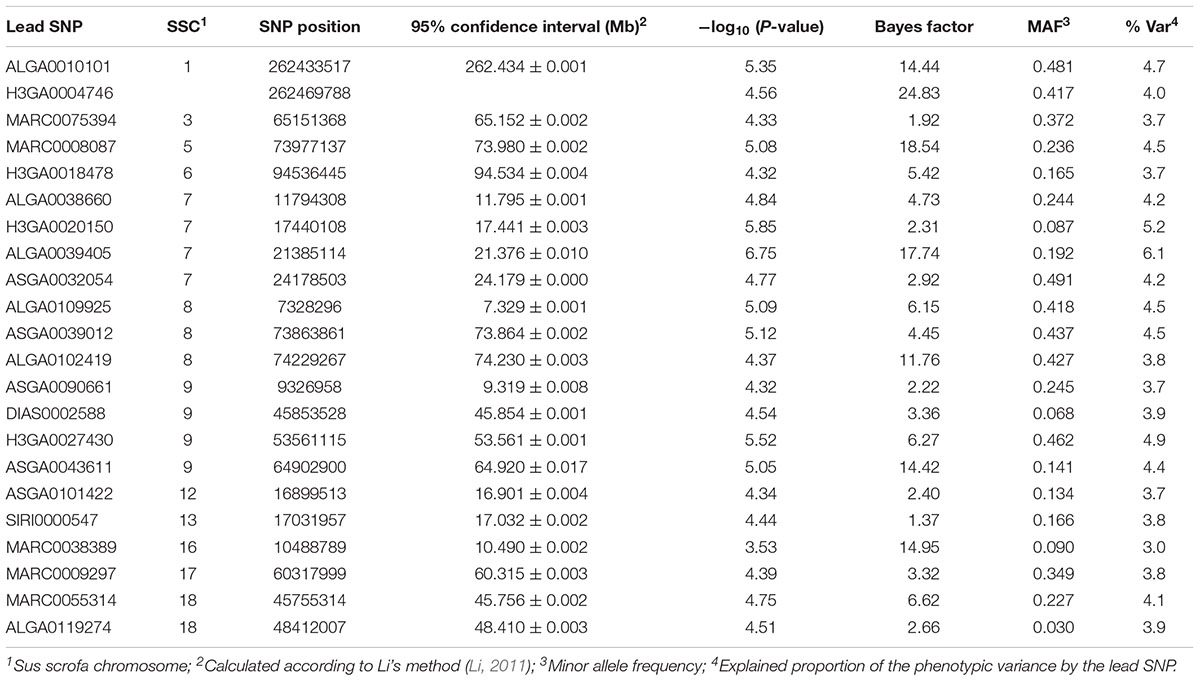
Table 6. Genomic regions and corresponding lead SNPs identified by single- and multi-locus GWAS for serum ALP.
For data integration and analysis of GO, a list of genes was derived from single- and multi-locus GWAS. Therefore, genes located in the 95% confidence intervals of QTL regions and genes that are in LD with significantly associated SNPs were considered. A list of 191 candidate genes was obtained and used for GO term analysis. In total, 61 GO terms reached statistical significance (adjusted P-value ≤0.05) and clustered in 7 GO groups (Figure 2). The largest group was mainly formed by genes of the histone cluster family, which resulted in enriched GO terms such as “chromatin organization,” “nucleosome,” and “protein–DNA complex.” Genes located in QTL regions for traits related to Ca–P balance were further enriched for GO terms such as “cell–cell communication,” “phosphatidylinositol bisphosphate binding,” and “smooth muscle contraction.” Interestingly, due to the cluster of solute carriers located in the QTL region on SSC7, “solute:sodium symporter activity” was also enriched.
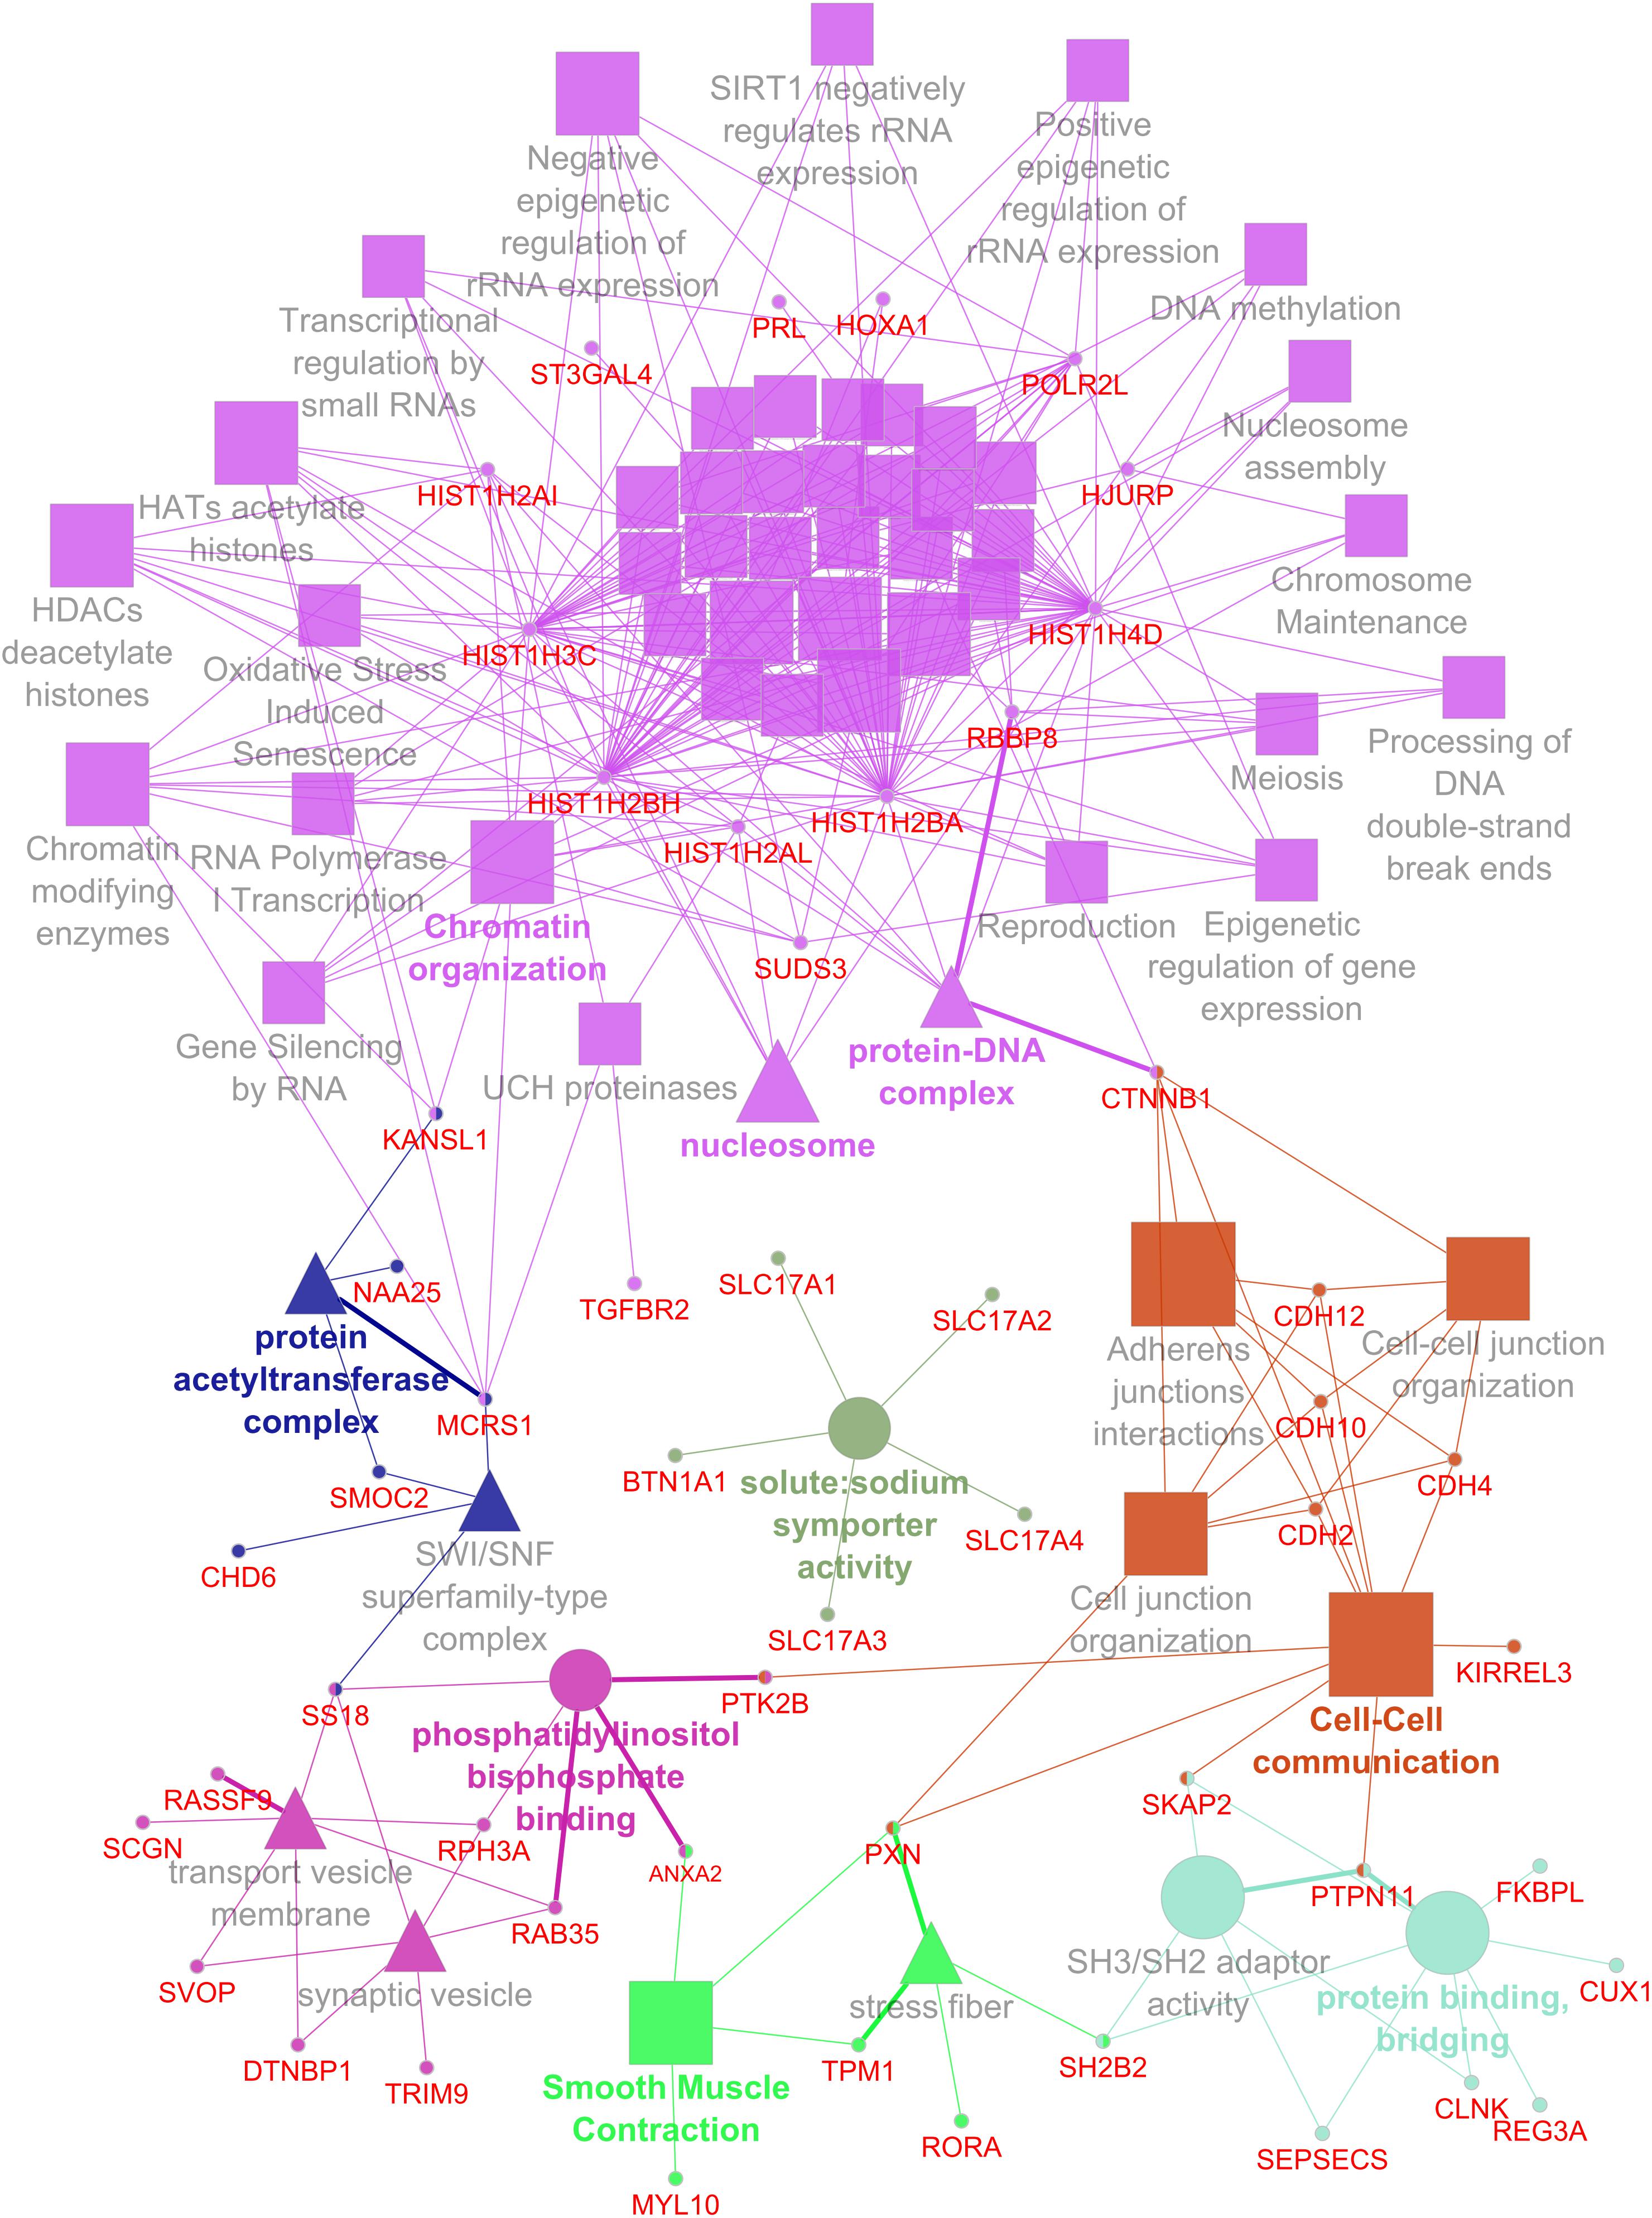
Figure 2. Network representing enriched GO terms and linked genes based on QTL for hematological traits related to the calcium and phosphorus homeostasis.
Discussion
Genomic Heritability of Phenotypes Related to Ca and P Homeostasis
In human diagnostics, hematological parameters can be determined easily and are a valuable tool for assessing the patient’s state of health. Parameters related to the Ca and P balance are used to indicate mineral status and bone turnover and to contribute to the diagnosis of bone health, vascular calcification, and kidney diseases (Kestenbaum et al., 2010). Corresponding phenotypes are derived from large cohorts and allow comprehensive studies to elucidate the genetic contribution to the variation in these traits. In terms of heritability, the estimates for serum Ca (0.33) and IP (0.58) obtained from these human studies correspond well in magnitude to the genetic contribution investigated in this study for pigs (Hunter et al., 2002). For IP, the estimate of heritability was almost twice as high as for serum Ca in both species, which might indicate conserved mechanisms to maintain Ca and P homeostasis within narrow ranges. The serum ALP activity, which showed the highest genomic heritability among the traits analyzed in this study, was also attributed a high heritability in humans (Nielson et al., 2012). Moreover, breed-specific differences in ALP were mentioned for cattle (Cole et al., 2001). The total activity of ALP in serum is indicative for concentrations of local ALP isoforms from liver, muscle, bone, and bile duct. Its serum values point to abnormalities of the corresponding tissues; e.g., with regard to bones, it serves as early marker for increased bone turnover (Hoffmann and Solter, 2008). The genomic heritability estimate for the Ca/P ratio of the analyzed pigs was moderate and in similar magnitude to genomic heritability for Ca. Ca/P is proposed as an indicator of bone mobilization and reflects the P status (Anderson et al., 2017). Indeed, Ca/P showed high negative correlation with IP and moderate positive correlation with Ca at the phenotypic and genotypic level. This is very much in accordance with correlations between IP and the serum Ca × P product in humans (Yokoyama, 2008). Ca and IP showed a moderate positive phenotypic and genetic correlation in this study, albeit the estimated genetic correlation is accompanied by some uncertainty as indicated by the high standard deviations of these estimations. The positive correlations reflect the organism’s efforts to maintain both Ca and IP levels, as well as their ratio, at a certain level (Feher, 2017). Moreover, the common genetics of both traits, indicated by the moderate genetic correlation, is, to some extent, expected considering the complex interplay between both minerals and the numerous factors that affect their regulation such as PTH, FGF23, and vitamin D metabolites (Shaker and Deftos, 2018).
Genomic Regions Associated With Hematological Traits Related to the Ca and P Balance
Existing genome-wide analyses in different species indicate mainly positional candidate genes with not yet known function in Ca and P homeostasis (Reiner et al., 2009; Kestenbaum et al., 2010; Bovo et al., 2016; Van Goor et al., 2016). Notably, taking into account the QTL intervals derived from a human meta-analysis, at least some functional candidate genes such as CASR, FGF23, ALPL, and SLC34A1 are included (Kestenbaum et al., 2010). In pigs, even the targeted association analysis of obvious candidate genes involved in Ca and P regulation could not demonstrate significant contributions to the phenotypic variability (Just et al., 2018b). Similarly, in the current GWAS, none of the leading SNPs of the QTL point to positional candidate genes that are hitherto known to be major players in the regulation of Ca and P homeostasis. Nevertheless, the current study revealed several QTL regions for the analyzed traits, which partly overlap with genomic regions from pig QTL database. Specifically, porcine genome regions with a contribution to the traits analyzed have been previously mapped on different chromosomes (Supplementary Table 1; Reiner et al., 2009; Yoo et al., 2012; Bovo et al., 2016; Just et al., 2018b). Interestingly, despite the physiological relationship within mineral homeostasis, only few overlapping genomic regions between the individual traits have been identified.
Candidate Genes Associated With IP Levels
Promising candidate genes for IP, due to their proximity and linkage to leading SNPs, are BICDL1 and Ras-related protein Rab-35 (RAB35) on SSC14 (Supplementary Figure 1). According to current knowledge, both BICDL1 and RAB35 are involved in the regulation of neurite outgrowth. Indeed, processes involved in the extension of neurons are dependent on Ca entries and phosphorylation events (Sutherland et al., 2014). However, whether changes in these processes are detectable at blood level is questionable. In addition, RAB35 is a key regulator of intracellular membrane transport and involved in endocytosis. The same QTL on SSC14 further contains the recently proposed candidate gene TRAF-Type Zinc Finger Domain Containing 1 (TRAFD1) (Just et al., 2018b), but also harbors several other genes demanding the dissection of this QTL to provide further insights. Although the genomic region on SSC6 was the most prominent in the multi-marker analysis for IP, the positional candidate genes (GATA6 and RBBP8) lack any connection to P homeostasis so far. The candidate gene on SSC1, THBS2, is proposed due to its functions in mediating cell-to-cell interaction and inhibiting angiogenesis, even though the association only reached the suggestive significance level. With respect to Ca and P homeostasis, mice lacking THBS2 showed altered bone growth including increased bone density and cortical thickness (Kyriakides et al., 1998).
Candidate Genes Associated With Ca Levels
For Ca, which showed the lowest genomic heritability among the traits analyzed, only few significantly associated genomic regions were detected by the two GWAS methods. Interestingly, genomic regions on SSC6 and SSC18 border QTL previously identified by microsatellite analysis (Reiner et al., 2009). Based on the positional overlap or proximity to leading SNPs, Cut Like Homeobox 1 (Cux1; SSC3), GAN (SSC6), BCO1 (SSC6), and Sonic Hedgehog (SHH; SSC18) were proposed as positional candidate genes. Considering the currently known functional involvement of these genes, BCO1 and SHH in particular have relations to bone metabolism and health and might be screened for genetic variations. Specifically, BCO1 represents a key enzyme in the metabolism of vitamin A that also affects bone formation and calcium metabolism (Frankel et al., 1986; Binkley and Krueger, 2000). SHH is associated to the initiation of osteogenesis through interactions with bone morphogenetic proteins (BMP) (Yuasa et al., 2002).
Candidate Genes Associated With the Ca/P Ratio
The highest significant association resulting from single- and multi-locus analysis of Ca/P pointed to SSC8 and SSC13 with LGI2 and ULK4 as positional candidate genes. Both genes are reported to be widely expressed in different tissues (see text footnote 3). So far, little is known about the function of LGI2, apart from its association with epilepsies (Limviphuvadh et al., 2010). ULK4 has several functions in the brain including involvement in neuronal cell proliferation and cell-cycle regulation, whereas functions outside the central nervous system are largely unknown (Liu et al., 2017). Considering current functional information, the GWAS results propose Thioredoxin Related Transmembrane Protein 1 (TMX1) on SSC1 and Receptor-Type Tyrosine-Protein Phosphatase T (PTPRT) on SSC17 as the most interesting positional and functional candidate genes. TMX1 is highlighted for its role in the regulation of Ca pumps at the contact surface between mitochondria and endoplasmic reticulum, thus influencing Ca transfer and mitochondria activity (Krols et al., 2016). Tyrosine-Protein Phosphatases are known to play a central role in the formation of bone, specifically in processes such as osteoclast production and function and RANKL-mediated signaling (Hendriks et al., 2013). So far, PTPRT was shown to cause obesity with altered insulin resistance and lowered feed intake in a knock-out mouse model, whereas in cattle, it was associated with meat quality traits (Tizioto et al., 2013; Feng et al., 2014).
Candidate Genes Associated With ALP Activity
Several genomic regions identified for ALP were located in or near the QTL recorded in the QTL database. Specifically, regions on SSC6 and SSC7 overlap with two of the main findings of the study by Reiner et al. (2009). For the QTL on SSC6, ALPL at 79.6 Mb was initially proposed as positional candidate and highlighted for its functional role in bone mineralization in humans (Nielson et al., 2012). The QTL identified in the current study, however, pointed to a region around 94.5 Mb where no known gene mapped. The region on SSC7 harbors the highest significantly associated SNP obtained from single-locus analyses. ALGA0039405 is located in PRSS16, which acts in T-cell development and antigen-presenting pathways and is associated with human diabetes susceptibility (Guerder et al., 2018). Taking into account genes containing at least suggestive significant markers, the list of positional candidates in this QTL region further comprises phosphate transporters (SLC17A1 and SLC17A4) and nucleosome-related genes (HIST1H3E, HIST1H1D, and HMGN4). In particular, the genetics of phosphate transporters are worth analyzing, as these play an important role in the Ca and P balance, even though corresponding polymorphisms have so far only been associated with gout and cholesterol homeostasis (Dehghan et al., 2008; Koyama et al., 2015). Other positional candidate genes mapped in the QTL identified for SSC1 and SSC8. H3GA0004746 on SSC1 revealed the highest BF for ALP and is an intron variant of the Prostaglandin-Endoperoxide Synthase 1 (PTGS1). PTGS1 is involved in prostaglandin metabolism and angiogenesis. Moreover, prostaglandins are known to affect bone metabolism (Blackwell et al., 2010). PTGS1 was recently proposed as a candidate gene for ankylosing spondylitis, a disease accompanied by bone overgrowth (Cortes et al., 2015). The QTL on SSC8 was indicated by both single- and multi-locus GWAS and pointed to Fraser Extracellular Matrix Complex Subunit 1 (FRAS1) as positional candidate. Observations that patients with FRAS1 mutations could have more frequent skull ossification defects (van Haelst et al., 2008) tie in with evidence of an involvement of this gene in familial sclerosing bone dysplasia revealed by exome sequencing (Gannagé-Yared et al., 2014).
Molecular Mechanisms Contributing to the Ca and P Homeostasis
The final interpretation of the gene list derived from the current GWAS suffers due to considerable gaps in the functional annotation of proposed candidate genes. Although most putative positional candidates showed indications of involvement in the Ca and P balance and bone metabolism according to literature, many of these genes are not yet assigned to corresponding GO terms and thus not fully considered. Nevertheless, GO term analysis revealed some obvious terms in connection with the Ca and P balance. Phosphatidylinositol pathways, for example, have previously been described as affected in the context of altered dietary Ca and P intake in pigs (Just et al., 2018a). Similarly, P transporters and the role of Ca in the contraction of smooth muscles are molecular themes that can make a significant contribution to the genetic variance of the traits analyzed (Jiang and Stephens, 1994; Kestenbaum et al., 2010). The large proportion of GO terms related to nucleosomes is mainly driven by the porcine histone gene cluster on SSC7 and reflects the already improved functional annotation available for these genes. The other GO terms emphasized genes that are involved in cellular signaling, cell communication, and posttranslational modification and thus mainly represent intracellular actions of Ca and P. It should be noted that the extracellular Ca concentration is around 20,000 times higher compared to intracellular levels (Clapham, 2007). However, there is evidence that the sensing of intracellular levels might trigger pathways that also affect the extracellular Ca concentration (Bronner, 2001; Just et al., 2018a).
Conclusion
The current study elucidates the genetic parameters of Ca, IP, Ca/P, and ALP and provides a list of positional and functional candidate genes and QTL regions for further dissection. The consideration of the results might prove beneficial in relation to pig breeding for both a more efficient utilization of dietary minerals and for an optimal development and maintenance of the skeletal system.
Data Availability
The raw data supporting the conclusions of this manuscript will be made available by the authors, without undue reservation, to any qualified researcher.
Ethics Statement
This study was carried out in accordance with the recommendations of the German Law of Animal Protection. All protocols have been approved by the Animal Care Committee of the Leibniz Institute for Farm Animal Biology (FBN).
Author Contributions
KW and EM designed and supervised the study. EM and SP collected the data. HR and MO conducted the experiments. HR, DW, and MO analyzed the data. HR wrote the manuscript. All authors reviewed the manuscript.
Funding
This study has received funding from the European Research Area Network on Sustainable Animal Production (ERA-NET SusAn) as part of the Pegasus Project (2817ERA02D). The Leibniz Institute for Farm Animal Biology (FBN) has provided its own funding. The publication of this article was funded by the Open Access Fund of the Leibniz Institute for Farm Animal Biology (FBN).
Conflict of Interest Statement
The authors declare that the research was conducted in the absence of any commercial or financial relationships that could be construed as a potential conflict of interest.
Acknowledgments
We thank Angela Garve, Hannelore Tychsen, and Nicole Gentz for their excellent technical help.
Supplementary Material
The Supplementary Material for this article can be found online at: https://www.frontiersin.org/articles/10.3389/fgene.2019.00590/full#supplementary-material
Footnotes
References
Anderson, S., Kidd, L., Benvenutti, M., Fletcher, M., and Dixon, R. (2017). New candidate markers of phosphorus status in beef breeder cows. Anim. Prod. Sci. 57, 2291–2303. doi: 10.1071/AN17363
Bindea, G., Mlecnik, B., Hackl, H., Charoentong, P., Tosolini, M., Kirilovsky, A., et al. (2009). ClueGO: a cytoscape plug-in to decipher functionally grouped gene ontology and pathway annotation networks. Bioinformatics 25, 1091–1093. doi: 10.1093/bioinformatics/btp101
Binkley, N., and Krueger, D. (2000). Hypervitaminosis A and bone. Nutr. Rev. 58, 138–144. doi: 10.1111/j.1753-4887.2000.tb01848.x
Blackwell, K. A., Raisz, L. G., and Pilbeam, C. C. (2010). Prostaglandins in bone: bad cop, good cop? Trends Endocrinol. Metab. 21, 294–301. doi: 10.1016/j.tem.2009.12.004
Bovo, S., Schiavo, G., Mazzoni, G., Dall’olio, S., Galimberti, G., Calò, D., et al. (2016). Genome-wide association study for the level of serum electrolytes in Italian large white pigs. Anim. Genet. 47, 597–602. doi: 10.1111/age.12459
Bronner, F. (2001). Extracellular and intracellular regulation of calcium homeostasis. Sci. World J. 1, 919–925. doi: 10.1100/tsw.2001.489
Chande, S., and Bergwitz, C. (2018). Role of phosphate sensing in bone and mineral metabolism. Nat. Rev. Endocrinol. 14, 637–655. doi: 10.1038/s41574-018-0076-3
Cole, N., Brown, M., and Phillips, W. (2001). Genetic × environment interactions on blood constituents of Angus, Brahman, and reciprocal-cross cows and calves grazing common bermudagrass or endophyte-infected tall fescue. J. Anim. Sci. 79, 1151–1161. doi: 10.2527/2001.7951151x
Cortes, A., Maksymowych, W. P., Wordsworth, B. P., Inman, R. D., Danoy, P., Rahman, P., et al. (2015). Association study of genes related to bone formation and resorption and the extent of radiographic change in ankylosing spondylitis. Ann. Rheum. Dis. 74, 1387–1393. doi: 10.1136/annrheumdis-2013-204835
Dehghan, A., Kottgen, A., Yang, Q., Hwang, S. J., Kao, W. L., Rivadeneira, F., et al. (2008). Association of three genetic loci with uric acid concentration and risk of gout: a genome-wide association study. Lancet 372, 1953–1961. doi: 10.1016/s0140-6736(08)61343-4
Feher, J. (2017). “Calcium and phosphorus homeostasis I: the calcitropic hormones,” in Quantitative Human Physiology, 2nd Edn, ed. J. Feher (Boston: Academic Press), 924–932. doi: 10.1016/b978-0-12-800883-6.00090-2
Feng, X., Scott, A., Wang, Y., Wang, L., Zhao, Y., Doerner, S., et al. (2014). PTPRT regulates high-fat diet-induced obesity and insulin resistance. PLoS One 9:e100783. doi: 10.1371/journal.pone.0100783
Fernando, R., Toosi, A., Wolc, A., Garrick, D., and Dekkers, J. (2017). Application of whole-genome prediction methods for genome-wide association studies: a Bayesian approach. J. Agric. Biol. Environ. Stat. 22, 172–193. doi: 10.1007/s13253-017-0277-6
Frankel, T. L., Seshadri, M. S., Mcdowall, D. B., and Cornish, C. J. (1986). Hypervitaminosis A and calcium-regulating hormones in the rat. J. Nutr. 116, 578–587. doi: 10.1093/jn/116.4.578
Gannagé-Yared, M.-H., Makrythanasis, P., Chouery, E., Sobacchi, C., Mehawej, C., Santoni, F. A., et al. (2014). Exome sequencing reveals a mutation in DMP1 in a family with familial sclerosing bone dysplasia. Bone 68, 142–145. doi: 10.1016/j.bone.2014.08.014
Gao, X., Starmer, J., and Martin, E. R. (2008). A multiple testing correction method for genetic association studies using correlated single nucleotide polymorphisms. Genet. Epidemiol. 32, 361–369. doi: 10.1002/gepi.20310
Gelman, A., and Rubin, D. B. (1992). Inference from iterative simulation using multiple sequences. Stat. Sci. 7, 457–472. doi: 10.1214/ss/1177011136
Gesellschaft für Ernährungsphysiologie (2006). Empfehlungen zur Energie-und Nährstoffversorgung beim Schwein. Ausschuss für Bedarfsnormen der Gesellschaft für Ernährungsphysiologie. Frankfurt: DLG Verlag.
Guerder, S., Hassel, C., and Carrier, A. (2018). Thymus-specific serine protease, a protease that shapes the CD4 T cell repertoire. Immunogenetics 71, 223–232. doi: 10.1007/s00251-018-1078-y
Hendriks, W. J. A. J., Elson, A., Harroch, S., Pulido, R., Stoker, A., and Den Hertog, J. (2013). Protein tyrosine phosphatases in health and disease. FEBS J. 280, 708–730. doi: 10.1111/febs.12000
Hiersche, M., Rühle, F., and Stoll, M. (2013). Postgwas: advanced GWAS interpretation in R. PLoS One 8:e71775. doi: 10.1371/journal.pone.0071775
Hittmeier, L. J., Grapes, L., Lensing, R. L., Rothschild, M. F., and Stahl, C. H. (2006). Genetic background influences metabolic response to dietary phosphorus restriction. J. Nutr. Biochem. 17, 385–395. doi: 10.1016/j.jnutbio.2005.08.008
Hoffmann, W. E., and Solter, P. (2008). “Diagnostic enzymology of domestic animals,” in Clinical Biochemistry of Domestic Animals, 6th Edn, eds J. Kaneko, J. Harvey, and M. Bruss (Burlington, MA: Elsevier), 351–378. doi: 10.1016/b978-0-12-370491-7.00012-x
Hunter, D., Lange, M., Snieder, H., Macgregor, A., Swaminathan, R., Thakker, R., et al. (2002). Genetic contribution to renal function and electrolyte balance: a twin study. Clin. Sci. 103, 259–265. doi: 10.1042/cs1030259
Jiang, H., and Stephens, N. L. (1994). Calcium and smooth muscle contraction. Mol. Cell. Biochem. 135, 1–9. doi: 10.1007/BF00925956
Just, F., Oster, M., Büsing, K., Borgelt, L., Murani, E., Ponsuksili, S., et al. (2018a). Lowered dietary phosphorus affects intestinal and renal gene expression to maintain mineral homeostasis with immunomodulatory implications in weaned piglets. BMC Genomics 19:207. doi: 10.1186/s12864-018-4584-2
Just, F., Reyer, H., Muráni, E., Ponsuksili, S., Oster, M., and Wimmers, K. (2018b). Genetic variants of major genes contributing to phosphate and calcium homeostasis and their association with serum parameters in pigs. J. Appl. Genet. 59, 1–9. doi: 10.1007/s13353-018-0449-2
Karkkainen, H. P., and Sillanpaa, M. J. (2012). Robustness of Bayesian multilocus association models to cryptic relatedness. Ann. Hum. Genet. 76, 510–523. doi: 10.1111/j.1469-1809.2012.00729.x
Kestenbaum, B., Glazer, N. L., Köttgen, A., Felix, J. F., Hwang, S.-J., Liu, Y., et al. (2010). Common genetic variants associate with serum phosphorus concentration. J. Am. Soc. Nephrol. 21, 1223–1232. doi: 10.1681/ASN.2009111104
Koyama, T., Matsui, D., Kuriyama, N., Ozaki, E., Tanaka, K., Oze, I., et al. (2015). Genetic variants of SLC17A1 are associated with cholesterol homeostasis and hyperhomocysteinaemia in Japanese men. Sci. Rep. 5:15888. doi: 10.1038/srep15888
Krols, M., Bultynck, G., and Janssens, S. (2016). ER–Mitochondria contact sites: a new regulator of cellular calcium flux comes into play. J. Cell Biol. 214, 367–370. doi: 10.1083/jcb.201607124
Kyriakides, T. R., Zhu, Y.-H., Smith, L. T., Bain, S. D., Yang, Z., Lin, M. T., et al. (1998). Mice that lack thrombospondin 2 display connective tissue abnormalities that are associated with disordered collagen fibrillogenesis, an increased vascular density, and a bleeding diathesis. J. Cell Biol. 140, 419–430. doi: 10.1083/jcb.140.2.419
Lander, E., and Kruglyak, L. (1995). Genetic dissection of complex traits: guidelines for interpreting and reporting linkage results. Nat. Genet. 11, 241–247. doi: 10.1038/ng1195-241
Lederer, E. (2014). Regulation of serum phosphate. J. Physiol. 592, 3985–3995. doi: 10.1113/jphysiol.2014.273979
Li, H. (2011). A quick method to calculate QTL confidence interval. J. Genet. 90, 355–360. doi: 10.1007/s12041-011-0077-7
Limviphuvadh, V., Chua, L. L., Eisenhaber, F., Adhikari, S., and Maurer-Stroh, S. (2010). Is LGI2 the candidate gene for partial epilepsy with pericentral spikes? J. Bioinform. Comput. Biol. 8, 117–127. doi: 10.1142/S0219720010004550
Liu, M., Xu, P., O’brien, T., and Shen, S. (2017). Multiple roles of Ulk4 in neurogenesis and brain function. Neurogenesis 4:e1313646. doi: 10.1080/23262133.2017.1313646
Meuwissen, T. H., Hayes, B. J., and Goddard, M. E. (2001). Prediction of total genetic value using genome-wide dense marker maps. Genetics 157, 1819–1829.
Morito, N., Yoh, K., Usui, T., Oishi, H., Ojima, M., Fujita, A., et al. (2018). Transcription factor MafB may play an important role in secondary hyperparathyroidism. Kidney Int. 93, 54–68. doi: 10.1016/j.kint.2017.06.023
Nielson, C. M., Zmuda, J. M., Carlos, A. S., Wagoner, W. J., Larson, E. A., Orwoll, E. S., et al. (2012). Rare coding variants in ALPL are associated with low serum alkaline phosphatase and low bone mineral density. J. Bone Miner. Res. 27, 93–103. doi: 10.1002/jbmr.527
Pérez, P., and de Los Campos, G. (2014). Genome-wide regression & prediction with the BGLR statistical package. Genetics 198, 483–495. doi: 10.1534/genetics.114.164442
Pike, J. W., Meyer, M. B., Martowicz, M. L., Bishop, K. A., Lee, S. M., Nerenz, R. D., et al. (2010). Emerging regulatory paradigms for control of gene expression by 1,25-dihydroxyvitamin D3. J. Steroid Biochem. Mol. Biol. 121, 130–135. doi: 10.1016/j.jsbmb.2010.02.036
Pruim, R. J., Welch, R. P., Sanna, S., Teslovich, T. M., Chines, P. S., Gliedt, T. P., et al. (2010). LocusZoom: regional visualization of genome-wide association scan results. Bioinformatics 26, 2336–2337. doi: 10.1093/bioinformatics/btq419
Reiner, G., Clemens, N., Fischer, R., Köhler, F., Berge, T., Hepp, S., et al. (2009). Mapping of quantitative trait loci for clinical–chemical traits in swine. Anim. Genet. 40, 57–64. doi: 10.1111/j.1365-2052.2008.01804.x
Reyer, H., Hawken, R., Murani, E., Ponsuksili, S., and Wimmers, K. (2015). The genetics of feed conversion efficiency traits in a commercial broiler line. Sci. Rep. 5: 16387. doi: 10.1038/srep16387
Rodehutscord, M. (2001). Current phosphorus evaluation systems for livestock in Germany. Lohmann Inform. 25, 1–8.
Scheet, P., and Stephens, M. (2006). A fast and flexible statistical model for large-scale population genotype data: applications to inferring missing genotypes and haplotypic phase. Am. J. Hum. Genet. 78, 629–644. doi: 10.1086/502802
Shaker, J. L., and Deftos, L. (2018). “Calcium and phosphate homeostasis,” in Endotext, eds L. J. De Groot, G. Chrousos, K. Dungan, K. R. Feingold, A. Grossman, J. M. Hershman, et al. (South Dartmouth, MA: MDText. com, Inc.).
Stelzer, G., Rosen, N., Plaschkes, I., Zimmerman, S., Twik, M., Fishilevich, S., et al. (2016). The GeneCards suite: from gene data mining to disease genome sequence analyses. Curr. Protoc. Bioinform. 54, 1.30.1–1.30.33. doi: 10.1002/cpbi.5
Sutherland, D. J., Pujic, Z., and Goodhill, G. J. (2014). Calcium signaling in axon guidance. Trends Neurosci. 37, 424–432. doi: 10.1016/j.tins.2014.05.008
Tizioto, P. C., Decker, J. E., Taylor, J. F., Schnabel, R. D., Mudadu, M. A., Silva, F. L., et al. (2013). Genome scan for meat quality traits in Nelore beef cattle. Physiol. Genomics 45, 1012–1020. doi: 10.1152/physiolgenomics.00066.2013
Van Goor, A., Ashwell, C. M., Persia, M. E., Rothschild, M. F., Schmidt, C. J., and Lamont, S. J. (2016). Quantitative trait loci identified for blood chemistry components of an advanced intercross line of chickens under heat stress. BMC Genomics 17:287. doi: 10.1186/s12864-016-2601-x
van Haelst, M. M., Maiburg, M., Baujat, G., Jadeja, S., Monti, E., Bland, E., et al. (2008). Molecular study of 33 families with Fraser syndrome new data and mutation review. Am. J. Med. Genet. A 146A, 2252–2257. doi: 10.1002/ajmg.a.32440
VanRaden, P. M. (2008). Efficient methods to compute genomic predictions. J. Dairy Sci. 91, 4414–4423. doi: 10.3168/jds.2007-0980
Yokoyama, K. (2008). The calcium–phosphorus in guidelines for CKD-MBD. Kidney Int. 74:245. doi: 10.1038/ki.2008.175
Yoo, C.-K., Cho, I.-C., Lee, J.-B., Jung, E.-J., Lim, H.-T., Han, S.-H., et al. (2012). QTL analysis of clinical-chemical traits in an F2 intercross between Landrace and Korean native pigs. Physiol. Genomics 44, 657–668. doi: 10.1152/physiolgenomics.00172.2011
Keywords: minerals, genetics, pigs, genome-wide association, genomic heritability, hematological traits
Citation: Reyer H, Oster M, Wittenburg D, Murani E, Ponsuksili S and Wimmers K (2019) Genetic Contribution to Variation in Blood Calcium, Phosphorus, and Alkaline Phosphatase Activity in Pigs. Front. Genet. 10:590. doi: 10.3389/fgene.2019.00590
Received: 16 November 2018; Accepted: 04 June 2019;
Published: 28 June 2019.
Edited by:
David E. MacHugh, University College Dublin, IrelandReviewed by:
Dirk-Jan De Koning, Swedish University of Agricultural Sciences, SwedenMartin Johnsson, Swedish University of Agricultural Sciences, Sweden
Copyright © 2019 Reyer, Oster, Wittenburg, Murani, Ponsuksili and Wimmers. This is an open-access article distributed under the terms of the Creative Commons Attribution License (CC BY). The use, distribution or reproduction in other forums is permitted, provided the original author(s) and the copyright owner(s) are credited and that the original publication in this journal is cited, in accordance with accepted academic practice. No use, distribution or reproduction is permitted which does not comply with these terms.
*Correspondence: Klaus Wimmers, wimmers@fbn-dummerstorf.de