
Abstract
Rapid screening of COVID-19 is key to controlling the pandemic. However, current nucleic acid amplification involves lengthy procedures in addition to the discomfort of taking throat/nasal swabs. Here we describe potential breath-borne volatile organic compound (VOC) biomarkers together with machine learning that can be used for point-of-care screening of COVID-19. Using a commercial gas chromatograph-ion mobility spectrometer, higher levels of propanol were detected in the exhaled breath of COVID-19 patients (N = 74) and non-COVID-19 respiratory infections (RI) (N = 30) than those of non-COVID-19 controls (NC)/health care workers (HCW) (N = 87), and backgrounds (N = 87). In contrast, breath-borne acetone was found to be significantly lower for COVID-19 patients than other subjects. Twelve key endogenous VOC species using supervised machine learning models (support vector machines, gradient boosting machines (GBMs), and Random Forests) were shown to exhibit strong capabilities in discriminating COVID-19 from (HCW + NC) and RI with a precision ranging from 91% to 100%. GBM and Random Forests models can also discriminate RI patients from healthy subjects with a precision of 100%. In addition, the developed models using breath-borne VOCs could also detect a confirmed COVID-19 patient but with a false negative throat swab polymerase chain reaction test. It takes 10 min to allow an entire breath test to finish, including analysis of the 12 key VOC species. The developed technology provides a novel concept for non-invasive rapid point-of-care-test screening for COVID-19 in various scenarios.
Export citation and abstract BibTeX RIS

Original content from this work may be used under the terms of the Creative Commons Attribution 4.0 license. Any further distribution of this work must maintain attribution to the author(s) and the title of the work, journal citation and DOI.
1. Introduction
The COVID-19 pandemic has already caused a significant loss of life, social disruption, and economic standstill [1, 2]. The crisis is still continuing throughout much of the world. As of now, the future of this pandemic remains largely uncertain. Screening and diagnosis of COVID-19 are central to stemming the pandemic. Presently, reverse transcription-polymerase chain reaction (RT-PCR) is mainly used for screening, diagnosis, and hospital discharge of COVID-19 patients by detecting ribonucleic acid (RNA) of the SARS-CoV-2 in biosamples such as throat/nasal swabs, saliva, etc [3, 4]. However, the technique requires lengthy procedures and many bio-agents in addition to the discomfort of taking throat swabs, and sometimes, unfortunately, leads to false negatives [3]. A computed tomography scan is occasionally used to supplement RT-PCR [5, 6]. For asymptomatic patients posing a potential risk of transmitting SARS-CoV-2, the accuracy of the current methods needs to be investigated and validated urgently [3]. Our previous study showed that the RT-PCR test failed to safely discharge 22% of COVID-19 patients who were otherwise still exhaling the SARS-CoV-2 RNA into the air [7]. In addition, some COVID-19 patients have tested positive again for SARS-CoV-2 after hospital discharge using the throat swab protocol [8–10]. Therefore, there is a potential risk of reintroducing the infection source to humans and the environment when discharging COVID-19 patients from isolation solely based on the PCR results [11, 12].
The world is now at a historic cross-road of opening up economies while tolerating the risk of waves of COVID-19 spread. In recent years, exhaled breath has emerged as an important biomarker medium for disease analysis [13–18]. For example, it was shown that ethane and n-pentane detected in the breath are related to lipid peroxidation and oxidative stress levels in the body [19], while acetone in exhaled breath has been shown to be related to the metabolic status of diabetic patients [20]. In addition, volatile organic compounds (VOCs) in the exhaled breath have been used to study asthma, lung cancer, and other diseases [21, 22]. Most recently, VOCs biomarkers showed great potential in diagnosing respiratory infections, especially the COVID-19 [23–26]. However, current studies on breath analysis of COVID-19 lack either the specific identification of key VOC species for the disease [24] or sufficient analysis of the multi-dimensional VOCs data together with other types of respiratory infections through advanced algorithms such as machine learning to provide better classification performance [25, 26]. The SARS-CoV-2 infection might result in characteristic breath-borne VOCs profiles that can be used to rapidly screen COVID-19 [18]. To test this hypothesis, we analyzed the breath-borne VOCs from 191 subjects and their related backgrounds (N = 87) using a commercial breath VOC analyzer. The breath-borne VOCs profiles from these subjects were further used to develop machine learning models to screen COVID-19 patients.
2. Materials and methods
2.1. Exhaled breath VOC collection from subje
A total of 191 subjects were recruited as listed in table 1 during July to September, 2020 in Beijing, including 74 COVID-19 patients, 30 non-COVID-19 patients with respiratory infections (including pneumonia, but no other pathogen tests were performed) (RI); 56 health care workers (HCW) who collected breath samples and conducted epidemiological tracing with COVID-19 patients; and 31 non-COVID-19 controls (NC) who did not have direct contact with COVID-19 patients or their associated environments. All the non-COVID-19 subjects have been tested negative for COVID-19 by RT-PCR using throat and nasal swab samples when providing the breath samples. Also, the HCW and NC did not report any sickness at the time of the study. The demographic, sampling and medical information for these subjects are provided in the supporting information (tables S1–S4) (available online at stacks.iop.org/JBR/15/047104/mmedia). At the time of exhaled breath sampling, 36 of the confirmed COVID-19 patients had symptoms, while 38 of them did not, and the average intervals between disease onset and breath sampling were 30.23 d (95% CI 28.03–32.43) (table S1). Exhaled VOCs were collected with 1 l ALTEF gas sample bags (Jensen Scientific Products Inc., FL, USA), and the VOC loss in the bag over a 48 h period was evaluated (figure S1). The subjects were asked to exhale into the bag using their mouth for 0.5–3 min till it was full. For every single expiration, the first half breath was exhaled to the surroundings, and then the remaining breath was expelled into the bag, thus ensuring that only end-tidal breath, i.e., the alveolar air-more representative for the disease state, was collected. The subjects were asked in advance not to eat and to drink only water if needed, 2 h before the sample collection. They were advised to gargle with water immediately before providing breath samples to avoid possible interferences from food and other oral sources. Background air samples from COVID-19 wards, HCW offices, outdoor and indoor air for NC, and fever clinics for RI were collected for quality control using a gas sampling pump (HDP12-WZ05, Dalian Hede Tech Ltd, Liaoning, China) at a flow rate of 10 l min−1. The COVID-19 patients were recruited by an authorized hospital in treating COVID-19 patients in Beijing. The RI had clinical flu symptoms, but no SARS-CoV-2 infection as tested and diagnosed by two hospitals in Beijing. Recruitment and further analysis inclusion of both HCW and NC subjects in relation to COVID-19 or RI patients were based on no onset of clinical symptoms and no lung problems for at least a 1 month observation period before the sample collection. The collection of exhaled breath samples followed strict biosafety guidelines, and the collected samples were sealed and transferred to a Level-2+ BioSafety lab at Chaoyang District CDC, Beijing for further analysis. As shown in figure 1(A), researchers wore personal protective equipment when analyzing the breath samples, including N95 respirators, protective clothing, isolation clothing, goggles, double-layer latex gloves, and waterproof boot covers following the 'Technical Guidelines for Laboratory Testing of COVID-19' promulgated by the China Centers for Disease Control and Prevention [27]. Additionally, we recruited another four non-COVID-19 subjects to provide five breath samples in 24 h following the same protocols for the above subjects. We analyzed the breath-borne VOCs' variations at different times of the day for four healthy subjects. The four subjects were all RT-PCR tested negative and did not report any sickness at the time of the study. Their demographic, sampling and medical information were provided in table S5.

Figure 1. (A) Breath-borne VOC analysis using GC-IMS in a certified CDC level-2+ biosafety lab; (B) boxplots (from top to bottom: outlier, 95% percentile, mean, median, 5% percentile, and outlier) of acetone in exhaled breath samples collected from different subject groups (74 COVID-19, 87 (HCW + NC), 30 RI, 59 COVID-19 wards, 19 backgrounds of HCW + NC, 9 fever clinics); (C) representative samples of GC-IMS signals of 12 VOC species detected in the exhale breath and background air samples of different groups.
Download figure:
Standard image High-resolution imageTable 1. Distributions of different subjects (COVID-19, HCW, NC, RI) recruited and various backgrounds.
| Subjects | Number of subjects | Paired backgrounds | Number of backgrounds |
|---|---|---|---|
| COVID-19 | 74 | COVID-19 wards | 59 |
| Health care workers (HCW) | 56 | CDC office and outdoor | 10 |
| Non-COVID-19 controls (NC) | 31 | Home and outdoor | 9 |
| Respiratory infections (RI) | 30 | Fever clinics | 9 |
| Total | 191 | Total | 87 |
2.2. Analysis of breath-borne VOCs
VOC (N = 70 species) profiles from these subjects' breath samples (N = 191) and their background air samples (N = 87) were analyzed within 12 h after collection using a BreathSpec GC-IMS (G.A.S. Dortmund, Germany), consisting of a gas chromatograph (GC) and an ion mobility spectrometer (IMS) in Chaoyang CDC Level-2+ BioSafety lab (figure 1(A)). For every breath or background air sample, the analysis was repeated twice with the BreathSpec with a measurement variation of 0.1%–5.0%. Seventy VOC peak areas were detected using VOCal software with a GC-IMS library (v 0.1.1, G.A.S.) based on their retention index and drift time values. The relative quantities of VOCs (70 species) were determined by the peak volumes using the software. For any given sample, the analysis was completed within 10 min. The identification of VOC species was based on retention index and drift time of each peak using the built-in library. Additionally, we used standard samples to further confirm the VOC species identification results from the GC-IMS. Details for the analysis procedure are provided in the supporting information.
2.3. Statistical analysis
The minimal sample size was calculated to be 27, based on the difference in relative levels of major breath-borne VOCs (acetone and propanol) between COVID-19 and NC in our first report [28] under the statistical power (1 − β = 0.90), and significance level (α = 0.05). The data were Box-Cox transformed to fulfill the requirement for parametric test when necessary. Twelve breath-borne VOC species (peaks) were identified by breath-borne levels of at least 1.4 times those of the background air samples in addition to a statistically significant difference (table S6). The differences in VOC levels between breath and their background air samples were analyzed via a paired t-test (if data exhibited a normal distribution by Shapiro–Wilk test) otherwise a Wilcoxon signed rank test was used. Statistical differences in specific relative VOC concentrations between each pair of different subject groups were analyzed via ANOVA or Kruskal–Wallis one way analysis of variance on ranks (if data did not follow a normal distribution or an equal variance test failed after transformation). All statistical tests were performed with Sigmaplot 12.5 (Systat Software Inc., IL, USA). A p-value of less than 0.05 indicated a statistically significant difference at a confidence level of 95%. Besides, the principal component analysis (PCA) in this study was performed using the software R (x64 3.6.2) with package "ggord". The analysis of machine learning was performed using Python version 3.8 (Python Software Foundation, Beaverton, USA) based on an open source 'scikit-learn' toolbox. Three supervised learning methods, support vector machines (SVMs), gradient boosting machines (GBMs) and Random Forests were used to classify the groups based on the high dimensional GC-IMS data. For each model, the data of the tested groups were divided randomly into a training set (train size = 70%) and a test set (test size = 30%). Stratified ten-fold cross-validation is employed on the training set to optimize the parameters. The model performance was estimated by the area under the receiver operator characteristic curve (AUC), recall score (sensitivity), precision (positive predictive value (PPV)), F1 score, accuracy, specificity, negative predictive value (NPV) which are described in details (supporting information). Recall score is the ability of the model to find all the true COVID-19 from the population, precision is the ability of the model to correctly locate a true COVID-19 case; while F1 score is the overall assessment for recall score and precision.
3. Results
Our machine learning models derived from breath-borne VOC data (12 different VOC species) can be readily used to discriminate COVID-19 from other tested subjects (HCW + NC and RI). Among many VOC species, acetone levels were observed to be substantially lower for COVID-19 patients than those of NC, HCW, and RI (figure 1(B); p-values < 0.001). In the contrast, higher levels of propanol were detected in the exhaled breath of COVID-19 patients and non-COVID-19 RI than those of HCW and NC, as shown in tables S7 and S8. The gallery plot of 12 VOC species both identified and non-identified in some selected representative exhaled breath, background air and standard samples are shown in figure 1(C). The species (peaks) were selected manually after merging the test results of all samples into one plot to show the highest signals. Thus, the size of 'chessboard fields' for each species (peaks) was selected to present the maximum of the species (peaks) but not to interfere with other species (peaks) which are adjacent in the plot (figure S2). Over 70 species were identified in breath samples, and 12 of them were determined to be endogenous (the dashed boxes) after comparing with those levels in background air. Notable differences of 12 VOCs among different test groups were shown in the plot. Pure VOC agents were used to verify the identifications VOCs species (propanol, acetone, and acetaldehyde).
In this study, the stability test of breath-borne VOCs in the ALTEF bag revealed, as shown in figure S1, that except for acetic acid, tested VOCs remain over 98% in 6 h and 96% in 12 h. The increased and then decreased recovery rates for some species might result from the absorption and release by water condensate in the breath. The relatively fixed pattern of sampling and analysis schedule in this study possibly reduced the variations of VOCs in the sampling bags. As shown in figure 2, the VOC profiles from exhaled breath were significantly different from those background air. In this study, the breath samples are properly transported and timely handled to reduce the influences of loss or formation of specific VOCs species. Nonetheless, online measurement of breath-borne VOCs is preferred in the future.
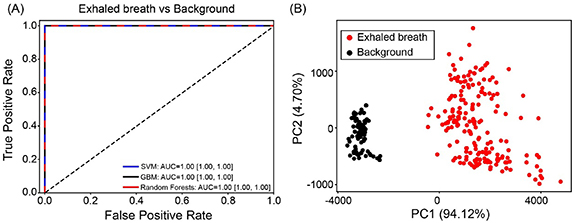
Figure 2. (A) Receiver operator characteristic (ROC) curve of machine learning classification of VOCs profiles in exhaled breath from all subjects in the second campaign and their background air; (B) PCA ordinations of VOCs profiles in exhaled breath and background air. PC1 and PC2 are the first and second principal components. The VOCs species involved in the PCA analysis were 12 species (peaks) which were shown to be significantly higher in breath than in background air.
Download figure:
Standard image High-resolution imageThe breath-borne acetone level (ppbv) for COVID-19 patients, NC + HCW and RI were 168.9 (95% CI 156.7–181.2), 261.1 (95% CI 246.1–276.1) and 308.5 (95% CI 260.3–356.8), respectively, as calculated using the standard curve in figure 3(A). For other VOC species, the mean level and statistical comparisons among different subjects are listed in tables S7 and S8. As shown in the tables, other VOCs species such as acetic acid, propanol and non-identified peaks were shown to be different among different groups. Our machine learning models SVM, GBM and Random Forests demonstrated strong capabilities in discriminating COVID-19 from (HCW + NC) and RI. ROC curves and the detailed performance parameters for the three machine learning models were shown in figure 3 and table S9, respectively. Based on ROC curves and F1 scores (combining the recall score and the precision), the best performing model was SVM (F1 score 100%) for differentiating COVID-19 and HCW + NC controls with a recall score of 100%, a precision of 100% and an AUC of 1.00 (95% CI 1.00–1.00). For the comparison of COVID-19 and RI, the F1 scores and the AUC were 100% and 1.00 (95% CI 1.00–1.00) for GBM and Random Forests. In addition, the developed models can also successfully differentiate between RI and HCW + NC, yielding the F1 scores up to 84% and the AUC of 0.95 (95% CI 0.86–1.00) to 1.00 (95% CI 1.00–1.00) for GBM and Random Forests.
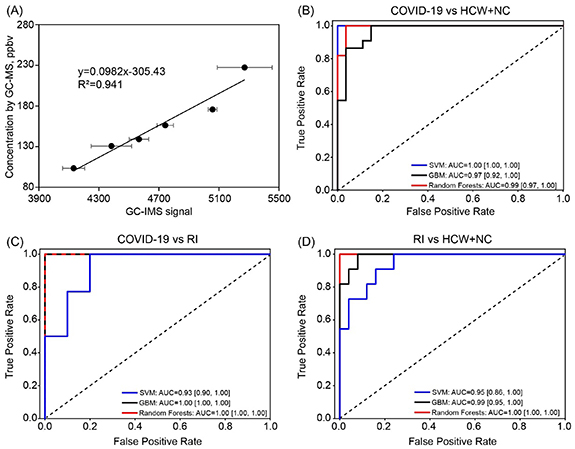
Figure 3. (A) The standard curve of breath-borne acetone as measured by GC-IMS (calibrated by GC-MS). The acetone concentrations of serial diluted breath samples from a healthy subject were determined by GC-MS. Detailed method of GC-MS was shown in our previous publication [29]; ROC curves for three different machine learning models (SVM, gradient boosting, and random forests); (B): COVID-19 vs (HCW + NC); (C): COVID-19 vs RI; (D): RI vs (HCW + NC).
Download figure:
Standard image High-resolution imageFor the GBM and Random Forests models, weighted importance of VOCs species for classification of COVID-19 and other subjects were provided in table 2. As shown in the table, the top weighted VOCs species were different for different classification sets, for example, acetone was the most important VOC when differentiating COVID-19 from HCW + NC, while acetic acid played a vital role in differentiating RI from others.
Table 2. Weighted importance of VOC species in the GBM and random forests model for classification of COVID-19 from other subjects. γ '-1' or '-2' refers to the corresponding propanol monomer and dimer ion in the IMS, and is not part of the name. All VOC species are characterized using their RI and Dt listed in table S6.
| COVID-19 vs (HCW + NC) | COVID-19 vs RI | RI vs (HCW + NC) | ||||
|---|---|---|---|---|---|---|
| Feature | GBM | Random forests | GBM | Random forests | GBM | Random forests |
| Acetic acid | 0.029 | 0.151 | 0.893 | 0.290 | 0.217 | 0.187 |
| Propanol-1γ | 0.083 | 0.042 | 0.000 | 0.008 | 0.113 | 0.133 |
| Propanol-2γ | 0.005 | 0.030 | 0.000 | 0.020 | 0.043 | 0.084 |
| Acetone | 0.431 | 0.233 | 0.011 | 0.096 | 0.148 | 0.103 |
| Acetaldehyde | 0.000 | 0.035 | 0.003 | 0.018 | 0.001 | 0.027 |
| Area 30 | 0.026 | 0.046 | 0.000 | 0.071 | 0.000 | 0.045 |
| Area 44 | 0.134 | 0.067 | 0.000 | 0.050 | 0.007 | 0.018 |
| Area 57 | 0.022 | 0.027 | 0.038 | 0.073 | 0.248 | 0.142 |
| Area 58 | 0.162 | 0.189 | 0.021 | 0.241 | 0.065 | 0.047 |
| Area 62 | 0.070 | 0.060 | 0.000 | 0.054 | 0.101 | 0.096 |
| Area 63 | 0.004 | 0.039 | 0.002 | 0.075 | 0.012 | 0.060 |
| Area 64 | 0.034 | 0.081 | 0.032 | 0.003 | 0.046 | 0.058 |
The 74 recruited COVID-19 patients were divided into two groups according to their latest throat swab nucleic acid test results on the day of performing the breath test (47 positive and 27 negative, table S1). As shown in table S9, the machine learning model performed poorly in differentiating COVID-19 patients with positive and negative swab tests (AUC = 0.62 (95% CI 0.36–0.85) to 0.71 (95% CI 0.44–0.89), F1 scores ⩽67%). This indicates that COVID-19 patients shared similar VOCs profiles regardless of the PCR test results. As discussed above, the machine learning models performed well in discriminating all COVID-19 patients from other subjects. These results suggest that the developed method holds promise of screening COVID-19 patients even with a recent false-negative PCR test result. Interestingly, another independent study has also demonstrated breath-based VOC test can successfully classify a COVID-19 patient whose RT-PCR test was otherwise inconclusive [25]. As shown in table S9, when discriminating COVID-19 patients with HCW/NC, the false negative rate of the SVM, GBM and Random Forests models are 0%, 13.6%, and 18.8%, respectively. However, the PCR test could generate 36.5% false-negative rate (27 PCR tested negative out of 74) in this study. The false negative results by RT-PCR were frequently reported in sputum, nasal and throat samples during the first 7 d after onset of the symptoms with rates as 11%, 27% and 40%, respectively [30]. This indicates that the developed screening method can offer better sensitivity over the PCR test. Besides, our previous study showed that patients with negative throat swab test still can emit SARS-CoV-2 RNA via breath [7]. Therefore, COVID-19 screening and diagnosis should not be entirely based on nasal/pharyngeal swab nucleic acid test. Those false negative results from the PCR test were due to either its low detection limits or the sample quality. Using both machine learning and principal component analysis, we did not detect an influence from the background air (figure 2). Besides, the possible confounders on the breath VOCs profiles were summarized in table S10, and the machine learning analysis showed there was no specific effects of these confounders on the classifications of breath VOCs profiles (figure S3; table S11).
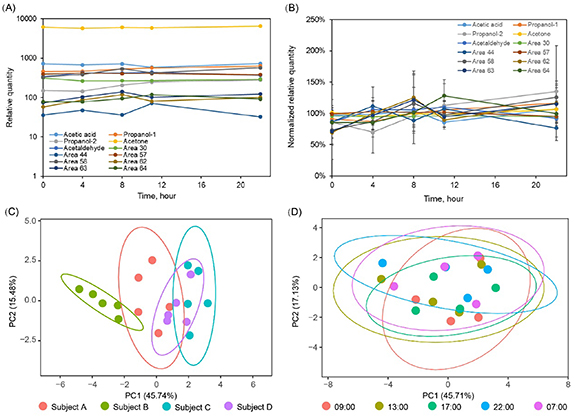
In our study, HCW were recruited as a control to the COVID-19 patients because they could be exposed to the environment involving VOCs from COVID-19 patients. However, our results showed the breath-borne VOCs profiles of COVID-19 are significantly different from those of HCW, indicating that the influence of prior environmental exposure to VOCs emitted by the patients could be neglected. Figures 4(A) and (B) show average relative quantities and normalized relative quantities of 12 breath-borne VOCs from four healthy volunteers, respectively, over a 22 h time period. PCA (figures 4(C) and (D)) showed that the VOC patterns seemed to be similar (grouped together) over the time period (from 9:00 to next 7:00), while it seems each individual has a distinctive pattern of VOC species (four subjects). It was likewise observed in anther work that the stable and specific individual signatures of breath-borne composition, i.e. 'core breathprints', do exist, thus serving as a biofluid of choice in metabolomics studies [31]. We also performed machine learning classification of these four subjects using the established algorithm based on our COVID-19 and HCW/NC data, and the results (table S5) showed that they are all successfully recognized as non-COVID-19.
Figure 4. Variations of 12 breath-borne VOCs from four healthy volunteers in 24 h (9:00 am, 13:00 pm, 17:00 pm, 22:00 pm, 7:00 am of the next day): (A) average relative quantity; (B) normalized average relative quantity; PCA plots of breath-borne VOCs profiles (12 VOCs) at different time of the day from four healthy volunteers: (C) grouped by individuals and each group was consist of five breath-borne VOCs profiles in 24 h (9:00 am, 13:00 pm, 17:00 pm, 22:00 pm, 7:00 am of the next day); (D) grouped by collection time and each group represented four subjects' breath-borne VOCs profiles (12 VOCs) profiles collected at the same time.
Download figure:
Standard image High-resolution image
4. Discussion
Rapid screening and diagnosis of COVID-19 plays a vital role in controlling the pandemic. Breath-borne VOCs have been investigated as biomarkers for lung cancer [13], oxidative stress [19], and many other diseases [15]. VOC emission is described as being caused directly or indirectly by reactive oxygen species around the cells [13, 15]. Our recent study demonstrated that rats exposed to various substances emitted distinctive VOC profiles [29]. When people are infected with SARS-CoV-2, characteristic protein and metabolite changes are observed; and more than 100 lipids have been reported to be down-regulated in their blood sera [32]. In previous studies, distinctive patterns of exhaled VOCs from in vitro cell tests with human rhinovirus, influenza virus and respiratory syncytial virus were observed [33, 34]. Similarly, the complex biochemistry processes of COVID-19 such as SARS-CoV-2 entry and replication, humoral and cellular immunity, and cytokine storm, could induce the formation of VOCs or alter the normal VOCs profiles [18]. Here we show that breath-borne VOCs profiles can be used to characterize the differences among COVID-19 and RI (SARS-CoV-2 negative) patients (both representing respiratory infections) when compared with NC and HCW subjects. Detection of a VOC profile with a lower level of acetone but a higher level of propanol, as revealed here, could possibly correspond to a COVID-19 infection or some disease that is at least different from other known respiratory infections. However, it is difficult to eliminate the influences of individual variations from diet and medication on these emitted VOCs [13, 15]. Here, the same diet was managed and provided for COVID-19 patients except those in critical conditions by the hospital during the hospitalization. Nonetheless, machine learning models were able to successfully classify these different groups with different arrays of selected 12 breath-borne endogenous VOC species. In a previous work, although Shan et al used non-VOC-species-specific sensor arrays, they were also able to differentiate between COVID-19 and healthy subjects by coupling machine learning and their eight VOC signals [24]. Recently, COVID-19 ARDS (acute respiratory distress syndrome) and non-COVID-19 ARDS patients were also successfully differentiated by breath VOCs profiles (four VOC species) obtained by proton transfer reaction time-of-flight mass spectrometry [35]. Here, GC-IMS was used to mainly analyze oxygenated hydrocarbons in exhaled breath. Shen et al developed a machine learning model using proteomic and metabolomic measurements from a training cohort of 18 non-severe and 13 severe patients, and they have correctly identified seven out of ten COVID-19 patients [32]. Most recently, Steppert et al have shown that VOC biomarkers can be successfully used to discriminate between COVID-19 and influenza-A [25]. The screening and diagnosis potential of the breath analysis for COVID-19 has also been demonstrated in another work [26]. Here, in addition to identification of certain VOC species, the qualitative and quantitative data for other endogenous VOC peaks including retention index and drift time shown in table S6 are provided in our study. COVID-19 is a new disease, and associated VOC species might not be fully covered by the GC-IMS. The results from this work nonetheless can be directly utilized by other groups of scientists working on similar issues.
Besides the main described symptoms of fever and cough (>80%) [36], 'silent hypoxia', a condition of oxygen deprivation, has also been reported in COVID-19 patients [37]. In our study, acetone, the most abundant breath-borne VOC, was observed in lower concentrations in the breath of COVID-19 patients. Acetone is generated from the decarboxylation of acetoacetate in hepatocytes, which derives from lipolysis or lipid peroxidation [38]. The decline of breath-borne acetone might be related to the hypoxia and down-regulated lipid metabolism resulting from liver damage as reported [29]. These changes may in turn influence the oxygen demand, which can eventually lead to silent hypoxia. The metabolic abnormality resulting from SARS-CoV-2 infection is likely to be exacerbated by the cytokine storm in which levels of protein biomarkers, such as interleukin (IL)-2, IL-7, macrophage inflammatory protein 1-α, tumor necrosis factor-α, C-reactive protein (CRP) and IL-6, are substantially increased [39–41], and such occurrences could be related to observed breath-borne VOC species patterns of COVID-19 patients. Our findings here can assist in rapidly screening COVID-19 patients from a population and possibly even in the early stages of the disease as the change of breath-borne VOCs was shown to occur early in the disease process [42, 43]. Additionally, using the machine learning model we have developed we can carry out additional checks on those COVID-19 patients who are to be discharged based on multiple negative PCR tests. These to-be-discharged COVID-19 patients might have similar VOC profiles compared to those of healthy individuals, which in this case gives us additional confidence in discharging them. On the other hand, if a to-be-discharged COVID-19 patient fails our breath tests, this could serve as an alert for additional health monitoring of the subject or requires attention for supplementary medical checkup before discharge. This breath test can be done to other people in isolation and in a discharge scenario. The developed method is not meant to replace PCR, but instead to provide an additional checkup to reduce the medical uncertainties. Nonetheless, the application of the developed method in a clinical setting requires further investigation. In the future, if an opportunity allows, the temporal patterns of breath-borne VOCs from COVID-19 should be studied, which will help to evaluate whether the breath-borne VOCs biomarkers can support the decision-making for hospital discharge. Besides, the influences of respiratory maneuvers, medication and physiological parameters on breath-borne VOCs profiles such as respiratory rate, cardiac output and blood levels of glucose, should be also investigated to understand possible limitations of this screening technology. In addition, GC-IMS could sometimes lead to minor shifts for the same substance under different atmospheric conditions such as pressure [44]. The atmospheric pressure in Beijing at the time of the study (July to September) is 1004 ± 5.1 hPa (95% CI) according to the China Meteorological Data Service Centre, thus the variations of drift time caused by atmospheric pressure could be estimated within ±0.5%, which could be neglected. It should also be noted that for some VOCs the isomers and dimer could be present at the same time in IMS, and their relative quantities of isomers and dimer were highly correlated. Certainly, online measurement of breath-borne VOCs is preferred in terms of timing, sample handling, sample life as suggested or demonstrated in other studies [25, 26, 35]. The larger sample size of COVID-19 patients desired for this study was precluded by biosafety concerns and laboratory constraints due to the highly infectious nature of SARS-CoV-2. This technology can be continuously improved with each new trial data tested. This work provides a novel concept for rapidly screening COVID-19 by analyzing breath-borne VOCs using machine learning, while revealing potential VOC biomarkers for COVID-19. Compared to RT-PCR with throat swab protocol, the developed method has also shown certain advantages such as comfort sample collection, higher sensitivity, and less involvement from the HCW and so it is also safer.
Acknowledgments
This research was supported by the NSFC Distinguished Young Scholars Fund Awarded to M Yao (21725701) and a National Natural Science Foundation of China (NSFC) Grant (22040101) (PI: M Yao) dedicated to the COVID-19 pandemic. M Yao was also supported by a Grant from Guangzhou Laboratory (EKPG21-02). Four hospitals in Beijing are thanked for their assistance in recruiting the subjects. Special thanks are given to Jiazhen Guo from Ditan Hospital for assistance in the collection of exhaled breath. Relevant work was initially submitted to a pre-print server at https://doi.org/10.1101/2020.06.21.20136523 on 24 June 2020.
Supporting information
Machine learning model developments, quality control for VOC sampling bag, Procedure for GC-IMS analysis of VOCs, tables S1–S5 demographic, sampling, and medical information of subjects, table S6 breath/background ratios of 12 endogenous VOCs species, table S7 GC-IMS response data (mean ± standard deviation) of 12 endogenous VOCs species (peaks) between different test groups and their background air, table S8 statistical comparisons of 12 endogenous VOCs species (peaks) between different test groups, table S9 performances (F1 score, recall score (sensitivity), precision (PPV), accuracy, specificity, NPV and AUC [95% CI]) of different machine learning models in differentiating between different subject groups, table S10 summary information on the confounding factors for each group in the second campaign, table S11 the performances of machine learning classification of main confounders (gender, smoking, age and other diseases) based on exhaled VOCs profiles, figure S1 breath-borne VOCs recovery rate in ALTEF bag in 48 h, figure S2 an example of the original GC-IMS analysis results. Figure S3 ROC of machine learning analysis of sex, age, and smoke effects.
Data availability statement
All data that support the findings of this study are included within the article (and any supplementary files).
Ethics approval and consent to participate
The ethics approval for non-invasive collection of exhaled breath from human subjects was waived by the Ethics Committee of the Center for Disease Control and Prevention of Chaoyang District of Beijing due to the urgency of the COVID-19 outbreak investigation. Participants were given a verbal description about the study in advance via the hospital and we obtained their verbal consents onsite before the exhaled breath collection. The research was conducted in accordance with the principles embodied in the Declaration of Helsinki.
Conflict of interest
The authors declare that they have no competing interests.