the Creative Commons Attribution 4.0 License.
the Creative Commons Attribution 4.0 License.
 | 24 Oct 2022
A new methodology for measuring traveling quasi-5-day oscillations during sudden stratospheric warming events based on satellite observations
Shaodong Zhang
Qiao Xiao
Chunming Huang
Kaiming Huang
Enhancements of stationary planetary waves (SPWs) and traveling planetary waves (TPWs) are commonly observed in the middle atmosphere during sudden stratospheric warming (SSW) events. Based on the least squares fitting method (Wu et al., 1995), numerous studies have used satellite measurements to investigate the characteristics of TPWs during SSWs, but they have ignored the effect of the SPWs. However, a rapid and large change in the SPWs during SSWs may lead to significant disturbances in the amplitude of derived TPWs. In this study, we present a new methodology for obtaining the amplitudes and wave numbers of traveling quasi-5-day oscillations (Q5DOs) in the middle atmosphere during major SSWs. Our new fitting method is developed by inhibiting the effect of a rapid and large change in SPWs during SSWs. We demonstrate the effectiveness of the new method using both synthetic data and satellite observations. The results of the simulations indicate that the new method can suppress the aliasing from SPWs and capture the real variations in TPWs during SSWs. Based on the geopotential height data measured by the Aura satellite from 2004 to 2021, the variations in traveling Q5DOs during eight midwinter major SSWs are reevaluated using the new method. The differences in the fitted amplitudes between the least squares fitting method and the new method are usually over 100 m during the SSW onsets. Our analysis indicates that previously reported Q5DOs during SSWs might be contaminated by SPWs, leading to both overestimation and underestimation of the amplitudes of the traveling Q5DOs.


Sudden stratospheric warming (SSW) is one of the most representative phenomena in the atmospheric dynamics in the polar region, and it is caused by the interaction between stationary planetary waves (SPWs) and background mean flow (Matsuno, 1971; Baldwin et al., 2021). The onset of SSW is characterized by a positive gradient of zonal mean temperature from 90 to 60∘ N at 10 hPa (Andrews et al., 1987). Generally, a major SSW event is additionally associated with the phenomenon of wind reversals in the zonal mean eastward winds at 60∘ N and 10 hPa; otherwise, SSWs are regarded as minor events (Charlton and Polvani, 2007; Butler et al., 2017; Choi et al., 2019). During the occurrence of SSWs, the enhancements of SPWs largely affect the energy transportation in the stratosphere and the occurrence of extreme weather in the troposphere at middle latitudes (e.g., Manney et al., 2009; Kozubek et al., 2015; King et al., 2019; Domeisen et al., 2020). The zonal wave number of the enhanced SPWs usually corresponds to the geometry of the polar vortex during SSWs (e.g., Harada and Hirooka, 2017; Liu et al., 2019; White et al., 2021). A displacement vortex is mainly due to a strong SPW with a zonal wave number of 1 (SPW1), and split vortices are always associated with large SPWs with a zonal wave number of 2 (SPW2) (e.g., Seviour et al., 2013; Lawrence and Manney, 2018; Choi et al., 2019).
Traveling planetary waves (TPWs), widely observed with strong amplitudes during SSWs in recent decades, also play a significant role in controlling the global atmospheric and ionospheric couplings during SSWs (e.g., Gong et al., 2019; Koushik et al., 2020; Lin et al., 2020; Ma et al., 2022). One of the prominent TPWs, the westward-propagating quasi-5-day oscillation (Q5DO) with periods of 4–7 d, is usually observed from the mesosphere to the ionosphere at midlatitudes during SSWs with zonal wave numbers of both 1 and 2 (W1 and W2, respectively) (Gong et al., 2018; Pancheva et al., 2018; Yamazaki et al., 2020, 2021). These Q5DOs are believed to be generated by atmospheric barotropic/baroclinic instability due to large changes in zonal winds and temperatures during SSWs (e.g., Liu et al., 2004; Ma et al., 2020; Yamazaki et al., 2021). Based on the least squares fitting method introduced by Wu et al. (1995), the amplitude, phase, and zonal wave number of the Q5DOs can be obtained from satellite observations and reanalysis data sets (e.g., Huang et al., 2017; Qin et al., 2021). However, based on the least squares fitting method, a rapid and large change in the amplitudes of SPWs would lead to an apparent fluctuation in the amplitude of TPWs over a broad range of frequencies, including those corresponding to Q5DOs. Yamazaki and Matthias (2019) proposed that, based on the least squares fitting method, the effect of an SPW on a quasi-10-day wave (Q10DW) is equivalent to two oppositely propagating waves with equal amplitudes, periods, and wave numbers. They suggested that the effect of SPWs can be ignored when the activities of Q10DWs in the oppositely propagating direction are not simultaneously enhanced.
However, the rapid change in the amplitudes of SPWs is a typical characteristic during the occurrence of SSWs. Previous studies have usually ignored the effect of SPWs when obtaining the amplitudes of Q5DOs from satellite observations (e.g., Gong et al., 2018; Qin et al., 2021). Nevertheless, both westward and eastward Q5DOs have been frequently reported during SSWs in recent years (e.g., Pancheva et al., 2018; Rhodes et al., 2021; Wang et al., 2021; Yu et al., 2022). Thus, it is necessary to understand the real physics of the enhanced Q5DOs during SSWs and their relationships with SPWs. It is also necessary to inhibit the effect of SPWs when studying the variations in Q5DOs during SSWs. In the present study, we develop a new method for measuring the variation in westward- and eastward-propagating Q5DOs by inhibiting the effect of a rapid and large change in SPWs. The effectiveness of the new method is demonstrated by using both synthetic data and satellite observations.
The remainder of the paper is organized as follows: in Sect. 2, the synthetic data and the satellite data used in this study are introduced; Sect. 3 presents the new methodology for measuring the amplitudes of Q5DOs; discussions are given in Sect. 4, mainly focusing on the comparisons of traveling Q5DOs during SSWs between the least squares fitting method and the new fitting method; and conclusions are summarized in Sect. 5.
In the present study, an experiment is performed based on synthetic data in order to further understand the issue of SPWs and Q5DOs during SSWs. The synthetic data Y(x,t) are built based on Eq. (1), including three components: an SPW, a westward-propagating Q5DO, and an eastward-propagating Q5DO. This is expressed as follows:
where x is longitude; t is time; k is the wave number; ω is the frequency of Q5DOs; Ak and φk are the respective amplitude and phase of SPWs; and Bw and Be denote the amplitudes of westward and eastward Q5DOs with a phase of φw and φe, respectively. Based on the least squares fitting method introduced by Wu et al. (1995), TPWs with the same zonal wave number but in other periods only cause periodic modulation in the fitted amplitudes of Q5DOs. The aliasing caused by TPWs with different wave numbers is mainly captured in the studies of quasi-2-day waves based on satellite measurements (Tunbridge et al., 2011). For the analysis of Q5DOs, the aliasing due to components with different wave numbers is usually ignored, as Q5DOs with wave numbers of 3 or 4 are rarely reported. Nevertheless, the most important issue of the least squares fitting method may be the aliasing due to the rapid and large changes in SPWs. Therefore, to better understand the issue, the synthetic data for the simulations in the present study only include three components of waves with the same zonal wave numbers.
To verify the effectiveness of different fitting methods, the geopotential height data measured by the Aura Microwave Limb Sounder (Aura MLS) from 2005 to 2021 are used to derive the Q5DOs in the present study. The available Aura MLS geopotential height data in the version 4.2x Level 2 product are from 261 to 0.001 hPa (Livesey et al., 2020), with measurement errors of ±25, ±45, ±110, and ±160 m at 1, 0.1, 0.01, and 0.001 hPa, respectively. A comprehensive study of the measurement errors and fitting errors has been reported by Yamazaki and Matthias (2019) when using the Aura MLS geopotential height data to obtain the amplitudes of Q5DOs. They suggested that the mean values of the estimated 1σ uncertainties in TPWs are about 50 m at high latitudes in the Northern Hemisphere. Following their technique, mean values of the estimated 1σ uncertainties in the fitted amplitudes obtained by the new method are also about 50 m. The vertical structure of the estimated 1σ uncertainty of the new method is the same as the distributions shown in Fig. 1 of Yamazaki and Matthias (2019). In the present study, we focus on the difference between the original and new fitting methods. The fitted amplitudes are presented in the following analyses without dropping the values that are lower than the uncertainties. The analysis in this study focuses on the traveling Q5DOs with zonal wave numbers of 1 and 2 based on the data at 60∘ N (averaged from 55 to 65∘ N).

Figure 1Simulations of the least squares fitting method based on synthetic data, including an SPW and westward and eastward Q5DOs with a zonal wave number of 1. (a) Daily variations in the SPW amplitudes. The phase of the SPW is 0. (b) The real amplitudes of Q5DOs. Amplitudes are separately set as 100 and 60 m for the respective eastward and westward Q5DOs. (c) Q5DOs obtained from the least squares fitting method. The phases are and for the westward and eastward Q5DOs, respectively. Panel (d) is the same as panel (c) but with phases of and for the westward and eastward Q5DOs, respectively.
3.1 Simulations of the least squares fitting method
The least squares fitting method used in previous studies to derive the amplitude and phase of Q5DOs from satellite observations is based on Eq. (1) but without fitting the first term on the right-hand side (e.g., Huang et al., 2017; Qin et al., 2021). Generally, a 20 d sliding window with a step of 1 d is used to simultaneously extract the amplitudes of TPWs with zonal wave numbers from 3 to −3 (westward to eastward). The daily amplitudes of the Q5DOs are obtained with the largest value in the wave periods between 4 and 7 d. The fitting result is marked at the end day of each 20 d window. To better understand the original least squares fitting method, the synthetic data are used to first simulate the effect of a rapid and large change in SPWs when calculating the amplitudes of Q5DOs. As shown in Fig. 1a and b, three components of waves with a zonal wave number of 1 are given in the synthetic data: an SPW with an amplitude of 100 m and eastward- and westward-propagating Q5DOs with respective amplitudes of 100 and 60 m. The phases are set as 0, , and for the SPW and the westward and eastward-propagating Q5DOs, respectively. To simulate the effect of SPWs on TPWs, rapid large changes in the amplitudes of SPW are given on day 100 with magnitudes from 100 to 500 m and on day 150 with magnitudes from 500 to 100 m (see Fig. 1a).
Figure 1c presents the amplitudes of the westward- and eastward-propagating Q5DOs fitted by the least squares fitting method. As shown in Fig. 1c, abnormal fluctuations after days 100 and 150 are captured, which correspond to the occurrence of rapid large changes in the amplitudes of SPWs. However, Fig. 1c suggests that the fitted Q5DOs are not largely influenced by the SPWs when rapid large changes are not given in the amplitudes of SPWs (before day 100 or from days 120 to 150). Additionally, Fig. 1c indicates that abnormal fluctuations in Q5DOs induced by SPWs are not equivalent to two oppositely propagating directions. An enhancement and a decrease in the amplitudes of westward- and eastward-propagating Q5DOs can be simultaneously observed. Results shown in Fig. 1d are the same as those in Fig. 1c but are derived based on different phases of the westward and eastward Q5DOs in the synthetic data, where and are given in the westward and eastward Q5DOs. Comparing the results between Fig. 1c and d, it is interesting to note that the effect of a rapid large change in SPWs on the derived Q5DOs also depends on the phase relationships. Yamazaki and Matthias (2019) suggested that the effect of SPWs could be ignored when the activities of Q10DWs in the oppositely propagating direction were not simultaneously enhanced. However, according to our simulations, this criterion is not suitable for the analysis of Q5DOs with different phases. Our simulation indicates that the influence of a quick and large change in SPWs should not be ignored when extracting Q5DOs during SSWs from satellite observations based on the least squares fitting method. Thus, in this study, we develop a new fitting method to derive the Q5DOs by suppressing the effect of a rapid and large change in SPWs.
3.2 New fitting method
As the daily amplitude of SPWs (Ak(t)) cannot be directly derived when Q5DOs exist, the primary goal of the new method is to eliminate the rapid and large changes in Ak(t). The following steps are performed, in which SPWs and Q5DOs are considered within the same wave numbers.
3.2.1 Step 1: estimate the daily variations in SPWs
Based on the definition of SPWs, the phase φk should be a fixed value in each window. Therefore, φk is first fitted based on , where y(x) is the time-averaged geopotential height in each 20 d window. Using the fitted phase φk, the daily amplitudes of SPWs can be roughly estimated by the least squares fitting based on Eq. (2), which equals Eq. (1).
If we let and let , Eq. (2) can be simply expressed as follows:
However, the fitted amplitudes of SPWs, ak(t), are not the true amplitudes of SPWs (Ak(t)), which include the aliasing from Q5DOs. According to the above two equations, rapid and large changes in SPW amplitudes can only have impacts on the values of ak(t). Because the true values of Ak(t) cannot be directly fitted due to the aliasing of Q5DOs, our goal in Step 2 is to eliminate the rapid large changes in ak(t).
3.2.2 Step 2: eliminate the rapid large changes in SPWs
If we let , ak(t) in Eq. (3) can also be expressed as
The amplitude P and phase φ can be estimated by the least squares fitting method via Eq. (4). Taking the partial derivatives in time on both sides of Eq. (4), we obtain Eq. (5):
where represents the daily variations in the amplitudes of SPWs. The primary goal of Step 2 is to subtract large values of from ak(t) in order to eliminate the large variations in ak(t). However, cannot be obtained simply by , as cannot be derived accurately when values are large (“” represents the absolute values). Nevertheless, the lower boundary of the values of can be estimated when rapid large changes exist in SPWs ( values are large). The maximum value of will be at least larger than the maximum value of , which is ωP. Thus, the value of ωPcan be used as a threshold to determine rapid large changes in SPWs.
Therefore, when values are larger than the threshold of ωP, we subtract the value of the corresponding from all the following members of ak(t) to obtain a new series of . The values are estimated by , where . Instead of the P and φ fitted in the present window, the Ppre and φpre fitted from the previous window are used because the fitted Ppre and φpre are not influenced by the effect of rapid large changes in SPWs in the present window. Here, we have a new series of without rapid large changes in SPWs as well as new fitted P and φ for the next window.
3.2.3 Step 3: fit the real amplitudes of Q5DOs
After obtaining and bk(t) from Step 2, the reconstruction of the original data , which inhibits the rapid and large changes in SPWs, can be carried out based on Eq. (6):
The real amplitudes and phases of the Q5DOs (Bw, Be, φw, and φe) can then be fitted using the least squares fitting method via , where C is a constant.
Note that the effect of small changes in SPWs cannot be eliminated sometimes when values are smaller than ωP. These small changes in SPWs do not have significant effects on the fitted Q5DOs, and their elimination depends on the phase relationships between westward and eastward Q5DOs. Nevertheless, the Monte Carlo simulations based on random phases of Q5DOs reveal that the fake fluctuations in Q5DO amplitudes due to this effect will not exceed the value of 0.1ωP.
4.1 Simulations
Based on the new fitting method, we present the fitting result in Fig. 2. As shown in Fig. 2b, the fitted amplitudes of the Q5DOs are generally consistent with the amplitudes given in the original synthetic data. The apparent fluctuations in Q5DOs induced by SPWs have been removed. Note that, based on the new fitting method, the fitted amplitudes are not dependent on the phases of Q5DOs. The new fitting method will provide the same results as those shown in Fig. 2b when Q5DOs have different phases (not shown). Thus, the fitted amplitudes from the new method do not rely on the phase relationships of those waves. Figure 2 demonstrates that the new method is effective to suppress the effect of rapid large change in SPWs; however, a further experiment with synthetic data containing the enhancement of both SPWs and Q5DOs is needed to demonstrate that the new method can properly capture the changes in Q5DOs during SSWs. Moreover, we also add signals of SPWs and Q5DOs with wave number 2 in the synthetic data to approach the real situation in satellite observations. Figure 3 shows the results of the further experiment. The synthetic data used in Fig. 3 consist of six components: SPWs with wave number 1 and 2 (SPW1 and SPW2, respectively), westward-propagating Q5DOs with wave number 1 and 2 (W1 and W2, respectively), and eastward-propagating Q5DOs with wave number 1 and 2 (E1 and E2, respectively). The daily variation in the amplitudes of SPWs and Q5DOs are shown in Fig. 3a and b, respectively. The phase of SPW1 and SPW2 as well as the W1, E1, W2, and E2 Q5DOs are set as 0, , , , , and , respectively. Figure 3c and d present the fitting results for the least squares fitting method and the new fitting method. As shown in Fig. 3d, the result manifests that the variations in Q5DOs can be captured based on the new method and that the effect of rapid large change in SPWs can be limited.
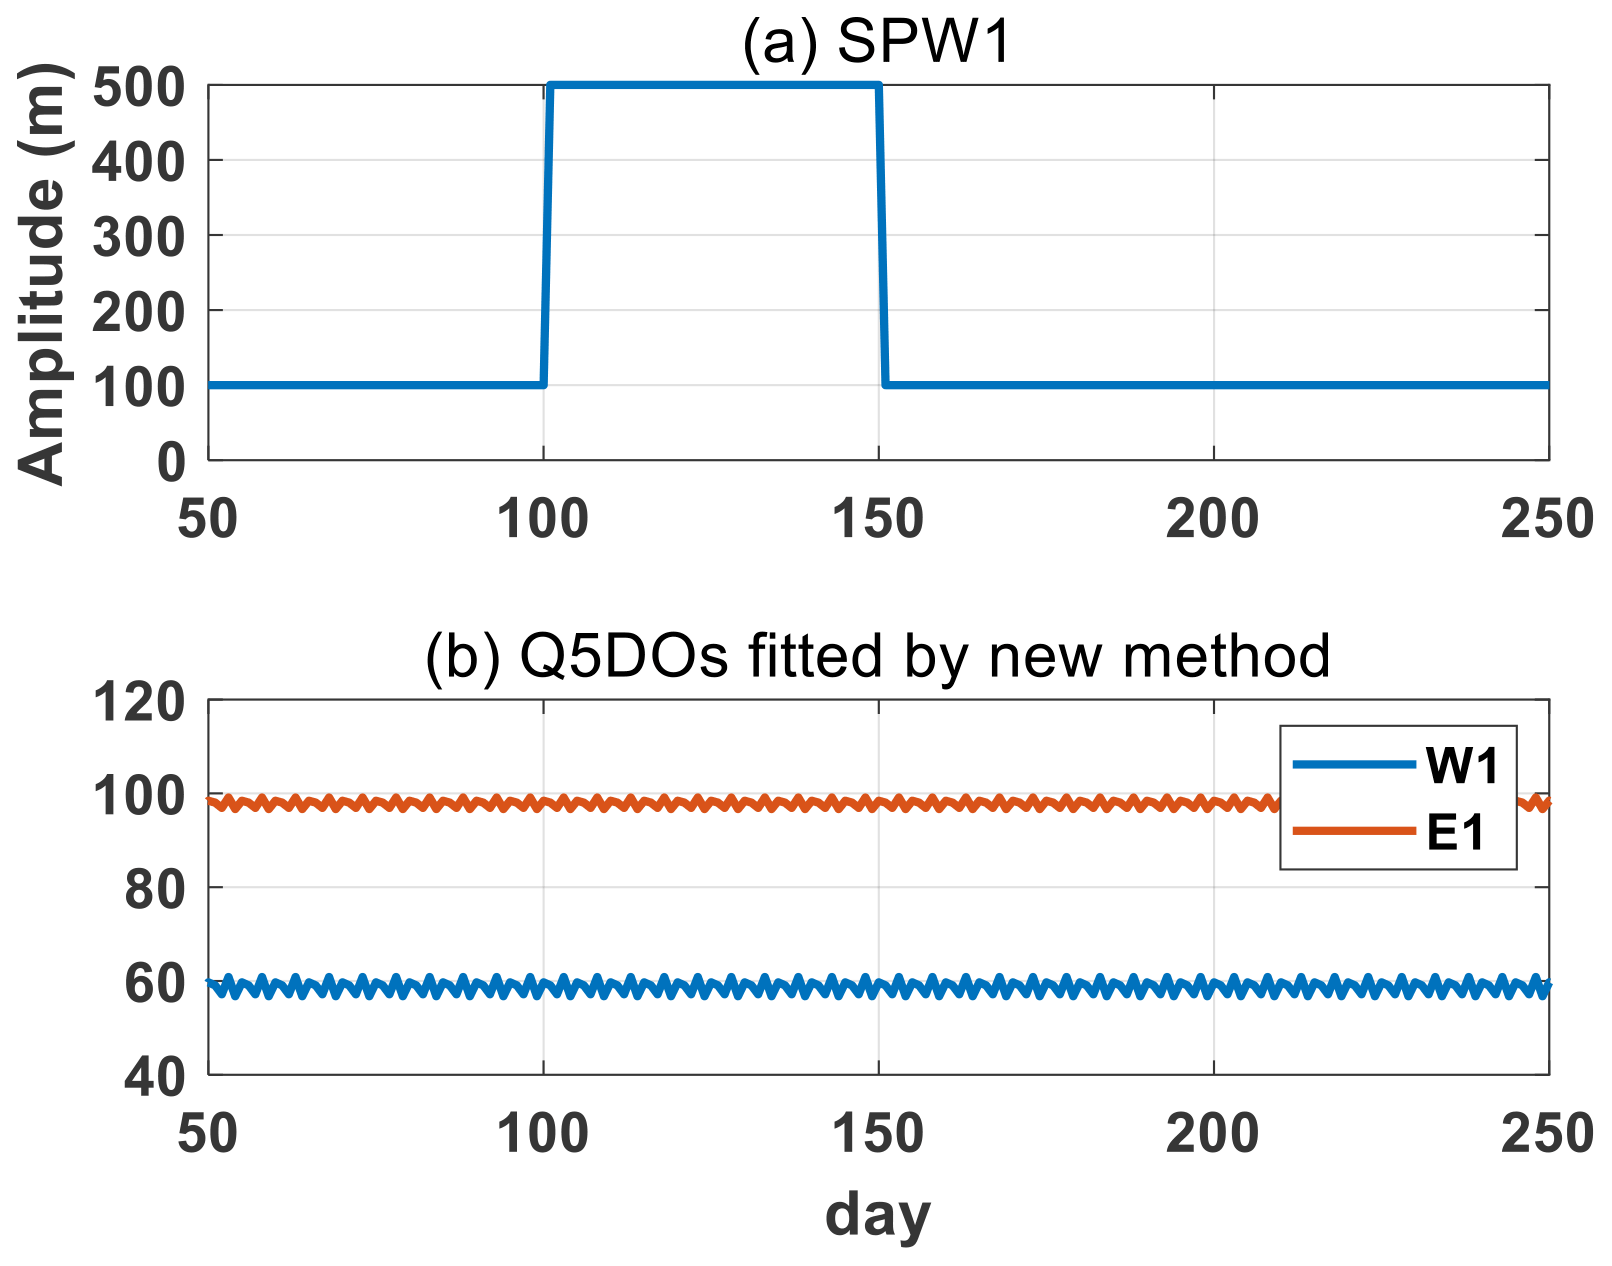
Figure 2Simulations of the new fitting method based on synthetic data, including an SPW and westward and eastward Q5DOs with a zonal wave number of 1. (a) Daily variations in the SPW amplitudes. The phase of the SPW is 0. (b) Q5DOs obtained from the new fitting method. The amplitudes are 60 and 100 m and the phases are and for the westward and eastward Q5DOs, respectively.
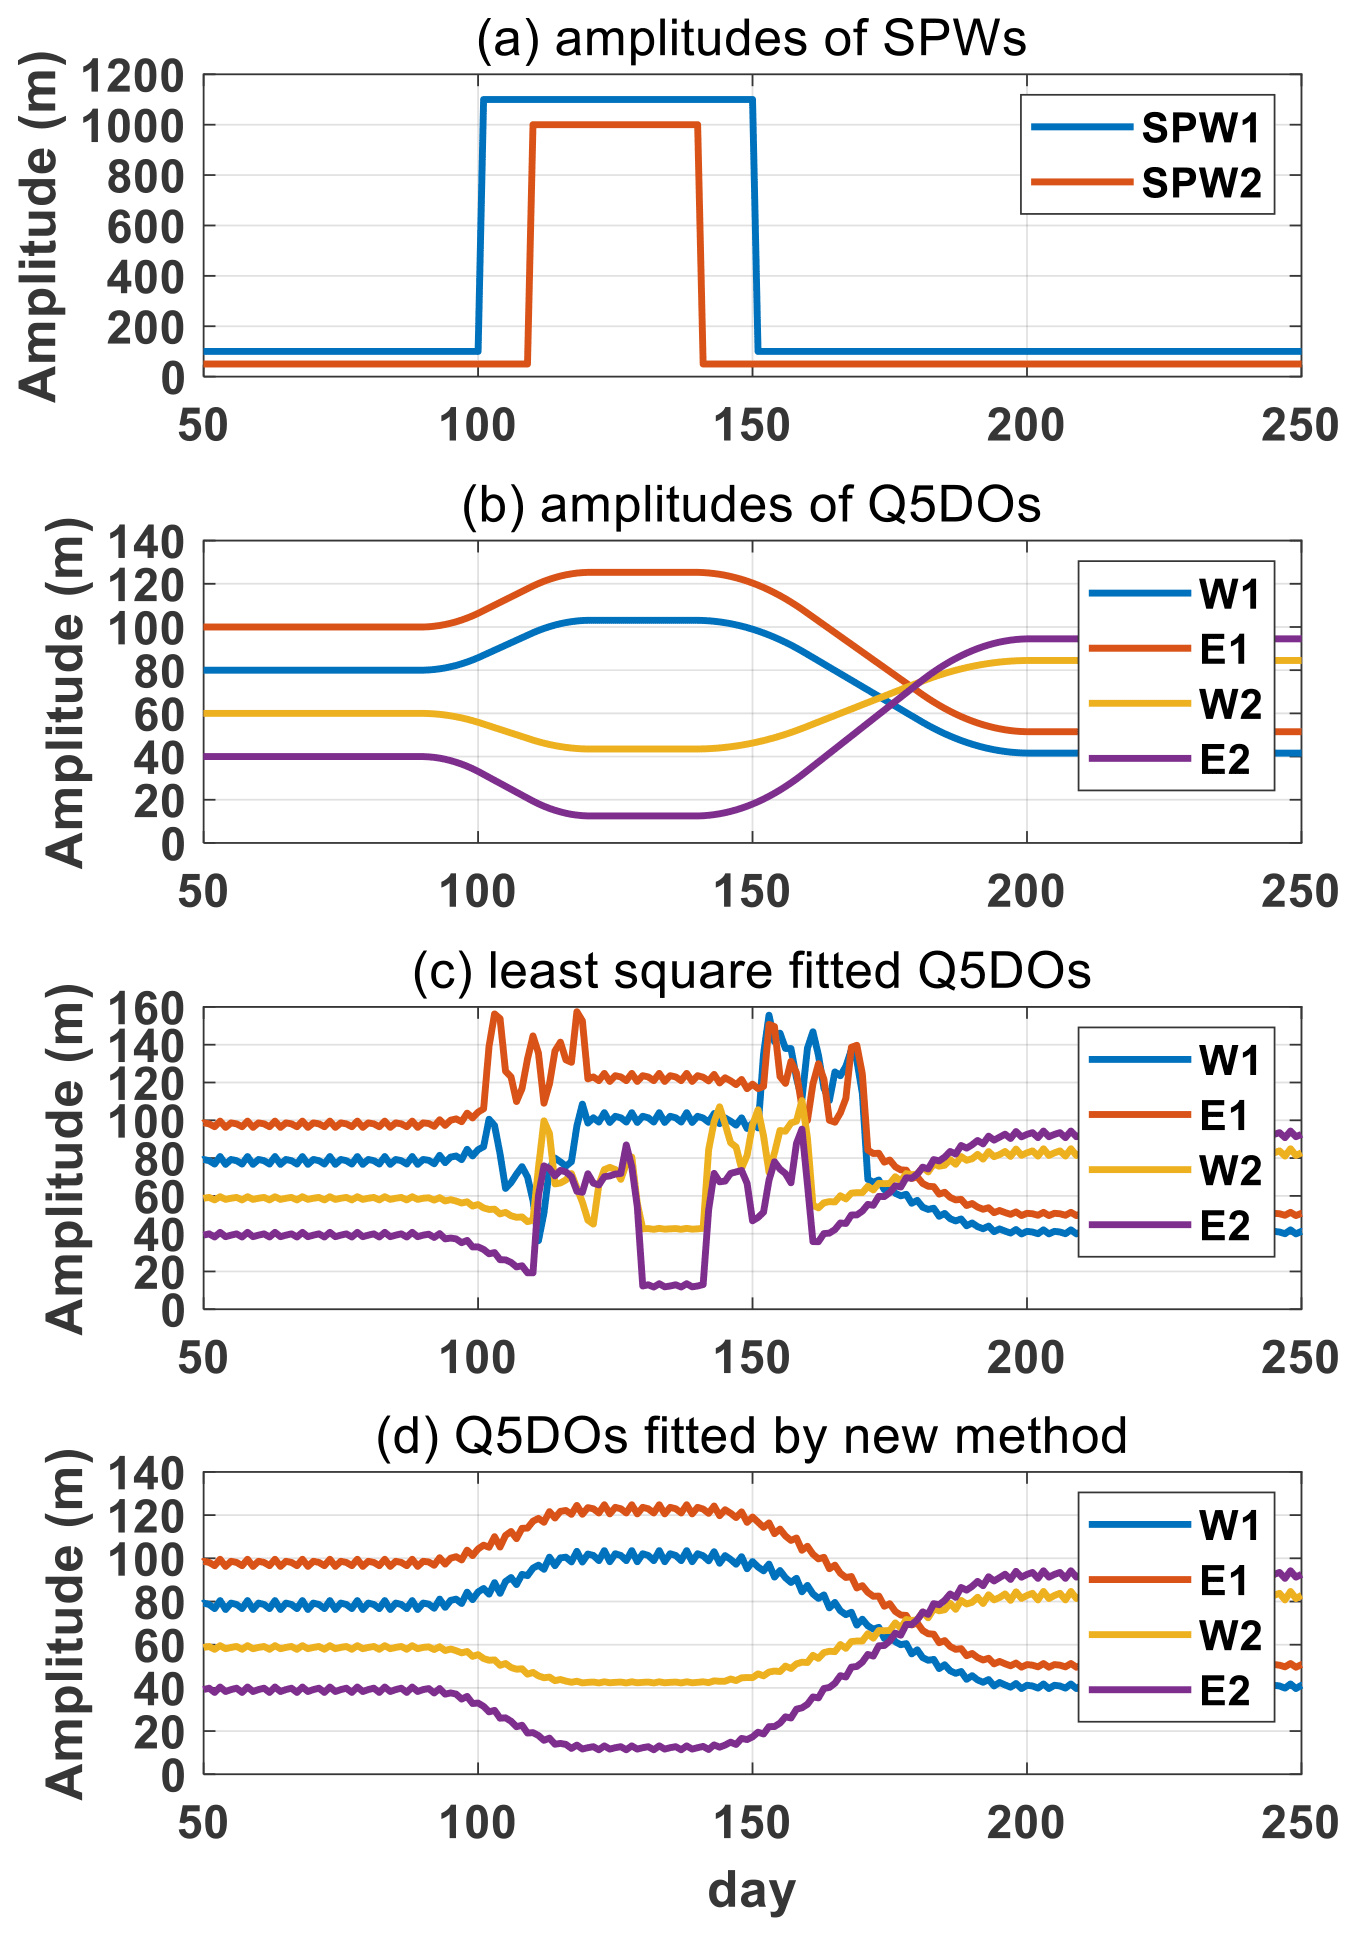
Figure 3Simulations of the new fitting method based on synthetic data, including (a) SPW1 and SPW2 and (b) westward and eastward Q5DOs with a zonal wave number of 1 and 2. The phase of SPW1 and SPW2 and of the W1, E1, W2, and E2 Q5DOs are set as 0, , , , , and , respectively. (c) Daily amplitudes of the fitted Q5DOs obtained from the original least squares fitting method. (d) Daily amplitudes of the fitted Q5DOs obtained from the new fitting method.
Note that some sawtooth-shaped points can be seen in the fitting results in Figs. 1, 2, and 3. The sawtooth-shaped points are caused by removing the linear declination on the time series. This process is required in both the original and new methods to eliminate the effect of seasonal trends in the observational data on the fitting of Q5DOs. The sawtooth-shaped points can be eliminated in the simulation by not removing the seasonal trends, but we keep them in both the original and new methods in the simulations in order to be consistent with the processes of dealing with the observational data.
4.2 Observations
The SPWs and TPWs can be both captured in the mesosphere region, and their origins have been reported in some previous studies. The mesospheric SPWs are usually believed to be related to the upward wave signals from the troposphere and the lower stratosphere which rely on the structure of the polar vortex (e.g., Harvey et al., 2018). In addition, wave–wave interactions, gravity wave forcing, and auroral heating can also generate mesospheric SPWs (e.g., Lu et al., 2018; Xu et al., 2013; Smith, 2003). The mesospheric TPWs are generally considered to be the result of atmospheric instabilities, and many recent studies have noticed the relationship between extremely strong TPWs and SSW events (Liu et al., 2004; Ma et al., 2020; Yamazaki et al., 2021). The mesospheric TPWs during SSWs can also be secondarily generated in situ by wave–wave interactions (e.g., Xiong et al., 2018; Wang et al., 2021). Nevertheless, the trigger mechanisms of mesospheric TPWs are still not fully understood due to a lack of long-term and high-resolution observational data in this region. Thus, satellite observations are widely used to reveal the feature of mesospheric TPWs. However, as indicated by our simulations, previous studies have ignored the effect of rapid and large changes in SPWs when calculating the variations in TPWs during SSWs. Using the geopotential height data provided by the Aura MLS measurement, we extract the variations in the traveling Q5DOs at 60∘ N during Arctic SSWs. The effectiveness of the new fitting method is discussed by comparing the results from the original least squares fitting method with those from the new method. The daily amplitudes of the Q5DOs are obtained with the largest value in the wave periods between 4 and 7 d. The fitting result is marked at the end day of each 20 d window. The traveling Q5DOs with a wave number of 3 and amplitudes below 10 hPa are not shown due to their weak amplitudes. In the present study, the pressure regions from 10 to 1 hPa, from 1 to 0.01 hPa, and from 0.01 to 0.001 hPa are discussed as the stratosphere, mesosphere, and lower thermosphere, respectively.
As observations from the Aura satellite are available after August 2004, the variations in traveling Q5DOs are investigated during eight midwinter major SSWs from 2005 to 2021 in the present study. Table 1 presents the eight midwinter major SSWs with their onset dates. The date with the maximum positive temperature gradient between 90 and 60∘ N at 10 hPa is defined as the SSW onset date, which is obtained around the date of the first wind reversal during each major event (e.g., Andrews et al., 1987). Note that the onset date used in the present study is only to roughly determine the commencement of SSWs, and our discussions are not sensitive to the nonuniform definitions of SSW onsets (e.g., Butler et al., 2015). In the present work, the SSW in the winter of 2009–2010 is classified as a minor event, as the wind reversal occurred 18 d after the onset date. To distinguished it from the SSW in February 2018, the SSW with the onset date of 28 December 2018 is referred to as the “2019 SSW” in this study. The SSWs before 2013 have been widely studied in previous publications (e.g., Choi et al., 2019; Charlton and Polvani, 2007; Butler et al., 2017; Liu et al., 2019; Rao et al., 2019), and the details of the three major SSWs from 2018 to 2021 are also available in many recent reports (e.g., Rao et al., 2018, 2020, 2021; Wang et al., 2019; Davis et al., 2022; Okui et al., 2021; Wright et al., 2021).
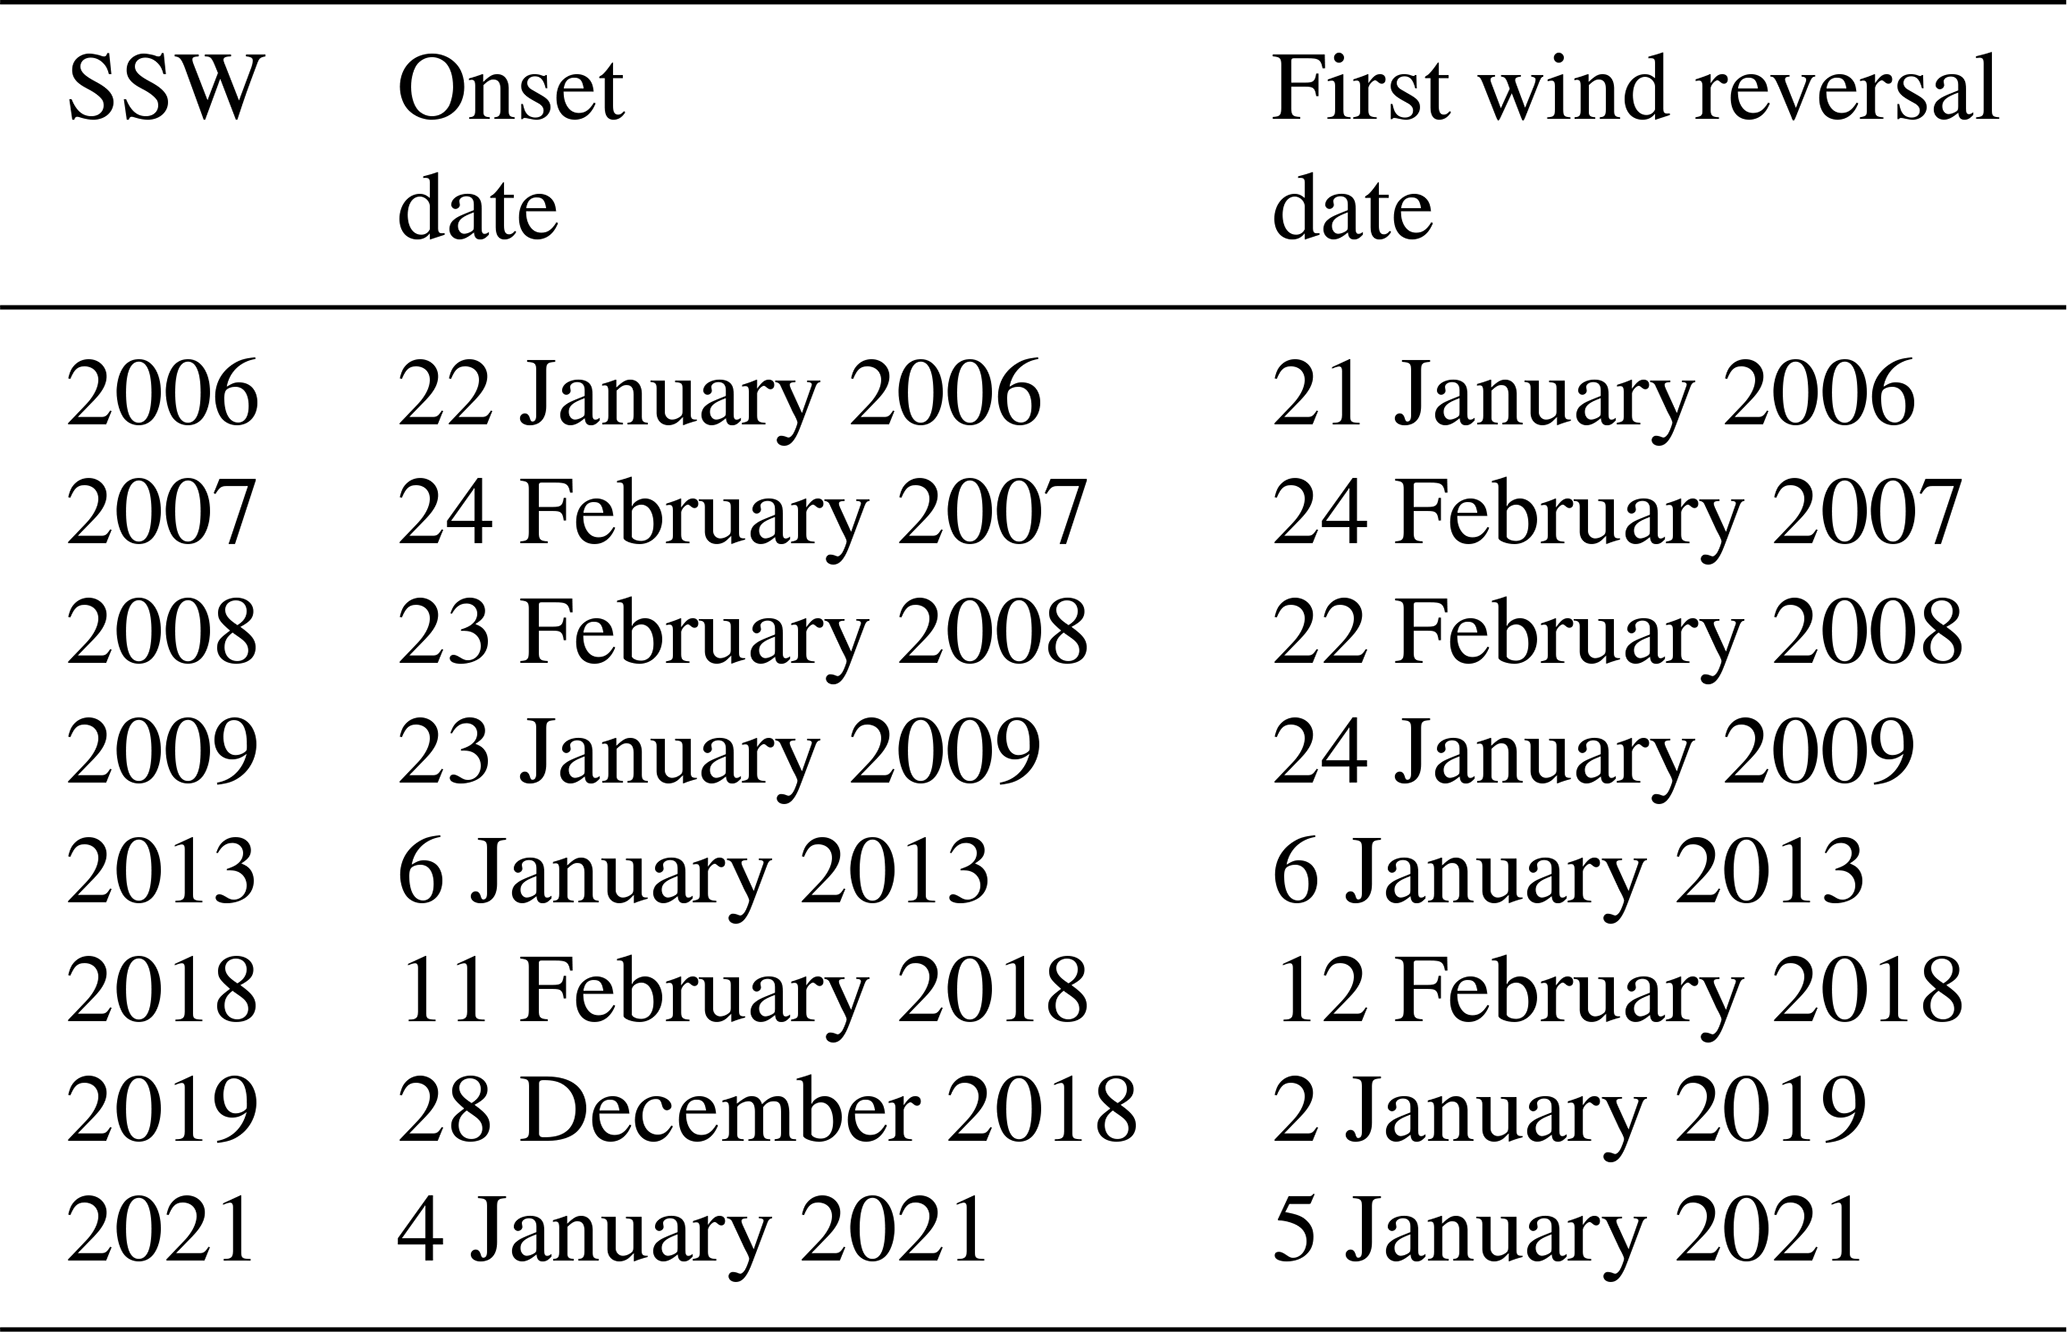

Figure 4The amplitudes of the W1 (a, b, c) and E1 (d, e, f) Q5DOs during the 2008 SSW obtained by the original least squares fitting method (a, d) and the new fitting method (b, e). The differences between the new and original methods are shown in panels (c) and (f). Contour steps are 10 m.

Comparisons of fitted amplitudes of traveling Q5DOs are shown in Figs. 4 and 5 for wave number 1 during the 2008 SSW and for wave number 2 during the 2013 SSW, respectively. Results for each case are given for 81 d, covering the period from 40 d before to 40 d after the SSW onset date (day 0). Figure 4 presents the amplitudes of W1 and E1 Q5DOs obtained from both the original (Fig. 4a, d) and new (Fig. 4b, e) methods during the 2008 SSW. The differences are calculated by subtracting the fitting result of the original method from the new method (Fig. 4c, f). Amplitudes are not fitted in the white area (where the data availability is less than 60 %) in each window. As shown in Fig. 4a, the W1 Q5DOs fitted by the original least squares fitting method reveal a significant response to the onset of the 2008 SSW. The amplitudes of the W1 Q5DOs in the mesosphere are larger than 500 m from days 0 to 20 with a maximum amplitude of 628 m on day 5. Figure 4b suggests that the amplitudes obtained from the new method are lower than 500 m during the 2008 SSW. The maximum amplitude obtained from the new method is 466 m on day 5, which is about 75 % of the amplitude obtained from the original least squares fitting method. The negative differences shown in Fig. 4c are generally larger than 200 m from days 0 to 20 in the mesosphere, indicating that the amplitudes of W1 Q5DOs after the onset of the 2008 SSW might be overestimated by the original least squares fitting method. Nevertheless, positive differences larger than 100 m are also captured before the SSW onset (day −15) around 1 hPa, as shown in Fig. 4c, revealing that the amplitudes of W1 Q5DOs obtained from the original method can also be underestimated during the 2008 SSW. For the amplitudes of E1 Q5DOs during the 2008 SSW, the original least squares fitting method may present an overestimation before the onset date and an underestimation after the onset date. As shown in Fig. 4f, the positive and negative differences both have maximum amplitudes over 200 m in the mesosphere around the onset date.
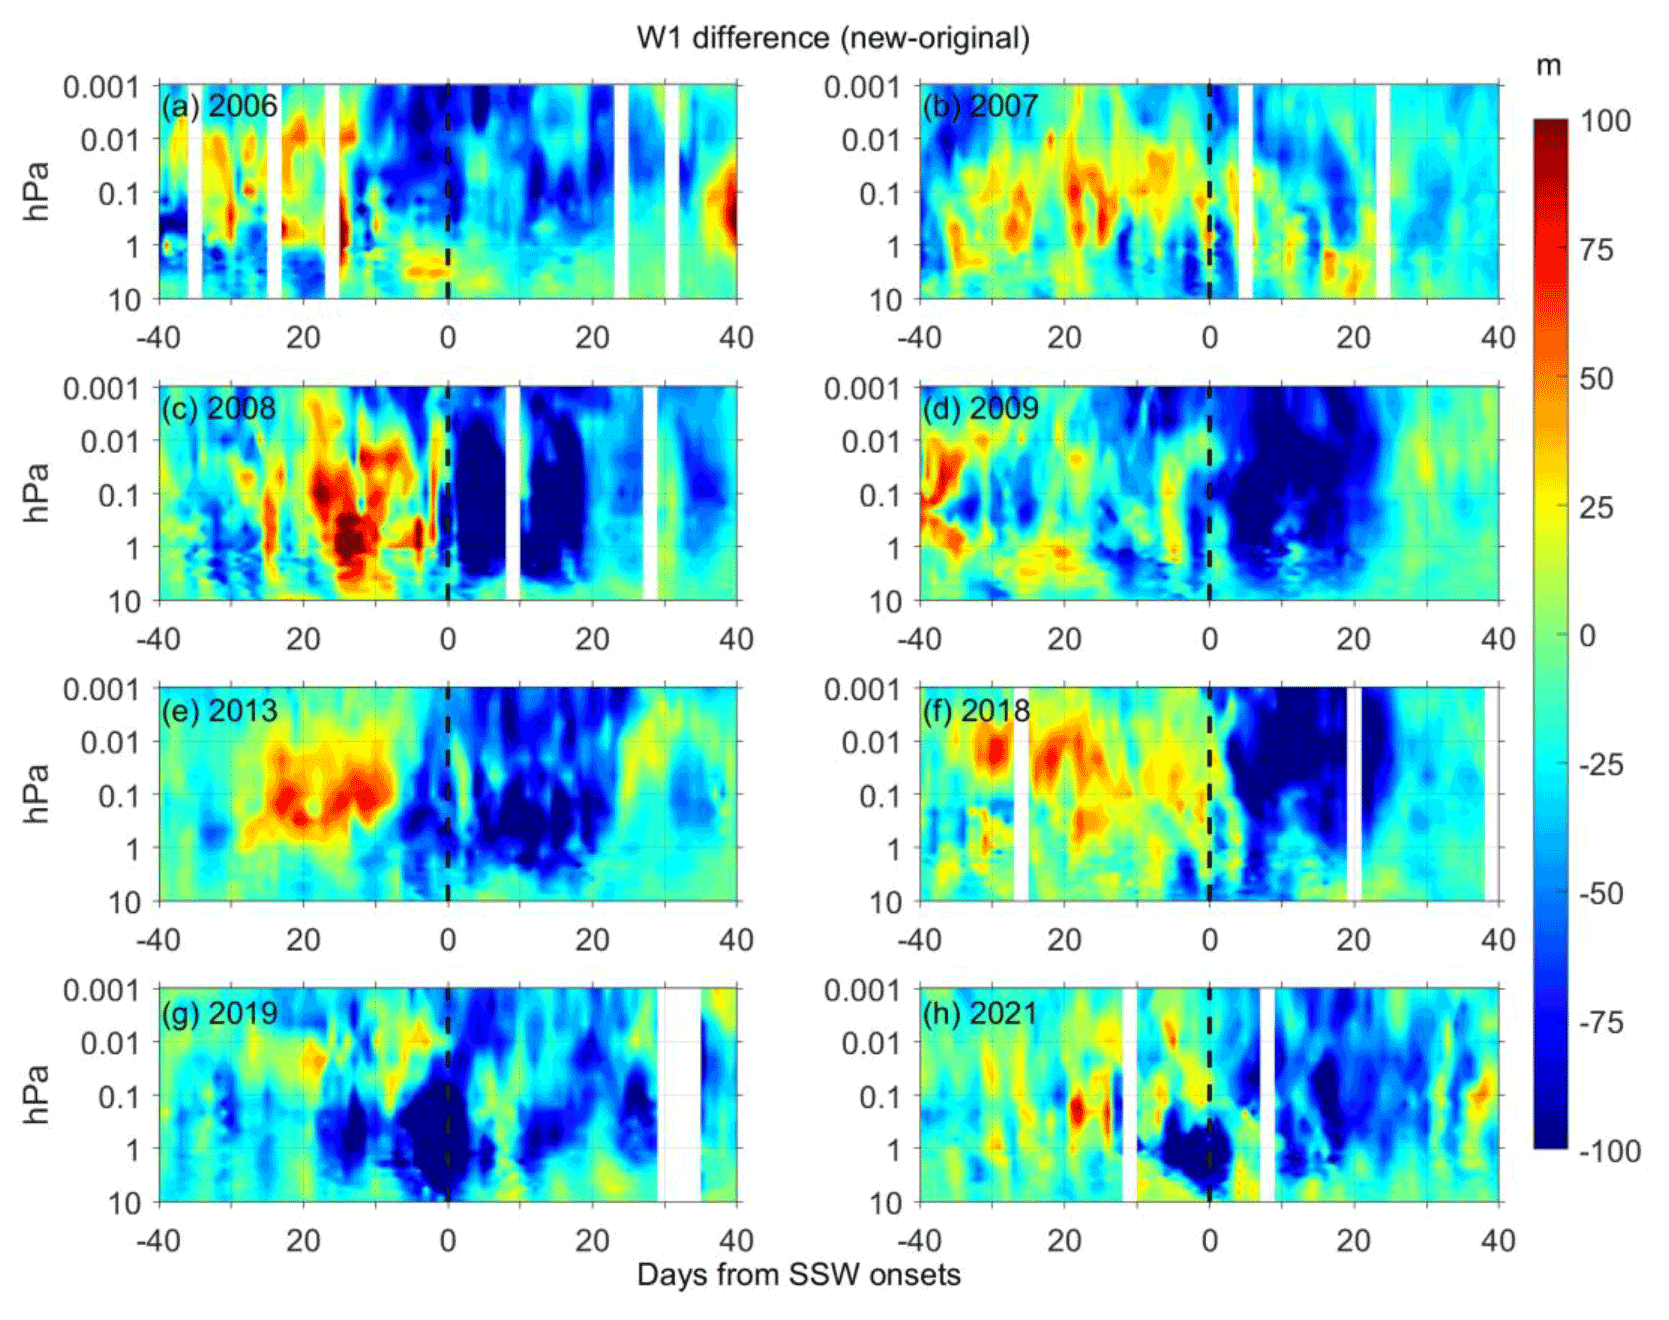
Figure 6The differences in the fitted W1 Q5DO amplitudes between the new and original methods during eight major SSWs from 2006 to 2021 (a–h). Contour steps are 5 m.
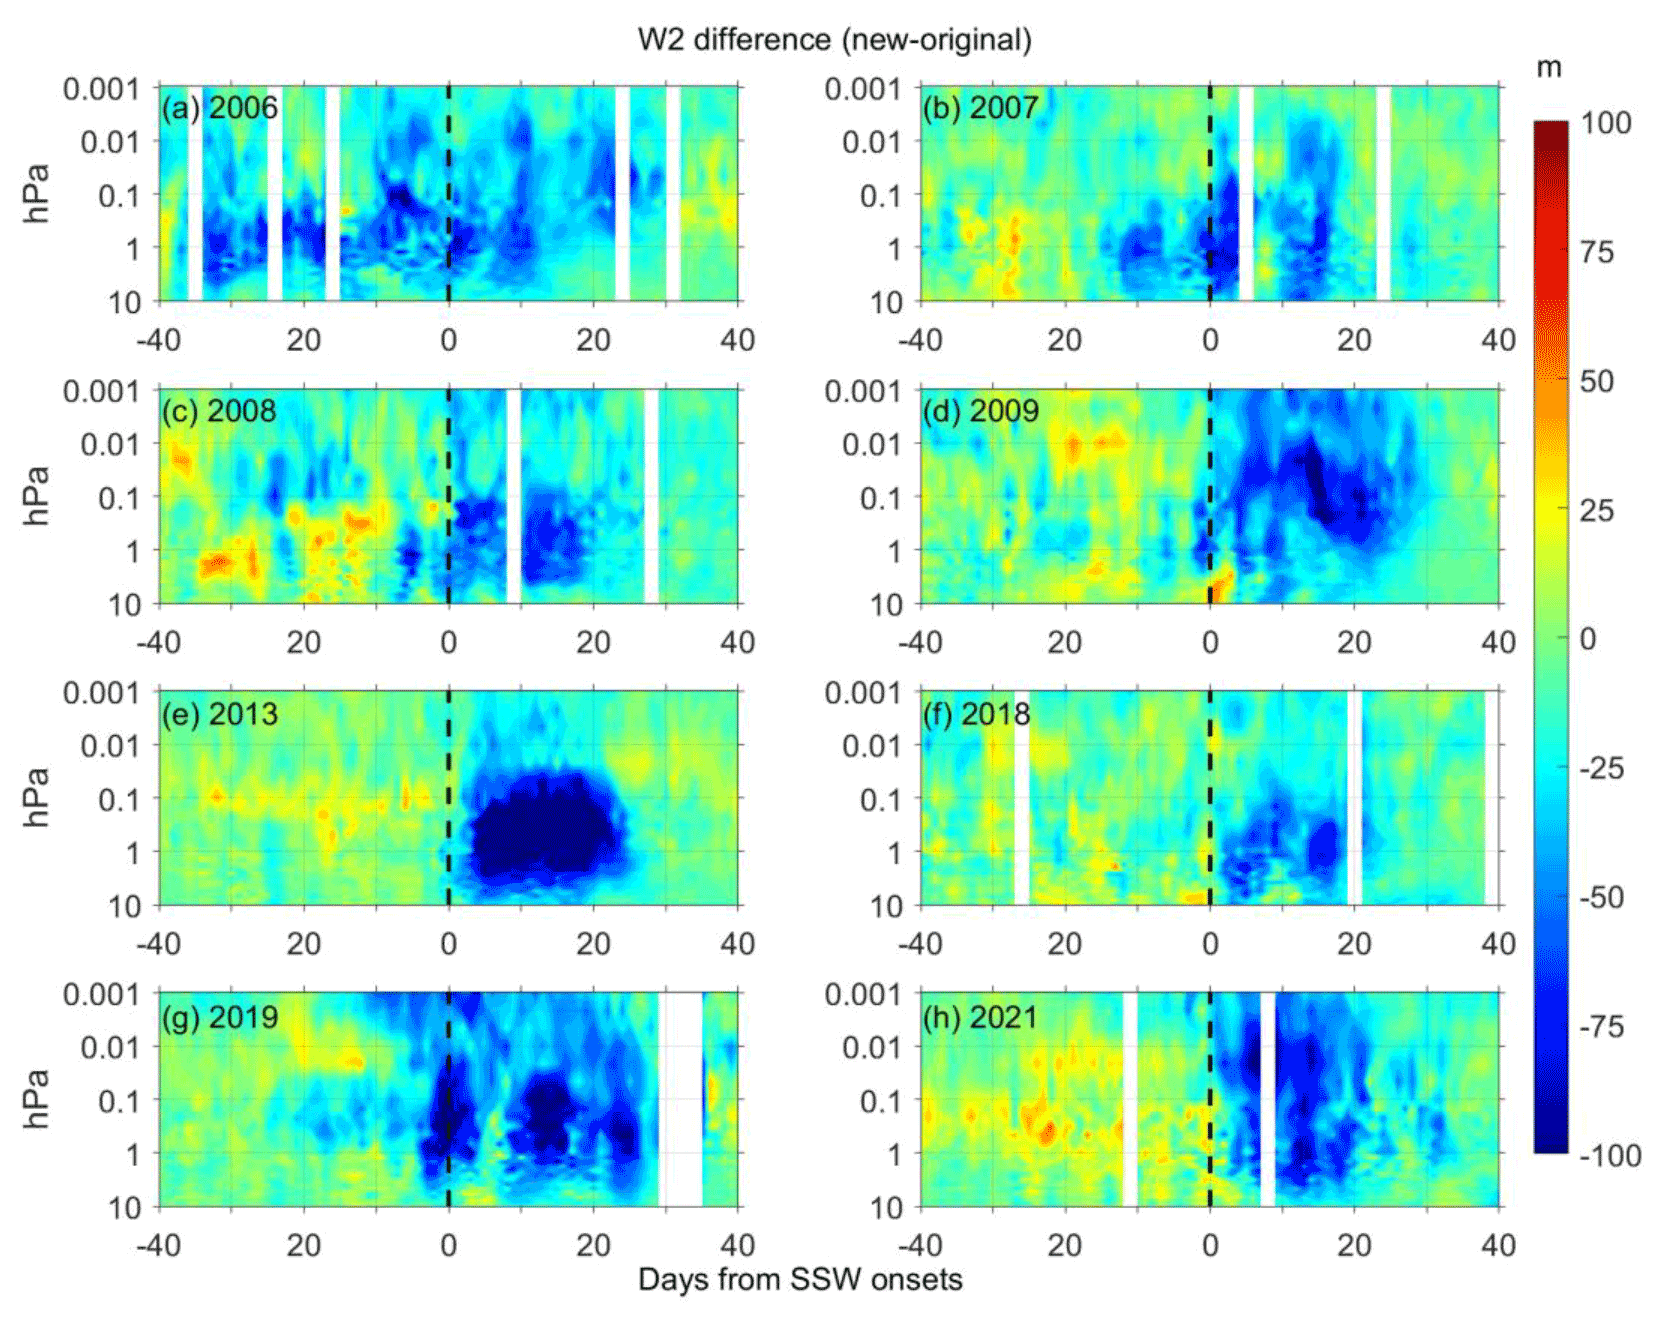
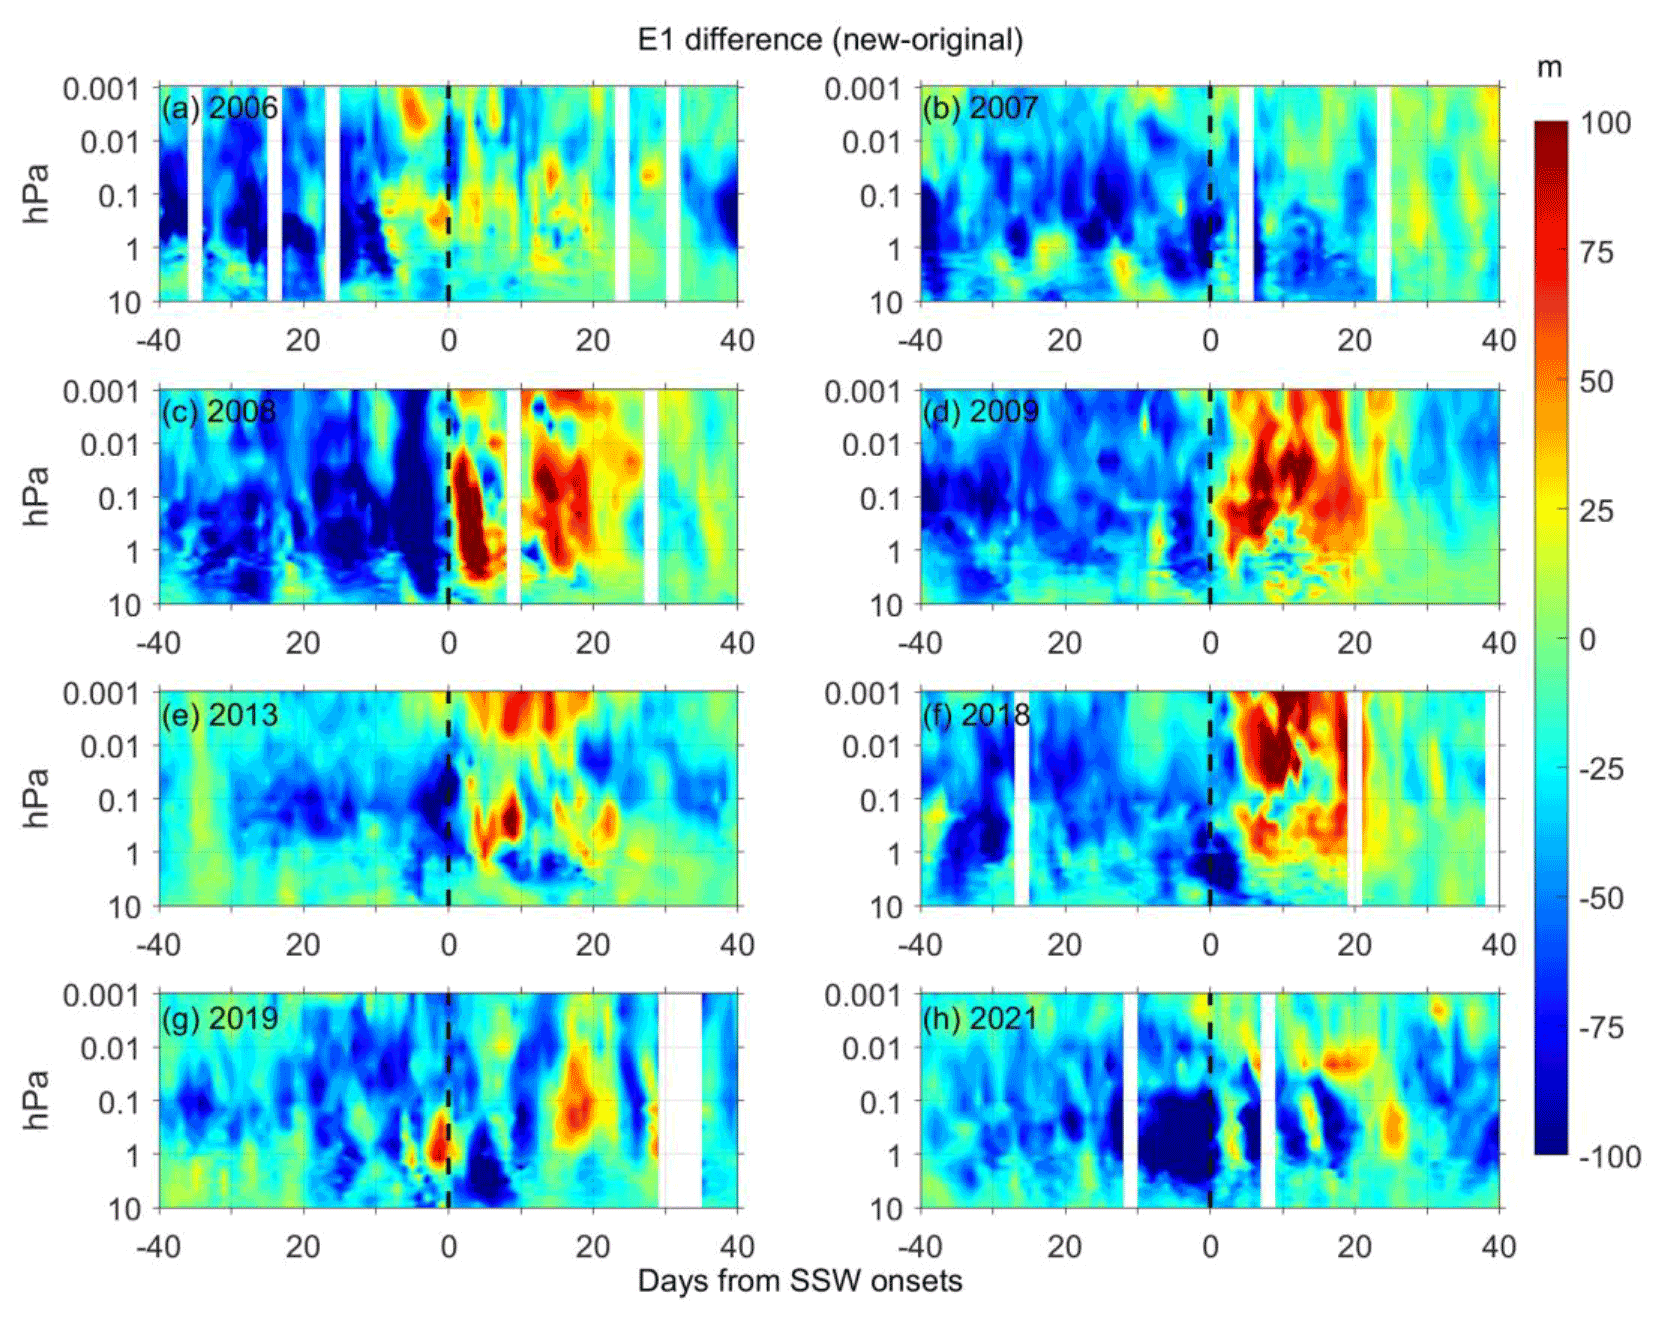
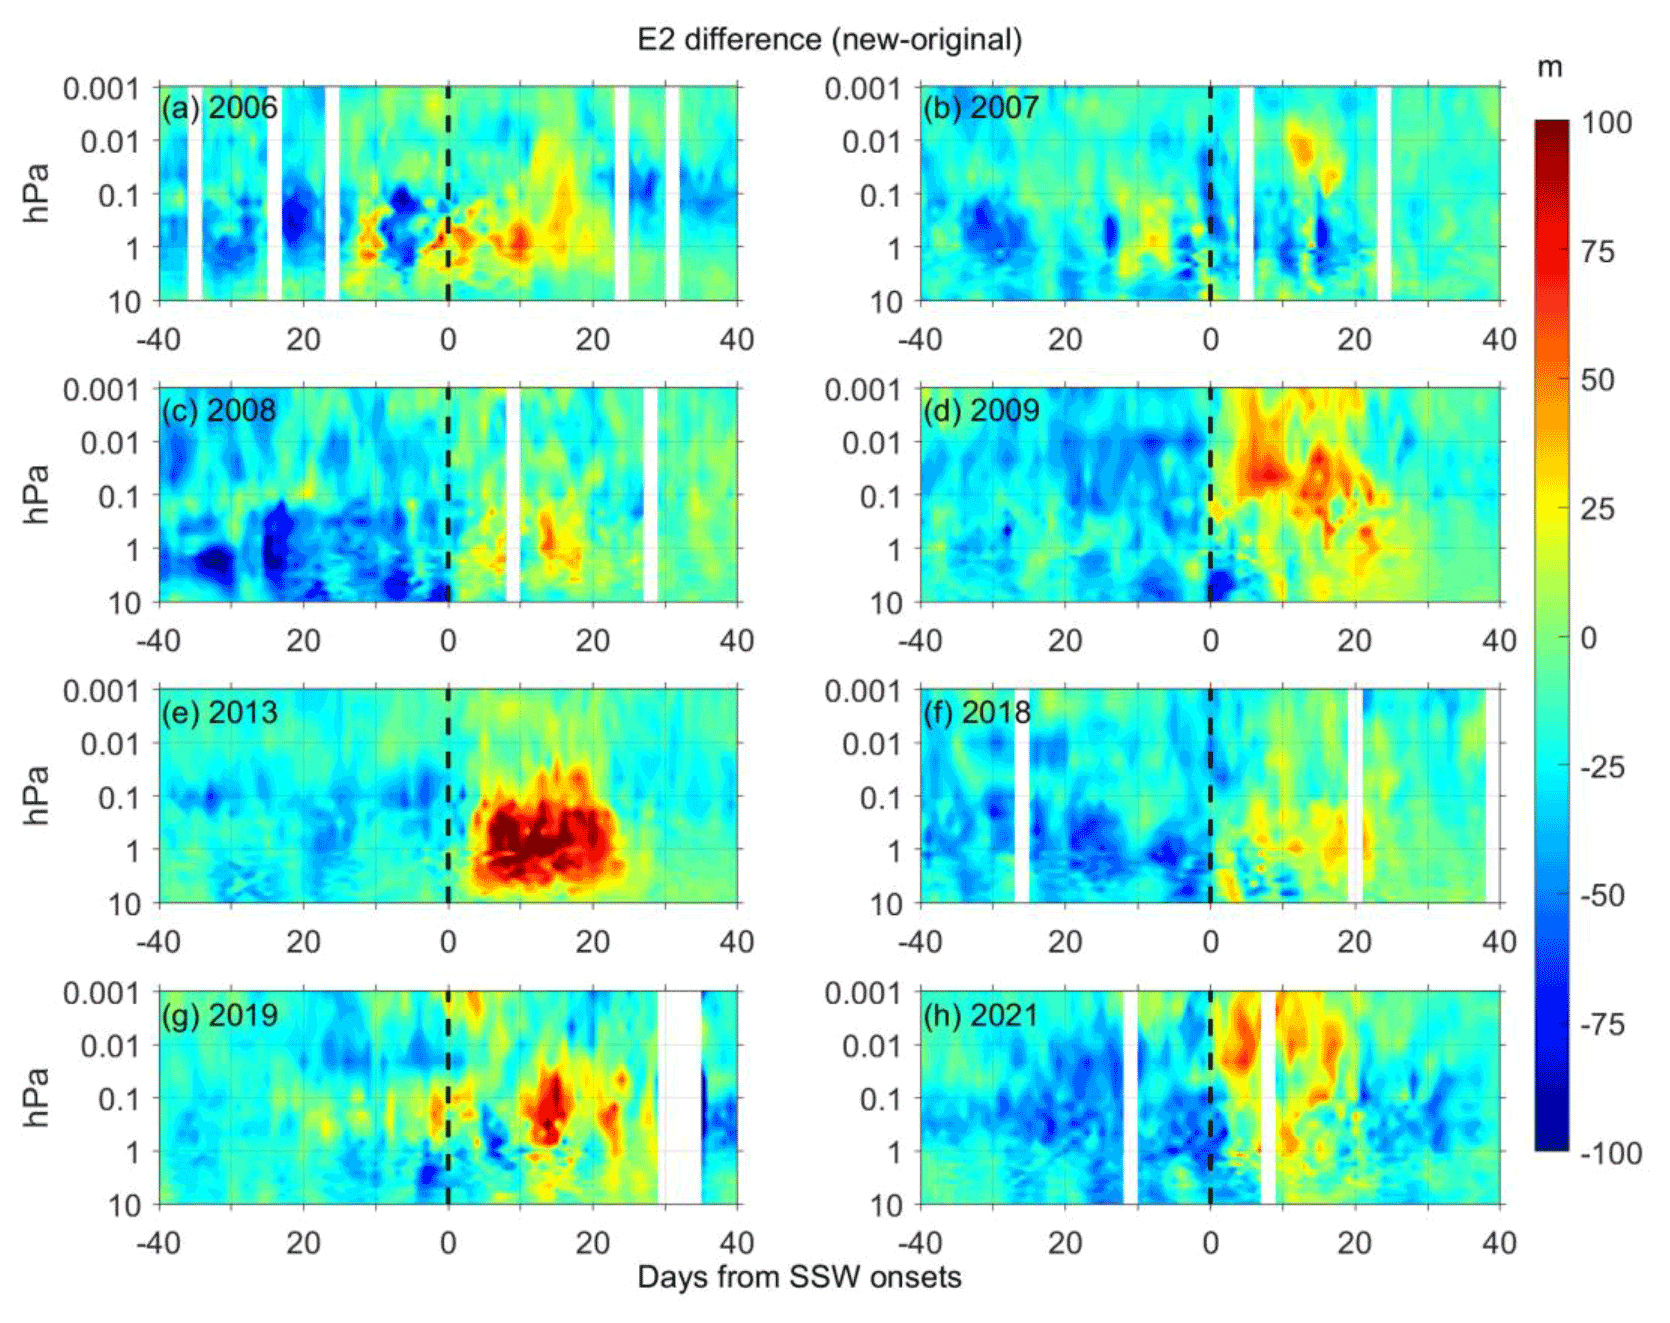
Figure 5 presents the same results as Fig. 4 but for the amplitudes of the W2 and E2 Q5DOs during the 2013 SSW. As shown in Fig. 5, strong enhancements of W2 Q5DOs and weak amplitudes of E2 Q5DOs after the 2013 SSW are captured by the original least squares fitting method. However, results from the new method after the onset of the 2013 SSW suggest that, based on the original least squares fitting method, the amplitudes of W2 Q5DOs might be overestimated and the amplitudes of E2 Q5DOs may be underestimated. The maximum positive and negative differences are both over 100 m. In order to understand the common differences between the two methods, we calculate the differences during the eight SSWs and present the results in Figs. 6, 7, 8, and 9 for the W1, W2, E1, and E2 components, respectively.
As shown in Figs. 6 and 7, the difference in the fitted westward-propagating Q5DO amplitudes between the new and original methods are usually negative after the SSW onsets, suggesting that the amplitudes of the westward-propagating Q5DOs might be overestimated by the original least squares fitting method after the SSW onsets. However, the difference in the fitted eastward-propagating Q5DO amplitudes between the new and original methods (as shown in Figs. 8 and 9) are usually positive after the SSW onsets, indicating that the amplitudes of the eastward-propagating Q5DOs might be underestimated by the original least squares fitting method after the SSW onsets. Additionally, the E1 Q5DOs before the SSW onsets might also be overestimated by the original least squares fitting method, as seen in Fig. 8. The enhancements of traveling Q5DOs during SSWs reported in previous studies are usually westward propagating after the SSW onsets and eastward propagating before the SSW onsets (e.g., Gong et al., 2018; Yu et al., 2022). Thus, our analyses indicate that the previously reported Q5DOs obtained by satellite measurements during SSWs might be contaminated by SPWs. The amplitudes of the enhancement of Q5DOs during SSWs might be overestimated. Additionally, the westward-propagating Q5DOs before the SSW onsets and the eastward-propagating Q5DOs after the SSW onsets might be underestimated by the original least squares fitting method. Therefore, in future studies of the activities of Q5DOs during SSWs based on satellite observations and reanalysis data, the variations in different wave components in Q5DOs have to be carefully derived by eliminating the effects of SPWs.
Generally, the TPWs, including the Q5DOs, dominate in the mesosphere and lower thermosphere, which are enhanced seasonally during winter and spring and largely control the winds and temperatures in the middle atmosphere (e.g., Gong et al., 2018, 2019; Pancheva et al., 2018; Yamazaki et al., 2020, 2021). The vertical and latitudinal propagation of the TPWs can also transport energy and lead to coupling on a global scale (e.g., Koushik et al., 2020; Ma et al., 2022). Thus, extracting the real amplitudes of the traveling waves is also important to reveal the characteristics in the mesosphere and the vertical couplings in the middle atmosphere. Some extremely strong TPWs are found to be related to the occurrence of SSWs, but their trigger mechanisms have not been fully understood (e.g., Ma et al., 2020; Yamazaki et al., 2021). However, the rapid and large change in the SPWs during SSWs can lead to contamination when deriving the real amplitudes of TPWs based on satellite observations or reanalysis data. The new method proposed in the present study can capture a more accurate variation in the amplitudes of TPWs than the old one. The new method is based on examinations during SSW events due to the assumption that a rapid and large change in SPWs is usually observed during SSWs. Nevertheless, the new method can also be used to extract the amplitudes of TPWs in the mesosphere during other seasons and cases, such as the spring final warmings and other disturbances in stratospheric vortices. Based on the new method, the common feature of the TPWs revealed by satellite observations in the mesosphere and lower thermosphere can be reevaluated, and the trigger mechanism of the mesospheric TPWs during SSWs can be further understood.
In the present study, a new fitting method is developed to derive the variations in traveling Q5DOs by inhibiting the effect of rapid and large changes in the amplitudes of SPWs. The effectiveness of the new method is demonstrated by both synthetic and observational data. According to the simulations, the new method can capture the variations in the amplitudes of traveling Q5DOs when large and rapid changes in SPWs are given. Based on the geopotential height data measured by MLS onboard the Aura satellite, we compare the difference in the traveling Q5DOs amplitudes between the original least squares fitting method and the new fitting method in the middle atmosphere during eight Arctic major SSWs from 2005 to 2021. Our results indicate that the enhancements of traveling Q5DOs during SSWs reported in previous studies might be overestimated due to the omission of the effect of rapid large changes in SPWs. Moreover, the amplitudes of westward-propagating Q5DOs before the SSW onsets and the amplitudes of eastward-propagating Q5DOs after the SSW onsets might be underestimated. Note that, as the amplitudes of SPWs cannot be derived accurately due to the aliasing of Q5DOs, the contribution of the SPWs and Q5DOs during SSWs cannot be quantified using the present method. Our goal is to attenuate the effect of SPWs on the derivation of Q5DOs during SSWs. Future works are needed to examine the effectiveness of the new method by using traveling planetary oscillations with other periods, such as the quasi-10-day and quasi-16-day waves.
The Aura MLS geopotential height data can be downloaded from the Goddard Earth Sciences Data and Information Services Center: https://acdisc.gesdisc.eosdis.nasa.gov/data/Aura_MLS_Level2/ML2GPH.004/ (NASA, 2022).
ZM and YG proposed the scientific ideas. QX and ZM contributed to data processing and simulation programming. ZM, YG, and SZ completed the analysis and manuscript. CH and KH discussed the results in the manuscript.
The contact author has declared that none of the authors has any competing interests.
Publisher’s note: Copernicus Publications remains neutral with regard to jurisdictional claims in published maps and institutional affiliations.
We acknowledge the Goddard Earth Sciences Data and Information Services Center for providing the Aura MLS geopotential height data.
This research has been supported by the Open Fund of Hubei Luojia Laboratory, the National Natural Science Foundation of China (grant nos. 42104145, 41574142, and 42127805), the Fundamental Research Funds for the Central Universities (grant no. 2042021kf0021), and the China Postdoctoral Science Foundation (grant nos. 2021M692465 and 2020TQ0230).
This paper was edited by Martin Dameris and reviewed by two anonymous referees.
Andrews, D. G., Holton, J. R., and Leovy, C. B.: Middle Atmosphere Dynamics, 1st ed., Academic Press, San Diego, California, eBook ISBN 9780080511672, Paperback ISBN 9780120585762, 1987.
Baldwin, M. P., Ayarzagüena, B., Birner, T., Butchart, N., Butler, A. H., and Charlton-Perez, A. J.: Sudden stratospheric warmings, Rev. Geophys., 58, e2020RG000708, https://doi.org/10.1029/2020RG000708, 2021.
Butler, A. H., Seidel, D. J., Hardiman, S. C., Butchart, N., Birner, T., and Match, A.: Defining Sudden Stratospheric Warmings, B. Am. Meteorol. Soc., 96, 1913–1928, https://doi.org/10.1175/BAMS-D-13-00173.1, 2015.
Butler, A. H., Sjoberg, J. P., Seidel, D. J., and Rosenlof, K. H.: A sudden stratospheric warming compendium, Earth Syst. Sci. Data, 9, 63–76, https://doi.org/10.5194/essd-9-63-2017, 2017.
Charlton, A. J. and Polvani, L. M.: A new look at stratospheric sudden warmings. Part I: Climatology and modeling benchmarks, J. Climate, 20, 449–469, https://doi.org/10.1175/JCLI3996.1, 2007.
Choi, H., Kim, B. M., and Choi, W.: Type classification of sudden stratospheric warming based on pre- and postwarming periods, J. Climate, 32, 2349–2367, https://doi.org/10.1175/JCLI-D-18-0223.1, 2019.
Davis, N. A., Richter, J. H., Glanville, A. A., Edwards, J., and LaJoie, E.: Limited surface impacts of the January 2021 sudden stratospheric warming. Nat. Commun., 13, 1136, https://doi.org/10.1038/s41467-022-28836-1, 2022.
Domeisen, D. I. V., Butler, A. H., Charlton-Perez, A. J., Ayarzagüena, B., Baldwin, M. P., Dunn-Sigouin, E., Furtado, J. C., Garfinkel, C. I., Hitchcock, P., Karpechko, A. Yu., Kim, H., Knight, J., Lang, A. L., Lim, E., Marshall, A., Roff, G., Schwartz, C., Simpson, I. R., Son, S., and Taguchi, M.: The role of the stratosphere in subseasonal to seasonal prediction: 2. Predictability arising from stratosphere-troposphere coupling, J. Geophys. Res.-Atmos., 125, e2019JD030923, https://doi.org/10.1029/2019JD030923, 2020.
Gong, Y., Li, C., Ma, Z., Zhang, S., Zhou, Q., Huang, C., Huang, K., Li, G., and Ning, B.: Study of the quasi-5-day wave in the MLT region by a meteor radar chain, J. Geophys. Res.-Atmos., 123, 9474–9487, https://doi.org/10.1029/2018JD029355, 2018.
Gong, Y., Wang, H., Ma, Z., Zhang, S., Zhou, Q., Huang, C., and Huang, K.: A statistical analysis of the propagating quasi 16-day waves at high latitudes and their response to sudden stratospheric warmings from 2005 to 2018, J. Geophys. Res.-Atmos., 124, 12617–12630, https://doi.org/10.1029/2019JD031482, 2019.
Harada, Y. and Hirooka, T.: Extraordinary features of the planetary wave propagation during the boreal winter 2013/2014 and the zonal wave number two predominance, J. Geophys. Res.-Atmos., 122, 11374–11387, https://doi.org/10.1002/2017JD027053, 2017.
Harvey, V. L., Randall, C. E., Goncharenko, L., Becker, E., and France, J.: On the upward extension of the polar vortices into the mesosphere, J. Geophys. Res.-Atmos., 123, 9171–9191, https://doi.org/10.1029/2018JD028815, 2018.
Huang, Y. Y., Zhang, S., Li, C. Y., Li, H. J., Huang, K., and Huang, C.: Annual and inter-annual variations in global 6.5DWs from 20–110 km during 2002–2016 observed by TIMED/SABER, J. Geophys. Res.-Space, 122, 8985–9002, https://doi.org/10.1002/2017JA023886, 2017.
King, A. D., Butler, A. H., Jucker, M., Earl, N. O., and Rudeva, I.: Observed relationships between sudden stratospheric warmings and European climate extremes, J. Geophys. Res.-Atmos., 124, 13943–13961, https://doi.org/10.1029/2019JD030480, 2019.
Koushik, N., Kumar, K. K., Ramkumar, G., Subrehmanyam, K. V., Kishore Kumar, G., Hocking, W. K., He, M., and Latteck, R.: Planetary waves in the mesosphere lower thermosphere during stratospheric sudden warming: Observations using a network of meteor radars from high to equatorial latitudes, Climate Dynam., 54, 4059–4074, https://doi.org/10.1007/s00382-020-05214-5, 2020.
Kozubek, M., Krizan, P., and Lastovicka, J.: Northern Hemisphere stratospheric winds in higher midlatitudes: longitudinal distribution and long-term trends, Atmos. Chem. Phys., 15, 2203–2213, https://doi.org/10.5194/acp-15-2203-2015, 2015.
Lawrence, Z. D. and Manney, G. L.: Characterizing stratospheric polar vortex variability with computer vision techniques, J. Geophys. Res.-Atmos., 123, 1510–1535, 2018.
Lin, J. T., Lin, C. H., Rajesh, P. K., Yue, J., Lin, C. Y., and Matsuo, T.: Local-time and vertical characteristics of quasi-6-day oscillation in the ionosphere during the 2019 Antarctic sudden stratospheric warming, Geophys. Res. Lett., 47, e2020GL090345, https://doi.org/10.1029/2020GL090345, 2020.
Livesey, N. J., Read, W. G., Wagner, P. A., Froidevaux, L., Lambert, A., Manney, G. L., Millán, L. F., Pumphrey, H. C., Santee, M. L., Schwartz, M. J., Wang, S., Fuller, R. A., Jarnot, R. F., Knosp, B. W., Martinez, E., and Lay, R. R.: Earth Observing Sys tem (EOS) Aura Microwave Limb Sounder (MLS) Version 4.2x Level 2 and 3 data quality and description document, Jet Propul sion Laboratory, California Institute of Technology, 20 April, 2020.
Liu, H. L., Talaat, E. R., Roble, R. G., Lieberman, R. S., Riggin, D. M., and Yee, J. H.: The 6.5-day wave and its seasonal variability in the middle and upper atmosphere, J. Geophys. Res., 109, D21112, https://doi.org/10.1029/2004JD004795, 2004.
Liu, S.-M., Chen, Y.-H., Rao, J., Cao, C., Li, S.-Y., Ma, M.-H., and Wang, Y.-B.: Parallel Comparison of Major Sudden Stratospheric Warming Events in CESM1-WACCM and CESM2-WACCM, Atmosphere, 10, 679, https://doi.org/10.3390/atmos10110679, 2019.
Lu, X., Wu, H., Oberheide, J., Liu, H.-L., and McInerney, J. M.: Latitudinal double-peak structure of stationary planetary wave 1 in the austral winter middle atmosphere and its possible generation mechanism, J. Geophys. Res.-Atmos., 123, 11551–11568, https://doi.org/10.1029/2018JD029172, 2018.
Ma, Z., Gong, Y., Zhang, S., Zhou, Q., Huang, C., Huang, K., Luo, J., Yu, Y., Li, G.: Study of a quasi-4-day oscillation during the 2018/2019 SSW over Mohe, China, J. Geophys. Res.-Space, 125, e2019JA027687, https://doi.org/10.1029/2019JA027687, 2020.
Ma, Z., Gong, Y., Zhang, S., Xiao, Q., Xue, J., Huang, C., and Huang, K.: Understanding the excitation of quasi-6-day waves in both hemispheres during the September 2019 Antarctic SSW, J. Geophys. Res.-Atmos., 127, e2021JD035984, https://doi.org/10.1029/2021JD035984, 2022.
Manney, G. L., Schwartz, M. J., Krüger, K., Santee, M. L., Pawson, S., Lee, J. N., Daffer, W. H., Fuller, R. A., and Livesey, N. J.: Aura Microwave Limb Sounder observations of dynamics and transport during the record breaking 2009 Arctic stratospheric major warming, Geophys. Res. Lett., 36, L12815, https://doi.org/10.1029/2009GL038586, 2009.
Matsuno, T.: A dynamical model of the stratospheric sudden warming, J. Atmos. Sci., 28, 1479–1494, https://doi.org/10.1175/1520-0469(1971)028<1479:ADMOTS>2.0.CO;2, 1971.
NASA: Aura/MLS geopotential height, Goddard Earth Sciences Data and Information Services Center [data set], https://acdisc.gesdisc.eosdis.nasa.gov/data/Aura_MLS_Level2/ML2GPH.004/, last access: 1 October 2022.
Okui, H., Sato, K., Koshin, D., and Watanabe, S.: Formation of a mesospheric inversion layer and the subsequent elevated stratopause associated with the major stratospheric sudden warming in 2018/19, J. Geophys. Res.-Atmos., 126, e2021JD034681, https://doi.org/10.1029/2021JD034681, 2021.
Pancheva, D., Mukhtarov, P., and Siskind, D. E.: The quasi-6-day waves in NOGAPS-ALPHA forecast model and their climatology in MLS/Aura measurements (2005–2014), J. Atmos. Sol.-Terr. Phy., 181, 19–37, https://doi.org/10.1016/j.jastp.2018.10.008, 2018.
Qin, Y., Gu, S.-Y., Teng, C.-K.-M., Dou, X.-K., Yu, Y., and Li, N.: Comprehensive study of the climatology of the quasi-6-day wave in the MLT region based on aura/MLS observations and SDWACCM-X simulations, J. Geophys. Res.-Space, 126, e2020JA028454, https://doi.org/10.1029/2020JA028454, 2021.
Rao, J., Ren, R., Chen, H., Yu, Y., and Zhou, Y.: The stratospheric sudden warming event in February 2018 and its prediction by a climate system model, J. Geophys. Res.-Atmos., 123, 13332–13345, https://doi.org/10.1029/2018JD028908, 2018.
Rao, J., Ren, R., Chen, H., Liu, X., Yu, Y., Hu, J., and Zhou, Y.: Predictability of stratospheric sudden warmings in the Beijing Climate Center Forecast System with statistical error corrections, J. Geophys. Res.-Atmos., 124, 8385–8400, https://doi.org/10.1029/2019JD030900, 2019.
Rao, J., Garfinkel, C. I., and White, I. P.: Predicting the downward and surface influence of the February 2018 and January 2019 sudden stratospheric warming events in subseasonal to seasonal (S2S) models, J. Geophys. Res.-Atmos., 125, e2019JD031919, https://doi.org/10.1029/2019JD031919, 2020.
Rao, J., Garfinkel, C. I., Wu, T., Lu, Y., Lu, Q., and Liang, Z.: The January 2021 sudden stratospheric warming and its prediction in subseasonal to seasonal models, J. Geophys. Res.-Atmos., 126, e2021JD035057, https://doi.org/10.1029/2021JD035057, 2021.
Rhodes, C. T., Limpasuvan, V., and Orsolini, Y. J.: Eastward-propagating planetary waves prior to the january 2009 sudden stratospheric warming, J. Geophys. Res.-Atmos., 126, e2020JD033696., https://doi.org/10.1029/2020JD033696, 2021.
Seviour, W. J. M., Mitchell, D. M., and Gray, L. J.: A practical method to identify displaced and split stratospheric polar vortex events, Geophys. Res. Lett., 40, 5268–5273, https://doi.org/10.1002/grl.50927, 2013.
Smith, A. K.: The origin of stationary planetary waves in the upper mesosphere, J. Atmos. Sci., 60, 3033–3041, https://doi.org/10.1175/1520-0469(2003)060<3033:TOOSPW>2.0.CO;2, 2003.
Tunbridge, V. M., Sandford, D. J., and Mitchell, N. J.: Zonal wave numbers of the summertime 2 day planetary wave observed in the mesosphere by EOS Aura Microwave Limb Sounder, J. Geophys. Res., 116, D11103, https://doi.org/10.1029/2010JD014567, 2011.
Wang, J. C., Palo, S. E., Forbes, J. M., Marino, J., Moffat-Griffin, T., and Mitchell, N. J.: Unusual quasi 10-day planetary wave activity and the ionospheric response during the 2019 Southern Hemisphere sudden stratospheric warming J. Geophys. Res.-Space, 126, e2021JA029286, https://doi.org/10.1029/2021JA029286, 2021.
Wang, Y., Shulga, V., Milinevsky, G., Patoka, A., Evtushevsky, O., Klekociuk, A., Han, W., Grytsai, A., Shulga, D., Myshenko, V., and Antyufeyev, O.: Winter 2018 major sudden stratospheric warming impact on midlatitude mesosphere from microwave radiometer measurements, Atmos. Chem. Phys., 19, 10303–10317, https://doi.org/10.5194/acp-19-10303-2019, 2019.
White, I. P., Garfinkel, C. I., Cohen, J., Jucker, M., and Rao, J.: The impact of split and displacement sudden stratospheric warmings on the troposphere, J. Geophys. Res.-Atmos., 126, e2020JD033989, https://doi.org/10.1029/2020JD033989, 2021.
Wright, C. J., Hall, R. J., Banyard, T. P., Hindley, N. P., Krisch, I., Mitchell, D. M., and Seviour, W. J. M.: Dynamical and surface impacts of the January 2021 sudden stratospheric warming in novel Aeolus wind observations, MLS and ERA5, Weather Clim. Dynam., 2, 1283–1301, https://doi.org/10.5194/wcd-2-1283-2021, 2021.
Wu, D. L., Hays, P. B., and Skinner, W. R.: A least-squares method for spectral-analysis of space-time series, J. Atmos. Sci., 52, 3501–3511, https://doi.org/10.1175/1520-0469(1995)052<3501:ALSMFS>2.0.CO;2, 1995.
Xiong, J., Wan, W., Ding, F., Liu, L., Hu, L., and Yan, C.: Two day wave traveling westward with wave number 1 during the sudden stratospheric warming in January 2017, J. Geophys. Res.-Space, 123, 3005–3013, https://doi.org/10.1002/2017JA025171, 2018.
Xu, J., Smith, A. K., Wang, W., Jiang, G., Yuan, W., Gao, H., Yue, J., Funke, B., López-Puertas, M., Russell, I. I. I., and M, J.: An observational and theoretical study of the longitudinal variation in neutral temperature induced by aurora heating in the lower thermosphere, J. Geophys. Res.-Space, 118, 7410–7425, 2013.
Yamazaki, Y. and Matthias, V.: Large-amplitude quasi-10-day waves in the middle atmosphere during final warmings, J. Geophys. Res.-Atmos., 124, 9874–9892, https://doi.org/10.1029/2019JD030634, 2019.
Yamazaki, Y., Matthias, V., Miyoshi, Y., Stolle, C., Siddiqui, T., Kervalishvili, G., Laštovička, J., Kozubek, M., Ward, W., Themens, D. R., Kristoffersen, S., and Alken, P.: September 2019 Antarctic sudden stratospheric warming: Quasi-6-day wave burst and ionospheric effects, Geophys. Res. Lett., 47, e2019GL086577, https://doi.org/10.1029/2019GL086577, 2020.
Yamazaki, Y., Matthias, V., and Miyoshi, Y.: Quasi-4-day wave: Atmospheric manifestation of the first symmetric Rossby normal mode of zonal wavenumber 2, J. Geophys. Res.-Atmos., 126, e2021JD034855, https://doi.org/10.1029/2021JD034855, 2021.
Yu, F. R., Huang, K. M., Zhang, S. D., Huang, C. M., and Gong, Y.: Observations of eastward propagating quasi 6-day waves from the troposphere to the lower thermosphere during SSWs in early 2016, J. Geophys. Res.-Atmos., 127, e2021JD036017, https://doi.org/10.1029/2021JD036017, 2022.