the Creative Commons Attribution 4.0 License.
the Creative Commons Attribution 4.0 License.
 | 01 Mar 2021
Lower-stratospheric aerosol measurements in eastward-shedding vortices over Japan from the Asian summer monsoon anticyclone during the summer of 2018
Tetsu Sakai
Tomohiro Nagai
Koichi Shiraishi
Yoichi Inai
Sergey Khaykin
Haosen Xi
Takashi Shibata
Masato Shiotani
Laura L. Pan
Eastward air-mass transport from the Asian summer monsoon (ASM) anticyclone in the upper troposphere and lower stratosphere (UTLS) often involves eastward-shedding vortices, which can cover most of the Japanese archipelago. We investigated the aerosol characteristics of these vortices by analysing data from two lidar systems in Japan, at Tsukuba (36.1∘ N, 140.1∘ E) and Fukuoka (33.55∘ N, 130.36∘ E), during the summer of 2018. We observed several events with enhanced particle signals at Tsukuba at 15.5–18 km of altitude (at or above the local tropopause) during August–September 2018, with a backscattering ratio of ∼ 1.10 and particle depolarization of ∼ 5 % (i.e. not spherical, but more spherical than ice crystals). These particle characteristics may be consistent with those of solid aerosol particles, such as ammonium nitrate. Each event had a timescale of a few days. During the same study period, we also observed similar enhanced particle signals in the lower stratosphere at Fukuoka. The upper troposphere is often covered by cirrus clouds at both lidar sites. Backward trajectory calculations for these sites for days with enhanced particle signals in the lower stratosphere and days without indicate that the former air masses originated within the ASM anticyclone and the latter more from edge regions. Reanalysis carbon monoxide and satellite water vapour data indicate that eastward-shedding vortices were involved in the observed aerosol enhancements. Satellite aerosol data confirm that the period and latitudinal region were free from the direct influence of documented volcanic eruptions and high-latitude forest fires. Our results indicate that the Asian tropopause aerosol layer (ATAL) over the ASM region extends east towards Japan in association with the eastward-shedding vortices and that lidar systems in Japan can detect at least the lower-stratospheric portion of the ATAL during periods when the lower stratosphere is undisturbed by volcanic eruptions and forest fires. The upper-tropospheric portion of the ATAL is either depleted by tropospheric processes (convection and wet scavenging) during eastward transport or is obscured by much stronger cirrus cloud signals.


The Asian summer monsoon (ASM) circulation includes a continental-scale anticyclone centred over the Tibetan Plateau, spanning from the Middle East to East Asia in the upper troposphere and lower stratosphere (UTLS). Satellite observations show elevated levels of trace gases of surface origin (e.g. Randel et al., 2010; Santee et al., 2017), aerosol particles (e.g. Vernier et al., 2015, 2018), and water vapour (e.g. Randel et al., 2015; Santee et al., 2017) within the ASM anticyclone due to active convection in this region and season. The ASM anticyclone exhibits distinct sub-seasonal variability due to westward- and eastward-shedding vortices (e.g. Popovic and Plumb, 2001; Amemiya and Sato, 2018), with the latter possibly being dynamically linked to the Bonin (or Ogasawara) high in the western Pacific (Enomoto et al., 2003) and constituting a major transport pathway of ASM air masses to the whole Northern Hemisphere (NH) midlatitude UTLS through the westerly jet stream (e.g. Garny and Randel, 2013; Vogel et al., 2014, 2016; Ungermann et al., 2016; Pan et al., 2016; Fadnavis et al., 2018; Luo et al., 2018; Honomichl and Pan, 2020). Eastward-shedding vortex events occur once every 10–20 d during the NH summer, with a horizontal scale of 20–30∘ longitude (2000–3000 km) and with a few days to 1 week of influence over the Japanese archipelago (e.g. Honomichl and Pan, 2020).
The enhanced aerosol particle signature in the ASM anticyclone at 14–18 km of altitude was first discovered from satellite observations (Vernier et al., 2011) and thereafter referred to as the Asian tropopause aerosol layer (ATAL). It was later verified from in situ balloon-borne measurements (Vernier et al., 2015, 2018; Yu et al., 2017; Brunamonti et al., 2018; Hanumanthu et al., 2020). Information on the chemical composition of the ATAL particles is limited (e.g. Martinsson et al., 2014; Vernier et al., 2018; Höpfner et al., 2019). Based on model simulations, the ATAL is expected to consist of carbonaceous and sulfate materials, mineral dust, and nitrate particles (e.g. Fadnavis et al., 2013; Gu et al., 2016; Lau et al., 2018; Fairlie et al., 2020; Bossolasco et al., 2020). Through analysis of satellite and high-altitude aircraft observations and laboratory experiments, Höpfner et al. (2019) provided evidence that a considerable part of the ATAL may contain solid ammonium nitrate (NH4NO3) particles. Their satellite data analysis using Cryogenic Infrared Spectrometers and Telescopes for the Atmosphere (CRISTA) data indicates enhanced NH4NO3 signals around the tropopause in both the ASM region and the western Pacific (including Japan) during 8–16 August 1997 (with the western Pacific signals suggestive of shedding vortices); also, their analysis of satellite Michelson Interferometer for Passive Atmospheric Sounding (MIPAS) data together with CRISTA data shows that the mass of NH4NO3 in the ASM region at 13–17 km peaks around August. It is also noted that Vernier et al. (2015, their Fig. 2b) showed mean eastward extension of the ATAL to the Japanese archipelago by averaging Cloud–Aerosol Lidar with Orthogonal Polarization (CALIOP) data for July–August 2006–2013, although the role of synoptic disturbances, such as eastward-shedding vortices, in the ATAL eastward extension does not appear to have been investigated using CALIOP data.
The “westward” extension of the ATAL to northern midlatitudes was reported by Khaykin et al. (2017) based on ground-based lidar at the Observatoire de Haute-Provence (OHP) in southern France (43.9∘ N, 5.7∘ E), with a layer of enhanced aerosol in the lower stratosphere with an average backscattering ratio (BSR; related to particle size and density) value of 1.05 being a systematic feature during August–October. This aerosol layer was shown to correlate with the seasonal water vapour maximum, suggesting the influx of convectively moistened air from the ASM anticyclone, whose influence on the extratropical lower stratosphere in late summer to early winter is well known (e.g. Vogel et al., 2014; Müller et al., 2016; Rolf et al., 2018).
Some lidar systems currently in operation in Japan are capable of measuring UTLS aerosol characteristics, including those at the Meteorological Research Institute (MRI) in Tsukuba (36.1∘ N, 140.1∘ E; Sakai et al., 2016) and Fukuoka University, Fukuoka (33.55∘ N, 130.36∘ E; Yasui et al., 1995). Both systems measure the BSR and particle depolarization ratio (PDR; related to the degree of particle non-sphericity). Previous studies using data from these systems investigated the impacts of large-scale tropical volcanic eruptions and other recent eruptions (Uchino et al., 1993; Sakai et al., 2016), as well as springtime transport of dust particles from the Asian continent called “kosa” events (yellow sand–dust events) (Sakai et al., 2003), amongst others; however, the data have not been investigated extensively for the possible detection of the ATAL from ASM circulation, i.e. its “eastward” extension, partly because extensive summertime cloud cover often prevents lidar sensing of the UTLS region and partly because ATAL signals are much weaker than volcanic signals. In this paper, focusing on the July–September 2018 period, we investigate whether these lidars are capable of measuring ATAL signals associated with eastward-shedding vortices from the ASM anticyclone, with combined analyses of backward trajectories, chemical reanalysis data, and satellite data for full understanding of the lidar observations. The remainder of this paper is organized as follows. Section 2 describes the lidar and other data analysed in this paper. Section 3 presents the results and discussion, and Sect. 4 concludes the findings.
2.1 Lidar data
The lidar system at the MRI in Tsukuba (36.1∘ N, 140.1∘ E) used in this study is an Nd:YAG system operated at a wavelength of 532 nm with capability for both BSR and PDR measurements (Sakai et al., 2016), which has been operated continuously since 2002. We define PDR as , where S and P are the background-subtracted lidar photon counts of the perpendicular (“senkrecht” in German) and parallel components, respectively, with respect to the polarization plane of the emitted laser light. The temporal and height resolutions of the original processed data are 5 min and 7.5 m, respectively. Quality control has been done primarily to flag data points influenced by thick cloud layers. To obtain vertical profiles of BSR and PDR with high signal-to-noise ratios, data were averaged over 150 m and 3 h, with time intervals of 18:00–21:00, 21:00–00:00, 00:00–03:00, and 03:00–06:00 local time (LT) for the use in this paper. BSR data were normalized to unity at 30–33 km of altitude where aerosol backscattering is assumed to be negligible, and PDR values were obtained using the method of Adachi et al. (2001).
The lidar system at Fukuoka (33.55∘ N, 130.36∘ E) used in this study is also an Nd:YAG system operated at a wavelength of 532 nm with PDR measurement capability. This system has been operated manually only during nights under clear-sky and/or non-rainy conditions; during July–September 2018, the system was operated on 11 nights. Vertical profiles were averaged over 900 m and 4 h for each night for the use in this paper. The PDR for Fukuoka is originally defined as , which has been converted to for this paper.
The uncertainties of lidar data discussed here are applicable to both systems. The BSR uncertainties were estimated as follows. The random component was estimated from the photon counts of the backscatter signals at 532 nm after temporal and vertical averaging by assuming Poisson statistics. Other sources of BSR uncertainties (biases) were estimated by assuming the uncertainty of the normalization value of BSR to be 8.5 × 10⁻³ (Russell et al., 1979, 1982) and that of the extinction-to-backscatter ratio to be 30 sr (Jäger and Hofmann, 1991; Jäger et al., 1995). The total uncertainty of BSR was then estimated to be 2 %–3 %, typically around the tropopause. The PDR uncertainties were estimated from the parallel and perpendicular components of backscatter signals at 532 nm. Other sources of PDR uncertainties (biases) include (1) the uncertainty in calibration of the total depolarization ratio (TDR), due to both particles and air molecules, and (2) the BSR uncertainty. Uncertainty (1) was estimated as follows. In the TDR calibration (Adachi et al., 2001), we subtracted depolarization caused by the lidar system (DEPsys) estimated from the observed TDR and BSR obtained in the altitude region where aerosol backscattering is negligible (i.e. BSR equals unity, and TDR equals the molecular depolarization ratio) or where spherical particles predominate (i.e. in lower-tropospheric water clouds). DEPsys errors result in PDR bias. For example, a DEPsys error of ±0.2 % results in a ±2 % bias in PDR, where BSR = 1.1. Uncertainty (2) arises mainly from our assumption that aerosol backscattering is negligible at 30–33 km of altitude. We also assumed an aerosol extinction-to-backscatter ratio of 50 sr over the whole measurement height range. These assumptions result in errors in BSR and thus PDR. For example, BSR errors of +0.05 and −0.05 result in a bias of −1 % and +3 % in PDR, respectively, where BSR = 1.1 and TDR = 0.7 %. Based on these considerations, we estimate that the total PDR uncertainty (random plus bias errors) is 5 % PDR.
2.2 Other data
Backward trajectories are calculated with the trajectory model used by Inai (2018) and Inai et al. (2018) as well as the most recent global atmospheric reanalysis dataset by the European Centre for Medium-Range Weather Forecasts (ECMWF), ERA5 (Hersbach et al., 2020), with 37 pressure levels up to 1 hPa and horizontal and temporal resolutions of 0.25∘ × 0.25∘ and 1 h, respectively. ERA5 temperature data in the tropical tropopause layer have been evaluated by Tegtmeier et al. (2020). Lagrangian transport calculations using ERA5 and its predecessor ERA-Interim have been compared by Hoffmann et al. (2019) and Li et al. (2020).
The Copernicus Atmosphere Monitoring Service (CAMS) atmospheric composition reanalysis dataset produced by the ECMWF (Inness et al., 2019) is used to analyse signatures of the ASM anticyclone and its eastward-shedding vortices, with 25 pressure levels up to 1 hPa and horizontal and temporal resolutions of 0.75∘ × 0.75∘ and 3 h, respectively. Carbon monoxide (CO), temperature (T), and geopotential (Φ) data are primarily analysed in this paper. CO is chosen because it is a good tracer for polluted air of surface origin (e.g. Luo et al., 2018). Although CO and ATAL aerosol particles do not necessarily have the same emission sources, CO is a good chemical tracer to indicate the location of the ASM anticyclone. CO data on pressure levels are projected onto isentropic surfaces using temperature data. In the CAMS, the Measurement of Pollution in the Troposphere (MOPITT) thermal infrared (TIR) satellite total-column CO data are assimilated, but Microwave Limb Sounder (MLS) and Infrared Atmospheric Sounding Interferometer (IASI) CO data are not. CAMS CO data are originally provided as mass mixing ratios (kg kg−1), which are converted to volume mixing ratios (ppbv) for this study. It is noted that a quick comparison (not shown) with MLS version 4.2 level 2 CO data (Santee et al., 2017; Livesey et al., 2020) at a 400 K isentropic surface (in the form of a longitude–time diagram like the one in Sect. 3.2) shows that CAMS CO data are roughly ∼ 10 ppbv greater than MLS CO over Japan during August–September 2018, but it also shows that eastward extension signals coming over Japan agree fairly well qualitatively within the differences in spatio-temporal sampling of the two datasets. The CAMS dataset also includes different types of aerosol particles, but they are not included in this study because relevant variables such as aerosol BSR and NH4NO3 concentration are not included. The Montgomery streamfunction (MSF), defined as MSF , where cp is the specific heat of dry air at constant pressure, in isentropic coordinates corresponds to geopotential (height) in isobaric coordinates (e.g. Popovic and Plumb, 2001; Santee et al., 2017; Amemiya and Sato, 2018; Salby, 1996) and is thus a good dynamical indicator of the ASM anticyclone. Potential vorticity (PV) on isentropic surfaces (e.g. at 360–380 K) is often used as a dynamical tracer in studies of the ASM anticyclone (e.g. Popovic and Plumb, 2001; Garny and Randel, 2013; Ploeger et al., 2015; Amemiya and Sato, 2018); however, PV at and above 400 K (the isentropic surface we will focus on in Sect. 3.2) is not very useful to analyse the ASM anticyclone boundary. Thus, we will analyse MSF at the 400 K surface calculated from CAMS data.
MLS version 4.2 level 2 water vapour data (Santee et al., 2017; Livesey et al., 2020) are analysed because water vapour is also a good tracer of the ASM anticyclone. We use MLS data rather than CAMS data for lower-stratospheric water vapour because MLS data have been well validated with e.g. balloon-borne frost-point hygrometers (e.g. Hurst et al., 2016; Fujiwara et al., 2010; Vömel et al., 2007), while reanalysis water vapour data are in general less reliable in the lower stratosphere (e.g. Davis et al., 2017). We found (not shown) that CAMS water vapour volume mixing ratio data (converted from the original specific humidity data) are greater than MLS data at the 400 K isentropic surface over Japan during July–September 2018 (e.g. the differences are roughly ∼ 2 ppmv for the wet signals around the longitudes of Japan in August 2018).
The possible influence of volcanic eruptions and wildfire events is investigated using two satellite aerosol particle datasets, one providing vertical extinction profile data at 675 nm from the Ozone Mapping and Profiler Suite (OMPS) Limb Profiler (LP), level 2 version 1.5 (Chen et al., 2018), and the other attenuated scattering ratio data from the CALIOP on board the Cloud–Aerosol Lidar and Infrared Pathfinder Satellite Observation (CALIPSO) satellite (Thomason et al., 2007; Winker et al., 2007, 2010). CALIOP level 3 monthly mean stratospheric aerosol data (CAL_LID_L3_Stratospheric_APro-Standard-V1-00) are used in this study; in this data product, clouds and polar stratospheric clouds (PSCs) have been removed based on the information of particulate extinction-to-backscatter (lidar) ratio and the multiple-scattering factor profile (Young and Vaughan, 2009; Kim et al., 2018; https://www-calipso.larc.nasa.gov/resources/calipso_users_guide/data_summaries/l3/lid_l3_stratospheric_apro_v1-00_v01_desc.php, last access: 24 February 2021).
3.1 Lidar measurements
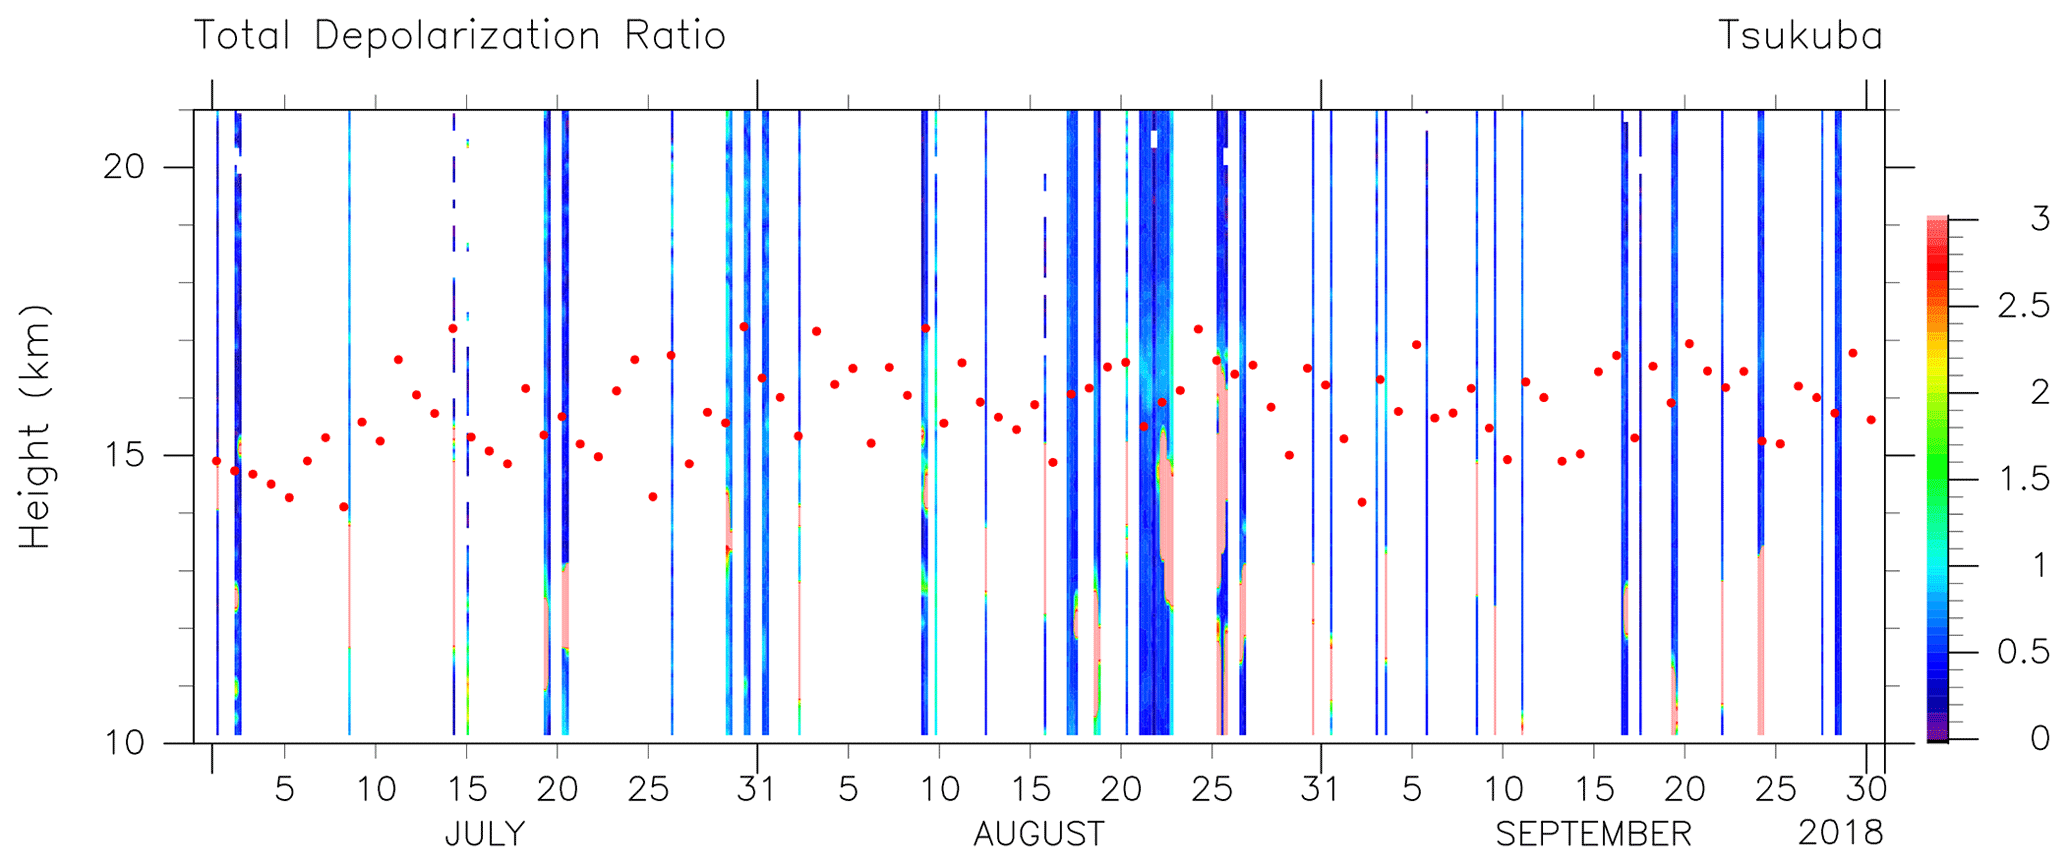
Time–height distributions of BSR and PDR observed in the UTLS at Tsukuba are shown in Fig. 1, and the corresponding vertical profiles are shown in Fig. 2. Because the PDR has more missing data points, the TDR time–height distribution is also shown in Fig. A1. Days with missing data (white regions; Fig. 1) are due to thick summertime rain clouds in the lower to middle troposphere, which prevented the laser light from reaching the middle stratosphere. However, some events with enhanced particle signals are evident just above the tropopause at 15.5–18 km and last for a few days, mainly in August but with some in September. In particular, the event peaking at around 21 August and spanning 18–26 August was the strongest one among the events that the lidars successfully measured during the 3-month period. We also observe another strong event around 9 August at 15–17 km, although missing observations before and after this date prevent characterization of the temporal scale of the event; furthermore, the tropopause height was highly variable at the time and was located at 17 km on that date, situating the aerosol-enhanced layer temporarily in the troposphere. Figure 2 shows that enhanced particle signals at 15.5–18 km were often observed in August and sometimes in September but not in July. Typical BSR and PDR values of enhanced signals are ∼ 1.10 (1.07–1.18) and ∼ 5 % (3 %–10 %), respectively (Figs. 1 and 2). Below the tropopause, strong signals were sometimes recorded with BSR values of > 1.25 and with PDR values ≫ 10 %. In general, the PDR values are 0 % for spherical particles (i.e. water clouds in the troposphere and liquid H2SO4 particles in the stratosphere) and > 25 %–30 % for ice cirrus particles (e.g. Sakai et al., 2003; Fujiwara et al., 2009). Strong signals in the upper troposphere are thus due to ice cirrus clouds. Enhanced signals in the lower stratosphere (15.5–18 km) may be due to solid particles, as indicated by PDR values of ∼ 5 % (3 %–10 %). Taking PDR uncertainties (Sect. 2.1) into account, these values can be considered small but non-zero. The PDR values of these signals, together with the region being above the local tropopause in most cases, strongly suggest that they are not ice cirrus particles. However, the possibility of a mixture of spherical H2SO4 particles (i.e. background stratospheric sulfate particles) and highly non-spherical particles, such as ice, volcanic ash (Prata et al., 2017), and wildfire smoke (Haarig et al., 2018), cannot be precluded only with our lidar data. We will come back to this issue in Sect. 3.3 after investigating other data. Before looking at the Fukuoka results, it is noted that for Tsukuba we do not plot the data with a “relative” uncertainty of PDR larger than 30 %; this treatment resulted in removing data points with BSR values lower than ∼ 1.05 at which background spherical sulfate particles (with PDR values of < 2 %) were presumably predominant.
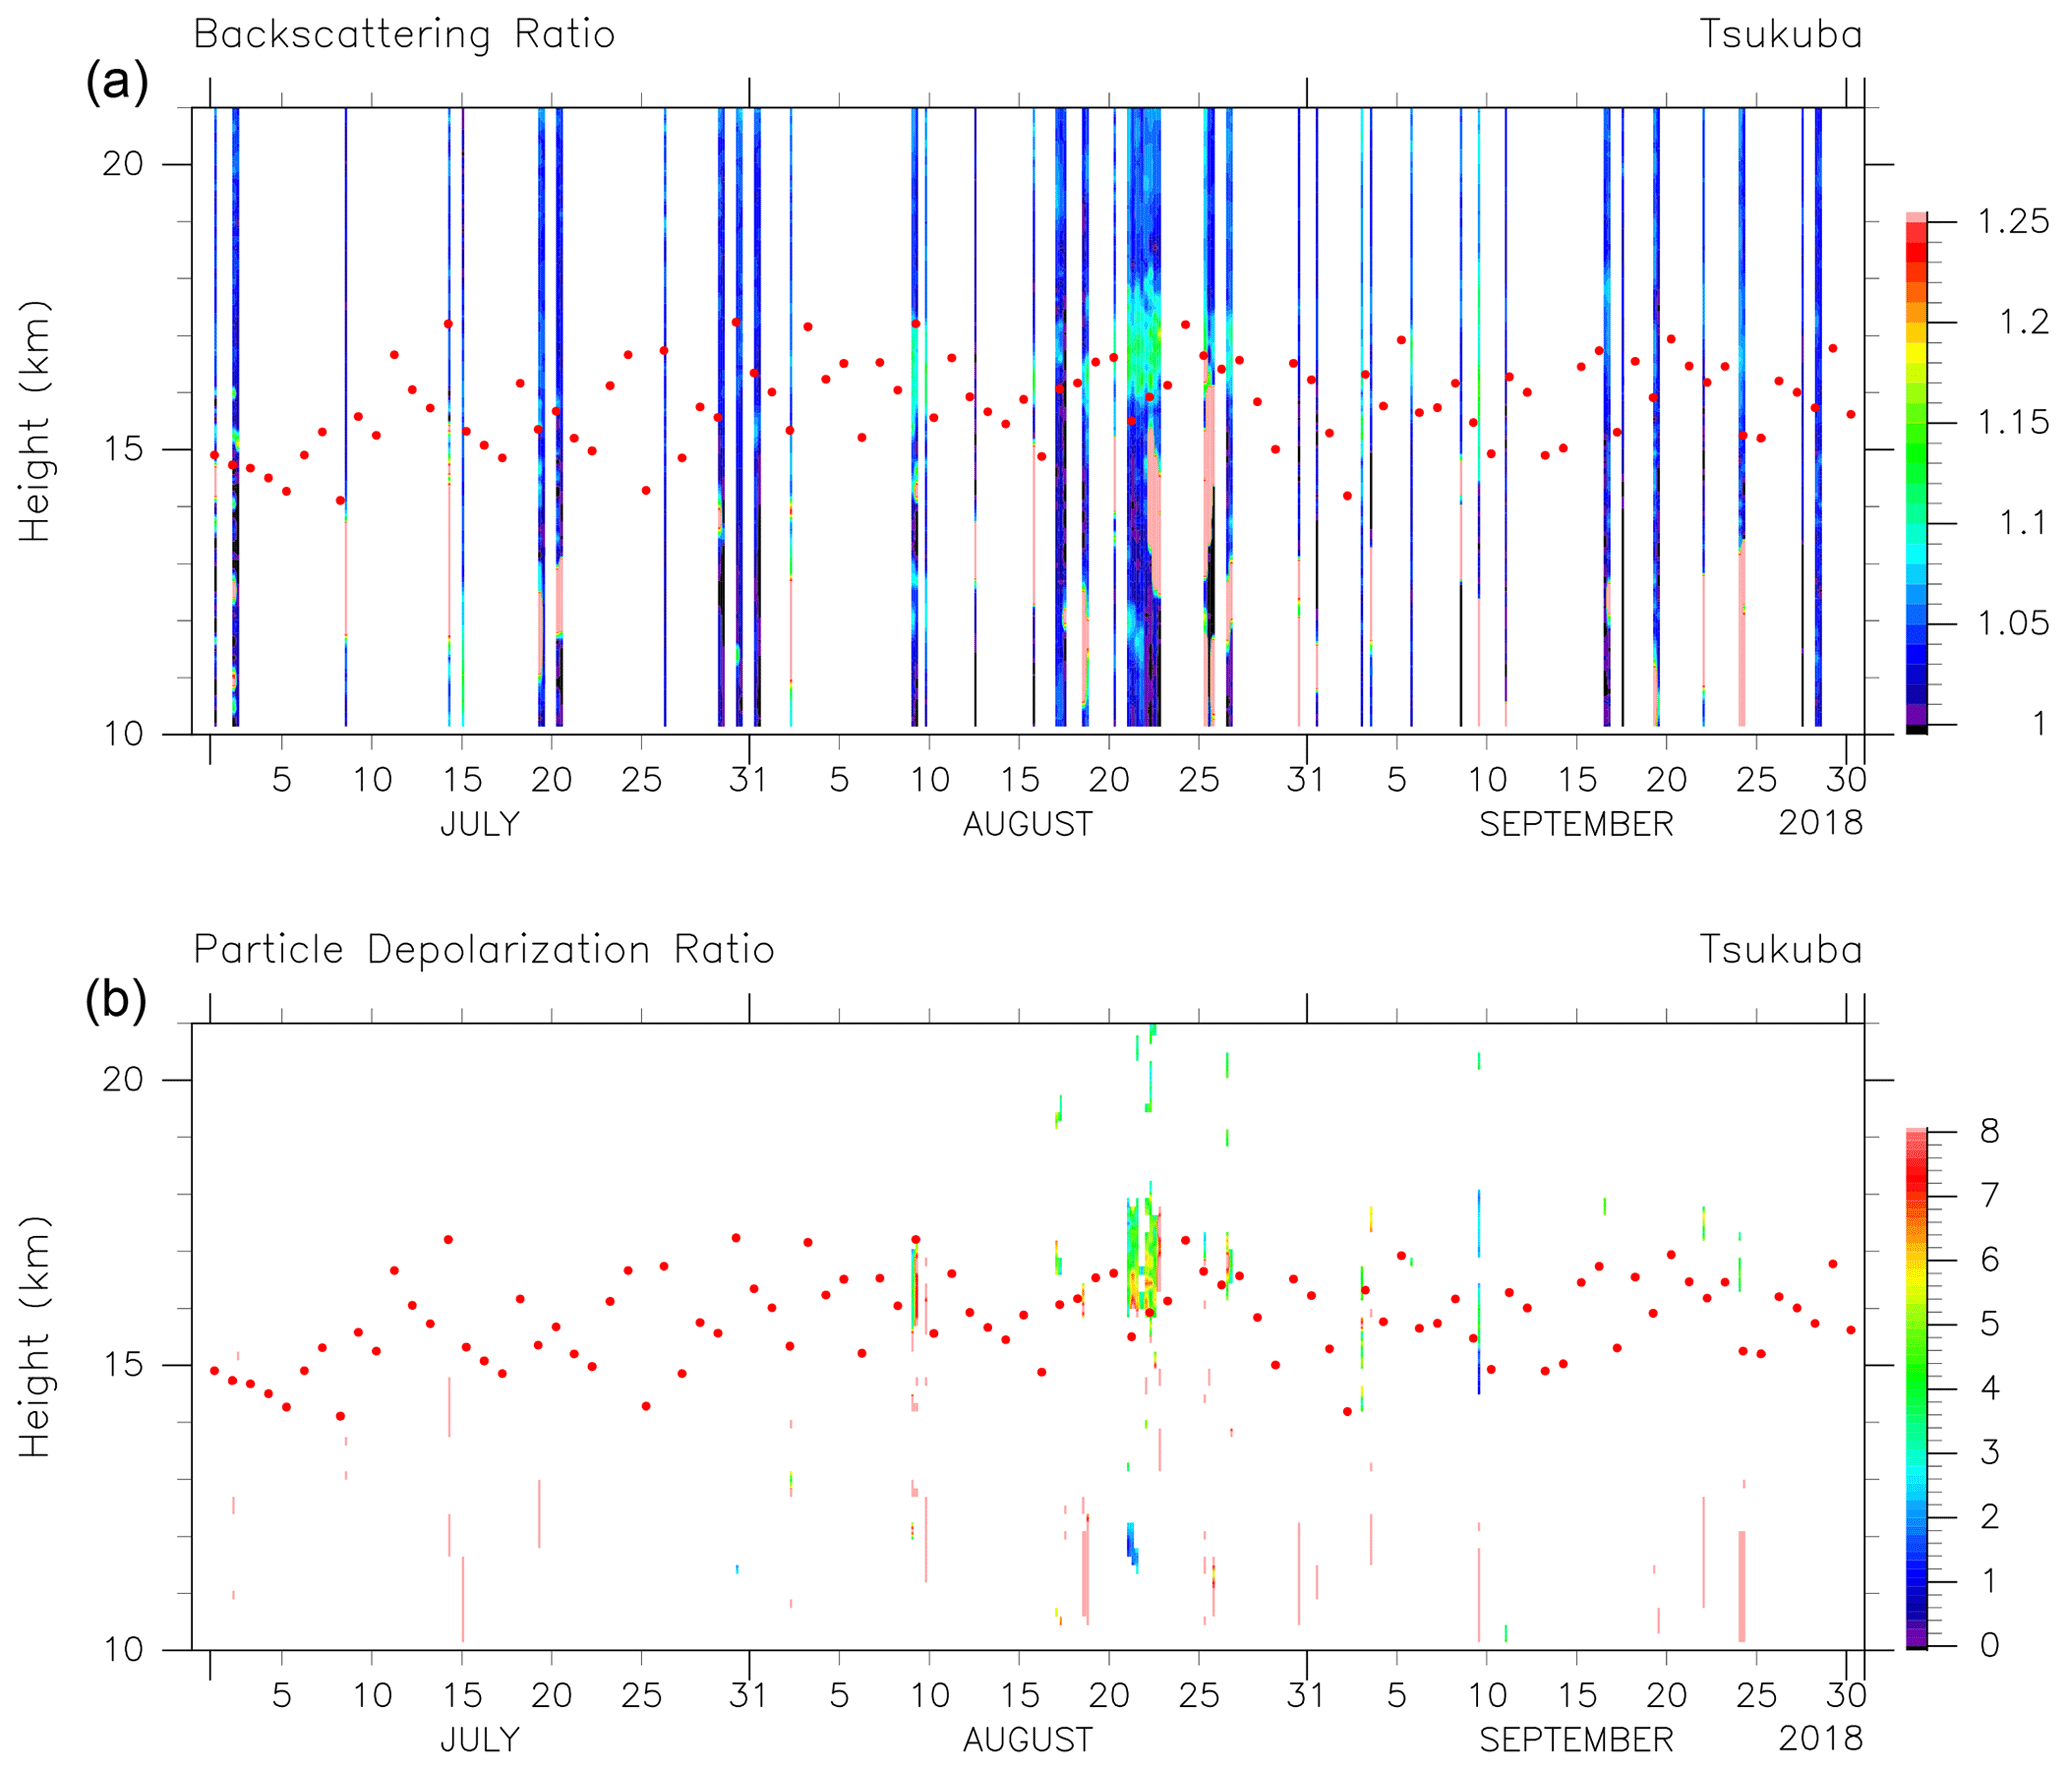
Figure 1Time–height distributions of (a) the backscattering ratio and (b) particle depolarization ratio (%) during July–September 2018, as measured using the lidar system at MRI, Tsukuba. For each day, four time slots (i.e. 18:00–21:00, 21:00–00:00, 00:00–03:00, and 03:00–06:00 LT) are prepared, with 3 h averaged data filling the slots where thick lower to middle tropospheric clouds do not exist. Red dots indicate the daily (first) lapse-rate tropopause locations determined by the Japan Meteorological Agency (JMA) based on 21:00 LT radiosonde data taken at the JMA Tateno site (which shares the same site as the MRI).
Vertical profiles of BSR and PDR observed at Fukuoka for 11 clear-sky and/or non-rainy nights during July–September 2018 are shown in Fig. 3. Again, enhanced particle signals were observed mainly in August above the tropopause at 15.5–18 km. The BSR values were in the range 1.09–1.14, with PDR values of 1 %–3 %, which are smaller than those observed at Tsukuba. It should be noted that the dates of lidar operation at Fukuoka did not overlap those at Tsukuba when strong enhancement was observed above the tropopause (e.g. 9, 18–26 August and 9 September), perhaps partly explaining the differences between Figs. 2 and 3.
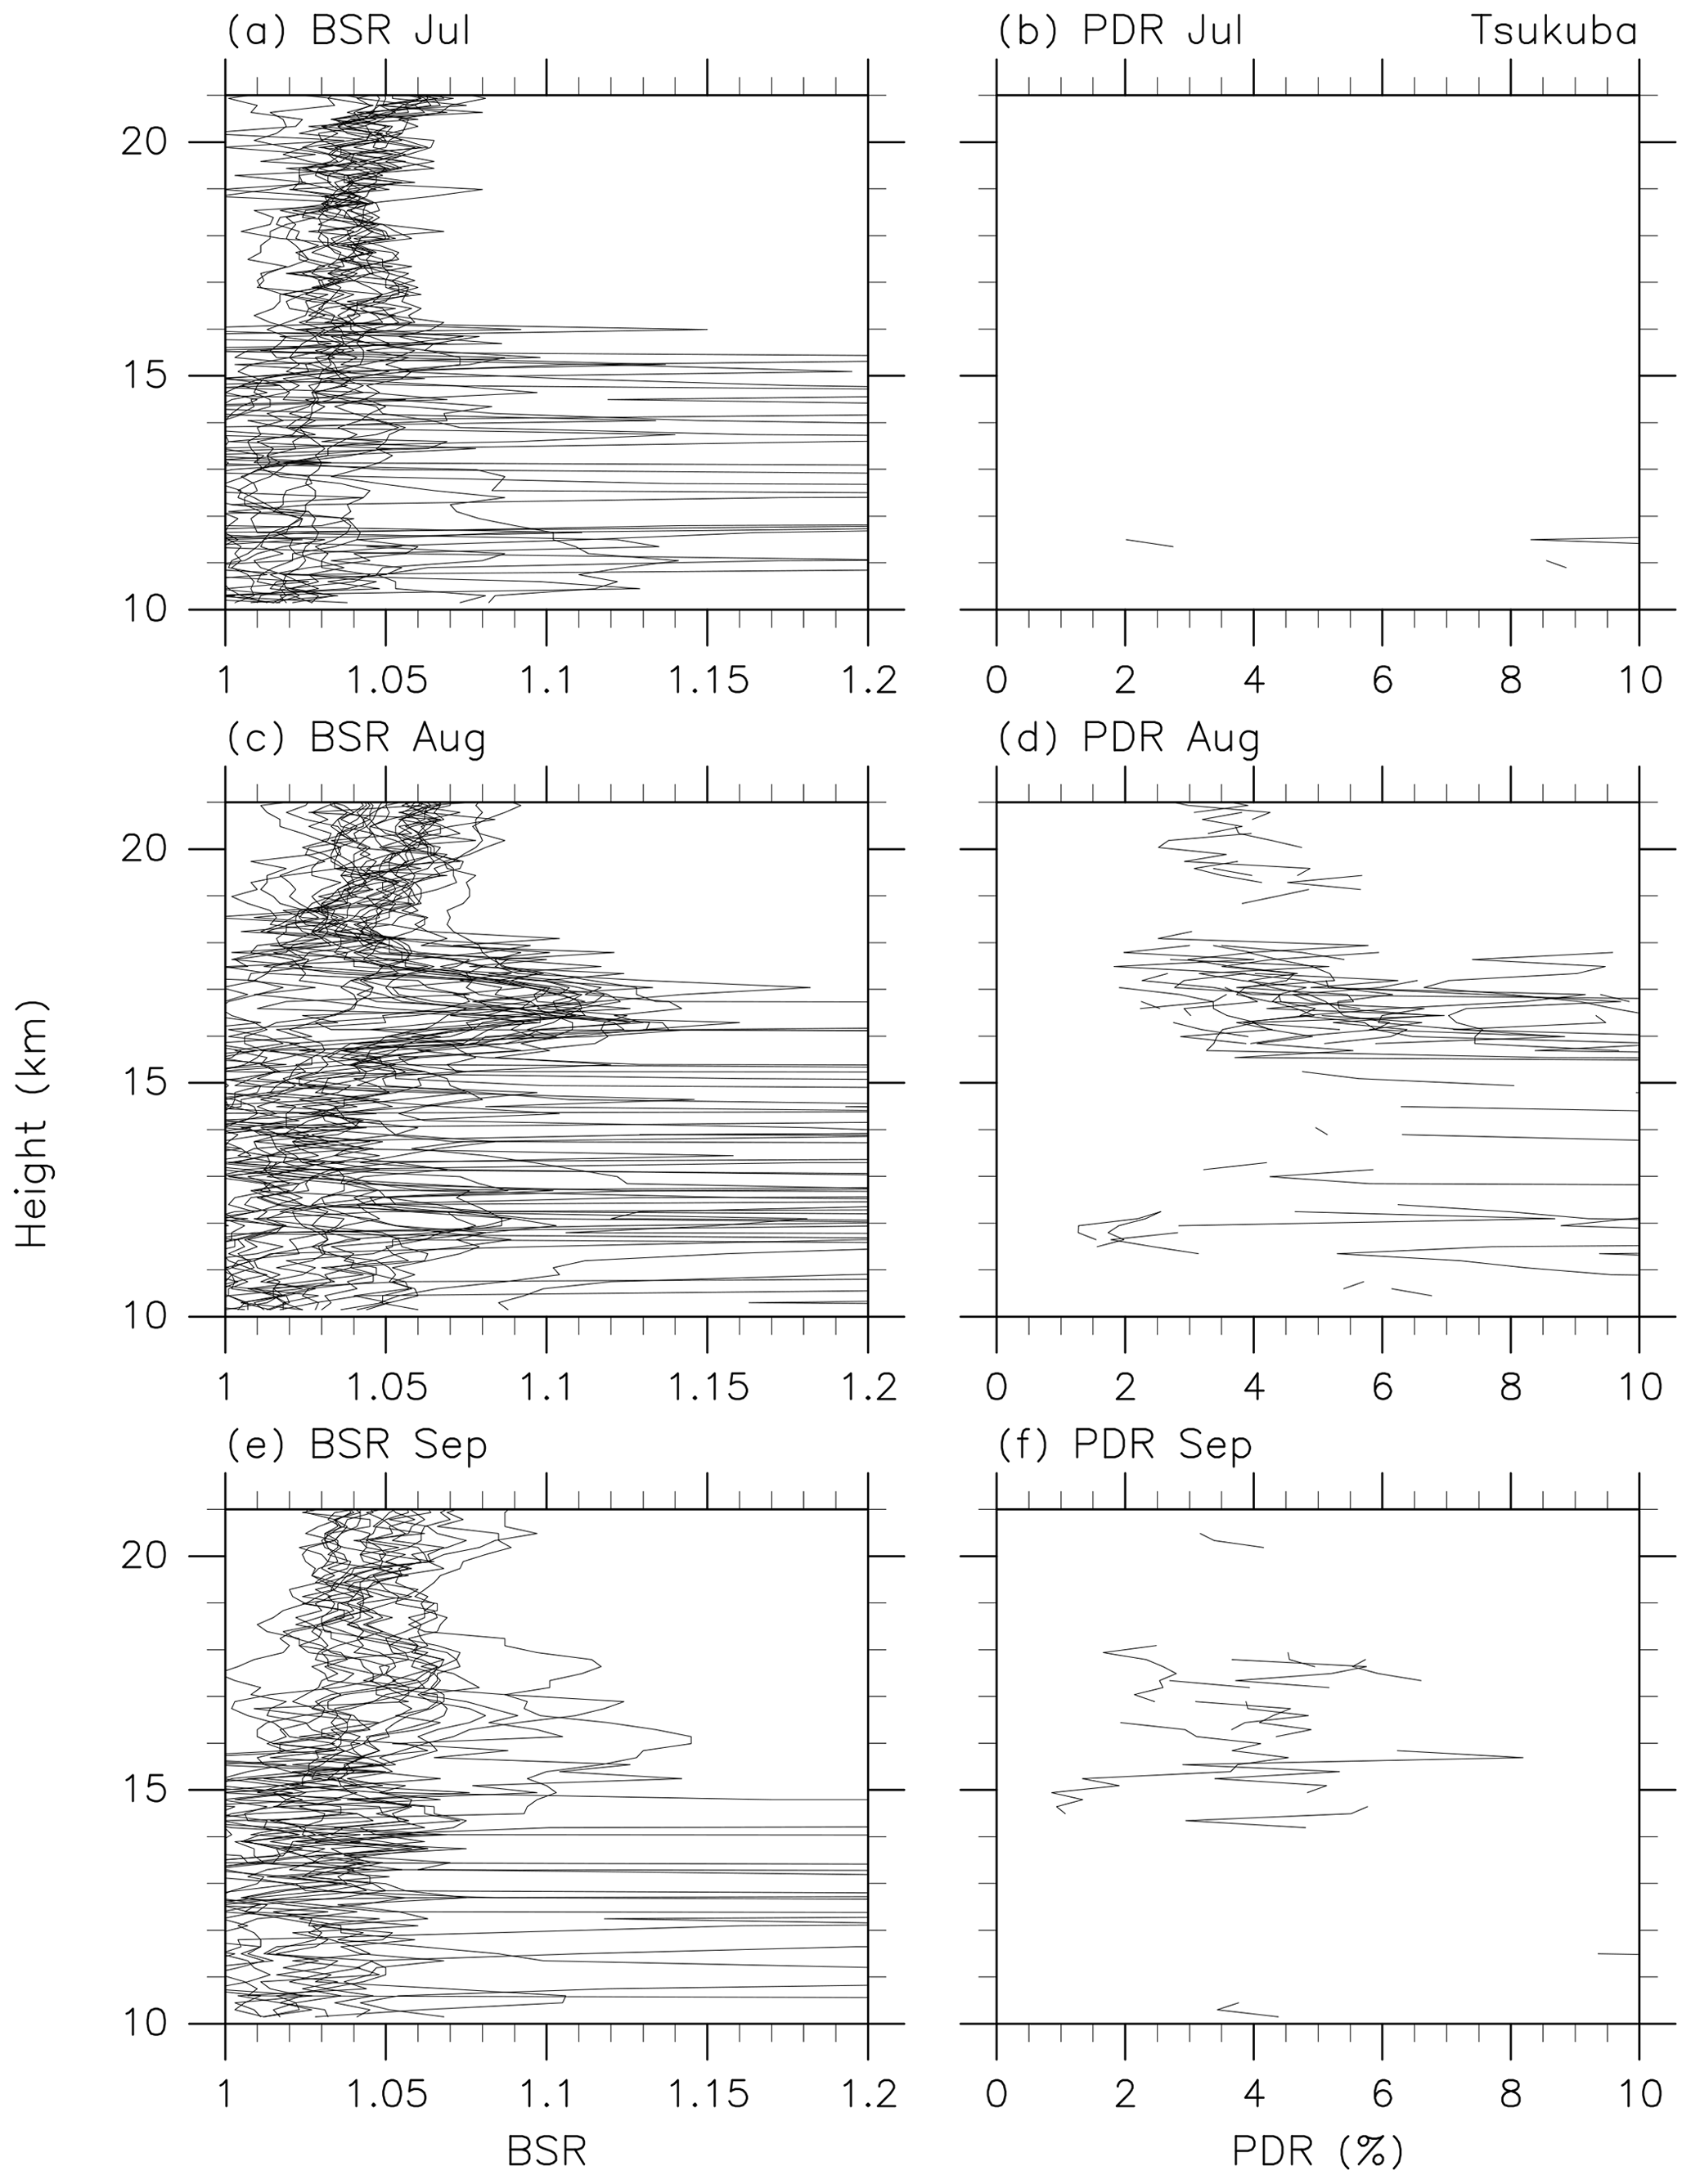
Figure 2Vertical profiles of (a, c, e) the backscattering ratio (BSR) and (b, d, f) particle depolarization ratio (PDR, in %) in (a, b) July, (c, d) August, and (e, f) September 2018 obtained using the lidar system at MRI, Tsukuba. It is noted that strong and noisy signals in BSR below ∼ 15.5 km are due to cirrus clouds.
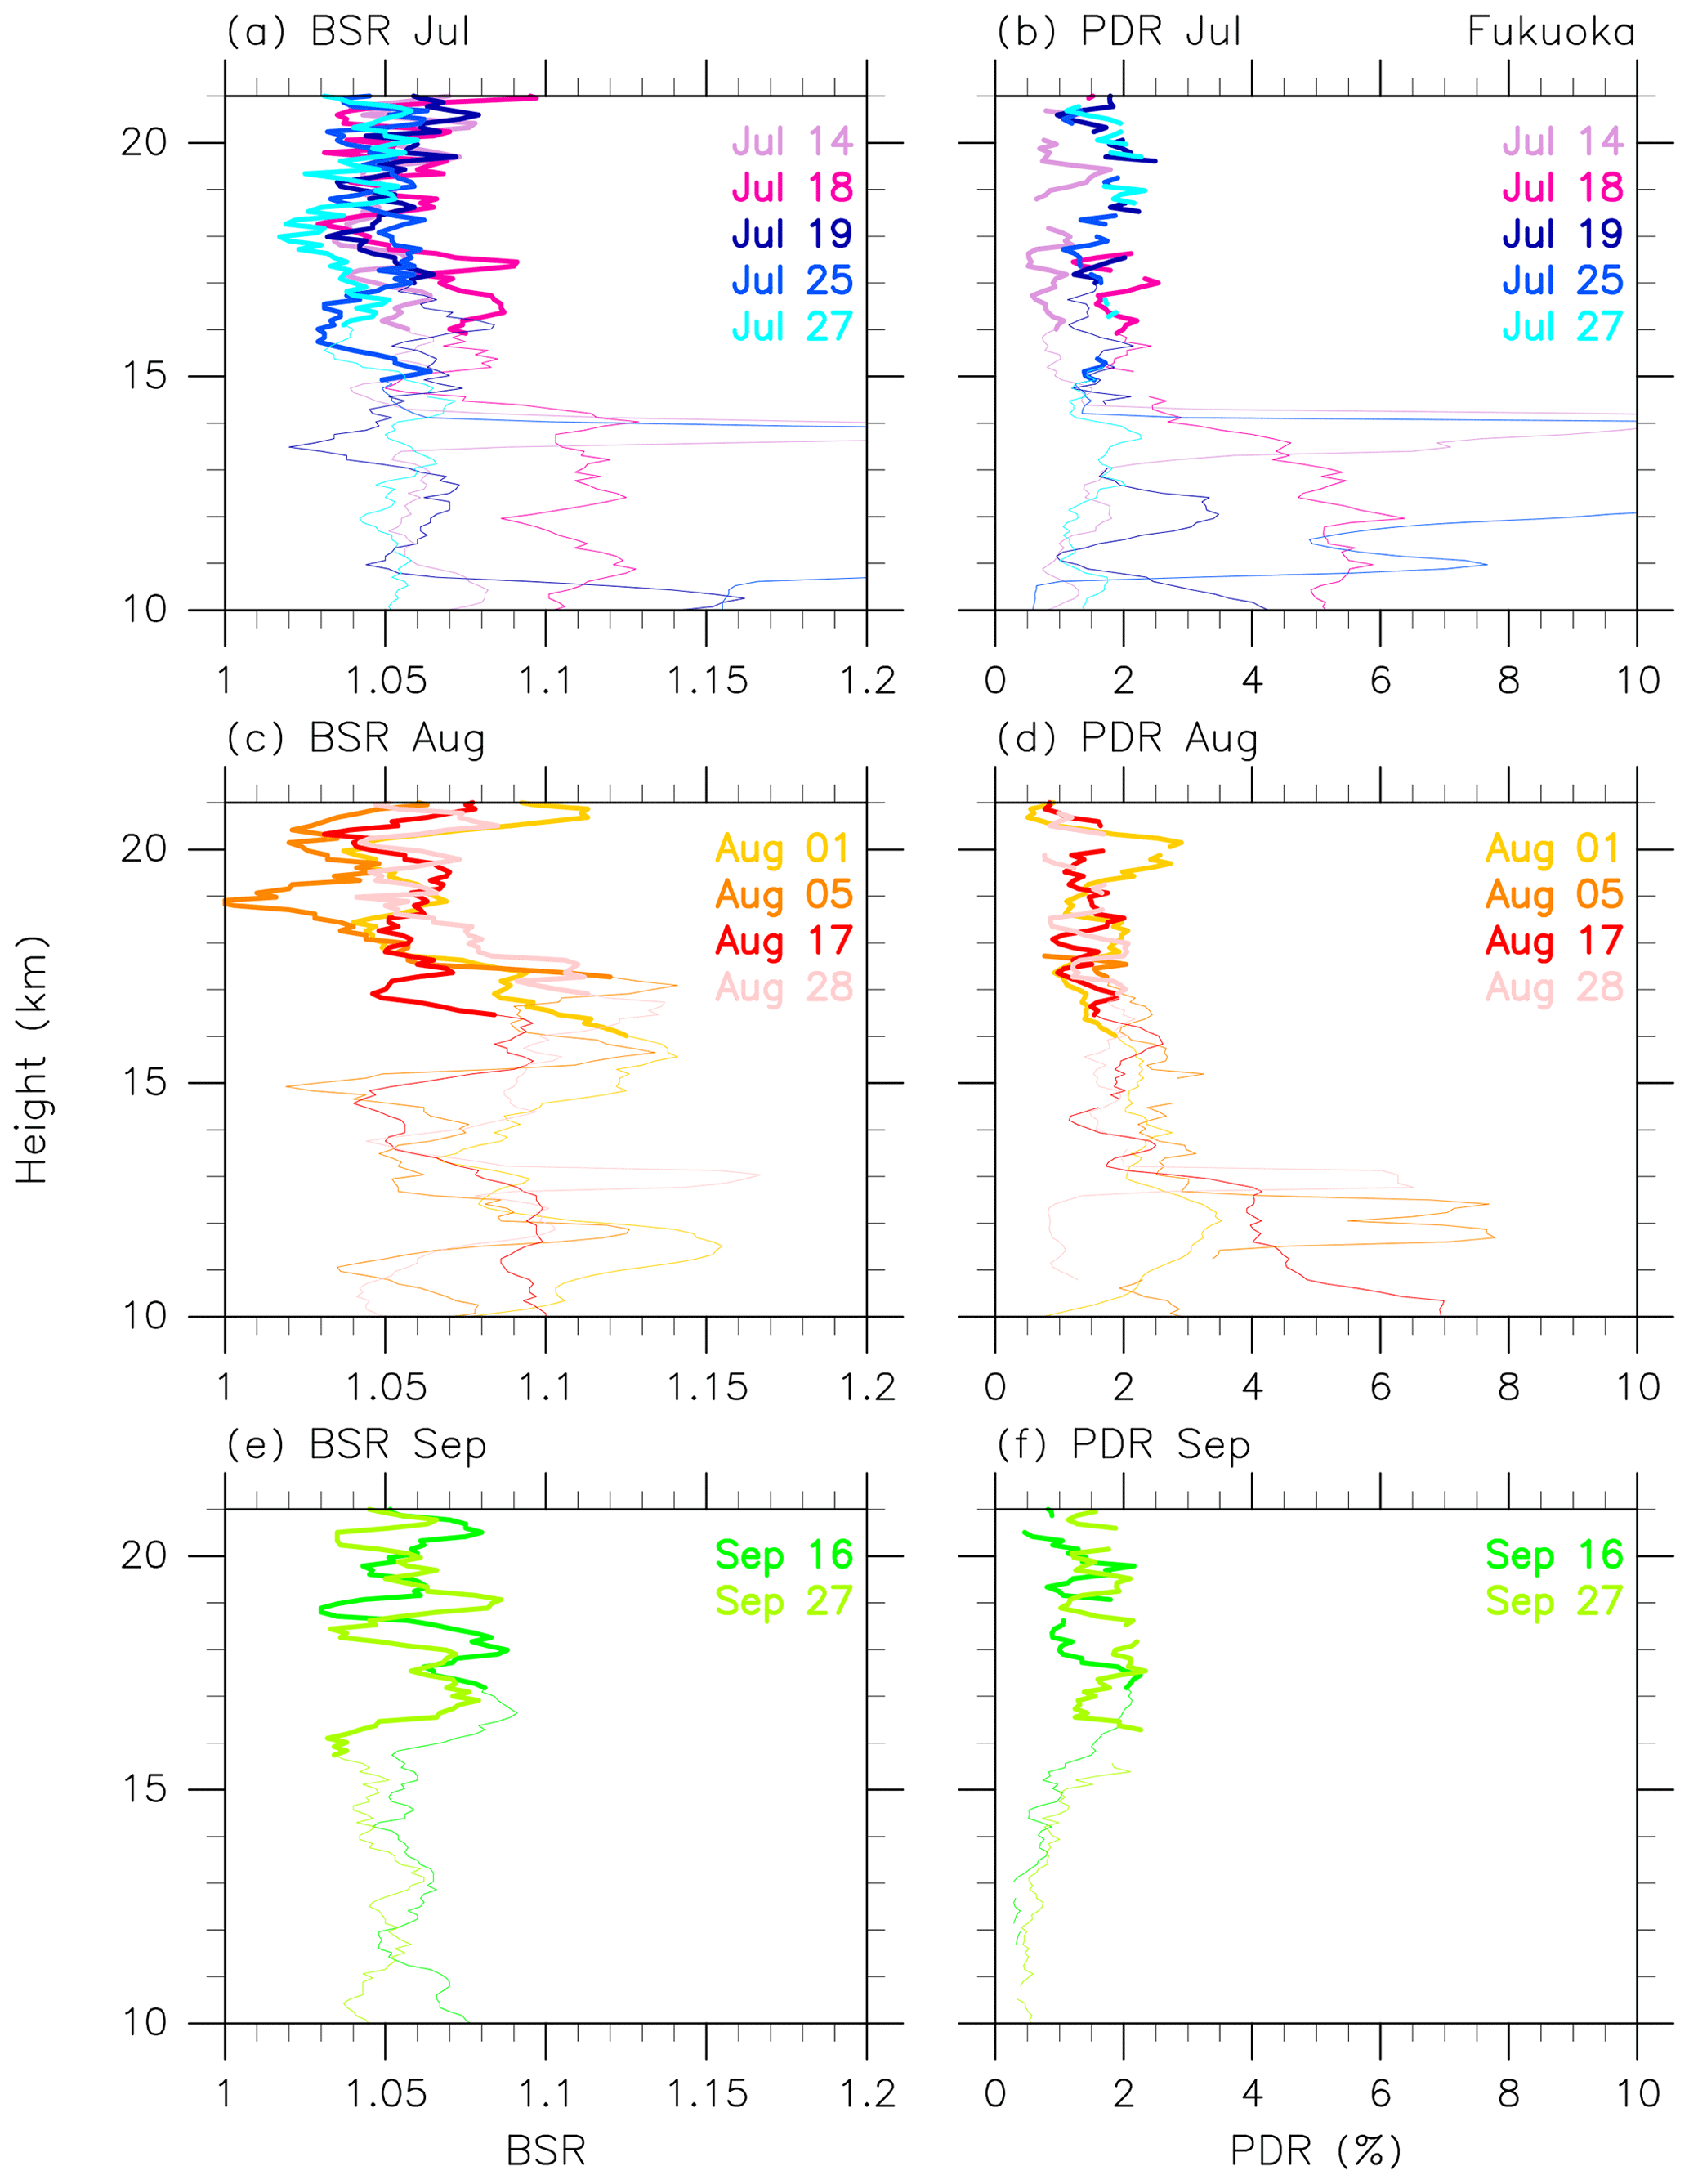
Figure 3A total of 11 vertical profiles of (a, c, e) the backscattering ratio (BSR) and (b, d, f) particle depolarization ratio (PDR, in %) in (a, b) July, (c, d) August, and (e, f) September 2018 obtained using the lidar system at Fukuoka. Dates and colours are assigned in the legend where, for example, “Jul 14” refers to the night of 14–15 July. The stratospheric portion of the profiles has been thickened using the daily (first) lapse-rate tropopause location information provided by the JMA based on operational 21:00 LT radiosonde data taken at the JMA Fukuoka site (at a ∼ 4 km distance from the lidar site).
3.2 Trajectories and air masses
The 10 d kinematic backward trajectories (using vertical wind) from Tsukuba and Fukuoka are shown in Figs. 4 and 5, respectively, with contrasting cases with or without aerosol particle enhancement in the 390–410 K potential temperature range (around 16.5–17.5 km at these stations). A potential temperature of 400 K corresponds to altitudes of ∼ 17.1 km at Tsukuba and ∼ 17.3 km at Fukuoka on average during July–September 2018 (based on twice-daily radiosonde data at each site, taken from http://weather.uwyo.edu/upperair/sounding.html, last access: 24 February 2021), i.e. near the centre of the lower-stratospheric BSR enhancement. By comparing the results from Santee et al. (2017) with our own analysis, the 65 ppbv contours of monthly mean CAMS CO data at 400 K potential temperature are chosen as an index of the boundaries of the ASM anticyclone (i.e. within the anticyclone, CO concentration is > 65 ppbv). These trajectories indicate that air masses over both stations come mainly from the west, sometimes via the north of Japan (indicative of the existence of vortices), and originate from the ASM anticyclone well within 10 d. They also indicate that air masses with enhanced aerosol particles at this height tend to originate in regions within the ASM anticyclone at altitudes of 16.5–18 km, i.e. around or just below the tropopause, whereas those without enhanced aerosol particles tend to originate from edge regions surrounding the anticyclone. Note that there is a trajectory that originates in the Pacific south of Japan as low as 4 km (Fig. 4b, a small-scale spiral in purple); this is associated with upward transport in the typhoon Soulik.
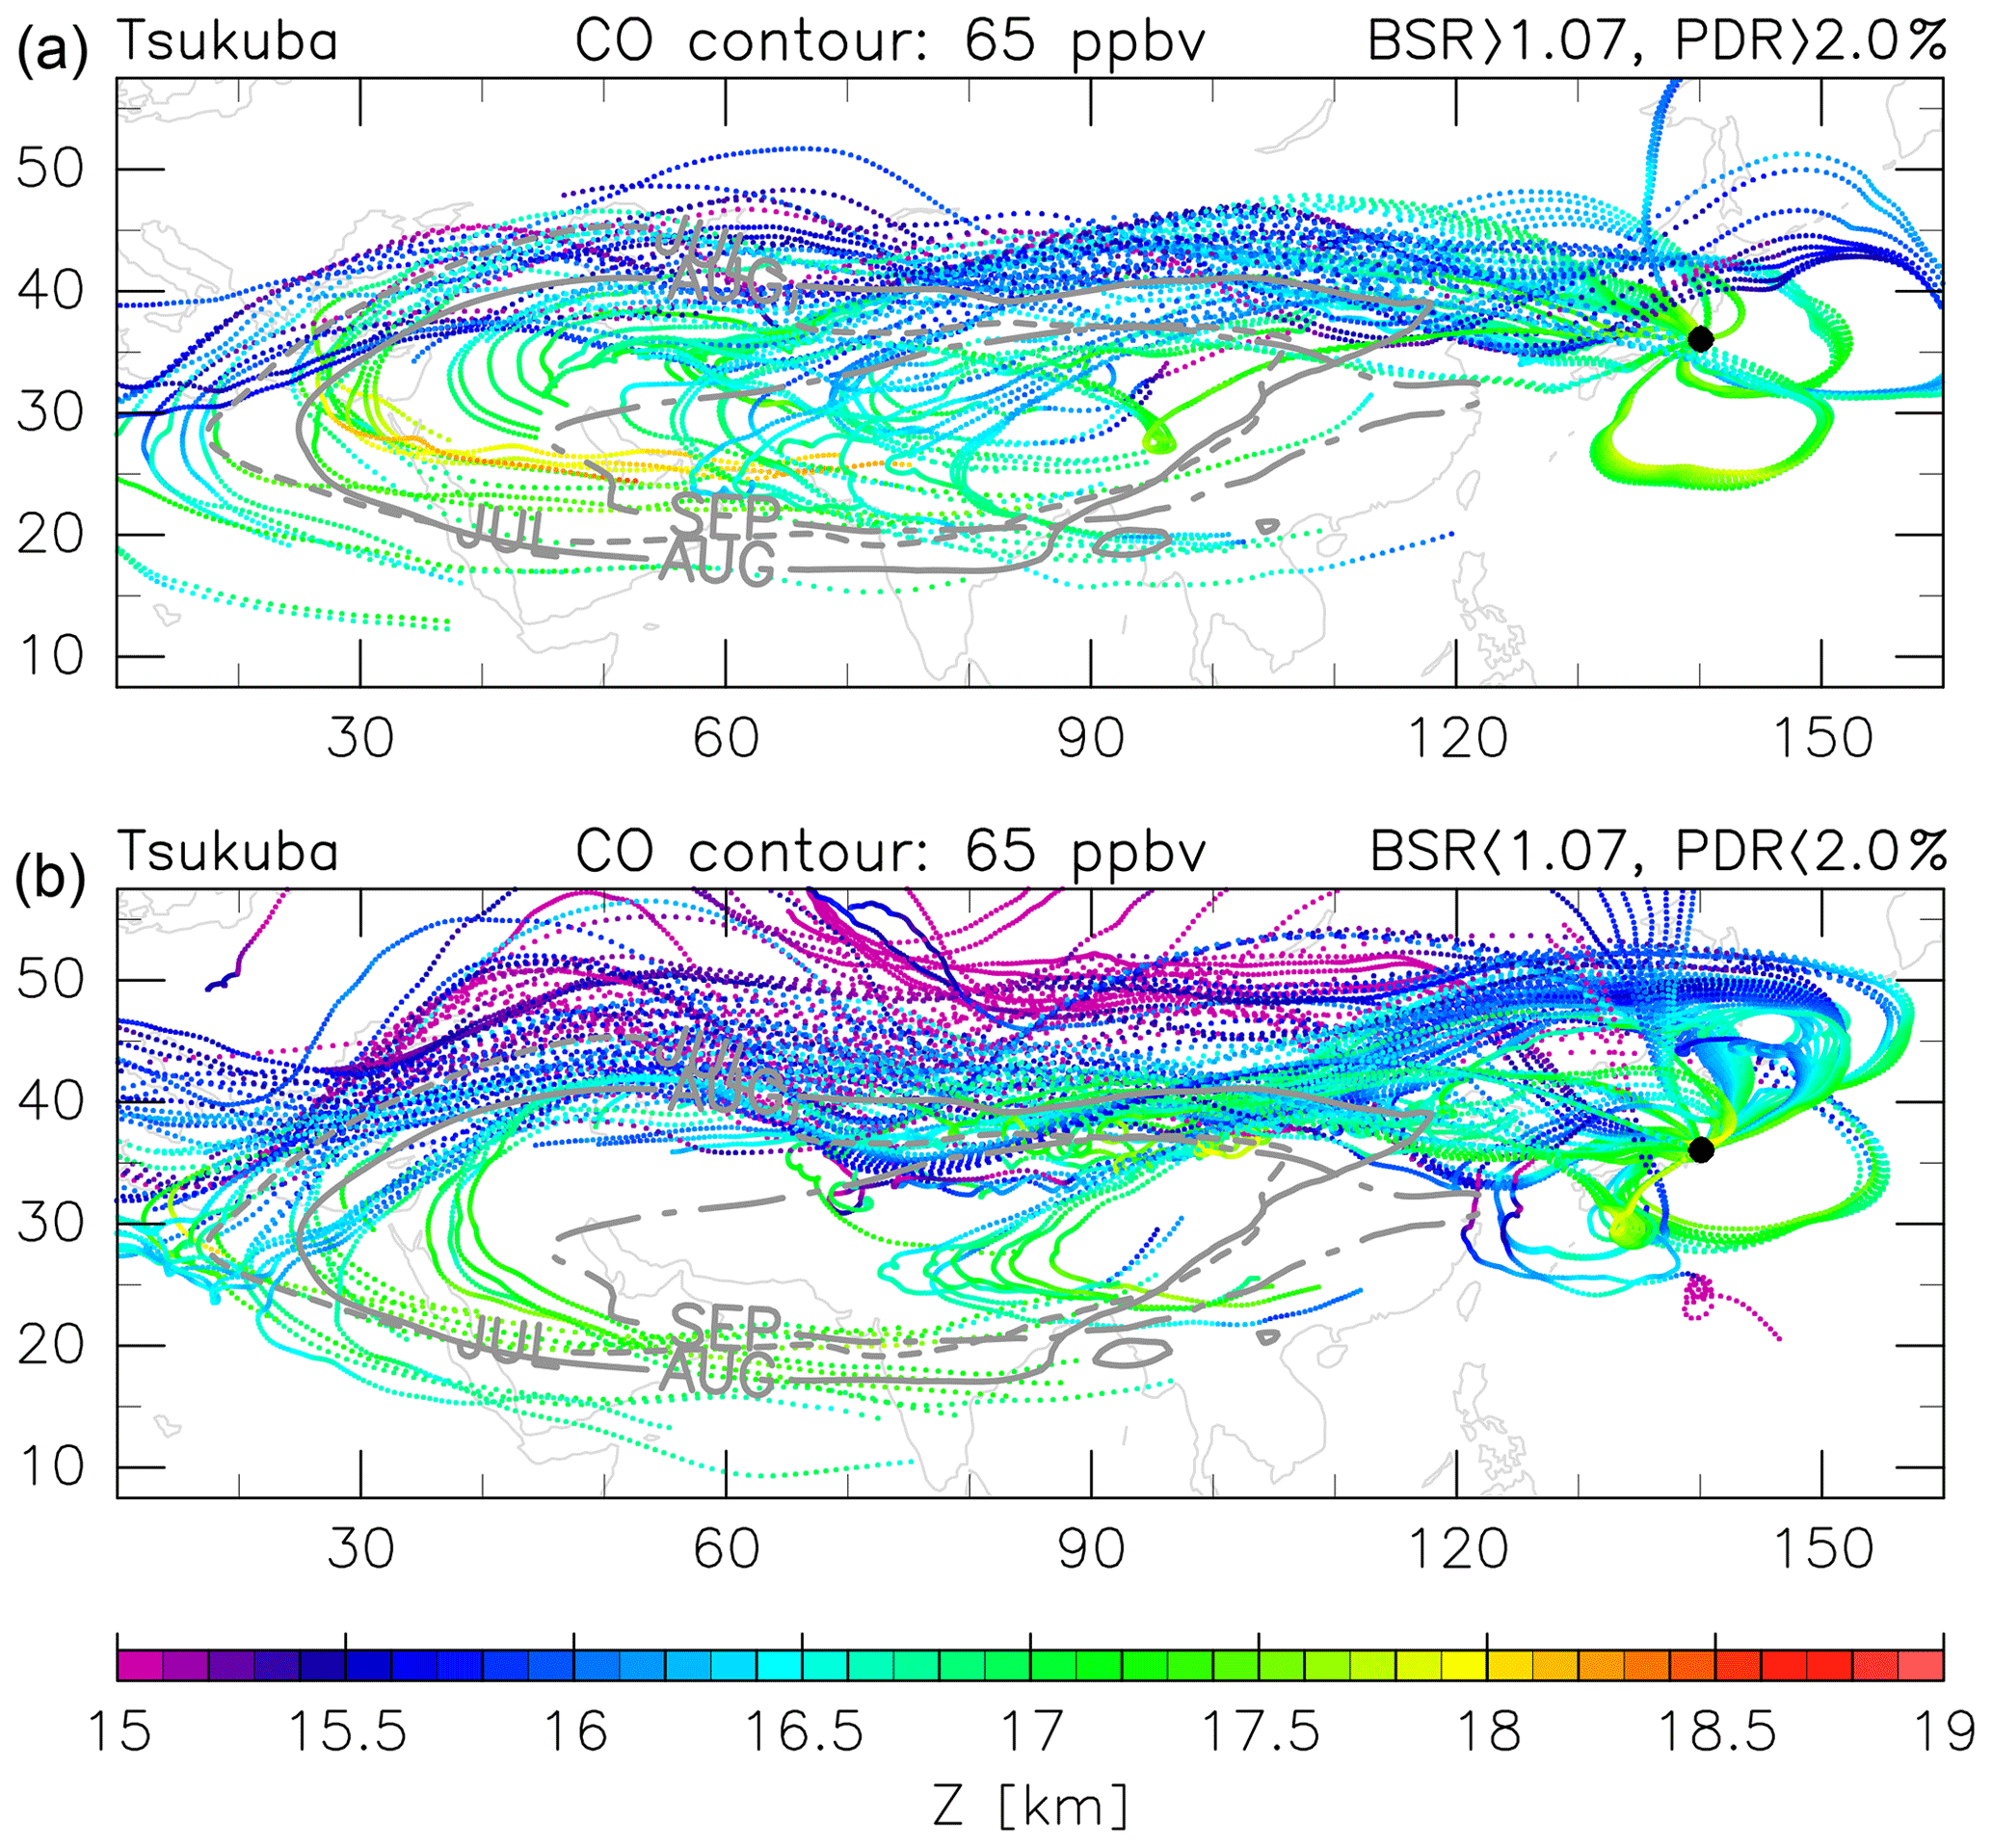
Figure 4Kinematic backward trajectories for 10 d starting from Tsukuba in the 390–410 K potential temperature range at 100 m geopotential height intervals on all days during July–September 2018 on which measurements were made using ERA5 reanalysis data. Cases are sorted into two categories: (a) with and (b) without enhanced aerosol signals observed by lidar at the trajectory starting points. The conditions and number of trajectories for the former and the latter cases are respectively BSR > 1.07 and PDR > 2.0 % with 78 trajectories and BSR < 1.07 and PDR < 2.0 % with 136 trajectories. Colours indicate geopotential height (Z) values of the trajectories. Grey contours indicate 65 ppbv monthly mean CAMS CO levels at 400 K potential temperature, roughly indicating monthly mean boundaries of the ASM anticyclone (dotted for July, solid for August, and dash-dotted for September).
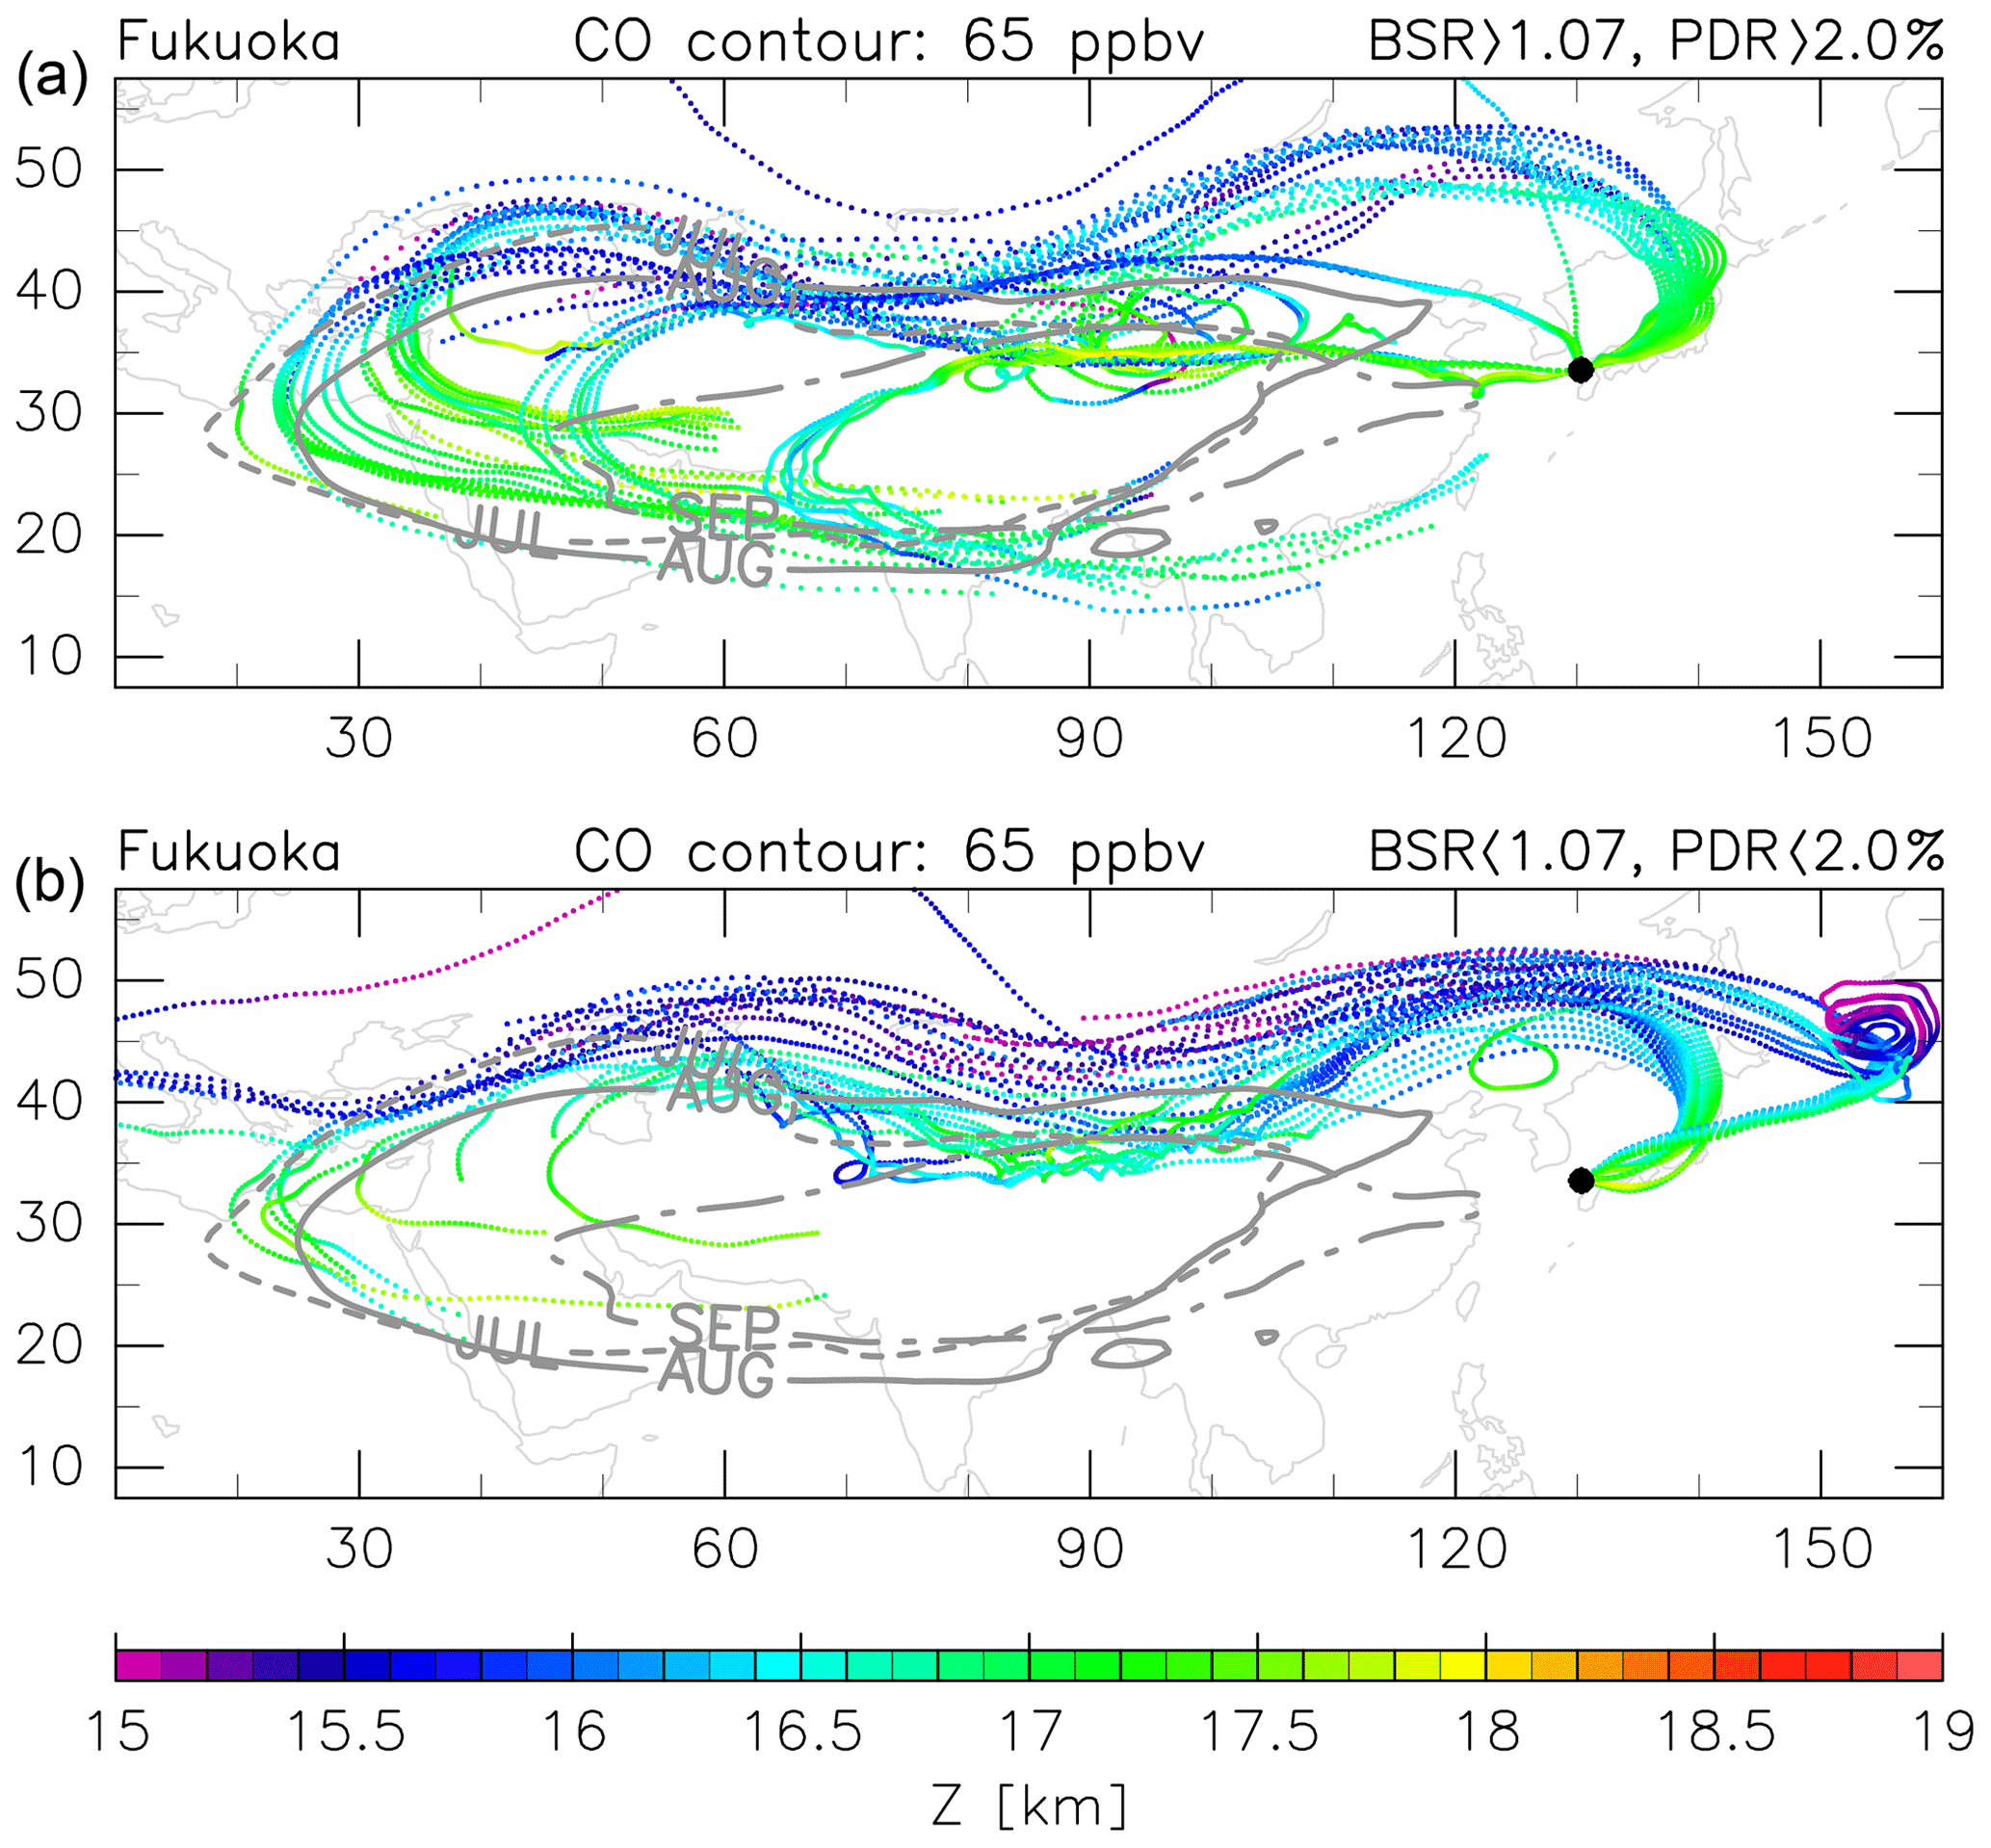
Figure 5As for Fig. 4, but for trajectories from Fukuoka with (a) 44 and (b) 37 trajectories.
Horizontal distributions of CO and MSF at the 400 K potential temperature surface during 18–23 August 2018 from the CAMS reanalysis data are shown in Fig. 6. Again, note that a potential temperature of 400 K corresponds to ∼ 17.1 km at Tsukuba and ∼ 17.3 km at Fukuoka during July–September 2018. The distribution of MSF indicates the location of the ASM anticyclone from the dynamical viewpoint. The strongest particle signals during the 3 months were observed on 21 August in the lower stratosphere over Tsukuba. The air mass with high CO concentrations was transported eastward from the ASM anticyclone centred over the Tibetan Plateau (Fig. 6), with an anticyclonic vortex of ∼ 20∘ longitude scale reaching the Japanese archipelago on 21 August, providing a clear signature of eastward-shedding vortices from the ASM anticyclone (e.g. Luo et al., 2018). Daily averaged longitude–time CO distributions over 30–40∘ N are shown in Fig. 7, with that latitude band chosen here because it includes the two lidar sites. The ASM anticyclone spans roughly 15–40∘ N, whereas the eastward-shedding vortices are often located slightly to the north at around 25–45∘ N, as indicated in Figs. 4–6; the latitude band must therefore be chosen carefully, depending on the research focus. In Fig. 7, the 60 ppbv CO contour may be a good indicator of eastward-shedding vortices. In July 2018, the eastward extension was weak, but in August there were three events that directly affected the two lidar sites on 3–15, 20–24 (Fig. 6), and 28–31 August. In September, there were three events on 3–8, 14–17, and 28–29 September. A comparison with Fig. 1 indicates that aerosol-particle-enhanced events correspond relatively well to CO-enhanced events, although missing lidar data points (due to low-level clouds) result in only the 20–24 August event being relatively well observed, with the 3–15 August event being captured only on 9 August. The ASM anticyclone is also characterized as an air mass hydrated by active convection from below (e.g. Santee et al., 2017). The longitude–time distribution of MLS water vapour at 400 K, averaged over 30–40∘ N with 8∘ longitude and 3 d bins, is shown in Fig. 8. The water-vapour-enhanced events over Japan correspond well with the CO-enhanced events over the same region shown in Fig. 7.
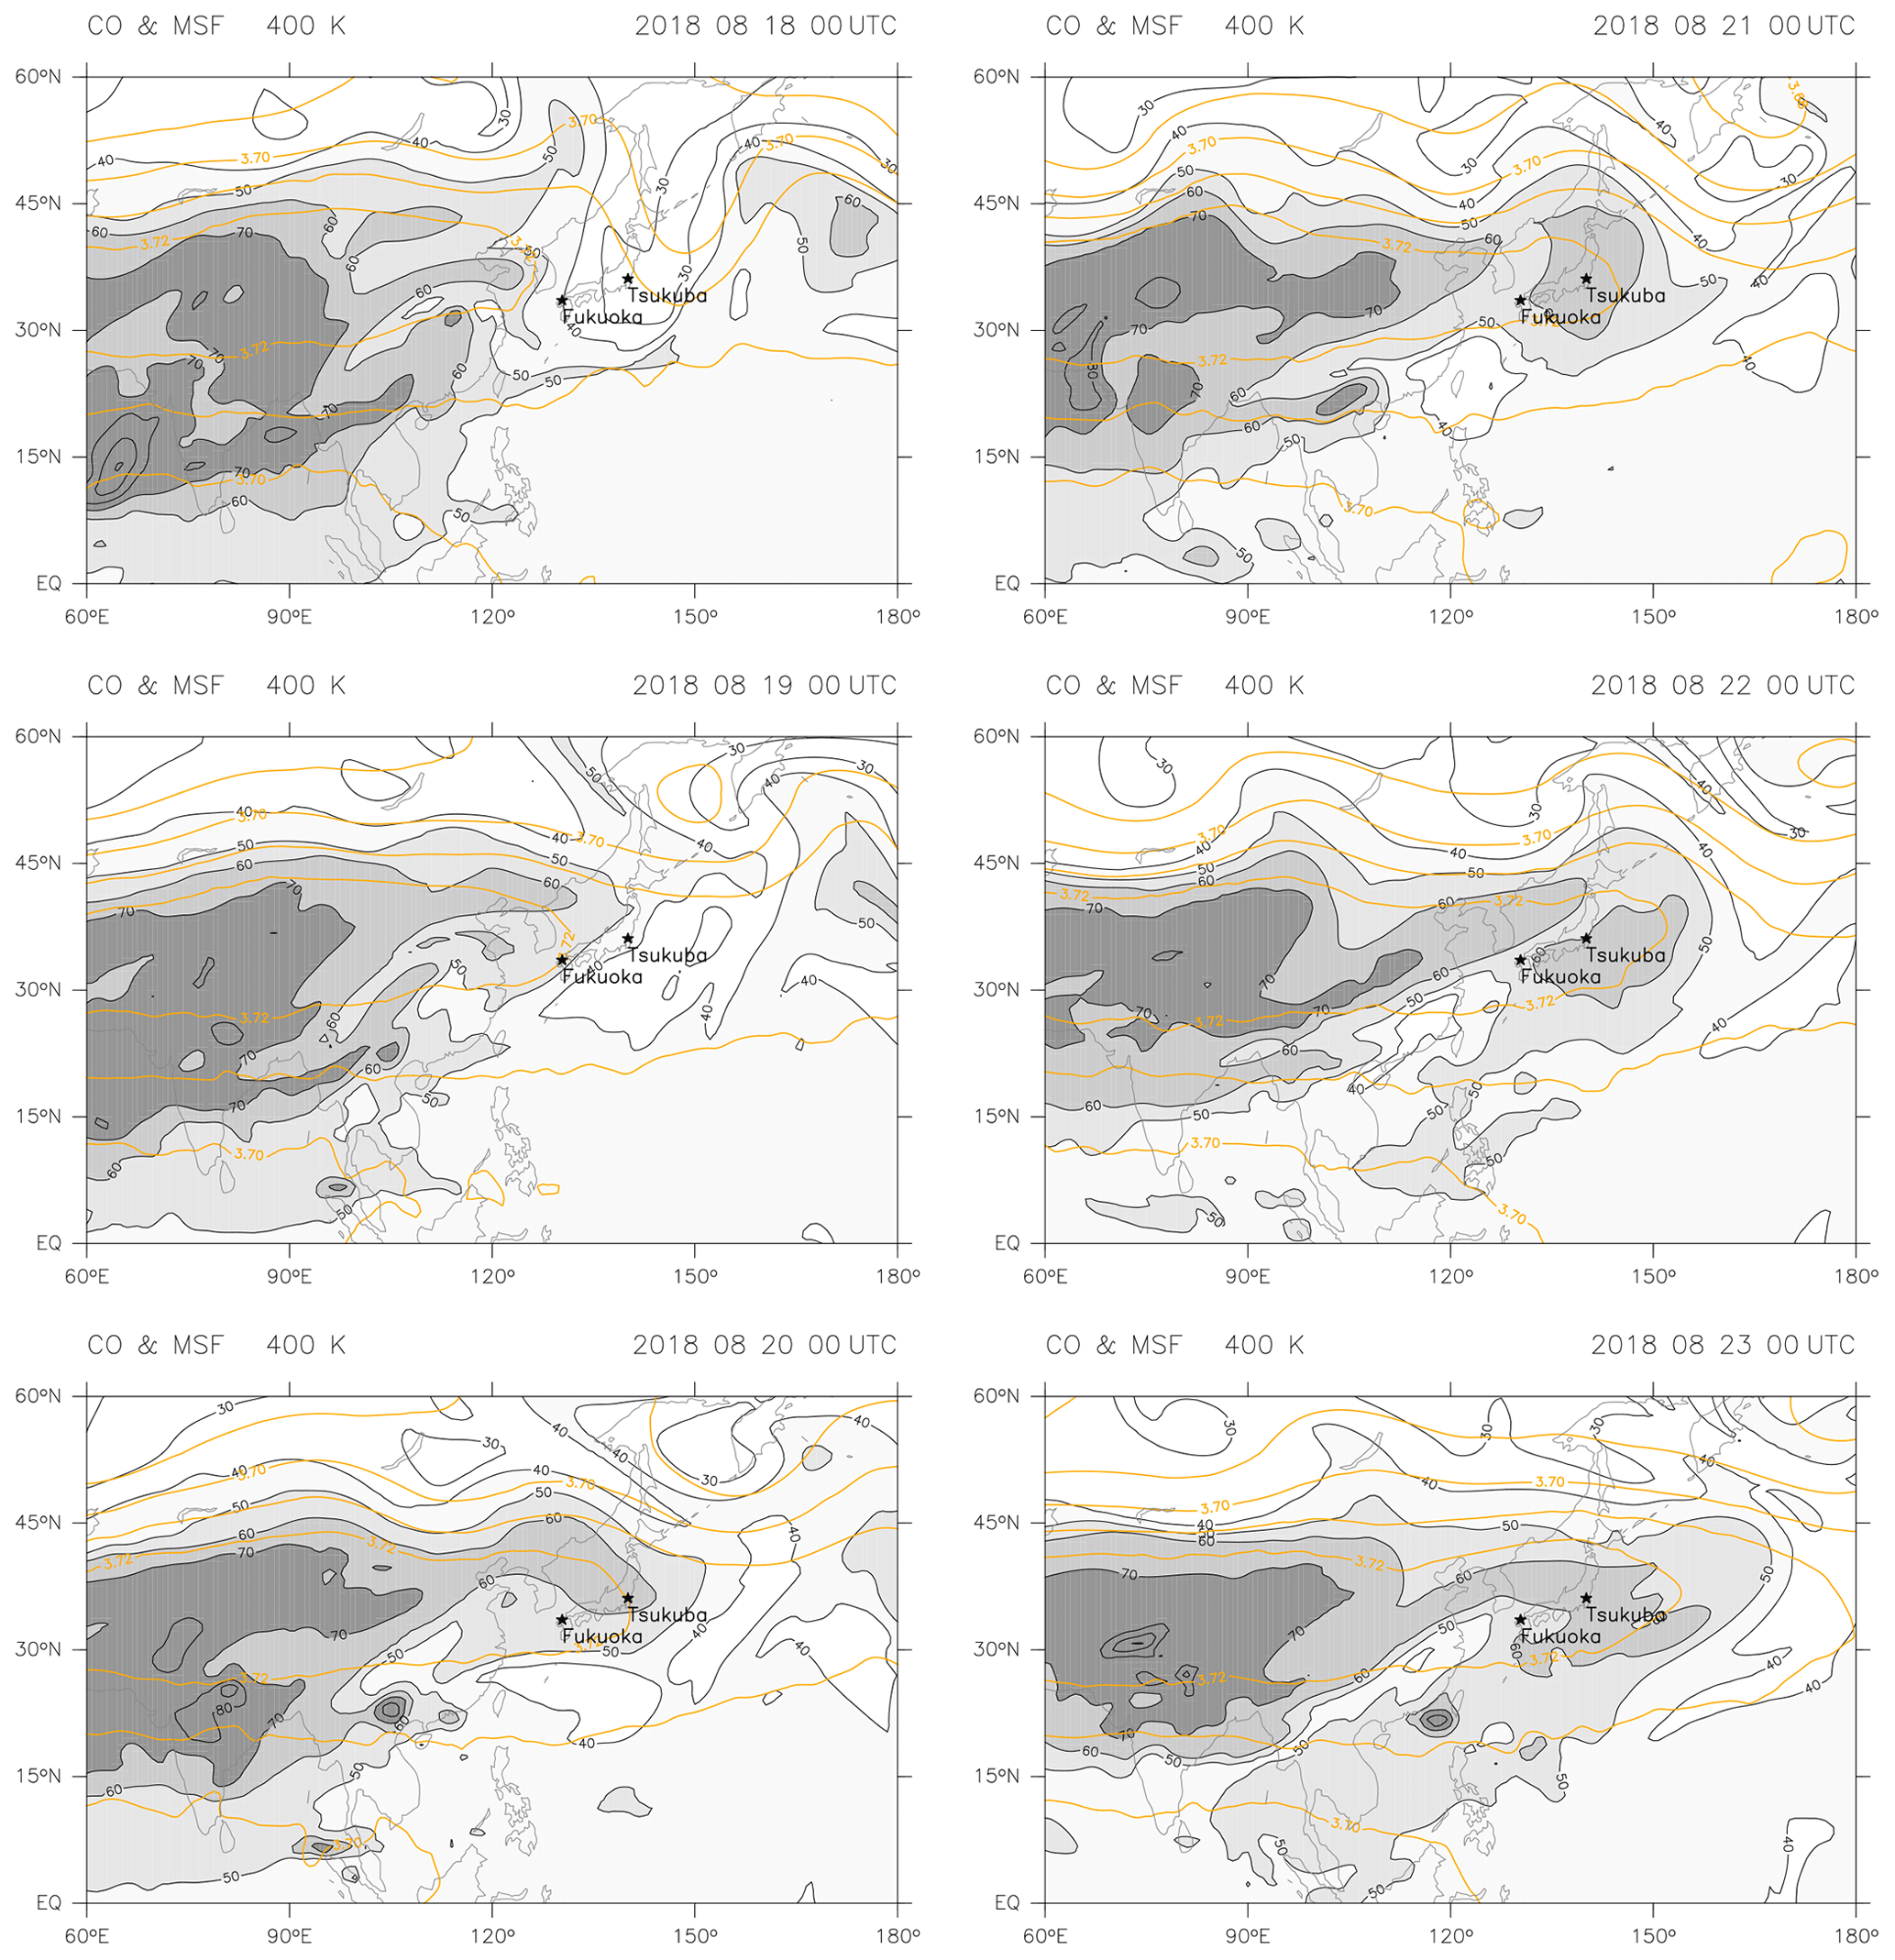
Figure 6Horizontal distribution of daily instantaneous (00:00 UTC) CO (black contours with grey tone, with intervals of 10 ppbv) and the Montgomery streamfunction (MSF; coloured contours at intervals of 0.01 × 10⁵ m2 s−2) at the 400 K potential temperature level during 18–23 August 2018 (dates indicated at the top right of each plot) using CAMS reanalysis data.

Figure 7Longitude–time distribution of the daily averaged CO concentration at 400 K potential temperature averaged over 30–40∘ N using CAMS reanalysis data. The contour interval is 10 ppbv, with 65 ppbv contours added (dotted). Vertical dotted lines indicate the locations of the two lidar sites in Fukuoka (130.36∘ E) and Tsukuba (140.1∘ E); furthermore, the periods along the longitude of Tsukuba when the CO concentration was 60 ppbv (i.e. 3–15, 20–24, and 28–31 August, as well as 3–8, 14–17, and 28–29 September) are shown as orange line segments.
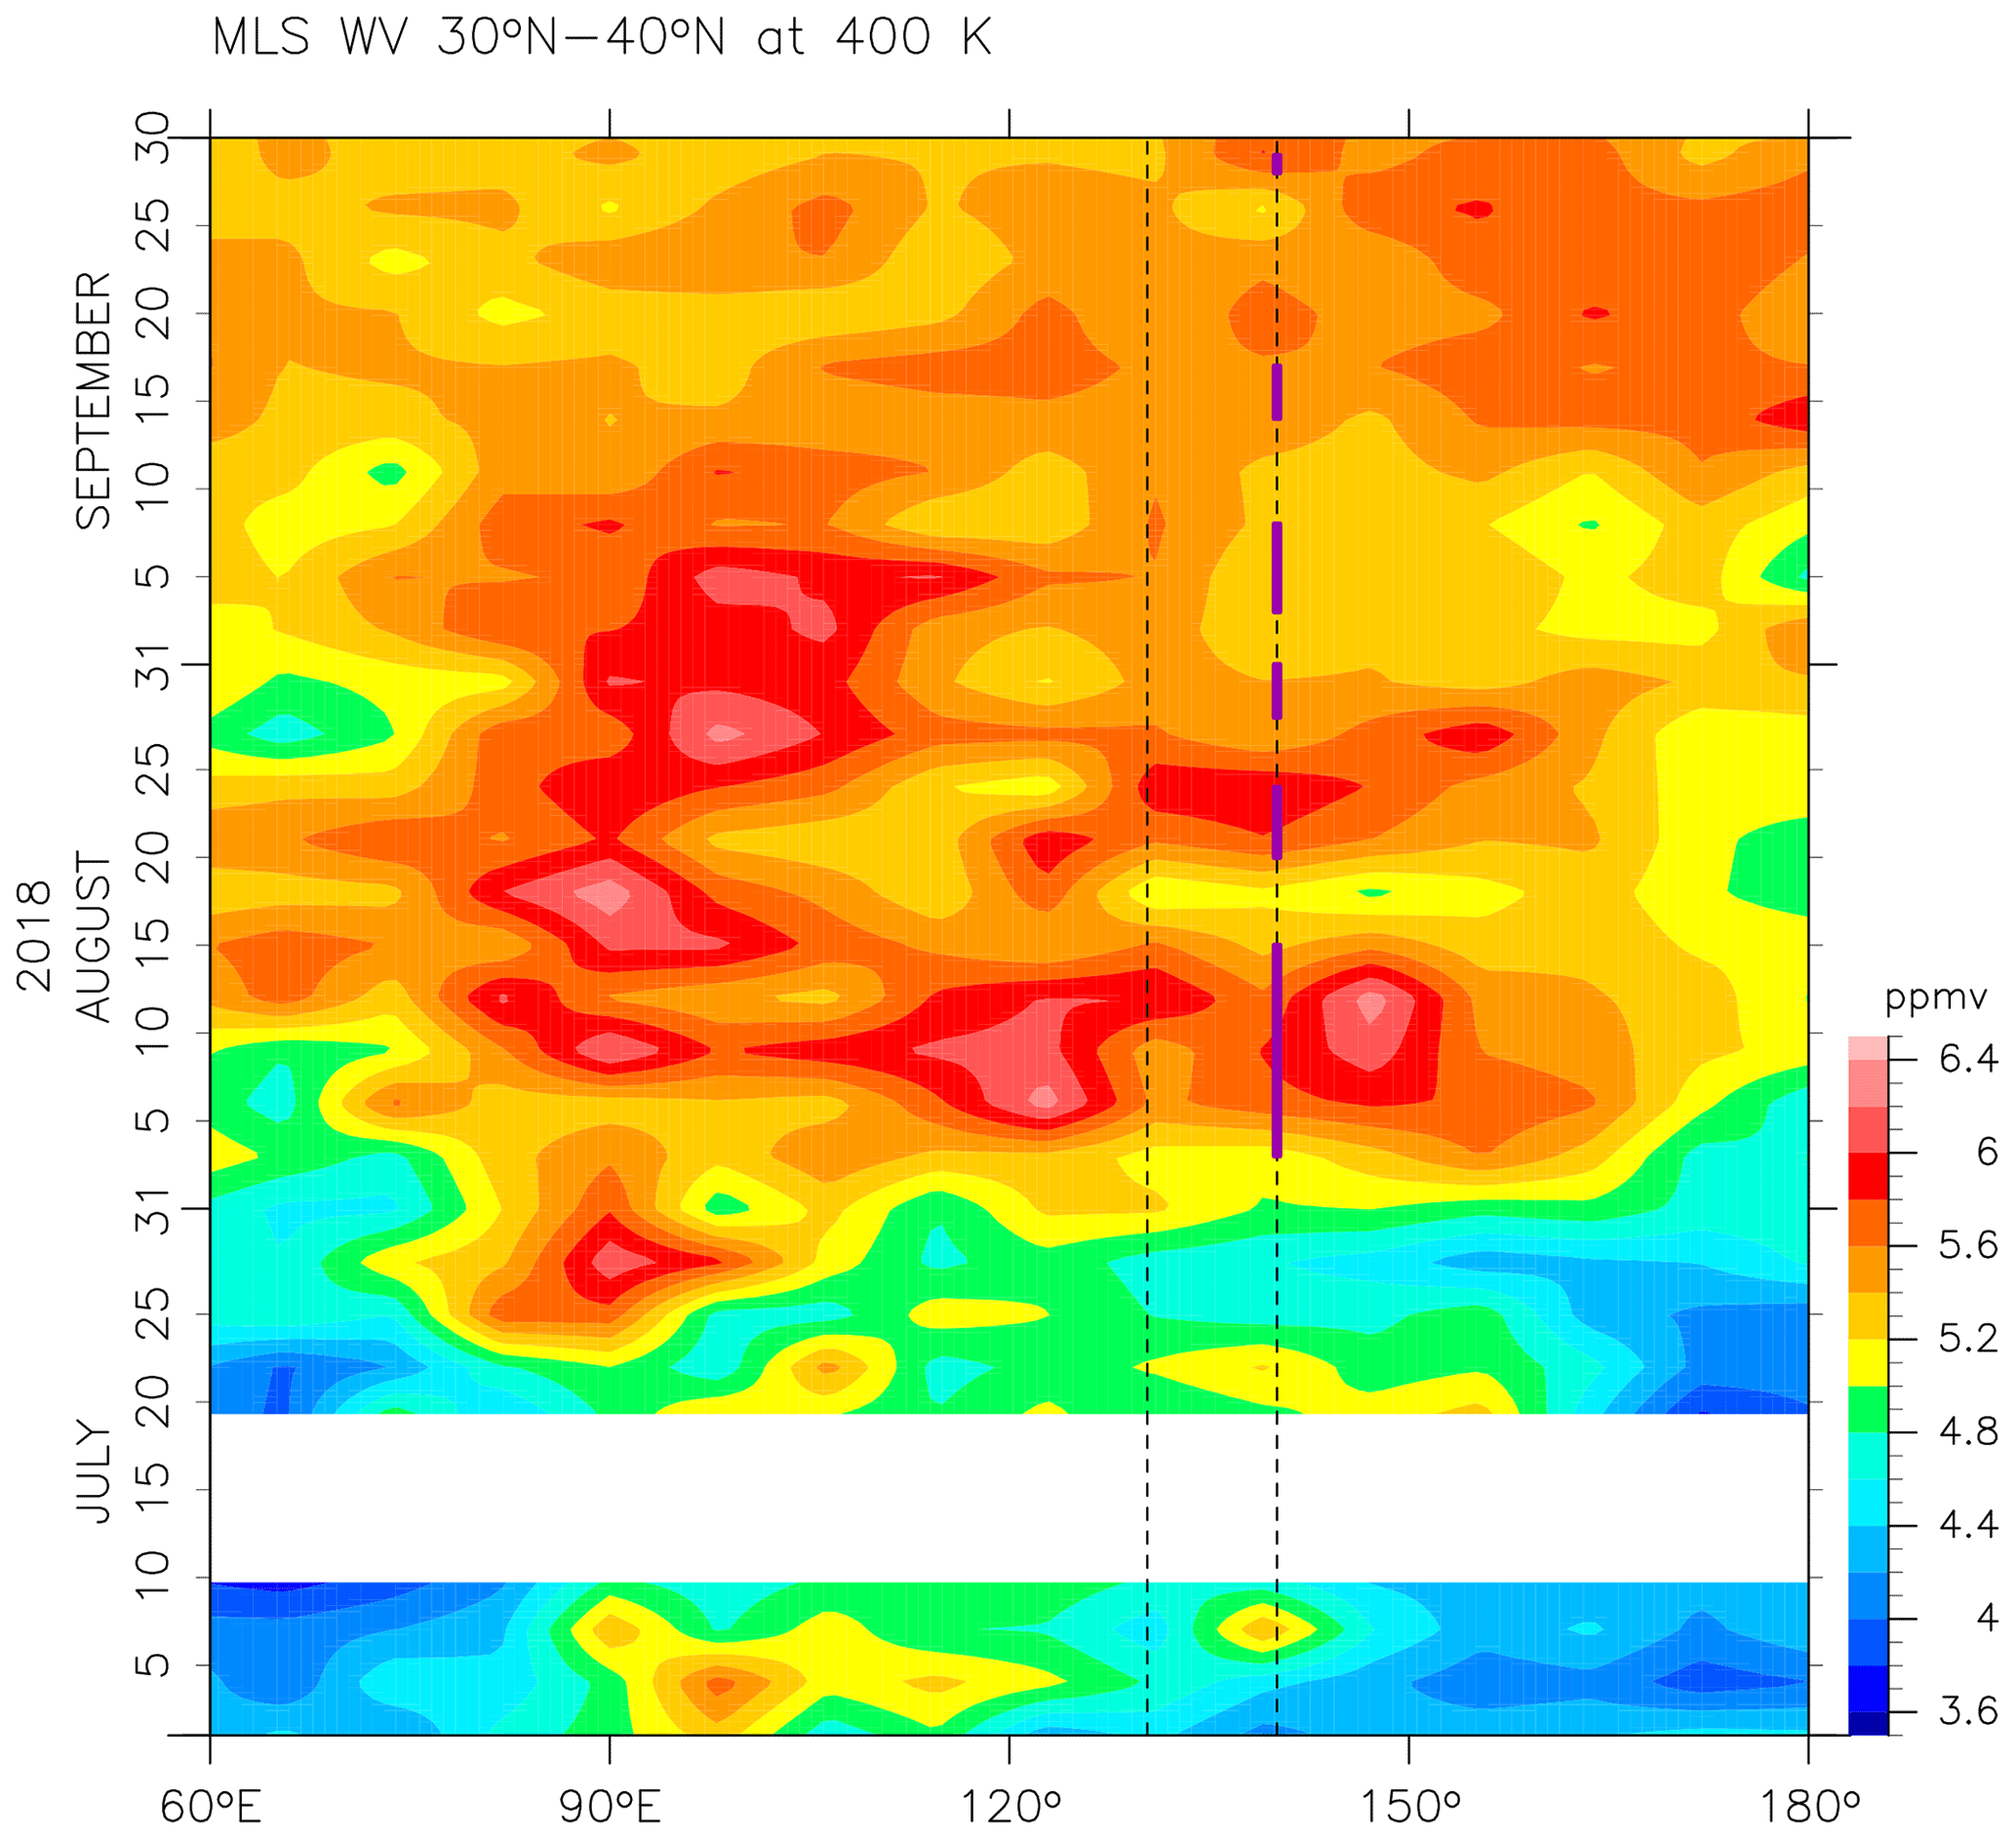
Figure 8As for Fig. 7, but for water vapour (in ppmv) at 400 K measured with the satellite MLS instrument. Data for the 30–40∘ N region have been aggregated into 3 d and 8∘ longitude bins, each constituting about 10 individual data points. The white region indicates missing measurements. The purple line segments are the same as the orange ones in Fig. 7.
3.3 Investigation of other potential causes
Lidar is sensitive to various types of volcanic aerosol (e.g. Yasui et al., 1996; Sakai et al., 2016; Khaykin et al., 2017). The lower stratosphere is continuously influenced by volcanic eruptions (GVP, 2013), which inject various types of particles and gases into the atmosphere (e.g. Robock, 2000). Among them, solid ash particles may remain in the stratosphere for up to a few months, while liquid H2SO4 particles resulting from the reaction of volcanic SO2 and H2S gases with OH and H2O may remain for a year or more. Aerosol particles are also emitted from biomass burning and forest fires, and although these particles rarely reach the stratosphere, extensive fire events can influence the stratospheric aerosol loading (e.g. Khaykin et al., 2018, 2020; Peterson et al., 2018; Kablick et al., 2020). In this section, the global lower-stratospheric aerosol loading during the summer of 2018 is investigated through an analysis of satellite aerosol data.
The time–latitude distribution of zonal-mean lower-stratospheric aerosol optical depth (AOD) at 675 nm from the OMPS LP satellite instrument is shown in Fig. 9. At high NH latitudes, the lower-stratospheric AOD increased in the summer of 2017 due to extensive wildfires in Canada (Khaykin et al., 2018; Peterson et al., 2018), but their influence became negligible by early 2018. In July 2018, the eruption of Ambae (or Aoba; 15.389∘ S, 167.835∘ E; GVP, 2019), Vanuatu, in the tropical western Pacific, caused increasing stratospheric AOD in the tropics. We also observed very weak signals around the same latitude from the beginning of April 2018, possibly due to the eruption of Ambae again during March–April 2018 (GVP, 2018). However, the lower-stratospheric AOD at 25–40∘ N was relatively low during July–September 2018, at least on a zonal-mean scale. The monthly mean CALIOP attenuated scattering ratio distribution due to aerosol particles at 17 km in July and August 2018 is shown in Fig. 10 where the ATAL is evident, with enhanced aerosol signals over the ASM region. In August there was also a hint of eastward extension of the ATAL to Japan, with a slight increase in the scattering ratio. By August, effects of the Ambae eruption had extended to about half of the tropics but had not reached Japan directly, at least not in a monthly mean view (see also the 10 d backward trajectories; Figs. 4 and 5).
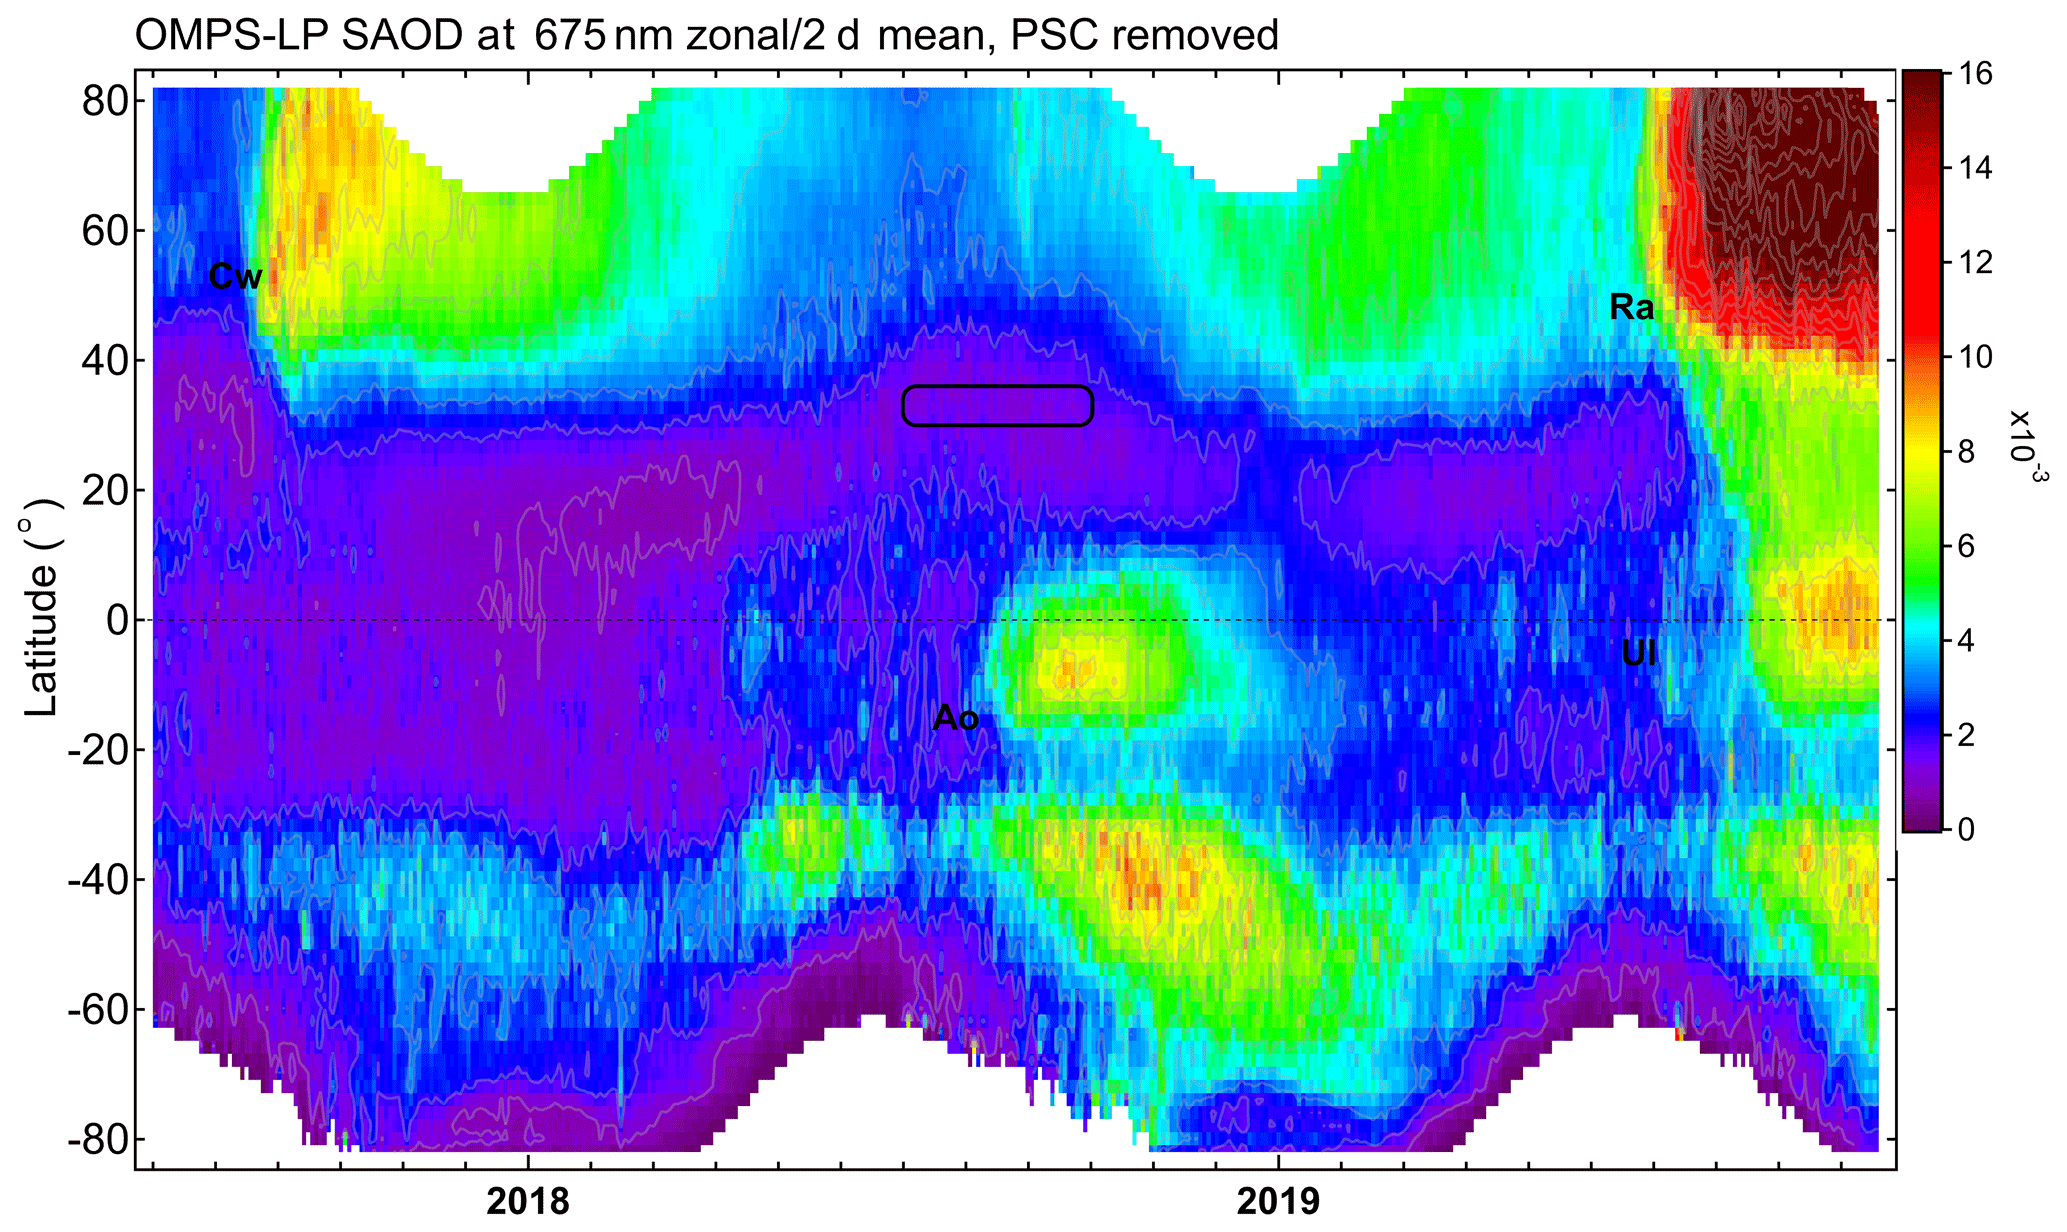
Figure 9Time–latitude distribution of zonal-mean and 2 d mean lower-stratospheric aerosol optical depth at 675 nm between the tropopause and 21 km of altitude from July 2017 to October 2019, as calculated from OMPS LP satellite data. The tropopause altitude for each OMPS LP profile was provided within the OMPS LP dataset. Signals due to polar stratospheric clouds (PSCs) have been removed. Major events that significantly enhanced NH stratospheric aerosol loading are labelled: Cw, Canadian wildfires in the summer of 2017; Ao, Ambae (Aoba) eruption, Vanuatu (July 2018); Ra, Raikoke eruption, Kuril Islands, Russia (June 2019); Ul, Ulawun eruption, Papua New Guinea (July, August, and October 2019) (GVP, 2013). The rectangular box indicates the period and location of the lidar measurements; white regions indicate missing measurements.
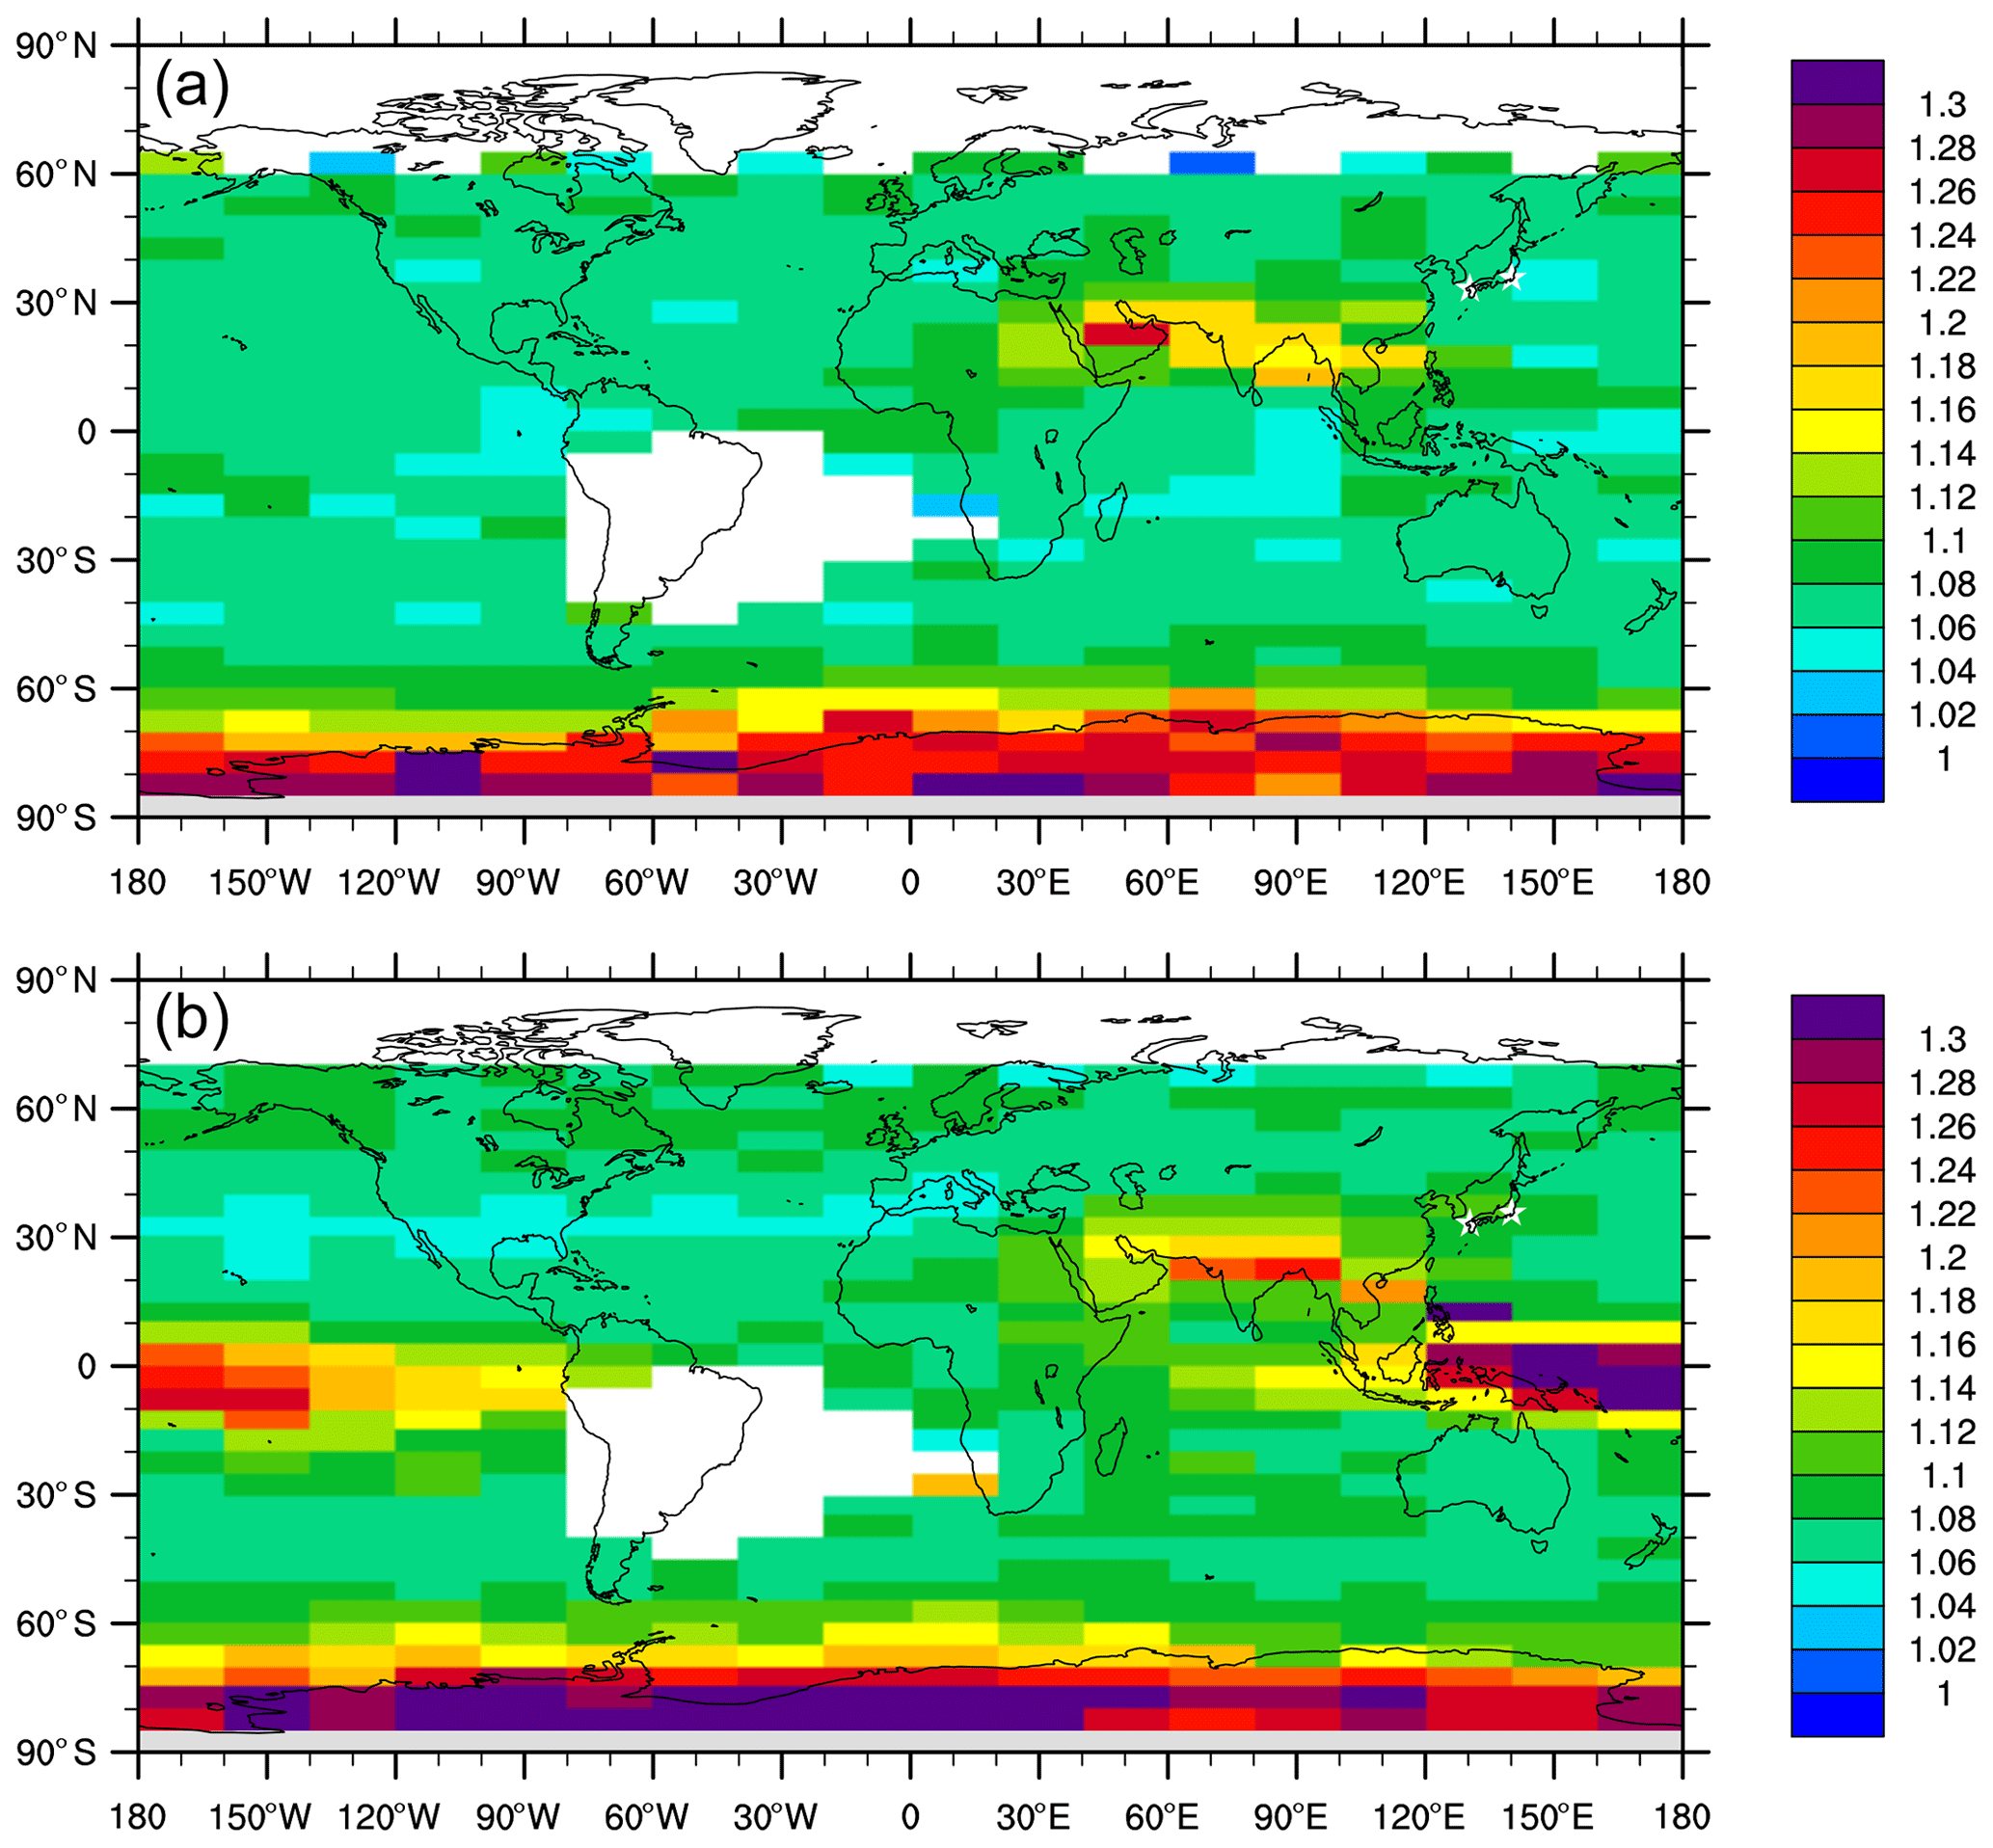
Figure 10Monthly mean horizontal distribution of attenuated scattering ratio at 17.042 km observed with the CALIOP satellite instrument in (a) July 2018 and (b) August 2018. Spatial bins are 5∘ in latitude, 20∘ in longitude, and 900 m in altitude. Clouds and PSCs have been removed (Sect. 2.2). It is noted that the CALIOP attenuated scattering ratio is defined as the ratio of the measured attenuated backscatter coefficients and the attenuated backscatter coefficients calculated from the molecular model, and its valid range is from 0.60 to 25.00. The two lidar station locations are marked with white stars. White regions indicate missing measurements (see Noel et al., 2014, for the data missing over the South Atlantic region).
Finally, Chouza et al. (2020) showed that lidar measurements at Mauna Loa, Hawaii, indicated no signals from volcanic eruptions during the summer of 2018. Also, at the OHP lidar site in France (43.9∘ N, 5.7∘ E), no enhancement in the lower-stratospheric aerosol abundance was observed during the summer of 2018. In summary, enhanced aerosol particle signals observed at Tsukuba (36.1∘ N) and Fukuoka (33.55∘ N) were unlikely to be due to volcanic eruptions or northern wildfires.
Lidar aerosol particle measurements made at Tsukuba and Fukuoka, Japan, during the summer of 2018 were investigated to determine whether these lidars are capable of detecting the eastward extension of the ATAL from the ASM anticyclone in the UTLS. Both lidars observed enhanced aerosol particle signals between the local tropopause and up to a few kilometres above it, with BSR values of ∼ 1.10 (1.07–1.18) and PDR values of ∼ 5 % (3 %–10 %) at Tsukuba, with similar BSR but lower PDR values at Fukuoka. The PDR difference between the two sites may be due to the Fukuoka lidar being operated on only 11 nights during the 3-month period and due to the fact that the dates of lidar operation at Fukuoka did not overlap those at Tsukuba when strong enhancement was observed. The lidars often detected strong signals (BSR values of > 1.25 and PDR values ≫ 10 %) due to ice cirrus clouds below the tropopause. The Tsukuba measurements indicate that timescales of lower-stratospheric enhancements are a few days. Backward trajectory calculations and reanalysis CO data support the hypothesis that air masses with enhanced aerosol signals originate in the ASM anticyclone and are transported over these sites in association with eastward-shedding vortices. OMPS LP and CALIOP satellite data indicated that the 25–40∘ N region was not influenced by volcanic eruptions or extensive biomass burning events during July–September 2018. Our results indicate that the enhanced aerosol particle levels measured at Tsukuba and Fukuoka are due to eastward-shedding vortices of the ATAL from the ASM anticyclone; i.e. they originated from pollutants emitted from Asian countries and were transported vertically by convection in the ASM region.
The PDR values obtained at Tsukuba, i.e. ∼ 5 % (3 %–10 %), suggest that these enhanced particles are solid particles rather than spherical liquid H2SO4 particles (PDR ∼ 0 %) or cirrus ice particles (PDR > 25 %–30 %). A recent laboratory experiment by Wagner et al. (2020a) showed PDR values of ∼ 9.5 % for solid NH4NO3 particles at 488 nm. (Also, Wagner et al., 2020b, showed electron microscope images of solid NH4NO3 particles, which are “of rather compact shape with aspect ratios predominantly in the range from 0.80 to 1.25”.) Thus, the values obtained with our lidars in Japan might be consistent with those of solid NH4NO3 particles suggested by Höpfner et al. (2019). Note that Sakai et al. (2010) investigated PDR values of other particle types at 532 nm in laboratory experiments; among these particles, sub-micrometre sea salt and ammonium sulfate crystals (e.g. Plate 9, pp. 237–239 of Pruppacher and Klett, 1997) were found to have PDR values of ∼ 8 % and ∼ 4 %, respectively. Small non-zero PDR values can occur if enhanced liquid H2SO4 particles and fresh ash particles from volcanic eruptions are mixed, although satellite data indicate this is less plausible (Sect. 3.3). However, it should be noted that the lidar BSR and PDR measurements cannot exclude the possibility of the co-existence of other types of solid aerosol particles such as mineral dust (e.g. modelling work by Lau et al., 2018; in situ measurements by Vernier et al., 2018), black carbon (e.g. modelling work by Gu et al., 2016), and some types of carbonaceous aerosols (e.g. modelling works by Gu et al., 2016; Lau et al., 2018; Fairlie et al., 2020), which are solid.
Lower-stratospheric aerosol enhancement over Japan was observed mainly during August–September and seldom in July. This may be partly explained by the seasonality of the concentration of solid NH4NO3 particles in the ASM anticyclone (Höpfner et al., 2019), peaking in August with significant year-to-year variations. Furthermore, June and July are in the rainy season for most of Japan, in association with the “baiu” frontal system (e.g. Ninomiya and Shibagaki, 2007). In July 2018, severe rainfall and flood events occurred early in the month (Shimpo et al., 2019), after which many parts of Japan experienced high surface temperatures with cumulonimbus clouds in several areas. Typhoons, synoptic low systems, and frontal systems affected Japan through the end of September 2018, with these rainfall and thick cloud events preventing the lidars from sensing the lower stratosphere, causing many of the missed data slots in Fig. 1.
In summary, part of the ATAL in the ASM anticyclone air mass is transported eastward and passes over Japan in the UTLS. Lidars in Japan can observe the lower-stratospheric portion of these aerosol particles if conditions permit, with summertime active convection and various weather systems often preventing their sensing of the lower stratosphere. Volcanic eruptions and extensive wildfires may complicate the detection of particles of ATAL origin over Japan. The upper-tropospheric portion of these particles is either depleted by tropospheric processes (convection and wet scavenging) or obscured by much stronger cirrus cloud signals. Despite the limited sampling, the lidar detection of ATAL particles verifies eastward UTLS transport associated with the sub-seasonal-scale dynamics of the ASM anticyclone, a process observed by satellite instruments and predicted by models. The spatial extent and chemical and aerosol content of this transport process are the main focus of an upcoming airborne field campaign, the Asian summer monsoon Chemical and Climate Impact Project (ACCLIP; Pan et al., 2019), which is scheduled to take place over the western Pacific during July–August 2022.
The time–height distribution of TDR at Tsukuba is shown in Fig. A1, complementing Fig. 1b (PDR distribution).
Lidar data analysed in this study can be downloaded from the following websites: https://mri-2.mri-jma.go.jp/owncloud/s/GrNGNiGKzq8tjqH (Sakai, 2021) for Tsukuba and https://www.cis.fukuoka-u.ac.jp/~ksiraisi/LidarDataArchive/Fukuoka_2018summer.zip (Shiraishi, 2021) for Fukuoka. ERA5 and CAMS data can be downloaded from the Copernicus website, the former from https://cds.climate.copernicus.eu (European Commission et al., 2021a) and the latter from https://ads.atmosphere.copernicus.eu (European Commission et al., 2021b). MLS version 4.2 level 2 data can be downloaded from https://acdisc.gesdisc.eosdis.nasa.gov/data/Aura_MLS_Level2/ (NASA, 2021a). OMPS LP level 2 version 1.5 data can be downloaded from https://snpp-omps.gesdisc.eosdis.nasa.gov/data (NASA, 2021b). CALIOP data can be downloaded from https://asdc.larc.nasa.gov/search (NASA, 2021c).
MF, MS, and LLP designed the study. TeS, TN, and KS operated the lidar systems, and MF, TeS, and KS analysed lidar data and drafted the paper. YI calculated trajectories. MF and HX analysed CAMS data. SK and MF analysed MLS data. SK analysed OMPS LP data, while TaS analysed CALIOP data. All authors contributed to the interpretation and reviewed and edited the paper.
The authors declare that they have no conflict of interest.
This study was financially supported by a grant for mission research on the sustainable humanosphere from the Research Institute for Sustainable Humanosphere (RISH), Kyoto University, Japan, for the fiscal years 2019–2020. We thank the undergraduate students at the Faculty of Science, Fukuoka University, who operated the lidar system at Fukuoka. The GFD-DENNOU library was used for producing Figs. 1–8 and A1. We thank Nawo Eguchi and Suginori Iwasaki for valuable comments on the draft paper. We also thank two anonymous reviewers and Michelle Santee for valuable comments and suggestions.
This study was financially supported by a grant for mission research on the sustainable humanosphere from the Research Institute for Sustainable Humanosphere (RISH), Kyoto University, Japan, for the fiscal years 2019–2020.
This paper was edited by Rolf Müller and reviewed by Michelle Santee and two anonymous referees.
Adachi, H., Shibata, T., Iwasaka, Y., and Fujiwara, M.: Calibration method for the lidar-observed stratospheric depolarization ratio in the presence of liquid aerosol particles, Appl. Optics, 40, 6587–6595, https://doi.org/10.1364/AO.40.006587, 2001.
Amemiya, A. and Sato, K.: A two-dimensional dynamical model for the subseasonal variability of the Asian monsoon anticyclone, J. Atmos. Sci., 75, 3597–3612, https://doi.org/10.1175/JAS-D-17-0208.1, 2018.
Bossolasco, A., Jegou, F., Sellitto, P., Berthet, G., Kloss, C., and Legras, B.: Global modelling studies of composition and decadal trends of the Asian Tropopause Aerosol Layer, Atmos. Chem. Phys. Discuss. [preprint], https://doi.org/10.5194/acp-2020-677, in review, 2020.
Brunamonti, S., Jorge, T., Oelsner, P., Hanumanthu, S., Singh, B. B., Kumar, K. R., Sonbawne, S., Meier, S., Singh, D., Wienhold, F. G., Luo, B. P., Boettcher, M., Poltera, Y., Jauhiainen, H., Kayastha, R., Karmacharya, J., Dirksen, R., Naja, M., Rex, M., Fadnavis, S., and Peter, T.: Balloon-borne measurements of temperature, water vapor, ozone and aerosol backscatter on the southern slopes of the Himalayas during StratoClim 2016–2017, Atmos. Chem. Phys., 18, 15937–15957, https://doi.org/10.5194/acp-18-15937-2018, 2018.
Chen, Z., Bhartia, P. K., Loughman, R., Colarco, P., and DeLand, M.: Improvement of stratospheric aerosol extinction retrieval from OMPS/LP using a new aerosol model, Atmos. Meas. Tech., 11, 6495–6509, https://doi.org/10.5194/amt-11-6495-2018, 2018.
Chouza, F., Leblanc, T., Barnes, J., Brewer, M., Wang, P., and Koon, D.: Long-term (1999–2019) variability of stratospheric aerosol over Mauna Loa, Hawaii, as seen by two co-located lidars and satellite measurements, Atmos. Chem. Phys., 20, 6821–6839, https://doi.org/10.5194/acp-20-6821-2020, 2020.
Davis, S. M., Hegglin, M. I., Fujiwara, M., Dragani, R., Harada, Y., Kobayashi, C., Long, C., Manney, G. L., Nash, E. R., Potter, G. L., Tegtmeier, S., Wang, T., Wargan, K., and Wright, J. S.: Assessment of upper tropospheric and stratospheric water vapor and ozone in reanalyses as part of S-RIP, Atmos. Chem. Phys., 17, 12743–12778, https://doi.org/10.5194/acp-17-12743-2017, 2017.
Enomoto, T., Hoskins, B. J., and Matsuda, Y.: The formation mechanism of the Bonin high in August, Q. J. Roy. Meteor. Soc., 129, 157–178, https://doi.org/10.1256/qj.01.211, 2003.
European Commission, Copernicus, and ECMWF: Climate Data Store, available at: https://cds.climate.copernicus.eu, last access: 24 February 2021a.
European Commission, Copernicus, and ECMWF: Atmosphere Data Store, available at: https://ads.atmosphere.copernicus.eu, last access: 24 February 2021b.
Fadnavis, S., Semeniuk, K., Pozzoli, L., Schultz, M. G., Ghude, S. D., Das, S., and Kakatkar, R.: Transport of aerosols into the UTLS and their impact on the Asian monsoon region as seen in a global model simulation, Atmos. Chem. Phys., 13, 8771–8786, https://doi.org/10.5194/acp-13-8771-2013, 2013.
Fadnavis, S., Roy, C., Chattopadhyay, R., Sioris, C. E., Rap, A., Müller, R., Kumar, K. R., and Krishnan, R.: Transport of trace gases via eddy shedding from the Asian summer monsoon anticyclone and associated impacts on ozone heating rates, Atmos. Chem. Phys., 18, 11493–11506, https://doi.org/10.5194/acp-18-11493-2018, 2018.
Fairlie, T. D., Liu, H., Vernier, J., Campuzano-Jost, P., Jimenez, J. L., Jo, D. S., Zhang, B., Natarajan, M., Avery, M. A., and Huey, G.: Estimates of regional source contributions to the Asian Tropopause Aerosol Layer using a chemical transport model, J. Geophys. Res.-Atmos., 125, e2019JD031506, https://doi.org/10.1029/2019jd031506, 2020.
Fujiwara, M., Iwasaki, S., Shimizu, A., Inai, Y., Shiotani, M., Hasebe, F., Matsui, I., Sugimoto, N., Okamoto, H., Nishi, N., Hamada, A., Sakazaki, T., and Yoneyama, K.: Cirrus observations in the tropical tropopause layer over the western Pacific, J. Geophys. Res., 114, D09304, https://doi.org/10.1029/2008JD011040, 2009.
Fujiwara, M., Vömel, H., Hasebe, F., Shiotani, M., Ogino, S.-Y., Iwasaki, S., Nishi, N., Shibata, T., Shimizu, K., Nishimoto, E., Valverde-Canossa, J. M., Selkirk, H. B., and Oltmans, S. J.: Seasonal to decadal variations of water vapor in the tropical lower stratosphere observed with balloon-borne cryogenic frostpoint hygrometers, J. Geophys. Res., 115, D18304, https://doi.org/10.1029/2010JD014179, 2010.
Garny, H. and Randel, W. J.: Dynamic variability of the Asian monsoon anticyclone observed in potential vorticity and correlations with tracer distributions, J. Geophys. Res.-Atmos., 118, 13421–13433, https://doi.org/10.1002/2013JD020908, 2013.
Gu, Y., Liao, H., and Bian, J.: Summertime nitrate aerosol in the upper troposphere and lower stratosphere over the Tibetan Plateau and the South Asian summer monsoon region, Atmos. Chem. Phys., 16, 6641–6663, https://doi.org/10.5194/acp-16-6641-2016, 2016.
GVP (Global Volcanism Program): Volcanoes of the World, v. 4.9.0 (04 Jun 2020), Bulletin of the Global Volcanism Network, https://doi.org/10.5479/si.GVP.VOTW4-2013, 2013.
GVP (Global Volcanism Program): Report on Ambae (Vanuatu), Bulletin of the Global Volcanism Network, 43, https://doi.org/10.5479/si.GVP.BGVN201807-257030, 2018.
GVP (Global Volcanism Program): Report on Ambae (Vanuatu), Bulletin of the Global Volcanism Network, 44, https://doi.org/10.5479/si.GVP.BGVN201902-257030, 2019.
Haarig, M., Ansmann, A., Baars, H., Jimenez, C., Veselovskii, I., Engelmann, R., and Althausen, D.: Depolarization and lidar ratios at 355, 532, and 1064 nm and microphysical properties of aged tropospheric and stratospheric Canadian wildfire smoke, Atmos. Chem. Phys., 18, 11847–11861, https://doi.org/10.5194/acp-18-11847-2018, 2018.
Hanumanthu, S., Vogel, B., Müller, R., Brunamonti, S., Fadnavis, S., Li, D., Ölsner, P., Naja, M., Singh, B. B., Kumar, K. R., Sonbawne, S., Jauhiainen, H., Vömel, H., Luo, B., Jorge, T., Wienhold, F. G., Dirkson, R., and Peter, T.: Strong day-to-day variability of the Asian Tropopause Aerosol Layer (ATAL) in August 2016 at the Himalayan foothills, Atmos. Chem. Phys., 20, 14273–14302, https://doi.org/10.5194/acp-20-14273-2020, 2020.
Hersbach, H., Bell, B., Berrisford, P., Hirahara, S., Horányi, A., Muñoz-Sabater, J., Nicolas, J., Peubey, C., Radu, R., Schepers, D., Simmons, A., Soci, C., Abdalla, S., Abellan, X., Balsamo, G., Bechtold, P., Biavati, G., Bidlot, J., Bonavita, M., Chiara, G., Dahlgren, P., Dee, D., Diamantakis, M., Dragani, R., Flemming, J., Forbes, R., Fuentes, M., Geer, A., Haimberger, L., Healy, S., Hogan, R. J., Hólm, E., Janisková, M., Keeley, S., Laloyaux, P., Lopez, P., Lupu, C., Radnoti, G., Rosnay, P., Rozum, I., Vamborg, F., Villaume, S., and Thépaut, J.: The ERA5 global reanalysis, Q. J. Roy. Meteor. Soc., 146, 1999–2049, https://doi.org/10.1002/qj.3803, 2020.
Hoffmann, L., Günther, G., Li, D., Stein, O., Wu, X., Griessbach, S., Heng, Y., Konopka, P., Müller, R., Vogel, B., and Wright, J. S.: From ERA-Interim to ERA5: the considerable impact of ECMWF's next-generation reanalysis on Lagrangian transport simulations, Atmos. Chem. Phys., 19, 3097–3124, https://doi.org/10.5194/acp-19-3097-2019, 2019.
Honomichl, S. B. and Pan, L. L.: Transport from the Asian summer monsoon anticyclone over the western Pacific, J. Geophys. Res.-Atmos., 125, e2019JD032094, https://doi.org/10.1029/2019JD032094, 2020.
Höpfner, M., Ungermann, J., Borrmann, S., Wagner, R., Spang, R., Riese, M., Stiller, G., Appel, O., Batenburg, A. M., Bucci, S., Cairo, F., Dragoneas, A., Friedl-Vallon, F., Hünig, A., Johansson, S., Krasauskas, L., Legras, B., Leisner, T., Mahnke, C., Möhler, O., Molleker, S., Müller, R., Neubert, T., Orphal, J., Preusse, P., Rex, M., Saathoff, H., Stroh, F., Weigel, R., and Wohltmann, I.: Ammonium nitrate particles formed in upper troposphere from ground ammonia sources during Asian monsoons, Nat. Geosci., 12, 608–612, https://doi.org/10.1038/s41561-019-0385-8, 2019.
Hurst, D. F., Read, W. G., Vömel, H., Selkirk, H. B., Rosenlof, K. H., Davis, S. M., Hall, E. G., Jordan, A. F., and Oltmans, S. J.: Recent divergences in stratospheric water vapor measurements by frost point hygrometers and the Aura Microwave Limb Sounder, Atmos. Meas. Tech., 9, 4447–4457, https://doi.org/10.5194/amt-9-4447-2016, 2016.
Inai, Y.: Long-term variation in the mixing fraction of tropospheric and stratospheric air masses in the upper tropical tropopause layer, J. Geophys. Res.-Atmos., 123, 4890–4909, https://doi.org/10.1029/2018JD028300, 2018.
Inai, Y., Aoki, S., Honda, H., Furutani, H., Matsumi, Y., Ouchi, M., Sugawara, S., Hasebe, F., Uematsu, M., and Fujiwara, M.: Balloon-borne tropospheric CO2 observations over the equatorial eastern and western Pacific, Atmos. Environ., 184, 24–36, https://doi.org/10.1016/j.atmosenv.2018.04.016, 2018.
Inness, A., Ades, M., Agustí-Panareda, A., Barré, J., Benedictow, A., Blechschmidt, A.-M., Dominguez, J. J., Engelen, R., Eskes, H., Flemming, J., Huijnen, V., Jones, L., Kipling, Z., Massart, S., Parrington, M., Peuch, V.-H., Razinger, M., Remy, S., Schulz, M., and Suttie, M.: The CAMS reanalysis of atmospheric composition, Atmos. Chem. Phys., 19, 3515–3556, https://doi.org/10.5194/acp-19-3515-2019, 2019.
Jäger, H. and Hofmann, D.: Midlatitude lidar backscatter to mass, area, and extinction conversion model based on in situ aerosol measurements from 1980 to 1987, Appl. Optics, 30, 127, https://doi.org/10.1364/ao.30.000127, 1991.
Jäger, H., Deshler, T., and Hofmann, D. J.: Midlatitude lidar backscatter conversions based on balloonborne aerosol measurements, Geophys. Res. Lett., 22, 1729–1732, https://doi.org/10.1029/95GL01521, 1995.
Kablick III, G. P., Allen, D. R., Fromm, M. D., and Nedoluha, G. E.: Australian pyroCb smoke generates synoptic-scale stratospheric anticyclones, Geophys. Res. Lett., 47, e2020GL088101, https://doi.org/10.1029/2020GL088101, 2020.
Khaykin, S. M., Godin-Beekmann, S., Keckhut, P., Hauchecorne, A., Jumelet, J., Vernier, J.-P., Bourassa, A., Degenstein, D. A., Rieger, L. A., Bingen, C., Vanhellemont, F., Robert, C., DeLand, M., and Bhartia, P. K.: Variability and evolution of the midlatitude stratospheric aerosol budget from 22 years of ground-based lidar and satellite observations, Atmos. Chem. Phys., 17, 1829–1845, https://doi.org/10.5194/acp-17-1829-2017, 2017.
Khaykin, S. M., Godin-Beekmann, S., Hauchecorne, A., Pelon, J., Ravetta, F., and Keckhut, P.: Stratospheric smoke with unprecedentedly high backscatter observed by lidars above southern France, Geophys. Res. Lett., 45, 1639–1646, https://doi.org/10.1002/2017GL076763, 2018.
Khaykin, S. M., Legras, B., Bucci, S., Sellitto, P., Isaksen, L., Tencé, F., Bekki, S., Bourassa, A., Rieger, L., Zawada, D., Jumelet, J., and Godin-Beekmann, S.: The 2019/20 Australian wildfires generated a persistent smoke-charged vortex rising up to 35 km altitude, Commun. Earth Environ., 1, 22, https://doi.org/10.1038/s43247-020-00022-5, 2020.
Kim, M.-H., Omar, A. H., Tackett, J. L., Vaughan, M. A., Winker, D. M., Trepte, C. R., Hu, Y., Liu, Z., Poole, L. R., Pitts, M. C., Kar, J., and Magill, B. E.: The CALIPSO version 4 automated aerosol classification and lidar ratio selection algorithm, Atmos. Meas. Tech., 11, 6107–6135, https://doi.org/10.5194/amt-11-6107-2018, 2018.
Lau, W. K. M., Yuan, C., and Li, Z.: Origin, maintenance and variability of the Asian Tropopause Aerosol Layer (ATAL): The roles of Monsoon dynamics, Sci. Rep., 8, 3960, https://doi.org/10.1038/s41598-018-22267-z, 2018.
Li, D., Vogel, B., Müller, R., Bian, J., Günther, G., Ploeger, F., Li, Q., Zhang, J., Bai, Z., Vömel, H., and Riese, M.: Dehydration and low ozone in the tropopause layer over the Asian monsoon caused by tropical cyclones: Lagrangian transport calculations using ERA-Interim and ERA5 reanalysis data, Atmos. Chem. Phys., 20, 4133–4152, https://doi.org/10.5194/acp-20-4133-2020, 2020.
Livesey, N. J., Read, W. G., Wagner, P. A., Froidevaux, L., Lambert, A., Manney, G. L., Millán Valle, L. F., Pumphrey, H. C., Santee, M. L., Schwartz, M. J., Wang, S., Fuller, R. A., Jarnot, R. F., Knosp, B. W., Martinez, E., and Lay, R. R.: Aura Microwave Limb Sounder (MLS) Version 4.2x Level 2 and 3 data quality and description document, Technical Report JPL D-33509 Rev. E, available at: https://mls.jpl.nasa.gov/, last access: 26 August 2020.
Luo, J., Pan, L. L., Honomichl, S. B., Bergman, J. W., Randel, W. J., Francis, G., Clerbaux, C., George, M., Liu, X., and Tian, W.: Space–time variability in UTLS chemical distribution in the Asian summer monsoon viewed by limb and nadir satellite sensors, Atmos. Chem. Phys., 18, 12511–12530, https://doi.org/10.5194/acp-18-12511-2018, 2018.
Martinsson, B. G., Friberg, J., Andersson, S. M., Weigelt, A., Hermann, M., Assmann, D., Voigtländer, J., Brenninkmeijer, C. A. M., van Velthoven, P. J. F., and Zahn, A.: Comparison between CARIBIC Aerosol Samples Analysed by Accelerator-Based Methods and Optical Particle Counter Measurements, Atmos. Meas. Tech., 7, 2581–2596, https://doi.org/10.5194/amt-7-2581-2014, 2014.
Müller, S., Hoor, P., Bozem, H., Gute, E., Vogel, B., Zahn, A., Bönisch, H., Keber, T., Krämer, M., Rolf, C., Riese, M., Schlager, H., and Engel, A.: Impact of the Asian monsoon on the extratropical lower stratosphere: trace gas observations during TACTS over Europe 2012, Atmos. Chem. Phys., 16, 10573–10589, https://doi.org/10.5194/acp-16-10573-2016, 2016.
NASA: NASA GES DISK Aura MLS level 2 data, available at: https://acdisc.gesdisc.eosdis.nasa.gov/data/Aura_MLS_Level2/, last access: 24 February 2021a.
NASA: NASA GES DISK SNPP OMPS data, available at: https://snpp-omps.gesdisc.eosdis.nasa.gov/data, last access: 24 February 2021b.
NASA: Atmospheric Science Data Center, available at: https://asdc.larc.nasa.gov/search, last access: 24 February 2021c.
Ninomiya, K. and Shibagaki, Y.: Multi-scale features of the Meiyu-Baiu front and associated precipitation systems, J. Meteorol. Soc. Jpn., 85, 103–122, https://doi.org/10.2151/jmsj.85B.103, 2007.
Noel, V., Chepfer, H., Hoareau, C., Reverdy, M., and Cesana, G.: Effects of solar activity on noise in CALIOP profiles above the South Atlantic Anomaly, Atmos. Meas. Tech., 7, 1597–1603, https://doi.org/10.5194/amt-7-1597-2014, 2014.
Pan, L. L., Honomichl, S. B., Kinnison, D. E., Abalos, M., Randel, W. J., Bergman, J. W., and Bian, J.: Transport of chemical tracers from the boundary layer to stratosphere associated with the dynamics of the Asian summer monsoon, J. Geophys. Res.-Atmos., 121, 14159–14174, https://doi.org/10.1002/2016JD025616, 2016.
Pan, L. L., Kinnison, D., Liang, Q., Atlas, E., Bresch, J., Case, P., Fujiwara, M., Honomichl, S., Lait, L., Newman, P., Nishi, N., Randel, B., Smith, R., Tilmes, S., and Toon, B.: Progress in the Asian summer monsoon Chemical and Climate Impact Project (ACCLIP), AGU Fall Meeting 2019, 13 December 2019, San Francisco, CA, USA, A51K-2788, 2019.
Peterson, D. A., Campbell, J. R., Hyer, E. J., Fromm, M. D., Kablick III, G. P., Cossuth, J. H., and DeLand, M. T.: Wildfire-driven thunderstorms cause a volcano-like stratospheric injection of smoke, npj Clim. Atmos. Sci., 1, 30, https://doi.org/10.1038/s41612-018-0039-3, 2018.
Ploeger, F., Gottschling, C., Griessbach, S., Grooß, J.-U., Guenther, G., Konopka, P., Müller, R., Riese, M., Stroh, F., Tao, M., Ungermann, J., Vogel, B., and von Hobe, M.: A potential vorticity-based determination of the transport barrier in the Asian summer monsoon anticyclone, Atmos. Chem. Phys., 15, 13145–13159, https://doi.org/10.5194/acp-15-13145-2015, 2015.
Popovic, J. M. and Plumb, R. A.: Eddy shedding from the upper-tropospheric Asian monsoon anticyclone, J. Atmos. Sci., 58, 93–104, https://doi.org/10.1175/1520-0469(2001)058<0093:ESFTUT>2.0.CO;2, 2001.
Prata, A. T., Young, S. A., Siems, S. T., and Manton, M. J.: Lidar ratios of stratospheric volcanic ash and sulfate aerosols retrieved from CALIOP measurements, Atmos. Chem. Phys., 17, 8599–8618, https://doi.org/10.5194/acp-17-8599-2017, 2017.
Pruppacher, H. R. and Klett, J. D.: Microphysics and Clouds and Precipitation, Second Revised and Enlarged Edition, Kluwer Academic Publications, Dordrecht, The Netherlands, 1997.
Randel, W. J., Park, M., Emmons, L., Kinnison, D., Bernath, P., Walker, K. A., Boone, C., and Pumphrey, H.: Asian monsoon transport of pollution to the stratosphere, Science, 328, 611–613, https://doi.org/10.1126/science.1182274, 2010.
Randel, W. J., Zhang, K., and Fu, R.: What controls stratospheric water vapor in the NH summer monsoon regions?, J. Geophys. Res.-Atmos., 120, 7988–8001, https://doi.org/10.1002/2015JD023622, 2015.
Robock, A.: Volcanic eruptions and climate, Rev. Geophys., 38, 191–219, https://doi.org/10.1029/1998RG000054, 2000.
Rolf, C., Vogel, B., Hoor, P., Afchine, A., Günther, G., Krämer, M., Müller, R., Müller, S., Spelten, N., and Riese, M.: Water vapor increase in the lower stratosphere of the Northern Hemisphere due to the Asian monsoon anticyclone observed during the TACTS/ESMVal campaigns, Atmos. Chem. Phys., 18, 2973–2983, https://doi.org/10.5194/acp-18-2973-2018, 2018.
Russell, P. B., Swissler, T. J., and McCormick, M. P.: Methodology for error analysis and simulation of lidar aerosol measurements, Appl. Optics, 18, 3783, https://doi.org/10.1364/ao.18.003783, 1979.
Russell, P. B., Morley, B. M., Livingston, J. M., Grams, G. W., and Patterson, E. M.: Orbiting lidar simulations 1: Aerosol and cloud measurements by an independent-wavelength technique, Appl. Optics, 21, 1541, https://doi.org/10.1364/ao.21.001541, 1982.
Sakai, T., Nagai, T., Nakazato, M., Mano, Y., and Matsumura, T.: Ice clouds and Asian dust studied with lidar measurements of particle extinction-to-backscatter ratio, particle depolarization, and water-vapor mixing ratio over Tsukuba, Appl. Optics, 42, 7103–7116, https://doi.org/10.1364/AO.42.007103, 2003.
Sakai, T., Nagai, T., Zaizen, Y., and Mano, Y.: Backscattering linear depolarization ratio measurements of mineral, sea-salt, and ammonium sulfate particles simulated in a laboratory chamber, Appl. Optics, 49, 4441–4449, https://doi.org/10.1364/AO.49.004441, 2010.
Sakai, T., Uchino, O., Nagai, T., Liley, B., Morino, I., and Fujimoto, T.: Long-term variation of stratospheric aerosols observed with lidars over Tsukuba, Japan, from 1982 and Lauder, New Zealand, from 1992 to 2015, J. Geophys. Res.-Atmos., 121, 10283–10293, https://doi.org/10.1002/2016JD025132, 2016.
Sakai, T.: Aerosol lidar data at Tsukuba, available at: https://mri-2.mri-jma.go.jp/owncloud/s/GrNGNiGKzq8tjqH, last access: 24 February 2021.
Salby, M. L.: Fundamentals of Atmospheric Physics, Elsevier, San Diego, USA, 1996.
Santee, M. L., Manney, G. L., Livesey, N. J., Schwartz, M. J., Neu, J. L., and Read, W. G.: A comprehensive overview of the climatological composition of the Asian summer monsoon anticyclone based on 10 years of Aura Microwave Limb Sounder measurements, J. Geophys. Res.-Atmos., 122, 5491–5514, https://doi.org/10.1002/2016JD026408, 2017.
Shiraishi, K.: Lidar data obtained at Fukuoka University (33.55N, 130.36E, 35mASL) from July to September, 2018, available at: https://www.cis.fukuoka-u.ac.jp/~ksiraisi/LidarDataArchive/Fukuoka_2018summer.zip, last access: 24 February 2021.
Shimpo, A., Takemura, K., Wakamatsu, S., Togawa, H., Mochizuki, Y., Takekawa, M., Tanaka, S., Yamashita, K., Maeda, S., Kurora, R., Murai, H., Kitabatake, N., Tsuguti, H., Mukougawa, H., Iwasaki, T., Kawamura, R., Kimoto, M., Takayabu, I., Takayabu, Y. N., Tanimoto, Y., Hirooka, T., Masumoto, Y., Watanabe, M., Tsuboki, K., and Nakamura, H.: Primary Factors behind the Heavy Rain Event of July 2018 and the subsequent heat wave in Japan, SOLA, 15, 13–18, https://doi.org/10.2151/sola.15A-003, 2019.
Tegtmeier, S., Anstey, J., Davis, S., Dragani, R., Harada, Y., Ivanciu, I., Pilch Kedzierski, R., Krüger, K., Legras, B., Long, C., Wang, J. S., Wargan, K., and Wright, J. S.: Temperature and tropopause characteristics from reanalyses data in the tropical tropopause layer, Atmos. Chem. Phys., 20, 753–770, https://doi.org/10.5194/acp-20-753-2020, 2020.
Thomason, L. W., Pitts, M. C., and Winker, D. M.: CALIPSO observations of stratospheric aerosols: a preliminary assessment, Atmos. Chem. Phys., 7, 5283–5290, https://doi.org/10.5194/acp-7-5283-2007, 2007.
Uchino, O., Nagai, T., Fujimoto, T., Fujiwara, M., Akiyoshi, H., Yasumatsu, S., Hayashida, S., Sasano, Y., Nakane, H., Iwasaka, Y., Hase, M., Shibata, T., Itabe, T., Asai, K., Nomura, A., Saito, Y., Kano, T., Sai, Y., Tamaki, K., Nomura, R., Sunagawa, T., Nagasawa, C., Abo, M., Idesako, Y., and Kai, K.: Observation of the Pinatubo volcanic cloud by lidar network in Japan, J. Meteorol. Soc. Jpn., 71, 285–296, https://doi.org/10.2151/jmsj1965.71.2_285, 1993.
Ungermann, J., Ern, M., Kaufmann, M., Müller, R., Spang, R., Ploeger, F., Vogel, B., and Riese, M.: Observations of PAN and its confinement in the Asian summer monsoon anticyclone in high spatial resolution, Atmos. Chem. Phys., 16, 8389–8403, https://doi.org/10.5194/acp-16-8389-2016, 2016.
Vernier, J.-P., Thomason, L. W., and Kar, J.: CALIPSO detection of an Asian tropopause aerosol layer, Geophys. Res. Lett., 38, L07804, https://doi.org/10.1029/2010gl046614, 2011.
Vernier, J.-P., Fairlie, T. D., Natarajan, M., Wienhold, F. G., Bian, J., Martinsson, B. G., Crumeyrolle, S., Thomason, L. W., and Bedka, K. M.: Increase in upper tropospheric and lower stratospheric aerosol levels and its potential connection with Asian pollution, J. Geophys. Res.-Atmos., 120, 1608–1619, https://doi.org/10.1002/2014JD022372, 2015.
Vernier, J.-P., Fairlie, T. D., Deshler, T., Venkat Ratnam, M., Gadhavi, H., Kumar, B. S., Natarajan, M., Pandit, A. K., Akhil Raj, S. T., Hemanth Kumar, A., Jayaraman, A., Singh, A. K., Rastogi, N., Sinha, P. R., Kumar, S., Tiwari, S., Wegner, T., Baker, N., Vignelles, D., Stenchikov, G., Shevchenko, I., Smith, J., Bedka, K., Kesarkar, A., Singh, V., Bhate, J., Ravikiran, V., Durga Rao, M., Ravindrababu, S., Patel, A., Vernier, H., Wienhold, F. G., Liu, H., Knepp, T. N., Thomason, L., Crawford, J., Ziemba, L., Moore, J., Crumeyrolle, S., Williamson, M., Berthet, G., Jégou, F., and Renard, J.-B.: BATAL: The Balloon measurement campaigns of the Asian Tropopause Aerosol Layer, B. Am. Meteorol. Soc., 99, 955–973, 2018.
Vogel, B., Günther, G., Müller, R., Grooß, J.-U., Hoor, P., Krämer, M., Müller, S., Zahn, A., and Riese, M.: Fast transport from Southeast Asia boundary layer sources to northern Europe: rapid uplift in typhoons and eastward eddy shedding of the Asian monsoon anticyclone, Atmos. Chem. Phys., 14, 12745–12762, https://doi.org/10.5194/acp-14-12745-2014, 2014.
Vogel, B., Günther, G., Müller, R., Grooß, J.-U., Afchine, A., Bozem, H., Hoor, P., Krämer, M., Müller, S., Riese, M., Rolf, C., Spelten, N., Stiller, G. P., Ungermann, J., and Zahn, A.: Long-range transport pathways of tropospheric source gases originating in Asia into the northern lower stratosphere during the Asian monsoon season 2012, Atmos. Chem. Phys., 16, 15301–15325, https://doi.org/10.5194/acp-16-15301-2016, 2016.
Vömel, H., Barnes, J. E., Forno, R. N., Fujiwara, M., Hasebe, F., Iwasaki, S., Kivi, R., Komala, N., Kyrö, E., Leblanc, T., Morel, B., Ogino, S.-Y., Read, W. G., Ryan, S. C., Saraspriya, S., Selkirk, H., Shiotani, M., Valverde Canossa, J., and Whiteman, D. N.: Validation of Aura MLS water vapor by balloonborne Cryogenic Frostpoint Hygrometer measurements, J. Geophys. Res., 112, D24S37, https://doi.org/10.1029/2007JD008698, 2007.
Wagner, R., Bertozzi, B., Höpfner, M., Höhler, K., Möhler, O., Saathoff, H., and Leisner, T.: Solid ammonium nitrate aerosols as efficient ice nucleating particles at cirrus temperatures, J. Geophys. Res.-Atmos., 125, e2019JD032248, https://doi.org/10.1029/2019JD032248, 2020a.
Wagner, R., Testa, B., Höpfner, M., Kiselev, A., Möhler, O., Saathoff, H., Ungermann, J., and Leisner, T.: High-resolution optical constants of crystalline ammonium nitrate for infrared remote sensing of the Asian Tropopause Aerosol Layer, Atmos. Meas. Tech. Discuss. [preprint], https://doi.org/10.5194/amt-2020-262, in review, 2020b.
Winker, D. M., Hunt, W. H., and McGill, M. J.: Initial performance assessment of CALIOP, Geophys. Res. Lett., 34, L19803, https://doi.org/10.1029/2007GL030135, 2007.
Winker, D. M., Pelon, J., Coakley Jr., J. A., Ackerman, S. A., Charlson, R. J., Colarco, P. R., Flamant, P., Fu, Q., Hoff, R. M., Kittaka, C., Kubar, T. L., Le Treut, H., Mccormick, M. P., Mégie, G., Poole, L., Powell, K., Trepte, C., Vaughan, M. A., and Wielicki, B. A.: The CALIPSO mission: A global 3D view of aerosols and clouds, B. Am. Meteorol. Soc., 91, 1211–1230, https://doi.org/10.1175/2010BAMS3009.1, 2010.
Yasui, M., Fujiwara, M., Akiyoshi, H., Ikawa, S., Nonaka, H., and Shiraishi, K.: Seasonal variation of Pinatubo volcanic aerosols in the stratosphere observed by lidar in Fukuoka, J. Geomag. Geoelectr., 47, 989-998, https://doi.org/10.5636/jgg.47.989, 1995.
Yasui, M., Fujiwara, M., Shibata, T., Akiyoshi, H., Ikawa, S., Shiraishi, K., Nonaka, H.: Variations of volcanic aerosols observed in Fukuoka – A comparison of Mt El Chichon and Mt Pinatubo events, J. Geomag. Geoelectr., 48, 403-413, https://doi.org/10.5636/jgg.48.403, 1996.
Young, S. A. and Vaughan, M. A.: The retrieval of profiles of particulate extinction from Cloud-Aerosol Lidar Infrared Pathfinder Satellite Observations (CALIPSO) data: Algorithm description, J. Atmos. Ocean. Technol., 26, 1105–1119, https://doi.org/10.1175/2008jtecha1221.1, 2009.
Yu, P., Rosenlof, K. H., Liu, S., Telg, H., Thornberry, T. D., Rollins, A. W., Portmann, R. W., Bai, Z., Ray, E. A., Duan, Y., Pan, L. L., Toon, O. B., Bian, J., and Gao, R.-S.: Efficient transport of tropospheric aerosol into the stratosphere via the Asian summer monsoon anticyclone, P. Natl. Acad. Sci. USA, 114, 6972–6977, https://doi.org/10.1073/pnas.1701170114, 2017.