Article

Impacts of Forest Fire on Understory Species Diversity in Canary Pine Ecosystems on the Island of La Palma

1
Department of Biogeography, University of Bayreuth, Universitätsstraße 30, 95447 Bayreuth, Germany
2
Department of Agroecology, University of Bayreuth, Universitätsstraße 30, 95447 Bayreuth, Germany
3
Climate Policy, adelphi, Alt-Moabit 91, 10559 Berlin, Germany
4
School of Geography, University of Nottingham, Nottingham NG7 2RD, UK
5
Biogeography and Biodiversity Lab, Institute of Physical Geography, Goethe-University Frankfurt, Altenhöferallee 1, 60438 Frankfurt am Main, Germany
6
Department of Geography, University of Bergen, 5020 Bergen, Norway
7
BIOME Lab, Department of Biological, Geological and Environmental Sciences, Alma Mater Studiorum, University of Bologna, 40126 Bologna, Italy
8
Departamento de Botánica, Ecología y Fisiología Vegetal, Universidad de La Laguna, 38200 San Cristóbal de La Laguna, S/C de Tenerife, Spain
9
Disturbance Ecology, Universitätsstraße 30, 95447 Bayreuth, Germany
10
Institute of Geosciences and Earth Resources, National Research Council of Italy (CNR), Via G. Moruzzi 1, 56124 Pisa, Italy
11
Bayreuth Center of Ecology and Environmental Science BayCEER, Dr. Hans-Frisch-Straße 1-3, 95448 Bayreuth, Germany
12
Geographical Institute Bayreuth GIB, Universitätsstraße 30, 95447 Bayreuth, Germany
*
Author to whom correspondence should be addressed.
Forests 2021, 12(12), 1638; https://doi.org/10.3390/f12121638
Submission received: 28 October 2021 / Revised: 15 November 2021 / Accepted: 20 November 2021 / Published: 25 November 2021
(This article belongs to the Section Forest Biodiversity)

Abstract

:
Forest fires are drivers of spatial patterns and temporal dynamics of vegetation and biodiversity. On the Canary Islands, large areas of pine forest exist, dominated by the endemic Canary Island pine, Pinus canariensis C. Sm. These mostly natural forests experience wildfires frequently. P. canariensis is well-adapted to such impacts and has the ability to re-sprout from both stems and branches. In recent decades, however, anthropogenically caused fires have increased, and climate change further enhances the likelihood of large forest fires. Through its dense, long needles, P. canariensis promotes cloud precipitation, which is an important ecosystem service for the freshwater supply of islands such as La Palma. Thus, it is important to understand the regeneration and vegetation dynamics of these ecosystems after fire. Here, we investigated species diversity patterns in the understory vegetation of P. canariensis forests after the large 2016 fire on the southern slopes of La Palma. We analyzed the effect of fire intensity, derived from Sentinel-2 NDVI differences, and of environmental variables, on species richness (alpha diversity) and compositional dissimilarity (beta diversity). We used redundancy analysis (dbRDA), Bray–Curtis dissimilarity, and variance partitioning for this analysis. Fire intensity accounted for a relatively small proportion of variation in alpha and beta diversity, while elevation was the most important predictor. Our results also reveal the important role of the endemic Lotus campylocladus ssp. hillebrandii (Christ) Sandral & D.D.Sokoloff for understory diversity after fire. Its dominance likely reduces the ability of other species to establish by taking up nutrients and water and by shading the ground. The mid- to long-term effects are unclear since Lotus is an important nitrogen fixer in P. canariensis forests and can reduce post-fire soil erosion on steep slopes.

1. Introduction

Fires influence the environment on several levels. On a global scale, they influence the carbon cycle and the climate [1] and shift the distribution of several biomes [2,3,4]. On a landscape level, they lead to a mosaic of unburned and burned patches [5,6], with different levels of recovery ability and resilience to fire [7]. On a local level, the burn severity has a long-lasting influence on understory recovery due to soil heating effects [8], soil properties and organisms [9], and nutrient availability [10]. Forests are often well adapted to fire and are able to recover from fire through different mechanisms, e.g., seedling establishment [11,12,13,14], resprouting [15], or a mix of several fire adaptations [16]. On oceanic islands with pronounced topography due to volcanic activity, wildfires that are caused by lightning storms or volcanic eruptions are frequent events in terms of evolutionary time scales. Particularly, in forests that accumulate biomass in layers of litter (fuel) and naturally undergo dry periods, ignitions can translate into wildfires. Considering the spatial and ecological isolation of oceanic islands, adaptations to these impacts are to be expected, and non-adapted species establishing in such systems may be regularly eradicated. Although seemingly paradoxical from a human perspective, the casual occurrence of wildfires is known to preserve the functioning and diversity of fire-adapted ecosystems in the long term [17,18].
Fires have important long-term effects beyond the selection of specific plant functional traits. Nutrient cycles are controlled by fires through the mineralization of elements stored in the litter and biomass, often resulting in the mid-term increase of biomass in the understory compared to the pre-fire period [19]. Consequently, fire-prone forest ecosystems can be seen as complex and adaptive systems [20], wherein biotic and abiotic processes interact, and where ecosystem dynamics vary across different spatial and temporal scales. In the natural pine forests of the Canary Islands, fires have always affected the structure and dynamics of the vegetation, with fire affecting the same area rarely more than once per 20 years [21].
Today, anthropogenic causes of wildfires, whether deliberate or accidental, add to the natural drivers; only a small proportion of the fires on the Canary Islands is now attributed to ignition by natural causes [19,22]. Fire frequency may have been even higher in the last few centuries, when agriculture was the main economic activity. Around the 1960s, fire events changed from more frequent, small-scale fires towards less frequent larger-extent fires [23]. The ambition to suppress fires and avoid economic damage can promote even more severe fires [24,25]. In 2009, a large fire burned about 2000 hectares in the southern part of La Palma. Following a smaller fire in 2012, a large human-induced fire affected 4800 hectares (about 7% of the island’s area) in 2016. This last big fire is the subject of this study.
High fire frequency and short time intervals between fires may decrease fire intensity due to the shorter time available for biomass and fuel accumulation. On the downside, lack of vegetation cover due to repeated fires may increase soil erosion on steep slopes [26], reduce water holding and cation exchange capacities, and promote the leaching of nutrients [10,27,28]. The availability of nitrogen peaks shortly after the fire, then decreases [29]. Both nitrogen concentration and mineralization have been shown to decrease for more than 17 years after a fire in forest soils compared to unburned sites [30,31]. Phosphorus levels in the soil initially decrease but recover over time [29]. Due to their strong impact on the pine ecosystems of La Palma, wildfires can homogenize spatial variability of soil parameters and, consequently, also homogenize vegetation patterns [32].
In most ecosystems, the severity and size of fires depend on both the availability of fuel and its state (humidity). In Mediterranean areas, the fuel state, as measured by indices such as SPI or SPEI, controls the burned area [33]. As climate changes, an additional increase in the fire frequency and intensity is expected, especially during periods of drought, but also in consequence of increased biomass accumulation after humid periods [33,34,35,36,37]. The combination of climate warming and drought might even exceed the capacity of forest ecosystems to regenerate after a fire event. The Canary Islands, in their matrix of a subtropical ocean, are expected to experience decreasing amounts of precipitation in the face of climate change [38], possibly leading to an increased fire risk.
The Canary pine forest ecosystem differs from many other fire-prone forest types. P. canariensis is well adapted to frequent and intense wildfires [22]. It has thick, protective bark, serotinous cones and readily re-sprouts from all above-ground organs and roots after fire. Fallen needles accumulate on branches to form thick cushions and on the forest floor to form thick layers, promoting the likelihood of fire outbreaks [19]. P. canariensis indirectly benefits from forest fires, as these can eliminate many encroaching shrubs in the understory, while P. canariensis likely survives the fire. Otto et al. [11] found that high-intensity fires also halt the seedling establishment of P. canariensis shortly after the fire, probably due to a mix of seed bank destruction and unfavorable soil conditions. However, this does not stop the long-term recovery of P. canariensis forests. Even severely damaged trees can survive and re-sprout almost immediately. Additionally, seed dispersal from less affected areas supports recovery after a short-term decline in nutrient availability [12]. The species is also well adapted to the overall decrease in precipitation expected for the Canary Islands in the coming decades [39,40,41].
Island ecosystems are often relatively species-poor due to effective filters for dispersal and immigration [42]. This applies to the Canary Islands, despite their high levels of endemism [43]. The pine forest is characterized by monodominant stands of P. canariensis, whose global distribution is limited to the archipelago. P. canariensis forests play a key role in maintaining the water balance of several of the Canary Islands. In the canopies of these pine trees, the moisture from clouds condenses on their long pine needles, significantly increasing the total precipitation inside the forest on the windward eastern slopes [22]. Due to the constant trade winds being blocked by the island’s topography, this cloud contact is very frequent.
These forests tend to have low herbaceous species richness, at least in forbs and perennial herbs in the understory. As a general phenomenon, crown fires are known to diversify the patch mosaic of forests in response to site conditions of the terrain [6]. Fire has been found to promote local species richness in burned areas on La Palma [44], while possibly working as a filter for species invasion. The post-fire species assemblage largely reflects the local pre-fire species pool [45]. Some perennial native species are well adapted to fire [46]. Annuals, whose seeds survive fire impact in low intensity crown fires, often emerge after fire.
Vegetation responses after fire depend on fire severity. While severe fires in Canary Island pine forests may result in a complete loss of understory regeneration due to a destroyed seedbank, intermediate fire intensity typically leads to re-emerging plant communities and can even favor pine regeneration [11]. Overall, fires in pine forests may therefore lead to a complex mosaic of species diversity in the understory, depending on fire intensity. However, our understanding of fire-induced ecosystem dynamics, and related nutrient cycles, is limited for these forests.
One species obviously benefiting from fire is Lotus campylocladus Webb & Berthel. Its subspecies hillebrandii (Christ) Sandral & D.D.Sokoloff. is endemic to La Palma, and the species is endemic to the Canaries, with Lotus campylocladus in Tenerife and Lotus spartioides Webb & Berthel. in Gran Canaria performing a similar ecological role in the pine forests of those islands. Its seeds can remain dormant for years in layers of non-absorptive pine litter until these are removed through fire, and a topsoil with mineralized nutrients emerges. Then, the rapid growth and flowering of L. campylocladus ssp. hillebrandii can be triggered by precipitation and increased light availability. Due to its rhizobia’s nitrogen fixing capacity, this dynamic is likely to contribute positively to the nutrient cycling of Canarian pine ecosystems, as fires can also cause losses of soil nitrogen [30]. Thus, after fires, herbaceous species (with readily decomposable biomass) typically emerge for short periods, often at high abundance; the interaction of fire with P. canariensis and L. campylocladus ssp. hillebrandii may be a major factor controlling biodiversity patterns in these forests.
Here, we combine remote sensing with field research to investigate the effects of the large 2016 fire on plant species richness (alpha diversity) and compositional dissimilarity (beta diversity) of pine forest understory on La Palma. A better understanding of the spatio-temporal processes associated with wildfires in Canarian pine ecosystems is important for managing biodiversity, ecosystem functioning, and the important services provided by these forests.
This study is based on the following hypotheses and expectations that are derived from the strong link between fire intensity and understory species diversity outlined above, given that our field sampling was done 1.5 years after the fire event:
(A)
We hypothesized that the highest levels of species alpha and beta diversity would be at intermediate fire intensity;
(B)
Lowest abundance of L. campylocladus ssp. hillebrandii is expected at intermediate fire intensities because of the persisting dominance of P. canariensis at low fire intensities and the damage to the seedbank, unfavorable soil conditions, and erosion at high intensities;
(C)
As this legume (Lotus) contributes to N-fixing and nutrient availability, we expect an interaction between fire intensity and legume biomass in the effect on biodiversity patterns.

2. Materials and Methods
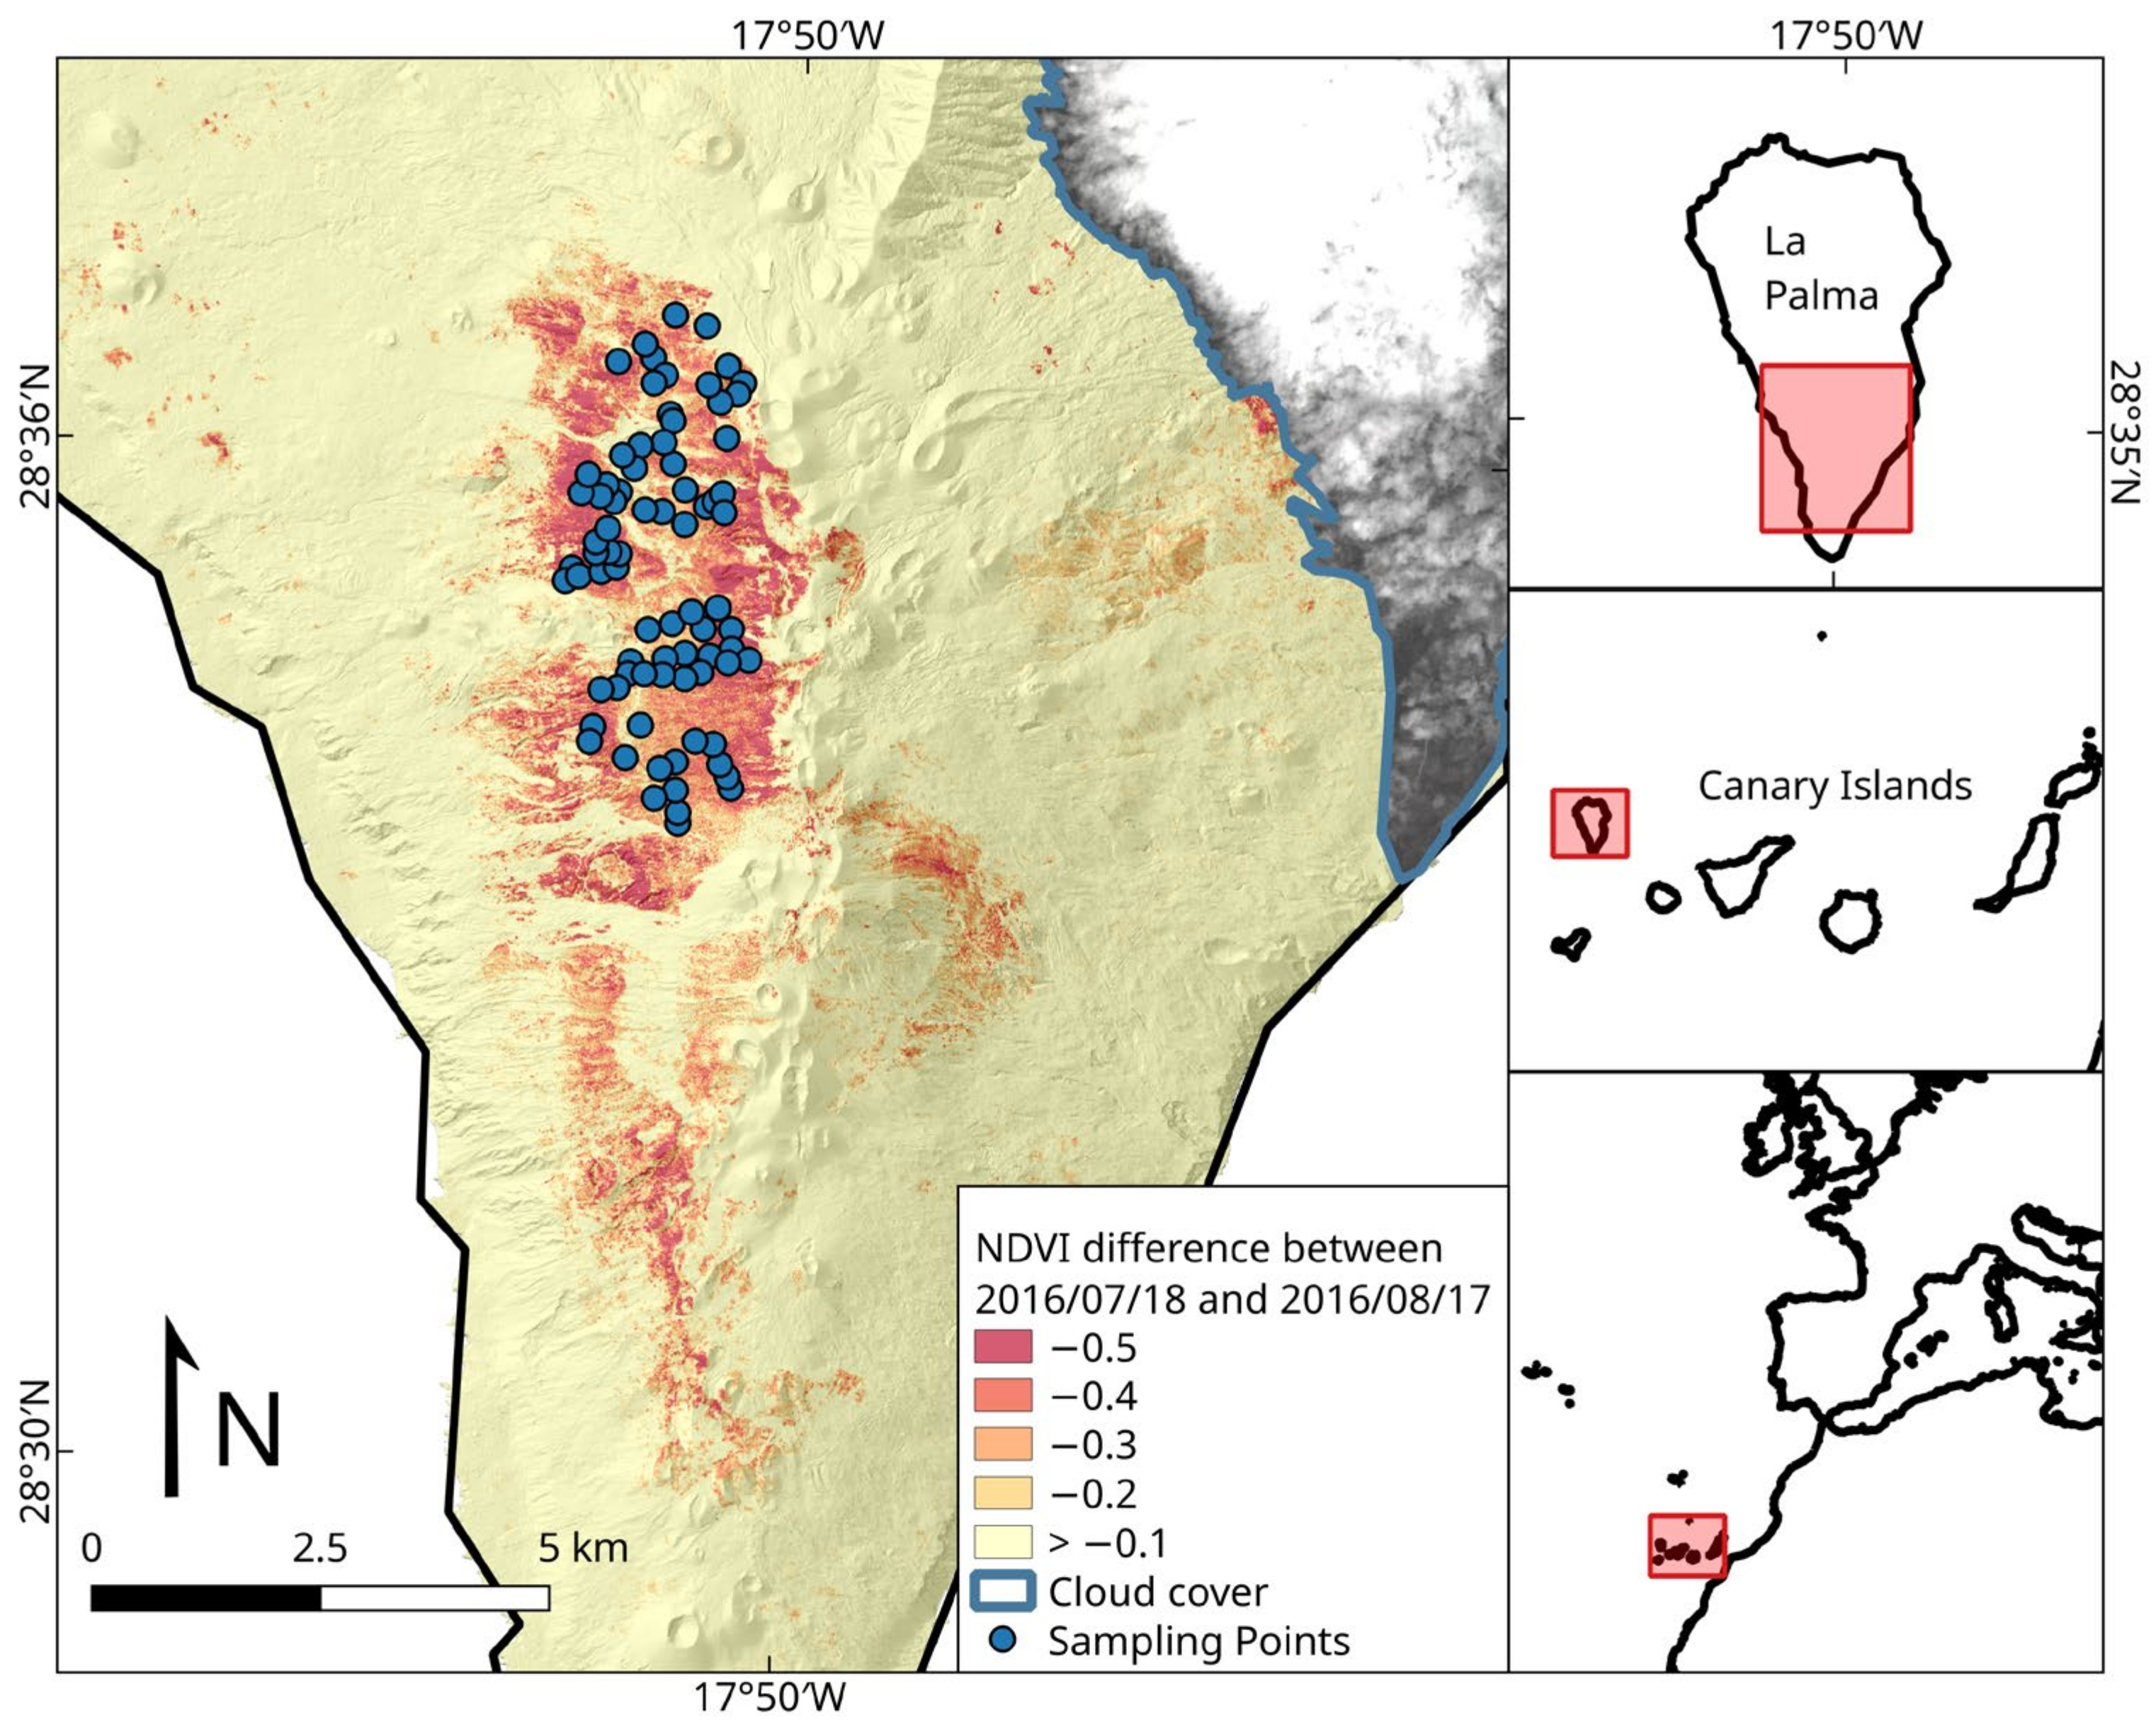
2.1. Study Area

The Canary Islands are situated offshore of the northwestern African coast in the Atlantic Ocean and are entirely of volcanic origin. La Palma is at the extreme northwest of the archipelago. It is the second-youngest island with an area of 706 km2 [47] and a maximum elevation of 2426 m a.s.l.—the second-highest island. The climate of the island is characterized by dry summers and high solar radiation in the areas not influenced by the trade-wind clouds [48]. Trade winds from the northeast dominate the precipitation pattern, resulting in large differences in precipitation within islands. This also affects the occurrence of P. canariensis, which can be found across most of the elevational range of the island, excluding the coastal area [49]. Due to its ability to filter water from moist air, it can survive in areas with as little as 250 mm of rainfall per year, and up to subtropical cloud forests receiving more than 600 mm of rainfall annually [22], with more than 1000 mm at the upper northeastern slopes of the island [48].
Our study area is located on the western slope of the Cumbre Vieja, the youngest part of La Palma (Figure 1), and still volcanically active. Indeed, part of the area has since been subject to the 2021 volcanic eruptions, which started on 19th September after more than 22,000 earthquakes within a week. The investigated region is dissected by a nonpublic dirt road running from north to south, used by the forestry management authorities.

2.2. Remote Sensing

The Sentinel-2 constellation is extremely useful for fire mapping, with a spatial resolution of approx. 10 m and a revisit time of 5 days [50,51]. These sensors have already been used to efficiently map burn severity based on vegetation indices [52,53,54]. Chen et al. [55] showed high agreement between the normalized difference vegetation index (NDVI) calculated for Landsat scenes and burn severity sampled on the ground. MODIS fire products are also widely used to map fire occurrences, as they offer the advantage of two decades of times series [56,57,58]. However, they suffer from low spatial resolution (250 m to 1 km).
To assess the fire intensity of the August 2016 fire, two Sentinel-2 scenes before (18 July 2016) and after (17 August 2016) the fire were selected. Due to the resilience of P. canariensis to fire damage, tree mortality observed in the field was very low. Therefore, we opted to use remotely sensed fire intensity as a statistically more robust measure. Both scenes were preprocessed to Level-2 analysis-ready data (ARD) using FORCE version 3.5.2 [59]. A monthly composite Landsat 8 near infra-red (NIR) base image was created using images from 2015 to 2020 and used for co-registering the Sentinel-2 scenes to correct for shifts between images and better align pixels. A LiDAR-based digital elevation model from the Cabildo Insular de La Palma with 2 m spatial resolution was used for topographic correction.
The NDVI was calculated for both scenes using the following Equation (1):
NDVI = NIR red NIR + red = Band   8 Band   4 Band   8 + Band   4  
A NDVI difference map (from now denoted “ΔNDVI”) was created by subtracting the NDVI before the fire from the NDVI after the fire. Changes due to the presence of clouds were cropped with a cloud mask. We used the ΔNDVI as a proxy (an inverse one) for fire intensity (Figure 1). For each sampling point, ΔNDVI was extracted using the package “rgdal” 1.5–23 [60] and “raster” version 3.4–5 [61], in R version 3.6.3 [62]. While both Sentinel-2 images were well aligned after co-registration, possible GPS inaccuracies could cause shifts between field measurements and remotely sensed data. Therefore, the mean ΔNDVI was extracted for three buffers with 30, 50 and 100 m radius. Buffers can reveal different landscape patterns, depending on size [63]. The 30 m and 100 m buffer correlated strongly with the NDVI difference value extracted directly at the nearest pixel of the sampling site. The 50 m buffer values only had a Pearson correlation coefficient of 0.65 with the pixel values. Due to the overall good accuracy of the used GPS device of roughly 3 m, it was decided to use the 30 m buffer.
Other spectral indices were also evaluated. The Burned area index (BAI) [64], was overly sensitive to the dark volcanic soils of La Palma and severely overestimated burned area. The Normalized burn ratio (NBR) and its difference, ΔNBR [65], performed reasonably well but decreased the spatial resolution of the output to 20 m due to the use of band 12. ΔNBR had a Pearson correlation of 0.84 with ΔNDVI. Therefore, ΔNDVI was preferred due to its finer spatial resolution.
The Copernicus Tree cover density product for the year 2015 [66] was included as an explanatory variable for canopy cover before the fire. To avoid confusion with the field-measured canopy cover, we refer to the remotely sensed product from before the fire as “Tree cover (RS)” and to the field-measured canopy cover as “Tree cover (field)”.
The Topographic complexity index (TCI) [67] and the Terrain ruggedness index (TRI) [68] were calculated from a 2 m × 2 m resolution DEM provided by the Cabildo Insular de La Palma and was included as measures for local heterogeneity of the topography. The Topographic complexity index represents the ratio between the 3D and 2D surface area (Equation (2))
TCI = 100 × 100 m Area 2 m × 2 m cos Slope 2 m × 2 m Area 100 m × 100 m
Area 2 m × 2 m and Slope 2 m × 2 m were calculated per grid cell for a 2 m × 2 m digital elevation model (DEM). Area 100 m × 100 m represents a grid cell from a 100 m × 100 m DEM and contains all 2500 2 m × 2 m grid cells.
The Terrain ruggedness index quantifies the heterogeneity of terrain with the following Equation (3):
TRI = ( Elevation ij Elevation 00 ) 2
where Elevation 00 is the center cell the TRI is calculated for and Elevation ij represents the elevation of the eight neighboring cells.

2.3. Field Sampling and Other Explanatory Variables

Plots were positioned in the burned area of the Canary pine forest on the western slope of Cumbre Vieja. Sampling was done between elevations of 1028 and 1682 m a.s.l. The sampling was focused on the northern part of the burned area (see Figure 1), which was the largest continuous area affected by fire.
Although very steep, inaccessible terrain with barrancos (ravines), and many small-scale forest gaps ruled out a fully random distribution of sampling sites; care was taken to sample evenly over the whole gradient of ΔNDVI. Sampling was conducted in March 2018, in a total of 79 plots. Plot size was 10 m × 10 m because this size matches the spatial resolution of Sentinel-2 and is a standard size applied in forest understory vegetation studies.
All vascular plant species within these plots were recorded, including their estimated cover. Cover values were recorded in percent, with values of 0.0001%, 0.001%, 0.01%, 0.1%, 0.5%, 1%, 2%, 3%, and 5% corresponding to 1 cm2, 10 cm2, 100 cm2, and so on. Values above 5% were estimated and rounded to the nearest 5%. In total, 80 plant species were recorded, with species names following the FloCan checklist [43] (see Figure S1 from Supplementary Materials for an overview of recorded species numbers per site). Additional variables (see Table 1) were recorded for later analysis. Positioning was done with a Garmin Montana 650 GPS device with an accuracy of 3 m.

2.4. Statistical Analyses
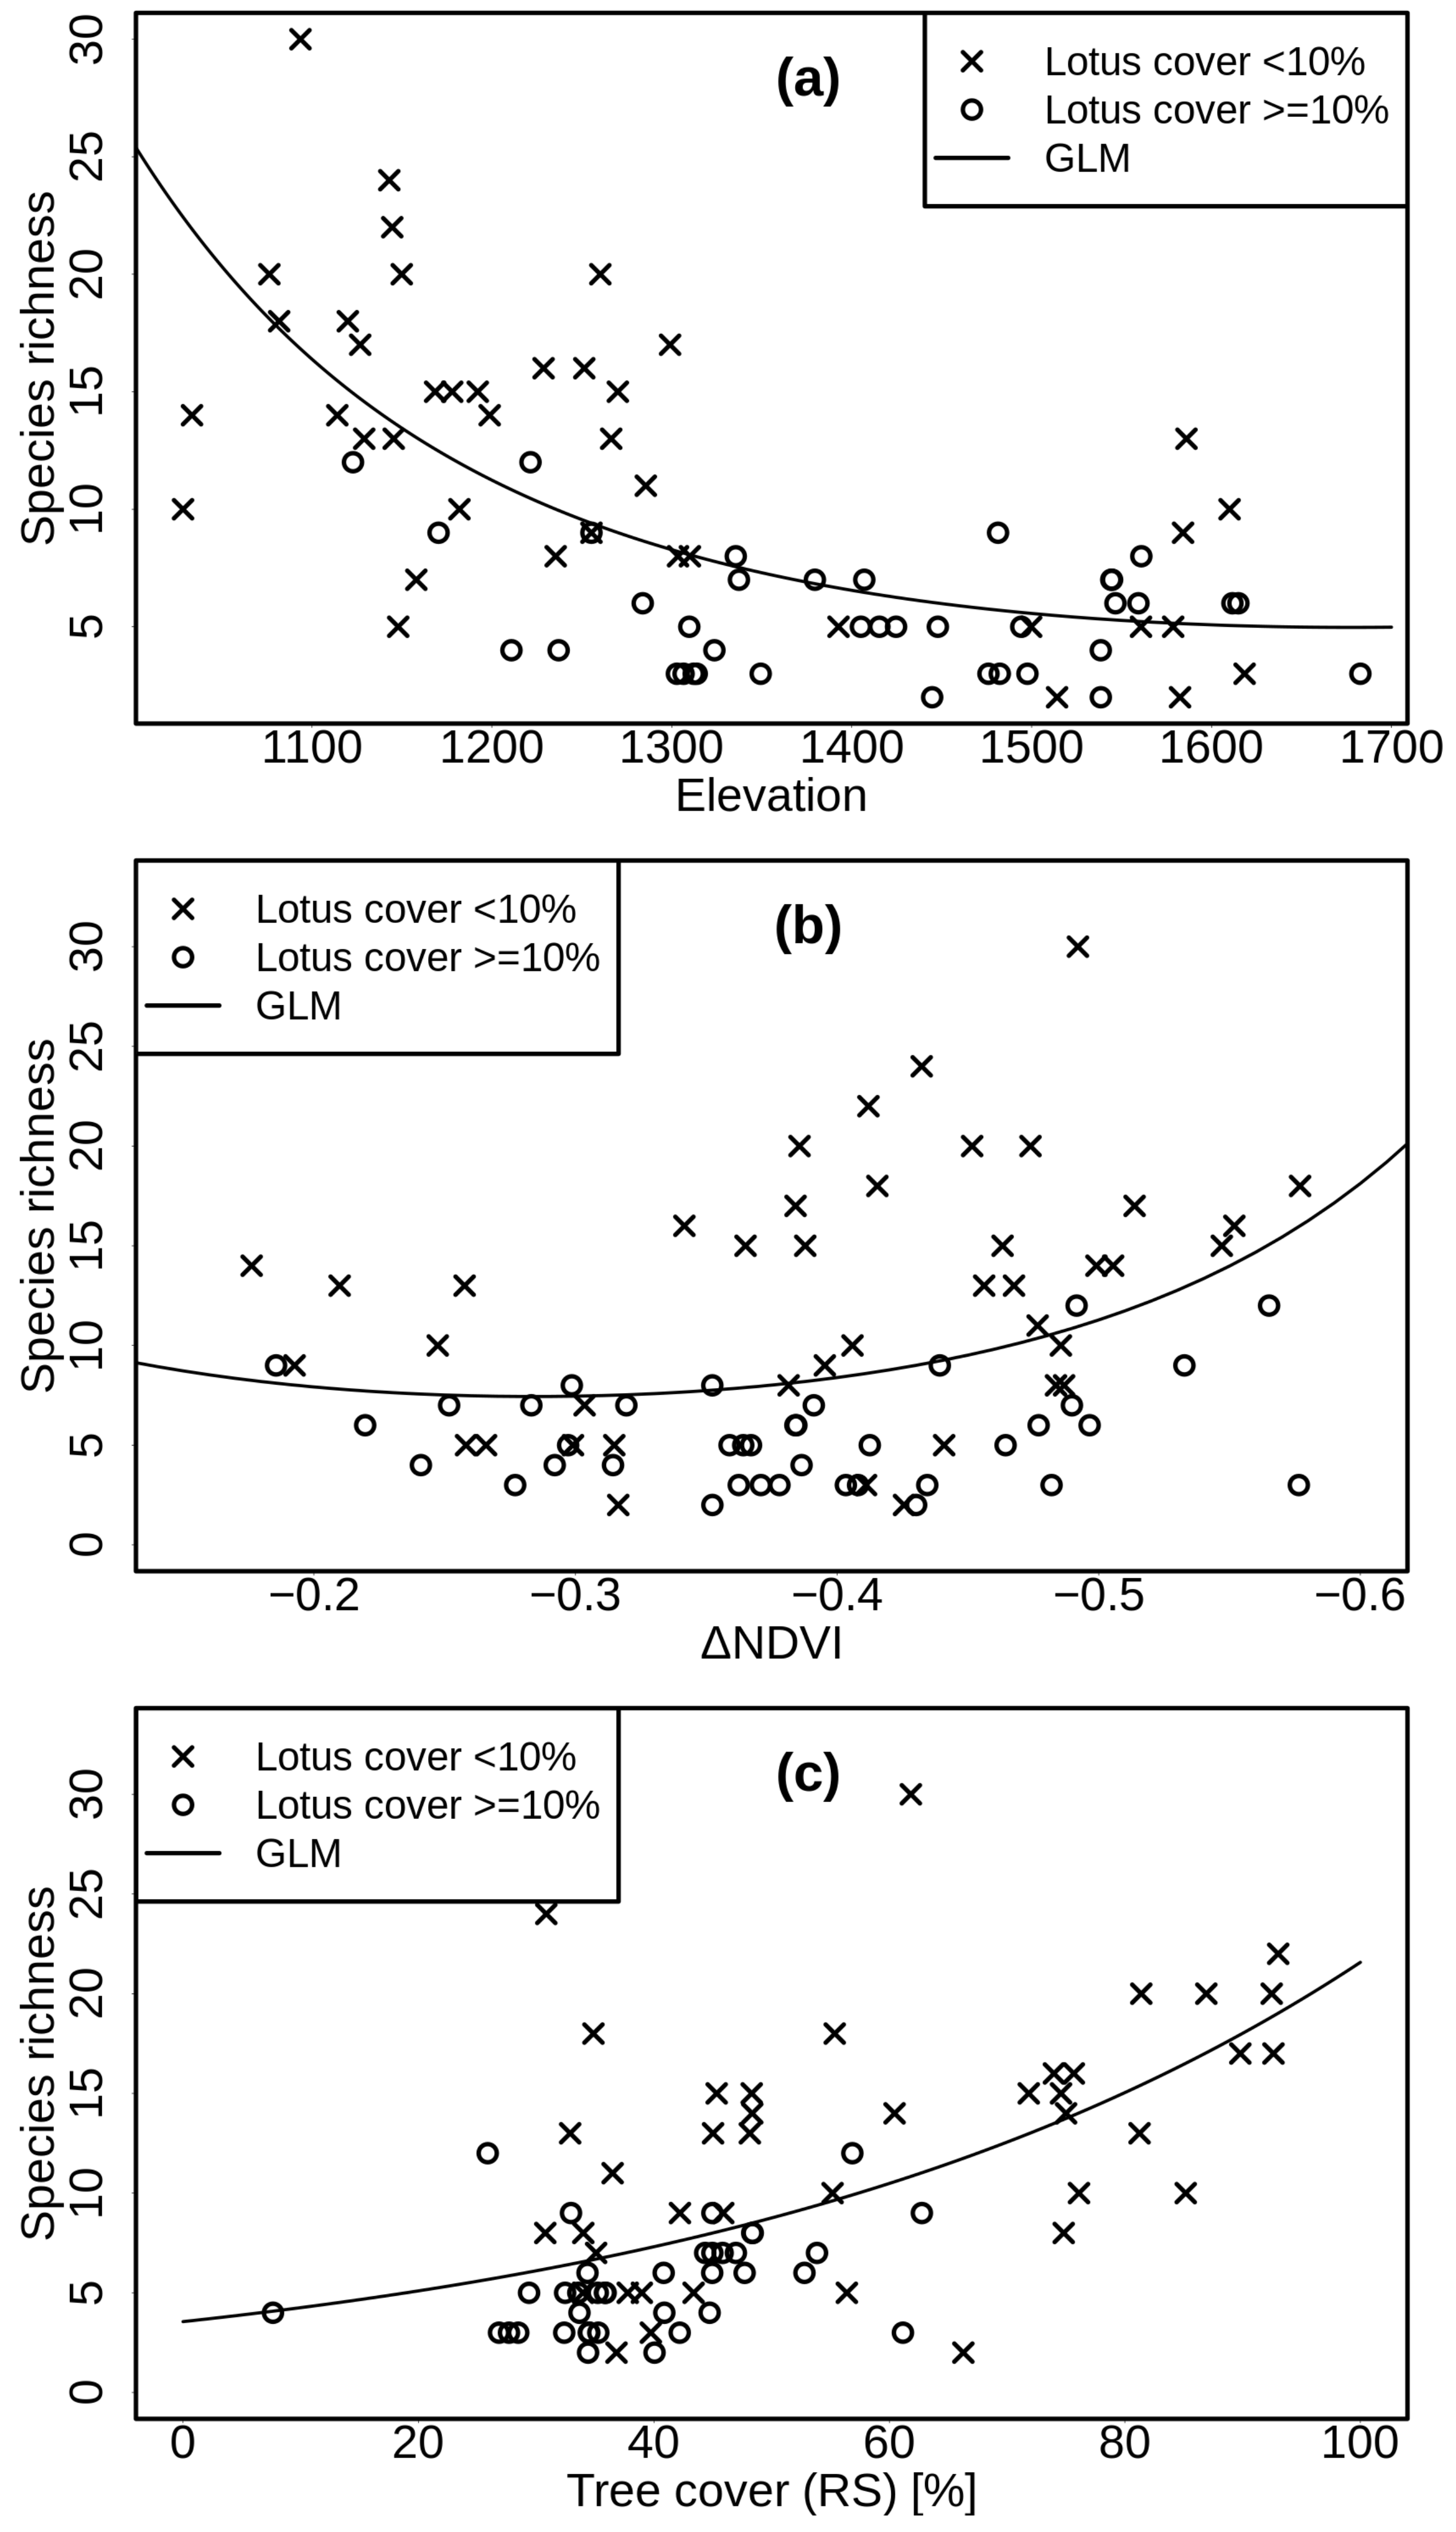
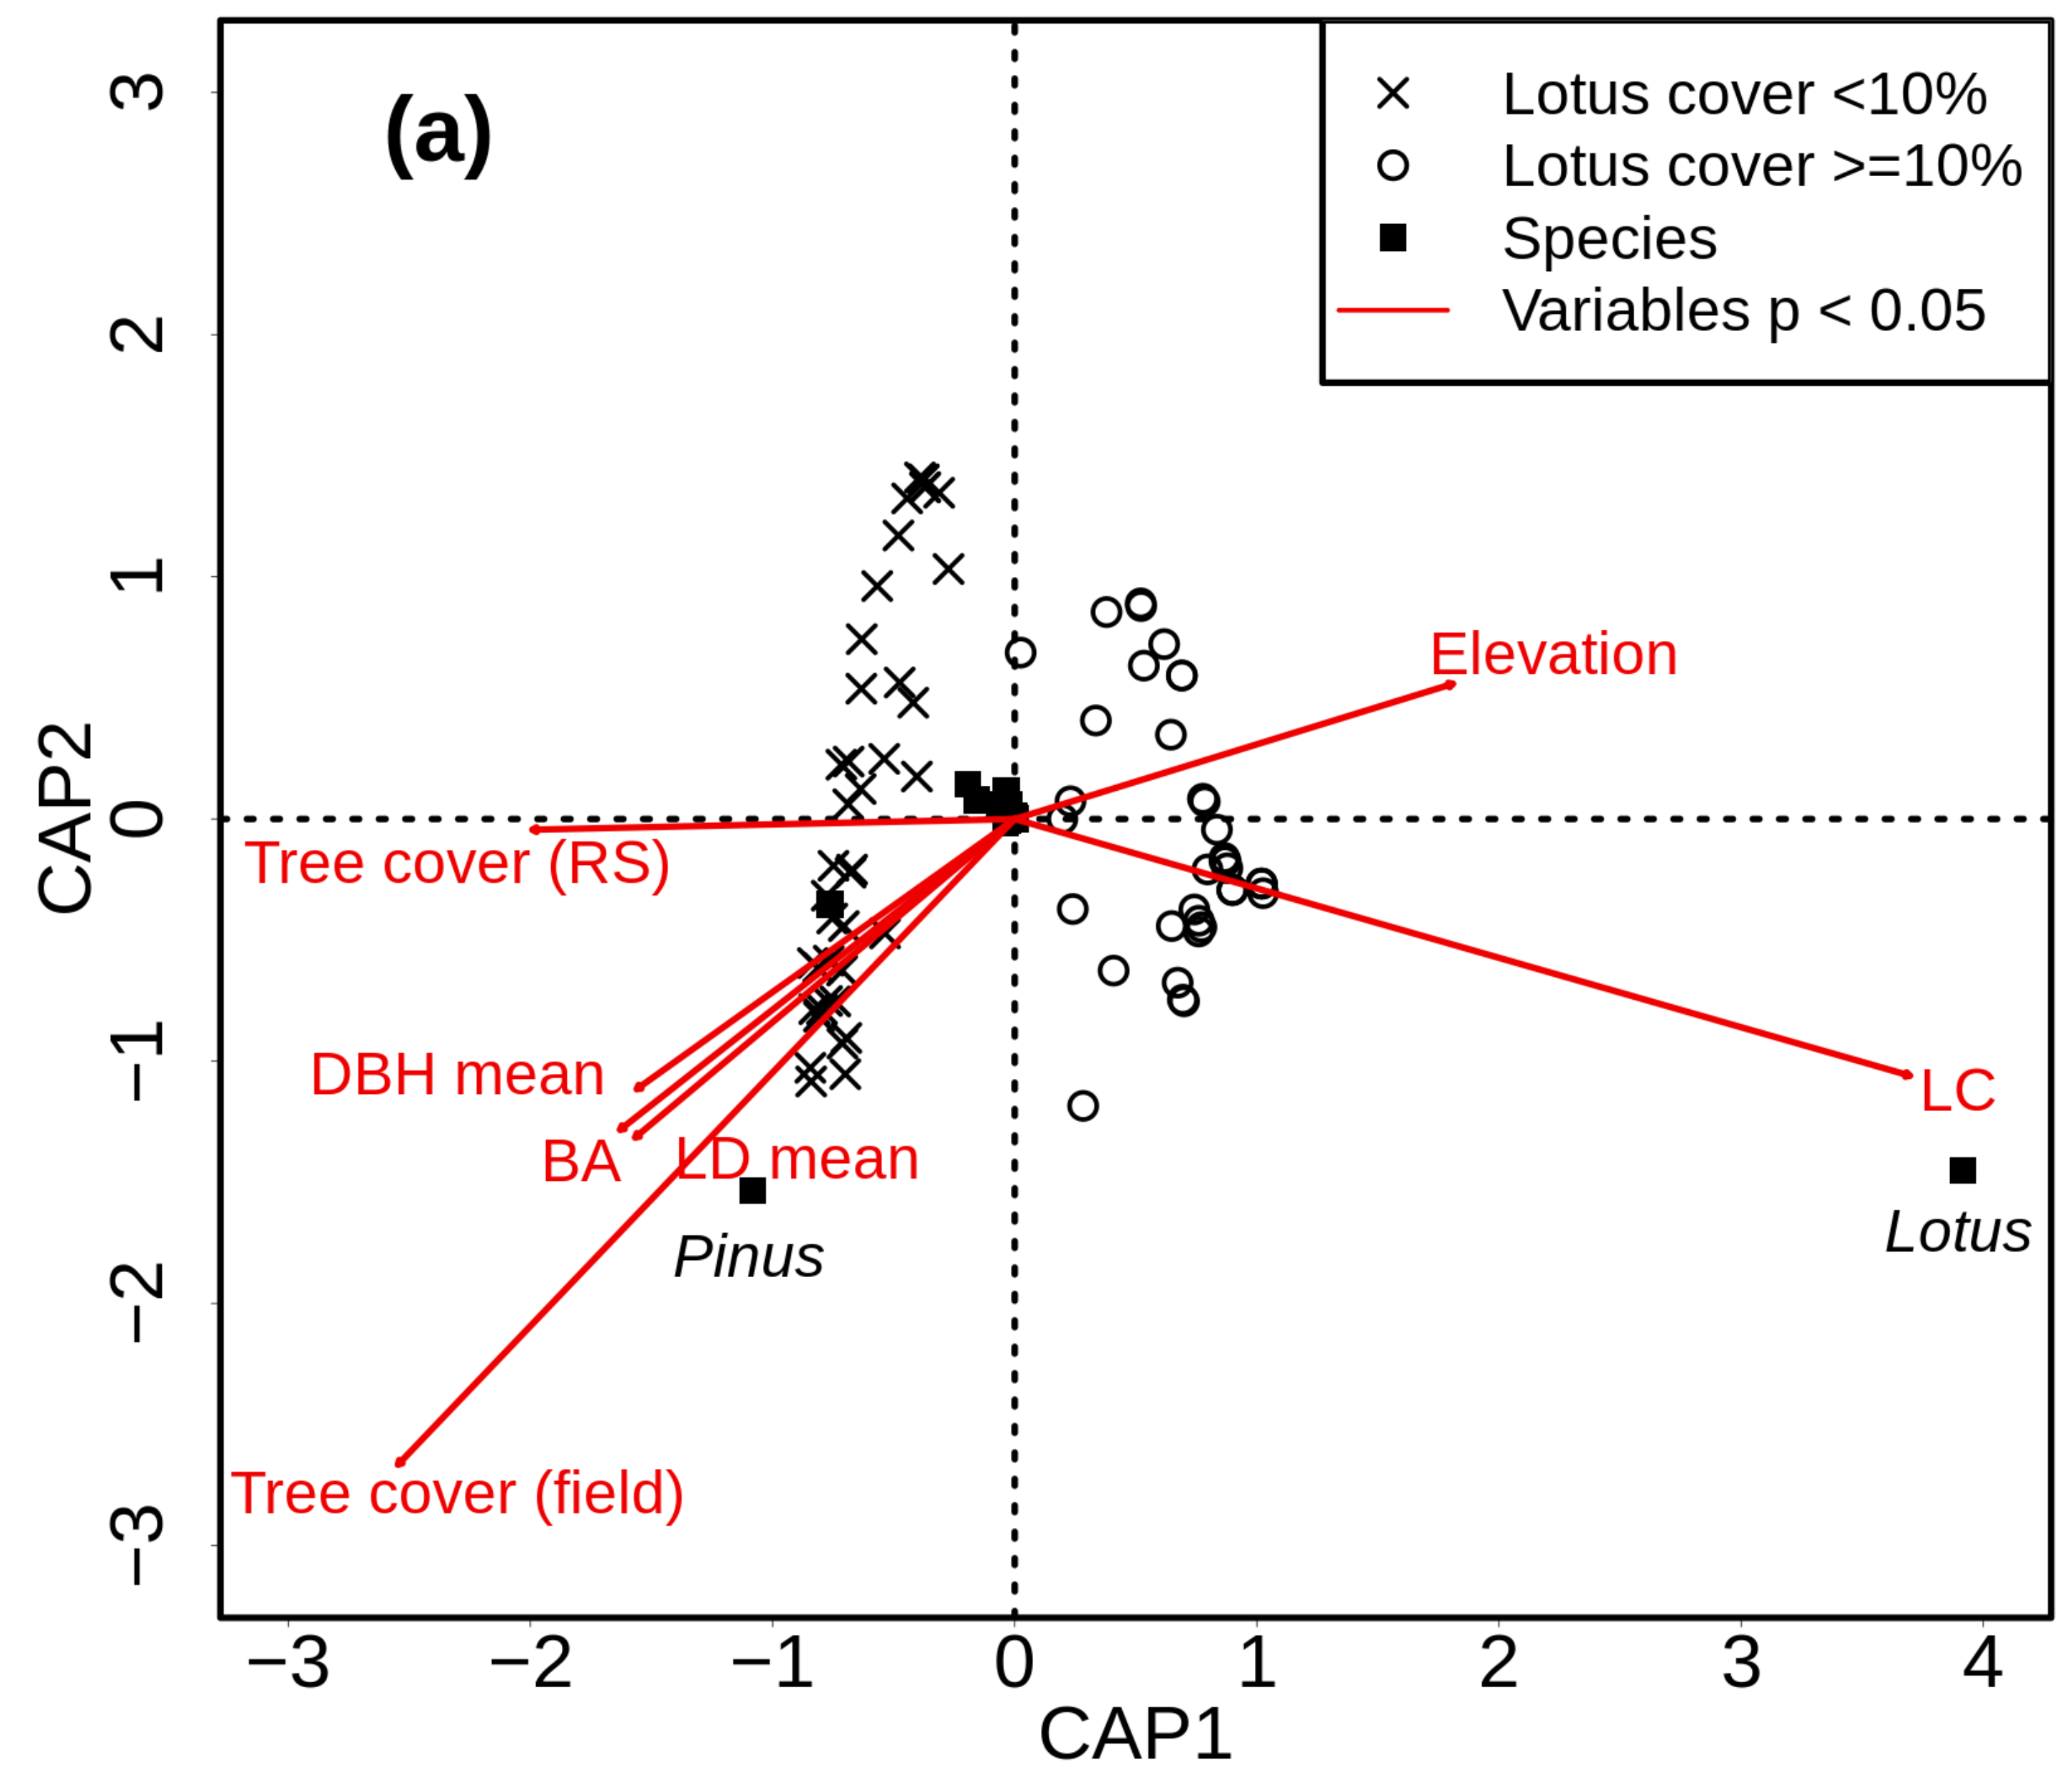
All statistical analyses were conducted using R version 3.6.3 [62]. Inter-variable correlation was calculated and visualized using package “corrplot” version 0.84 [70] (Figure S2 in Supplementary Materials). This was then used to identify variables with high collinearity (Pearson correlation coefficient above 0.7 or below −0.7) to select the most appropriate one.
To find the best-fitting transformation for all variables, exploratory linear models of the formula species richness ~ x were built, with x representing each variable. Additionally, the transformations x2, x + x2, sqrt (x) and log (x) were tested. The best transformation was selected based on the AIC of the models. Then, GLMs using family “poisson”, and therefore a logarithmic link function, were used to investigate the relationship between species richness and the explanatory variables. The GLM fit was tested using the Chi-square test on residual deviance and degrees of freedom. In addition to two simple GLMs, modelling species richness as functions of elevation and ΔNDVI, respectively, a multivariate model with the selected variable transformations was built. Stepwise variable selection was performed using the “step” function in R to pick the best-fitting GLM. Nagelkerke’s pseudo-R2 was calculated for all models, using the “pseudoR2” function from package “DescTools” version 0.99.40 [71].
To test for spatial autocorrelation, Moran’s I was calculated for the residuals of each GLM using function “moran.test” from the “spdep” package, version 1.1–5 [72]. For this, a weighted neighborhood matrix was used, which was calculated with the functions “dnearneigh” and “nb2listw”, again from the package “sdped”. Since significant spatial autocorrelation was found for all GLM residuals, the same analysis was repeated using Spatial linear models (SLM), namely simultaneous autoregressive models (SAR) using the package “spatialreg” version 1.1–5 [73]. SARs are able to account for spatial autocorrelation [74] and are frequently used in Ecology (e.g., [75,76,77]). The SAR models confirmed the general findings of the GLMs, while accounting for less of the variation in species richness due to the removal of spatial autocorrelation. The results of the SAR models can be found in Table S1 in the Supplementary Materials.
To analyze the influence of both fire intensity and environmental variables on species composition, a distance-based redundancy analysis (dbRDA) [78], using Bray–Curtis dissimilarity, was chosen [79]. Bray–Curtis dissimilarity [80] makes use of the estimated species abundances instead of only using presence–absence data. A dbRDA allows use of other dissimilarity indices apart from Euclidean distance, which is not appropriate for beta diversity analysis without data transformation [81]. Before fitting them to the dbRDA, environmental variables were standardized using the function “decostand” and the method “standardize”. After the dbRDA, an ANOVA-like permutation test was performed using the function “anova.cca” from the “vegan” package [82] to assess the significance of environmental variables.
To disentangle the importance of different variables on beta diversity, Mantel tests were performed on four different distance matrices. The environmental distance between each plot and all other plots was calculated using the same variables as the multivariate GLM, with the function “envdist”. In the same way, Bray–Curtis dissimilarity, topographic distance (following the surface of the DEM, calculated with the function “topodist” from package “topoDistance” version 1.01 [83]), and ΔΔNDVI were each calculated between every site and all other sites. While the simple difference (ΔNDVI) is used as a proxy for fire intensity per plot, ΔΔNDVI represents the difference between fire intensities between plots. ΔΔNDVI between a sampling site with high ΔNDVI and one with low ΔNDVI would therefore be bigger than between two sites of similar ΔNDVI levels.
Variance partitioning was performed using the function “varpart” to investigate the contribution of fire intensity and topography to the variance in the Bray–Curtis dissimilarity between plots. The following variables were used for topography: Elevation + Elevation2 + Inclination + Northness + Eastness + TCI + TRI.
To further investigate the explanatory power of environmental variables, a permutational MANOVA [84] was calculated using the function “adonis” from package “vegan” with 1000 permutations.
L. campylocladus ssp. hillebrandii poses a challenge for variance partitioning and statistical analyses. On the one hand, Lotus is part of the species pool and therefore influenced by fire intensity and environmental variables in the same way as all other species. On the other hand, the cover of the species in many of our plots is so thick that it influences the occurrence of other species by shading and water uptake. P. canariensis has a similar role; while it is a part of the species pool, it is the only species forming the tree layer of our sampling sites. Some predictor variables such as Tree cover (RS) and Basal area are entirely due to P. canariensis occurrence. To investigate the influence of using two species both as part of the species pool and the environmental variables, variance partitioning and permutational MANOVA were conducted on four different datasets. The whole dataset, the dataset without P. canariensis, the dataset without L. campylocladus ssp. hillebrandii, and the dataset without both. The dataset without both species only contained 77 observations instead of 79, since two plots contained only P. canariensis and L. campylocladus ssp. hillebrandii without any other species present. Additionally, the dbRDA was repeated with L. campylocladus ssp. hillebrandii cover removed from the environmental variables.
To assess the role of L. campylocladus ssp. hillebrandii on beta diversity, local contributions to beta diversity (LCBD) [81] were calculated for all plots using the “adespatial” package version 0.3–8. LCBD values represent “the degree of uniqueness of the sampling units in terms of community composition” [85]. Plots were split into two subsets, above and below 10% L. campylocladus ssp. hillebrandii cover (38 and 41 plots, respectively) to investigate the effect of L. campylocladus ssp. hillebrandii. A threshold of 10% was chosen owing to the distribution of L. campylocladus ssp. hillebrandii in the study area. With one data point with 5%, the other 40 points had 2% or less cover, with 28 points at 0%. Apart from seven points in the 15–30% range, at least a third of the remaining 32 data points had more cover, with 24 points above 50%. Even at 15%, we expect the dense growth (Figure 2) and considerable biomass accumulation of L. campylocladus ssp. hillebrandii to have an influence on nutrient, water, and light availability in large parts of the plot. Therefore, 10% was chosen as a threshold value. A Wilcoxon test was used to check for significant differences in the LCBD and elevation of both subgroups of plots. Additionally, the species contribution to beta diversity (SCBD) was calculated for all recorded species, based on the Hellinger distance. The Hellinger distance downweighs the occurrence of rare species and thus controls for overestimation due to rare species. To differentiate contributions by life strategy and growth form, SCBD values were also separated into contributions from nitrogen fixing species as well as non-nitrogen fixing species, and herbaceous plants were compared to woody plants.

3. Results

The species richness of our plots was best explained by elevation. A GLM with the formula Species Richness ~ Elevation + Elevation2 (Figure 3a) had a Nagelkerke’s pseudo-R2 of 0.81 (p < 0.001; Table 2), indicating higher species richness in lower elevations.
The influence of fire intensity, as measured by ΔNDVI, was significant but had a lower pseudo-R2 of 0.33 (Figure 3b, Table 2); the intermediate fire intensities tended to have the lowest species richness. Species richness was also highest in areas with highest forest density before the fire (Figure 3c, Table 2).
Stepwise variable selection of a multi-predictor GLM produce the following model: Species richness ~ Elevation + Elevation2 + Tree cover (field) + Tree cover (field)2 + Northness + Eastness + DBH mean + Litter depth mean + ΔNDVI + ΔNDVI2 + Tree cover (RS). Its pseudo-R2 was 0.94 (Table 2).
Significant spatial autocorrelation was detected for the residuals of all GLMs. Using SARs instead of GLMs resulted in differences in the pseudo-R2 values, but otherwise revealed the same patterns as the GLMs (Table S2 in Supplementary Materials).
Results of the Mantel test revealed similar correlations for the Bray–Curtis dissimilarity and the environmental distance and the topographic distance with Mantel’s R of 0.352 and 0.312, respectively (Table 3), while ΔΔNDVI only showed a significant relationship with the environmental distance.
The dbRDA revealed tree cover (both before and after the fire), elevation and L. campylocladus ssp. hillebrandii cover percentage as the most influential variables for species composition in our dataset. Plots were separated into two groups based on how abundant L. campylocladus ssp. hillebrandii was within them. Species were grouped around the center of Axis 1 and Axis 2 with only three species further away from the center: L. campylocladus, Vicia pubescens (DC.) Link. and P. canariensis. With Lotus-cover removed as an explanatory variable, the dbRDA shows a similar pattern, with a higher influence of other species, such as Bituminaria bituminosa (L.) C.H.Stirt. and Chamaecytisus prolifer (L.f.) Link, both also nitrogen fixers (Figure 4).
A permutational MANOVA revealed that elevation was the most important variable, with Elevation +Elevation2 explaining between 19.3% (in the subset with Lotus only) and 23.4% (in the subset with Pinus only) of the variance in the Bray–Curtis dissimilarity (Table S2). Depending on which data subset was used, Tree cover + Tree cover2 explained up to 24.7% of variance (in the subset with Pinus included) and Legume cover + Legume cover2 explained up to 35.3% (in the subset with both species present).
The influence of topography and fire on the Bray–Curtis dissimilarity was tested via variation partitioning. It revealed that topography-related variables account for much more of the variance than ΔNDVI. Topography accounts for between 24.7% of the variance in the subset with only P. canariensis included and 20% with both P. canariensis and L. campylocladus ssp. hillebrandii but only 18.4% of the subset without both, and 18.1% in the L. campylocladus ssp. hillebrandii only subset. ΔNDVI accounts for between 1.7% and 4.3% of the variance are also the most influential in the subset including only P. canariensis (Figure 5).
Plots dominated by L. campylocladus ssp. hillebrandii contribute significantly less to local beta diversity. Plots above 10% cover of this species (“Lotus-dominated plots”) had a mean LCBD value of 0.01, while plots below a 10% cover had a mean value of 0.015 (Figure 6b). Additionally, Lotus-dominated plots had significantly lower species richness: a mean of 5.5 compared with 12.5 in the non-Lotus-dominated sites (Figure 6a). The distribution of L. campylocladus ssp. hillebrandii depends on elevation, with Lotus-dominated plots being on average 137 m higher than the other sites. All three differences were significant (tested using Wilcoxon tests).
Species contributions to beta diversity were tested using the Hellinger distance between plots. L. campylocladus ssp. hillebrandii was by far the most influential species, SCBD = 0.445, followed by Vicia pubescens (0.166), P. canariensis (0.115), Bituminaria bituminosa (0.063), Chamaecytisus proliferus (0.042), and Cistus symphytifolius Lam. (0.028) (Figure 6c). Legume species were responsible for 75% of SCBDs, non-legumes for 25%. Herbaceous plants contributed 78% to SCBDs, and woody plants 22% (Figure 7).

4. Discussion

This study on forest ecosystem dynamics after fire in the endemic pine forest of La Palma, Canary Islands, identified major drivers of the alpha and beta diversity of vascular plant species. In particular, we found that elevation is not only the most important predictor for species richness, it also strongly affects the beta diversity between plots.

4.1. Alpha Diversity (Species Richness)

The most important predictor for plot-level species richness was elevation, with higher species numbers in lower elevations. Even though the sampling of this study covered a limited altitudinal gradient (654 m), elevation could account for a large proportion of the variation in species richness (pseudo-R2 of 0.81), as well as temperature and precipitation gradients with elevation, in which rainfall seasonality increases at higher elevations [77].
The lower elevation of the investigated gradient was close to roads and villages, explaining the emergence of ruderal and garden plants. Burned areas are known to be more prone to invasion processes [86]. A study by Steinbauer et al. [87] found a decrease in species richness with increasing altitude due to decreasing area and increasing climatic isolation—which is in line with our findings. Irl et al. [77] found elevation to be the most important predictor for species richness on La Palma; the explanatory power of elevation in our study is even higher. The opening of the forest canopy leads to a more direct influence of climatic factors compared to dense forests. The relatively uniform topography throughout our study area may reduce influences of specific site conditions. Finally, the importance of elevation is inflated by spatial autocorrelation, which is shown by the difference in explained variance between the GLM and the SAR model.
ΔNDVI, which serves as a proxy for fire intensity, also explained part of the variation in species richness (Nagelkerke’s pseudo-R2 = 0.33). Our sampled sites showed strong NDVI declines after the fire. In contrast to our hypothesis, more species were encountered in areas with a large difference in NDVI (high relative fire intensity). This is surprising, as seeds from several endemic plants of the Canary pine forest are known to show low germination rates after fire [88]. However, improved nutrient availability may have led to the highest species richness in areas with the largest ΔNDVI; Durán et al. [29] found a steep increase in the availability of soil nitrogen one year after a fire.
As our study shows, due to their relatively high spectral, spatial, and temporal resolution, Sentinel-2 data are very useful for fire-related applications. They can also be used for wildfire ignition probability modelling [89], fire damage mapping [90,91], with an accuracy comparable to unmanned aerial vehicles (UAVs) [53], and are also efficient for fire recovery mapping [92].
While NDVI and other spectral indices are good proxies for fire intensity on the ground [52,53,55], the stand density of P. canariensis could negatively affect the usefulness of vegetation indices as a direct proxy for fire intensity. Large gaps in the forest canopy might influence how well fire intensity is recorded in the satellite image. The mean tree cover before the fire, as derived from Copernicus, was 49%. On the other hand, the tree cover before the fire was quite a good predictor of species richness after the fire. As tree density in undisturbed forests is an indicator of resource availability, this could translate into the successional trajectories after fire.
Studies from pine forests in other biomes have shown different response patterns to those we found [93,94], indicating that the impact of fire intensity and the responses of pine forests to wildfire are context-dependent.

4.2. Beta Diversity

Beta diversity measures differences in community composition and adds another category of information to the assessment of biodiversity responses to disturbances. Multitemporal Sentinel-2 and LiDAR data have been linked successfully to species diversity on slopes in northwestern La Palma, with up to 85% of beta diversity reflected in patterns of remotely sensed data [95].
However, there is a multitude of beta diversity indices, highlighting quite different aspects of community responses [79,81,96,97,98]. In order to cover these different facets of beta diversity, we selected complementary metrics of beta diversity: the classic Bray–Curtis dissimilarity index, the modern LCBD, and the modern SCBD based on the Hellinger distance.
We found correlations between the species dissimilarity and both topographic distance and environmental distance. Increasing dissimilarity with distance is not surprising, but environmental variables show a correlation of similar strength. Elevation and L. campylocladus cover were the most important predictors influencing the compositional dissimilarity between plots, with elevation explaining 19.2–23.4% of the variation, depending on the subset under consideration.
Variance partitioning revealed topography to be of higher importance than fire intensity when explaining beta diversity. The highest explained variance was reached in the dataset that included Pinus but excluded Lotus. This is most likely due to the more direct effect burn damage has on P. canariensis compared to understory vegetation, which only germinates after the fire. Therefore, fire intensity has a higher explanatory power for the P. canariensis dataset. Since the severity of fire damage is linked to topographic variables, especially elevation and slope, topography and the shared variance explained by both topography and fire intensity are higher as well. In the future, this link between topographic variables and damage to P. canariensis could also be used for fire modelling.
The higher abundance of L. campylocladus at higher elevations may cause more homogenous patterns there, with a more heterogenous landscape mosaic at lower elevations. Other significant variables were Tree cover and Legume cover. Both variables explained significant yet minor parts of the variation in the subsets without Lotus and Pinus. ΔNDVI had a significant influence as well, explaining around 4.1–5.5% of the variation in beta diversity, with the highest values reached in the subset including Pinus and excluding Lotus. Again, this is not surprising, since P. canariensis is directly affected by burn damage, while nearly all the other recorded species germinated after the fire. Fire intensity’s effects on beta diversity must be interpreted carefully, due to mechanisms in which species were grouped before the fire due to habitat filtering or dispersal limitations and subsequently “unclumped” due to the niche selection of fire tolerant species and differences in sample sizes [99].
Conducting the PERMANOVA on the data subsets without Lotus and without Pinus revealed minor shifts in the importance of variables. In the presence of Lotus, the importance of elevation as a predictor variable decreased. Variance partitioning also revealed the lower importance of both fire intensity and topography compared to the subsets with Pinus included. The subsets with Pinus included exhibited more variance explained by fire intensity in both the PERMANOVA and the variance partitioning approach. Again, it can be assumed that this is caused by the much more direct effect fire has on Pinus compared to understory vegetation. Elevation also had a larger effect on the subsets with Pinus included. With differences in the moisture regime in higher elevations close to the Cumbre Vieja compared to lower regions, the recovery and therefore the cover of Pinus after the fire seem to be linked to precipitation.

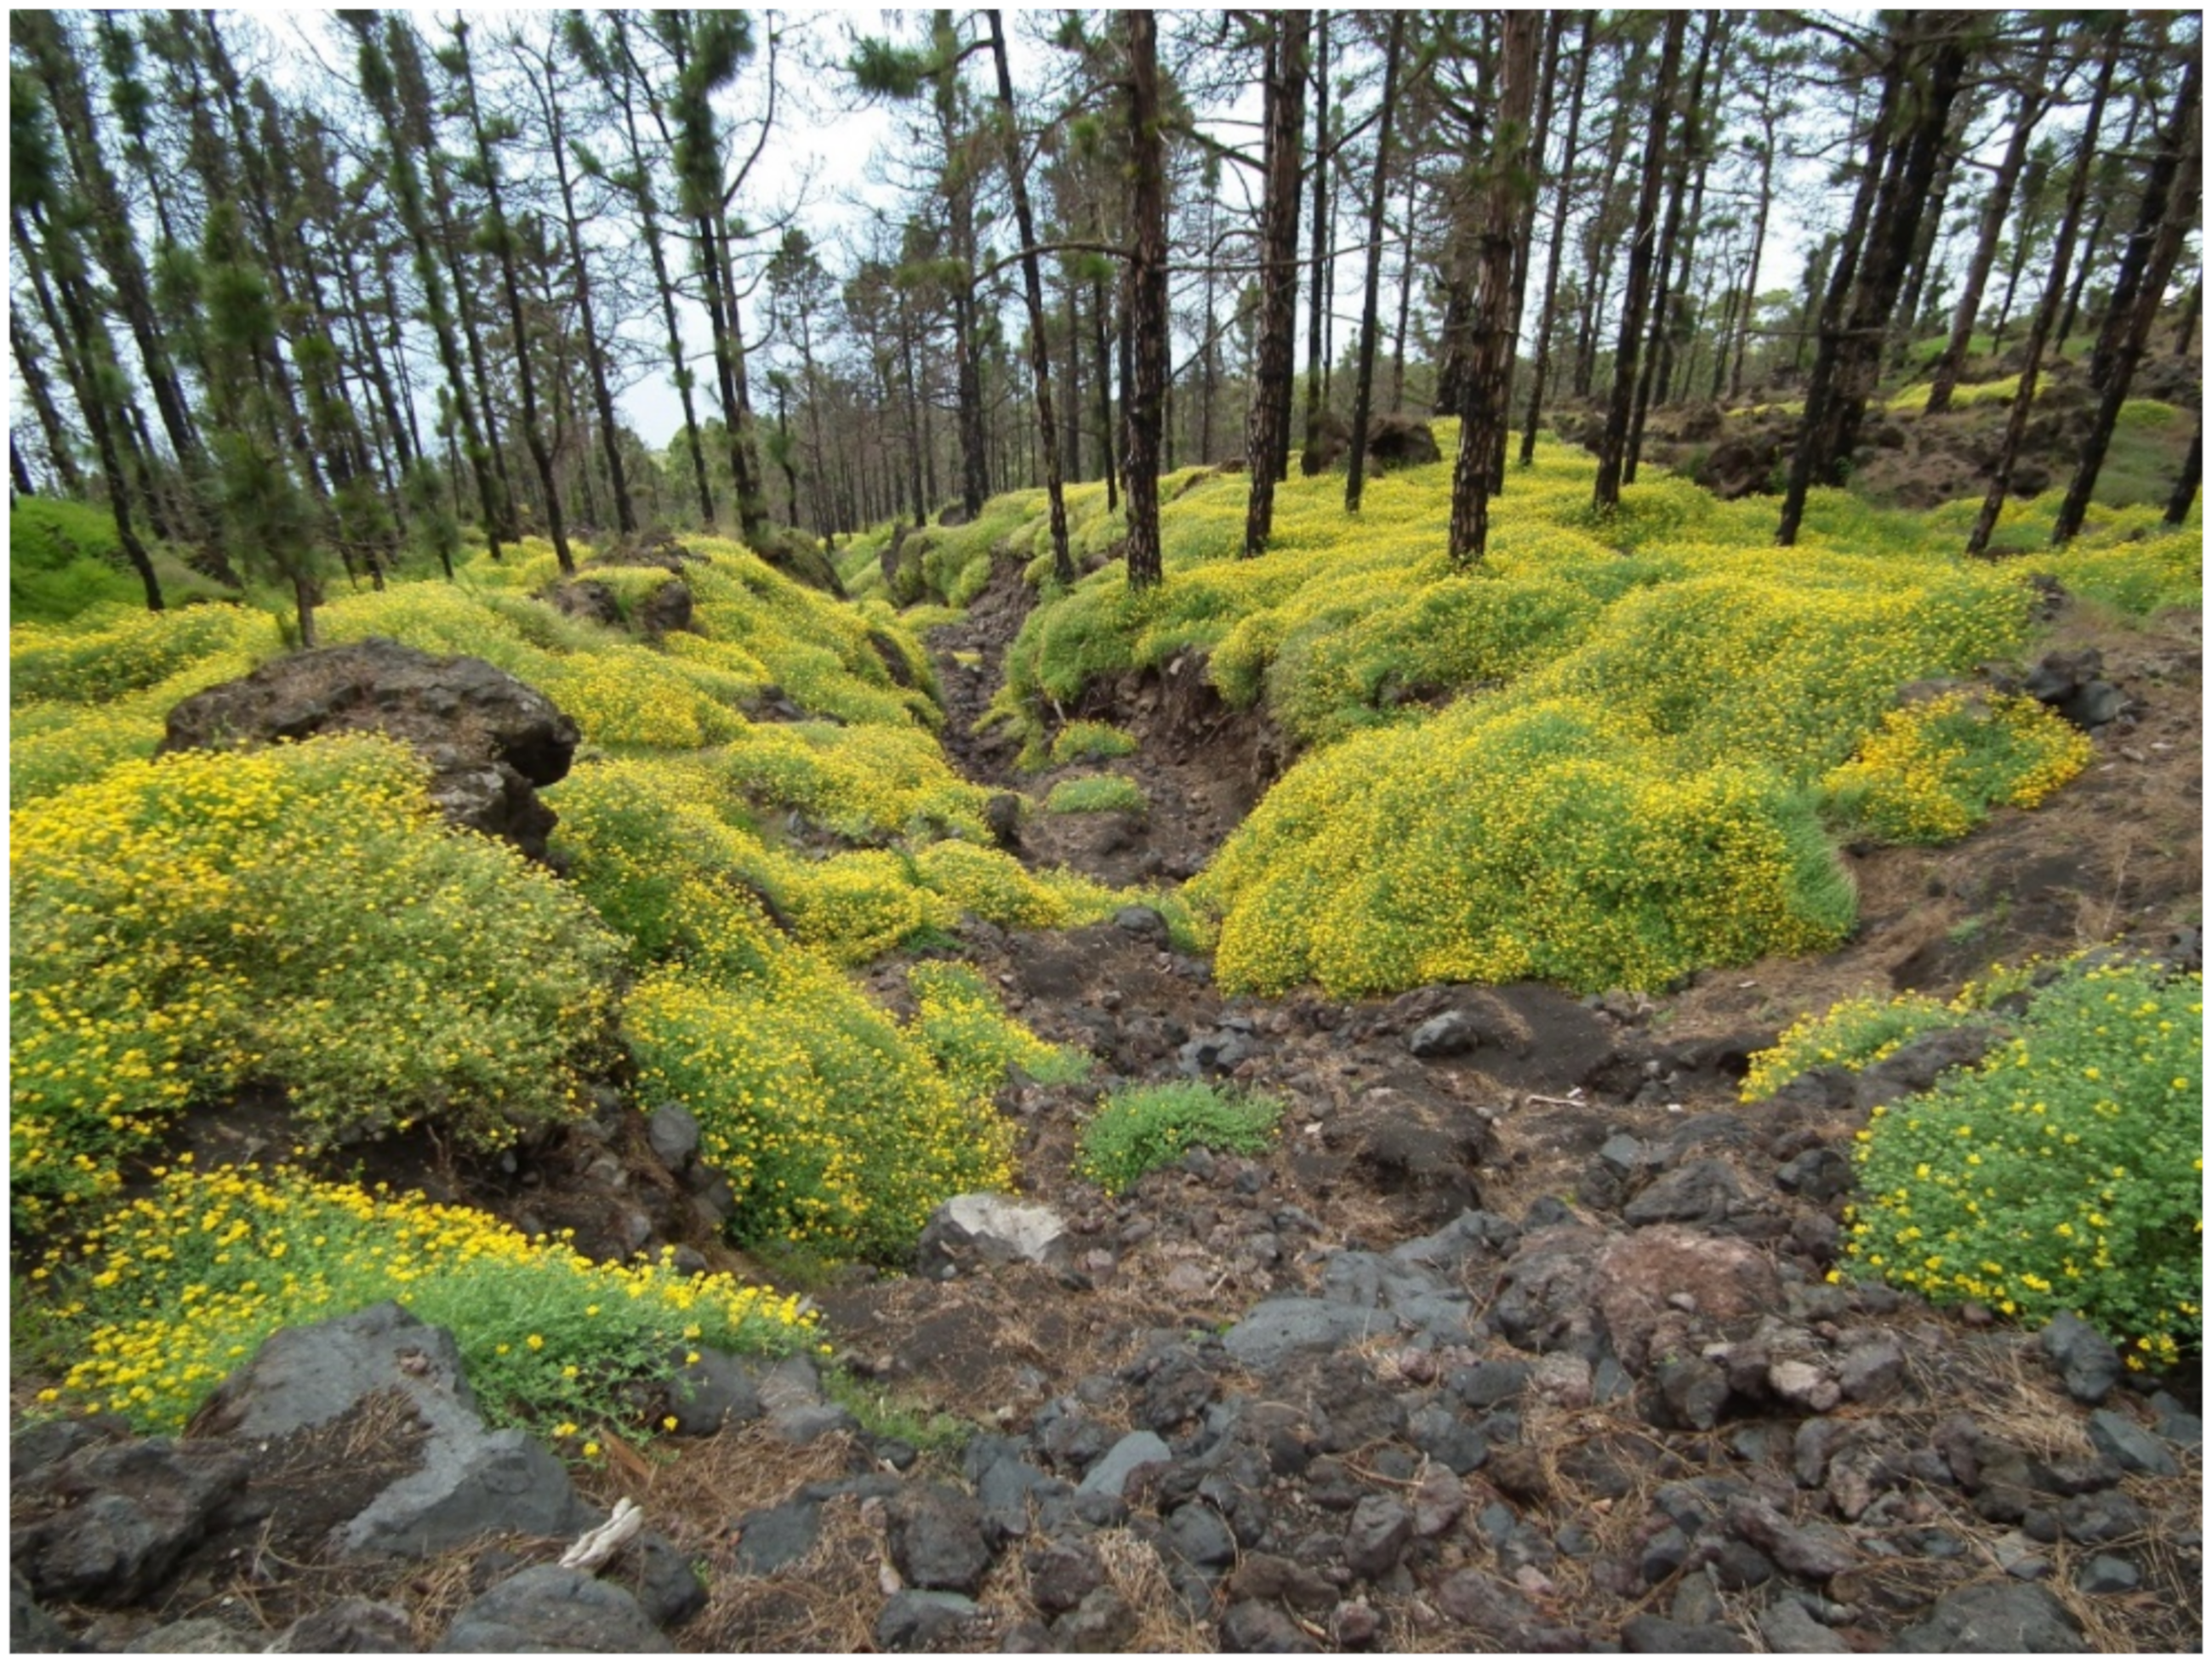
4.3. Role of Lotus campylocladus ssp. hillebrandii

Overall, L. campylocladus was found to be an important factor for both alpha and beta diversity. This species was encountered in 52 plots, 39 of which had 15% or more cover and 21 had 70% or more cover. The thick layer of this endemic plant appears to limit overall species richness and homogenize beta diversity. Nonetheless, L. campylocladus had the strongest influence on the species’ contributions to beta diversity (SCBD).
Lotus campylocladus ssp. hillebrandii thrives if a combination of fire and precipitation is provided. The data presented in this study were sampled towards the end of the moist season. Studies during and after the drier summer months could shed more light on species composition during forest recovery.
L. campylocladus can be classified as both a perennial herb and a dwarf shrub [100]. Since Lotus is usually a temporal occurrence in our study area and mostly lacked wooden stems, we classified it as herbaceous. With its ability to quickly cover open ground after fire, it hinders erosion and nutrient loss [30]. L. campylocladus and other nitrogen fixers are important factors for beta diversity. Four out of five of the highest SCBD values were nitrogen fixers. Generally, herbaceous plants contributed more to SCBD than woody plants.
On undisturbed sites, both nitrogen fixers and annual species reach higher abundances in the pine forests on the western slope of Cumbre Vieja compared to the eastern slope [101]. The low abundances of perennial plants indicate that these are less well adapted to fire impact. However, considering the vegetation structures in unburned Canary pine forests, it seems likely that Lotus will be replaced by shrub species in the future. While we found a link between fire intensity and both alpha and beta diversity, this was weaker than expected. Site conditions such as elevation were more important explanatory variables. Moreover, the distribution of L. campylocladus ssp. hillebrandii was driven mostly by elevation. The expected interaction between the L. campylocladus and biodiversity patterns could be confirmed, with the cover of Lotus as an important driver for beta diversity patterns.

5. Conclusions

We found a complex mix of drivers to be influencing alpha and beta diversity 1.5 years after a major fire. The most important explanatory environmental variables were related to elevation and to the presence of the key herb L. campylocladus, a nitrogen fixing endemic plant species. Elevation was overall the most important driver for both alpha and beta diversity patterns. This importance is most likely caused by a multitude of drivers, for example precipitation patterns changing with elevation. Sampling was conducted after the moist winter season. In this situation, L. campylocladus benefits from past fire-related nutrient mineralization and favorable soil water conditions. This combination yields high abundances. The ability of Lotus to fix nitrogen might additionally facilitate subsequent successional trajectories.
On a longer time-scale, climate change is very likely to further influence the forest vegetation of islands such as La Palma. With the expected increase in both fire frequency and size, and with lessons from past fire recoveries not necessarily holding true for future fires anymore, it is crucial to better understand drivers of forest recovery, both for their importance for local species richness in the rather species poor pine forest, and in terms of the role of understory vegetation in erosion prevention.

Supplementary Materials

The following are available online at https://www.mdpi.com/article/10.3390/f12121638/s1, Figure S1: Detail map indicating the species richness per site, Figure S2: Correlation table of all variables, Table S1: Model coefficients of the different SAR models taking spatial autocorrelation into account, Table S2: Results of the PERMANOVA with 1000 permutations for the 4 data subsets with and without Lotus and Pinus.

Author Contributions

Conceptualization, C.B., R.F. and F.W.; methodology, C.B., A.S., D.G. and F.W.; validation, F.W., A.S., D.G.; formal analysis, F.W.; investigation, F.W., A.S., D.G., C.B.; resources, C.B. and A.J.; data curation, F.W.; writing—original draft preparation, F.W., A.S., D.G., S.H.; writing—review and editing, C.B., F.W., S.H., A.J., R.F., O.V., A.C., A.P., S.D.H.I., R.O., A.S., J.M.F.-P., R.O.; visualization, F.W.; supervision, C.B.; project administration, C.B.; funding acquisition, C.B., A.J. All authors have read and agreed to the published version of the manuscript.

Funding

This research was funded by the EU Horizon 2020 project ECOPOTENTIAL under the grant number 641762. The publication cost was funded by the University of Bayreuth Open Access Publishing Fund.

Data Availability Statement

The data presented in this study are available on request from the corresponding author.

Acknowledgments

We acknowledge the support of the Elite Network of Bavaria and the study program Global Change Ecology. Also, we acknowledge the support of Felix Medina from the Cabildo Insular at La Palma, Spain.

Conflicts of Interest

The authors declare no conflict of interest.

References

  1. Bowman, D.M.; Balch, J.K.; Artaxo, P.; Bond, W.J.; Carlson, J.M.; Cochrane, M.A.; D’Antonio, C.M.; DeFries, R.S.; Doyle, J.C.; Harrison, S.P. Fire in the earth system. Science 2009, 324, 481–484. [Google Scholar] [CrossRef]
  2. Bond, W.J.; Woodward, F.I.; Midgley, G.F. The global distribution of ecosystems in a world without fire. New Phytol. 2005, 165, 525–538. [Google Scholar] [CrossRef]
  3. Bond, W.J.; Keeley, J.E. Fire as a global ‘herbivore’: The ecology and evolution of flammable ecosystems. Trends Ecol. Evol. 2005, 20, 387–394. [Google Scholar] [CrossRef] [PubMed]
  4. Pausas, J.G.; Keeley, J.E. A burning story: The role of fire in the history of life. Bioscience 2009, 59, 593–601. [Google Scholar] [CrossRef] [Green Version]
  5. Turner, M.G.; Hargrove, W.W.; Gardner, R.H.; Romme, W.H. Effects of fire on landscape heterogeneity in Yellowstone National Park, Wyoming. J. Veg. Sci. 1994, 5, 731–742. [Google Scholar] [CrossRef] [Green Version]
  6. Turner, M.G.; Romme, W.H. Landscape dynamics in crown fire ecosystems. Landsc. Ecol. 1994, 9, 59–77. [Google Scholar] [CrossRef]
  7. Pausas, J.G.; Llovet, J.; Rodrigo, A.; Vallejo, R. Are wildfires a disaster in the Mediterranean basin?—A review. Int. J. Wildland Fire 2008, 17, 713–723. [Google Scholar] [CrossRef]
  8. Schimmel, J.; Granstrom, A. Fire severity and vegetation response in the boreal Swedish forest. Ecology 1996, 77, 1436–1450. [Google Scholar] [CrossRef]
  9. Cowan, A.D.; Smith, J.E.; Fitzgerald, S.A. Recovering lost ground: Effects of soil burn intensity on nutrients and ectomycorrhiza communities of ponderosa pine seedlings. For. Ecol. Manag. 2016, 378, 160–172. [Google Scholar] [CrossRef] [Green Version]
  10. Butnor, J.R.; Johnsen, K.H.; Maier, C.A.; Nelson, C.D. Intra-annual variation in soil C, N and nutrients pools after prescribed fire in a Mississippi longleaf pine (Pinus palustris Mill.) plantation. Forests 2020, 11, 181. [Google Scholar] [CrossRef] [Green Version]
  11. Otto, R.; García-del-Rey, E.; Muñoz, P.G.; Fernández-Palacios, J.M. The effect of fire severity on first-year seedling establishment in a Pinus canariensis forest on Tenerife, Canary Islands. Eur. J. For. Res. 2010, 129, 499–508. [Google Scholar] [CrossRef]
  12. Méndez, J.; Morales, G.; de Nascimento, L.; Otto, R.; Gallardo, A.; Fernández-Palacios, J.M. Understanding long-term post-fire regeneration of a fire-resistant pine species. Ann. For. Sci. 2015, 72, 609–619. [Google Scholar] [CrossRef] [Green Version]
  13. Zagas, T.; Ganatsas, P.; Tsitsoni, T.; Tsakaldimi, M. Post-fire regeneration of Pinus halepensis Mill. stands in the Sithonia Peninsula, Northern Greece. Plant Ecol. 2004, 171, 91–99. [Google Scholar] [CrossRef]
  14. Spanos, I.A.; Daskalakou, E.N.; Thanos, C.A. Post-fire, natural regeneration of Pinus brutia forests in Thasos island, Greece. Acta Oecol. 2000, 21, 2013–2020. [Google Scholar] [CrossRef]
  15. Bond, W.J.; Midgley, J.J. Ecology of sprouting in woody plants: The persistence niche. Trends Ecol. Evol. 2001, 16, 45–51. [Google Scholar] [CrossRef]
  16. Tsitsoni, T. Conditions determining natural regeneration after wildfires in the Pinus halepensis (Miller, 1768) forests of Kassandra Peninsula (North Greece). For. Ecol. Manag. 1997, 92, 199–208. [Google Scholar] [CrossRef]
  17. Romme, W.H.; Boyce, M.S.; Gresswell, R.E.; Merrill, E.H.; Minshall, G.W.; Whitlock, C.; Turner, M.G. Twenty years after the 1988 Yellowstone fires: Lessons about disturbance and ecosystems. Ecosystems 2011, 14, 1196–1215. [Google Scholar] [CrossRef]
  18. Jentsch, A.; White, P. A theory of pulse dynamics and disturbance in ecology. Ecology 2019, 100, e02734. [Google Scholar] [CrossRef]
  19. Höllermann, P. The impact of fire in the Canarian ecosystems 1983–1998. (Auswirkungen des Feuers in Ökosystemen der Kanarischen Inseln 1983–1998). Erdkunde 2000, 54, 70–75. [Google Scholar] [CrossRef]
  20. Gell-Mann, M. Complex adaptive systems. In Complexity: Metaphors, Models and Reality, 1st ed.; Cowan, G., Pines, D., Meltzer, D., Eds.; Addison-Wesley: Boston, MA, USA, 1994; Volume XIX, pp. 17–45. [Google Scholar]
  21. Arévalo, J.R.; Naranjo Cigala, A.; Fernández-Palacios, J.M.; Fernández-Lugo, S. Ecology and management of natural and reforested Canary Island pine stands. In Woodlands: Ecology, Managment and Conservation, 1st ed.; Wallace, E.R., Ed.; Nova Science Publishers: New York, NY, USA, 2011; pp. 1–23. [Google Scholar]
  22. Climent, J.; Tapias, R.; Pardos, J.A.; Gil, L. Fire adaptations in the Canary Islands pine (Pinus canariensis). Plant Ecol. 2004, 171, 185–196. [Google Scholar] [CrossRef]
  23. Molina-Terrén, D.M.; Fry, D.L.; Grillo, F.F.; Cardil, A.; Stephens, S.L. Fire history and management of Pinus canariensis forests on the western Canary Islands Archipelago, Spain. For. Ecol. Manag. 2016, 382, 184–192. [Google Scholar] [CrossRef]
  24. Stephens, S.L.; Ruth, L.W. Federal forest-fire policy in the United States. Ecol. Appl. 2005, 15, 532–542. [Google Scholar] [CrossRef] [Green Version]
  25. Steel, Z.L.; Koontz, M.J.; Safford, H.D. The changing landscape of wildfire: Burn pattern trends and implications for California’s yellow pine and mixed conifer forests. Landsc. Ecol. 2018, 33, 1159–1176. [Google Scholar] [CrossRef]
  26. Mora, J.L.; Armas-Herrera, C.M.; Guerra, J.A.; Arbelo, C.D.; Rodríguez-Rodríguez, A.; Notario del Pino, J.S. A comparative study of long-term effects on fire-affected volcanic soils in two different ecosystems in the Canary Islands. Land Degrad. Dev. 2016, 27, 1489–1500. [Google Scholar] [CrossRef]
  27. Kutiel, P.; Shaviv, A. Effects of soil type, plant composition and leaching on soil nutrients following a simulated forest fire. For. Ecol. Manag. 1992, 53, 329–343. [Google Scholar] [CrossRef]
  28. Certini, G. Effects of fire on properties of forest soils: A review. Oecologia 2005, 143, 1–10. [Google Scholar] [CrossRef]
  29. Durán, J.; Rodríguez, A.; Fernández-Palacios, J.M.; Gallardo, A. Changes in soil N and P availability in a Pinus canariensis fire chronosequence. For. Ecol. Manag. 2008, 256, 384–387. [Google Scholar] [CrossRef]
  30. Durán, J.; Rodríguez, A.; Fernández-Palacios, J.M.; Gallardo, A. Changes in net N mineralization rates and soil N and P pools in a pine forest wildfire chronosequence. Biol. Fertil. Soils 2009, 45, 781–788. [Google Scholar] [CrossRef]
  31. Durán, J.; Rodríguez, A.; Fernández-Palacios, J.M.; Gallardo, A. Changes in leaf nutrient traits in a wildfire chronosequence. Plant Soil 2010, 331, 69–77. [Google Scholar] [CrossRef]
  32. Durán, J.; Rodríguez, A.; Méndez, J.; Morales, G.; Fernández-Palacios, J.M.; Gallardo, A. Wildfires decrease the local-scale ecosystem spatial variability of Pinus canariensis forests during the first two decades post fire. Int. J. Wildland Fire 2019, 28, 288–294. [Google Scholar] [CrossRef] [Green Version]
  33. Turco, M.; von Hardenberg, J.; AghaKouchak, A.; Llasat, M.C.; Provenzale, A.; Trigo, R.M. On the key role of droughts in the dynamics of summer fires in Mediterranean Europe. Sci. Rep. 2017, 7, 1–10. [Google Scholar]
  34. Stephens, S.L.; Agee, J.K.; Fulé, P.Z.; North, M.P.; Romme, W.H.; Swetnam, T.W.; Turner, M.G. Managing forests and fire in changing climates. Science 2013, 342, 41–42. [Google Scholar] [CrossRef] [PubMed]
  35. Enright, N.J.; Fontaine, J.B.; Bowman, D.M.; Bradstock, R.A.; Williams, R.J. Interval squeeze: Altered fire regimes and demographic responses interact to threaten woody species persistence as climate changes. Front. Ecol. Environ. 2015, 13, 265–272. [Google Scholar] [CrossRef] [Green Version]
  36. Abatzoglou, J.T.; Williams, A.P. Impact of anthropogenic climate change on wildfire across western US forests. Proc. Natl. Acad. Sci. USA 2016, 113, 11770–11775. [Google Scholar] [CrossRef] [Green Version]
  37. Turco, M.; Rosa-Cánovas, J.J.; Bedia, J.; Jerez, S.; Montávez, J.P.; Llasat, M.C.; Provenzale, A. Exacerbated fires in Mediterranean Europe due to anthropogenic warming projected with non-stationary climate-fire models. Nat. Commun. 2018, 9, 3821. [Google Scholar] [CrossRef] [PubMed]
  38. Harter, D.; Irl, S.; Seo, B.; Steinbauer, M.; Gillespie, R.G.; Triantis, K.A.; Fernandez-Palacios, J.M.; Beierkuhnlein, C. Impacts of global climate change on the floras of oceanic islands—Projections, implications and current knowledge. Perspect. Plant Ecol. Evol. Syst. 2015, 17, 160–183. [Google Scholar] [CrossRef]
  39. Luis, V.C.; Jiménez, M.S.; Morales, D.; Kucera, J.; Wieser, G. Canopy transpiration of a Canary Islands pine forest. Agric. For. Meteorol. 2005, 135, 117–123. [Google Scholar] [CrossRef]
  40. Wieser, G.; Brito, P.; Lorenzo, J.R.; González-Rodríguez, Á.M.; Morales, D.; Jiménez, M.S. Canary Island pine (Pinus canariensis), an evergreen species in a semiarid treeline. Prog. Bot. 2016, 77, 415–435. [Google Scholar]
  41. Climent, J.; López, R.; González, S.; Gil, L. El pino canario (Pinus canariensis), una especie singular. Ecosistemas 2007, 16, 80–89. [Google Scholar]
  42. Whittaker, R.J.; Fernández-Palacios, J.M. Island Biogeography: Ecology, Evolution, and Conservation, 2nd ed.; Oxford University Press: Oxford, UK; New York, NY, USA, 2007; p. 416. [Google Scholar]
  43. Beierkuhnlein, C.; Walentowitz, A.; Welss, W. FloCan—A revised checklist for the flora of the Canary Islands. Diversity 2021, 13, 480. [Google Scholar] [CrossRef]
  44. Irl, S.D.; Steinbauer, M.J.; Messinger, J.; Blume-Werry, G.; Palomares-Martínez, Á.; Beierkuhnlein, C.; Jentsch, A. Burned and devoured—Introduced herbivores, fire, and the endemic flora of the high-elevation ecosystem on La Palma, Canary Islands. Arct. Antarc. Alp. Res. 2014, 46, 859–869. [Google Scholar] [CrossRef] [Green Version]
  45. Arévalo, J.R.; Fernández-Palacios, J.M.; Jiménez, M.J.; Gil, P. The effect of fire intensity on the understory species composition of two Pinus canariensis reforested stands in Tenerife (Canary Islands). For. Ecol. Manag. 2001, 148, 21–29. [Google Scholar] [CrossRef]
  46. Gómez-González, S.; Torres-Díaz, C.; Valencia, G.; Torres-Morales, P.; Cavieres, L.A.; Pausas, J.G. Anthropogenic fires increase alien and native annual species in the Chilean coastal matorral. Divers. Distrib. 2011, 17, 58–67. [Google Scholar] [CrossRef]
  47. Carracedo, H.C.; Pérez Torrado, F.J.; Ancochea, E.; Meco, J.; Hernán, F.; Cubas, C.R.; Casillas, R.; Rodriguez, E.; Ahijado, A. Cenozoic volcanism II: The Canary Island. In The Geology of Spain, 1st ed.; Gibbon, W., Moreno, T., Eds.; The Geological Society: London, UK, 2002; pp. 439–472. [Google Scholar]
  48. Garzón-Machado, V.; Otto, R.; del Arco Aguilar, M.J. Bioclimatic and vegetation mapping of a topographically complex oceanic island applying different interpolation techniques. Int. J. Biometeorol. 2014, 58, 887–899. [Google Scholar] [CrossRef] [PubMed]
  49. Weigel, R.; Irl, S.D.; Treydte, K.; Beierkuhnlein, C.; Berels, J.; Field, R.; Miranda, J.C.; Steinbauer, A.; Steinbauer, M.J.; Jentsch, A. A novel dendroecological method finds a non-linear relationship between elevation and seasonal growth continuity on an island with trade wind-influenced water availability. AoB Plants 2018, 10, ply070. [Google Scholar] [CrossRef] [PubMed] [Green Version]
  50. Gascon, F.; Cadau, E.; Colin, O.; Hoersch, B.; Isola, C.; Fernández, B.L.; Martimort, P. Copernicus Sentinel-2 Mission: Products, Algorithms and Cal/Val. Earth Obs. Syst. XIX 2014, 9218, 92181E. [Google Scholar]
  51. Drusch, M.; Del Bello, U.; Carlier, S.; Colin, O.; Fernandez, V.; Gascon, F.; Hoersch, B.; Isola, C.; Laberinti, P.; Martimort, P.; et al. Sentinel-2: ESA’s optical high-resolution mission for GMES operational services. Remote Sens. Environ. 2012, 120, 25–36. [Google Scholar] [CrossRef]
  52. Navarro, G.; Caballero, I.; Silva, G.; Parra, P.C.; Vázquez, Á.; Caldeira, R. Evaluation of forest fire on Madeira Island using Sentinel-2A MSI imagery. Int. J. Appl. Earth Obs. Geoinf. 2017, 58, 97–106. [Google Scholar] [CrossRef] [Green Version]
  53. Pádua, L.; Guimarães, N.; Adão, T.; Sousa, A.; Peres, E.; Sousa, J.J. Effectiveness of sentinel-2 in multi-temporal post-fire monitoring when compared with UAV imagery. ISPRS Int. J. Geoinf. 2020, 9, 225. [Google Scholar] [CrossRef] [Green Version]
  54. Quintano, C.; Fernández-Manso, A.; Fernández-Manso, O. Combination of landsat and sentinel-2 MSI data for initial assessing of burn severity. Int. J. Appl. Earth Obs. Geoinf. 2018, 64, 221–225. [Google Scholar] [CrossRef]
  55. Chen, X.; Vogelmann, J.E.; Rollins, M.; Ohlen, D.; Key, C.H.; Yang, L.; Hunga, C.; Shi, H. Detecting post-fire burn severity and vegetation recovery using multitemporal remote sensing spectral indices and field-collected composite burn index data in a ponderosa pine forest. Int. J. Remote Sens. 2011, 32, 7905–7927. [Google Scholar] [CrossRef]
  56. Justice, C.O.; Giglio, L.; Korontzi, S.; Owens, J.; Morisette, J.T.; Roy, D.; Descloitres, J.; Alleaume, S.; Petitcolin, F.; Kaufman, Y. The MODIS fire products. Remote Sens. Environ. 2002, 83, 244–262. [Google Scholar] [CrossRef]
  57. Hernández-Leal, P.A.; González-Calvo, A.; Arbelo, M.; Barreto, A.; Alonso-Benito, A. Synergy of GIS and remote sensing data in forest fire danger modeling. IEEE J. Sel. Top. Appl. Earth Obs. Remote Sens. 2008, 1, 240–247. [Google Scholar] [CrossRef]
  58. Levin, N.; Heimowitz, A. Mapping spatial and temporal patterns of Mediterranean wildfires from MODIS. Remote Sens. Environ. 2012, 126, 12–26. [Google Scholar] [CrossRef]
  59. Frantz, D. FORCE—Landsat+ Sentinel-2 analysis ready data and beyond. Remote Sens. 2019, 11, 1124. [Google Scholar] [CrossRef] [Green Version]
  60. Bivand, R.; Keitt, T.; Rowlingson, B. Rgdal: Bindings for the ’Geospatial’ Data Abstraction Library, R package version 1.5-23; Available online: http://cran.r-project.org/%0Apackage=rgdal (accessed on 22 November 2021).
  61. Hijmans, R.J. Raster: Geographic Data Analysis and Modeling, R package version 3.4-5; Available online: https://cran.r-project.org/web/packages/raster/ (accessed on 22 November 2021).
  62. R Core Team. R: A Language and Environment for Statistical Computing. R Foundation for Statistical Computing: Vienna, Austria. Available online: https://www.r-project.org/ (accessed on 22 November 2021).
  63. Amici, V.; Rocchini, D.; Filibeck, G.; Bacaro, G.; Santi, E.; Geri, F.; Landi, S.; Scoppola, A.; Chiarucci, A. Landscape structure effects on forest plant diversity at local scale: Exploring the role of spatial extent. Ecol. Complex. 2015, 21, 44–52. [Google Scholar] [CrossRef]
  64. Chuvieco, E.; Martin, M.P.; Palacios, A. Assessment of different spectral indices in the red-near-infrared spectral domain for burned land discrimination. Int. J. Remote Sens. 2002, 23, 5103–5110. [Google Scholar] [CrossRef]
  65. Key, C.H.; Benson, N.; Ohlen, D.; Howard, S.; McKinley, R.; Zhu, Z. The normalized burn ratio and relationships to burn severity: Ecology, remote sensing and implementation. In Proceedings of the Ninth Forest Service Remote Sensing Applications Conference, San Diego, CA, USA, 8–12 April 2002; Greer, J.D., Ed.; American Society for Photogrammetry and Remote Sensing: Bethesda, MD, USA, 2002. [Google Scholar]
  66. Tree Cover Density 201—Copernicus Land Monitoring Service. Available online: https://land.copernicus.eu/pan-european/high-resolution-layers/forests/tree-cover-density/status-maps/2015 (accessed on 24 November 2021).
  67. Jenness, J.S. Calculating landscape surface area from digital elevation models. Wildl. Soc. Bull. 2004, 32, 829–839. [Google Scholar] [CrossRef]
  68. Riley, S.J.; DeGloria, S.D.; Elliot, R. A terrain ruggedness index that quantifies topographic heterogeneity. Intermt. J. Sci. 1999, 5, 23–27. [Google Scholar]
  69. Bitterlich, W. Die Winkelzählprobe. Forstwiss. Cent. 1952, 71, 215–225. [Google Scholar] [CrossRef]
  70. Wei, T.; Simko, V. R Package “Corrplot”: Visualization of a Correlation Matrix (Version 0.84). Available online: https://cran.r-project.org/web/packages/corrplot/ (accessed on 22 November 2021).
  71. Signorell, A.; Aho, K.; Alfons, A.; Anderegg, N.; Aragon, T.; Arppe, A. DescTools: Tools for Descriptive Statistics, R package version 0.99; Available online: https://cran.r-project.org/web/packages/DescTools/ (accessed on 22 November 2021).
  72. Bivand, R.; Altman, M.; Anselin, L.; Assunção, R.; Berke, O.; Bernat, A.; Blanchet, G.; Blankmeyer, E.; Carvalho, M.; Christensen, B.; et al. Spdep: Spatial Dependence: Weighting Schemes, Statistics and Models. Available online: https://cran.r-project.org/web/packages/spdep/ (accessed on 22 November 2021).
  73. Bivand, R.; Piras, G. Spatialreg: Spatial Regression Analysis. Available online: https://cran.r-project.org/web/packages/spatialreg/ (accessed on 22 November 2021).
  74. Kissling, W.D.; Carl, G. Spatial autocorrelation and the selection of simultaneous autoregressive models. Glob. Ecol. Biogeogr. 2008, 17, 59–71. [Google Scholar] [CrossRef]
  75. Kreft, H.; Jetz, W. Global patterns and determinants of vascular plant diversity. Proc. Natl. Acad. Sci. USA 2007, 104, 5925–5930. [Google Scholar] [CrossRef] [Green Version]
  76. Tognelli, M.F.; Kelt, D.A. Analysis of determinants of mammalian species richness in South America using spatial autoregressive models. Ecography 2004, 27, 427–436. [Google Scholar] [CrossRef]
  77. Irl, S.D.; Harter, D.E.; Steinbauer, M.J.; Gallego Puyol, D.; Fernández-Palacios, J.M.; Jentsch, A.; Beierkuhnlein, C. Climate vs. topography–spatial patterns of plant species diversity and endemism on a high-elevation island. J. Ecol. 2015, 103, 1621–1633. [Google Scholar] [CrossRef]
  78. Legendre, P.; Anderson, M.J. Distance-based redundancy analysis: Testing multispecies responses in multifactorial ecological experiments. Ecol. Monogr. 1999, 69, 1–24. [Google Scholar] [CrossRef]
  79. Anderson, M.J.; Crist, T.O.; Chase, J.M.; Vellend, M.; Inouye, B.D.; Freestone, A.L.; Sanders, N.J.; Cornell, H.V.; Comita, L.S.; Davies, K.F.; et al. Navigating the multiple meanings of β diversity: A roadmap for the practicing ecologist. Ecol. Lett. 2011, 14, 19–28. [Google Scholar] [CrossRef]
  80. Odum, E.P. Bird populations of the Highlands (North Carolina) Plateau in relation to plant succession and avian invasion. Ecology 1950, 31, 587–605. [Google Scholar] [CrossRef]
  81. Legendre, P.; De Cáceres, M. Βeta-diversity as the variance of community data: Dissimilarity coefficients and partitioning. Ecol. Lett. 2013, 16, 951–963. [Google Scholar] [CrossRef] [PubMed]
  82. Oksanen, J.; Guillaume Blanchet, F.; Friendly, M.; Kindt, R.; Legendre, P.; McGlinn, D.; Minchin, P.R.; O’Hara, R.B.; Simpson, G.L.; Solymos, P.; et al. Vegan: Community Ecology Package, R package version 2.5-6; Available online: https://cran.r-project.org/web/packages/vegan/ (accessed on 22 November 2021).
  83. Wang, I. topoDistance: Calculating Topographic Paths and Distances, R package version 1.0.1; Available online: https://cran.r-project.org/web/packages/topoDistance/ (accessed on 22 November 2021).
  84. Anderson, M.J. A new method for non-parametric multivariate analysis of variance. Austral Ecol. 2001, 26, 32–46. [Google Scholar]
  85. Dray, S.; Bauman, D.; Blanchet, G.; Borcard, D.; Clappe, S.; Guenard, G.; Jombart, T.; Larocque, G.; Legendre, P.; Madi, N.; et al. adespatial: Multivariate Multiscale Spatial Analysis, R package version 0.3-8; Available online: https://cran.r-project.org/web/packages/adespatial/ (accessed on 22 November 2021).
  86. Halpern, C.B. Early successional pathways and the resistance and resilience of forest communities. Ecology 1988, 69, 1703–1715. [Google Scholar] [CrossRef]
  87. Steinbauer, M.J.; Irl, S.; González, J.M.; Breiner, F.; Hernández Hernández, R.M.; Hopfenmüller, S.; Kidane, Y.; Jentsch, A.; Beierkuhnlein, C. Plant invasion and speciation along elevational gradients on the oceanic island La Palma, Canary Islands. Ecol. Evol. 2017, 7, 771–779. [Google Scholar] [CrossRef] [Green Version]
  88. Garzón-Machado, V.; del Arco Aguilar, M.J.; González, F.V.; Pérez-de-Paz, P.L. Fire as a threatening factor for endemic plants of the Canary Islands. Biodivers. Conserv. 2012, 21, 2621–2632. [Google Scholar] [CrossRef]
  89. Sánchez Sánchez, Y.; Martínez-Graña, A.; Santos Francés, F.; Mateos Picado, M. Mapping wildfire ignition probability using sentinel 2 and LiDAR (Jerte Valley, Cáceres, Spain). Sensors 2018, 18, 826. [Google Scholar] [CrossRef] [Green Version]
  90. Teodoro, A.; Amaral, A. A statistical and spatial analysis of Portuguese forest fires in summer 2016 considering Landsat 8 and Sentinel 2A data. Environments 2019, 6, 36. [Google Scholar] [CrossRef] [Green Version]
  91. Filipponi, F. Exploitation of sentinel-2 time series to map burned areas at the national level: A case study on the 2017 Italy wildfires. Remote Sens. 2019, 11, 622. [Google Scholar] [CrossRef] [Green Version]
  92. Evangelides, C.; Nobajas, A. Red-edge normalised difference vegetation index (NDVI705) from sentinel-2 imagery to assess post-fire regeneration. Remote Sens. Appl. Soc. Environ. 2020, 17, 100283. [Google Scholar] [CrossRef]
  93. Richter, C.; Rejmánek, M.; Miller, J.E.; Welch, K.R.; Weeks, J.; Safford, H. The species diversity × fire severity relationship is hump-shaped in semiarid yellow pine and mixed conifer forests. Ecosphere 2019, 10, e02882. [Google Scholar] [CrossRef]
  94. Miller, J.E.; Safford, H.D. Are plant community responses to wildfire contingent upon historical disturbance regimes? Glob. Ecol. Biogeogr. 2020, 29, 1621–1633. [Google Scholar] [CrossRef]
  95. Hoffmann, S.; Schmitt, T.M.; Chiarucci, A.; Irl, S.D.; Rocchini, D.; Vetaas, O.R.; Tanase, M.A.; Mermoz, S.; Bouvet, A.; Beierkuhnlein, C. Remote sensing of β-diversity: Evidence from plant communities in a semi-natural system. Appl. Veg. Sci. 2019, 22, 13–26. [Google Scholar] [CrossRef] [Green Version]
  96. Tuomisto, H. A diversity of beta diversities: Straightening up a concept gone awry. Part 1. Defining beta diversity as a function of alpha and gamma diversity. Ecography 2010, 33, 2–22. [Google Scholar] [CrossRef]
  97. Tuomisto, H. A diversity of beta diversities: Straightening up a concept gone awry. Part 2. Quantifying beta diversity and related phenomena. Ecography 2010, 33, 23–45. [Google Scholar] [CrossRef]
  98. Jurasinski, G.; Retzer, V.; Beierkuhnlein, C. Inventory, differentiation, and proportional diversity—a consistent terminology for quantifying biodiversity. Oecologia 2009, 159, 15–26. [Google Scholar] [CrossRef] [PubMed] [Green Version]
  99. Myers, J.A.; Chase, J.M.; Crandall, R.M.; Jiménez, I. Disturbance alters beta-diversity but not the relative importance of community assembly mechanisms. J. Ecol. 2015, 103, 1291–1299. [Google Scholar] [CrossRef] [Green Version]
  100. Sandral, G.; Remizowa, M.V.; Sokoloff, D.D. A taxonomic survey of Lotus section Pedrosia (Leguminosae, Loteae). Wulfenia 2006, 13, 97–192. [Google Scholar]
  101. Irl, S.D.; Obermeier, A.; Beierkuhnlein, C.; Steinbauer, M.J. Climate controls plant life-form patterns on a high-elevation oceanic island. J. Biogeogr. 2020, 47, 2261–2273. [Google Scholar] [CrossRef]
Figure 1. Changes in the Normalized Difference Vegetation Index (NDVI) on the western slopes of the Cumbre Vieja due to a fire in August 2016. The NDVI difference was calculated from two Sentinel-2 images from 18 July to 17 August 2016. The sampling sites of this study are marked with blue dots. The NDVI change in the upper right corner was caused by clouds and therefore masked out.
Forests 12 01638 g001
Figure 2. Thick patchy layers of herbaceous Lotus campylocladus ssp. hillebrandii one year after forest fire on steep slopes in the southern part of La Palma. Burned Pinus canariensis trees are re-sprouting from branches and trunks. It will take several years until canopy closure can be reached again (Photo Carl Beierkuhnlein).
Forests 12 01638 g002
Figure 3. Species richness against (a) Elevation (m), (b) ΔNDVI, and (c) Tree cover (RS) for 79 plots of size 10 m × 10 m. Crosses represent sampling plots with less than 10% Lotus campylocladus ssp. hillebrandii cover; circles more than 10% cover. The lines represent the fitted GLMs: (a) Species richness ~ Elevation + Elevation2 (Nagelkerke’s pseudo-R2 = 0.81); (b) Species richness ~ ΔNDVI + ΔNDVI2 (pseudo-R2 = 0.33); (c) Species richness ~ Tree cover (RS) (pseudo-R2 = 0.70). Tree cover (RS) represents the canopy cover before the fire and was extracted from the Copernicus “Tree cover density” product. See Table 2 for more detailed model coefficients.
Forests 12 01638 g003
Figure 4. Results of the dbRDA with and without Lotus campylocladus ssp. hillebrandii: (a) includes Lotus campylocladus ssp. hillebrandii cover both as a species and as an environmental variable. (b) excludes Lotus campylocladus ssp. hillebrandii cover as an environmental variable. Black squares mark distribution of species, which are mostly grouped around the center. Sites are shown as black crosses and circles, with the crosses signifying sites with a Lotus campylocladus ssp. hillebrandii cover below 10% and circles above 10%. Red arrows represent significant (p < 0.05) environmental variables. Variable names were partially abbreviated for clarity: LC= Lotus cover, SC = Shrub cover, Incl = Inclination, TCI = Topographic complexity index, TRI = Terrain ruggedness index, E = Eastness, N = Northness, LD mean = mean Litter depth, LD sd = standard deviation of Litter depth, DBH mean = mean Diameter at breast height, DBH sd = standard deviation of DBH, CAP1 and CAP2 are the first two constrained axes of the dbRDA. Tree cover (field) is the canopy cover estimated after the fire, Tree cover (RS) is the canopy cover before the fire as derived from the “Tree cover density” product from Copernicus. Non-significant variables were not plotted, to improve clarity. For (a), these were ΔNDVI, DBH sd, LD sd, TRI, TCI, Inclination, SC, Northness, and Eastness. For (b), these were DBH sd, LD sd, Northness, Eastness, and TRI.
Forests 12 01638 g004aForests 12 01638 g004b
Figure 5. Variance in Canary Island pine forest beta diversity explained by fire impact and topography, tested by variance partitioning. Fire intensity (modelled using ΔNDVI+ΔNDVI2) and topography (Elevation + Elevation2 + Inclination + Northness + Eastness + TCI + TRI) are crucial drivers of the Bray–Curtis dissimilarity of plant species across the 79 plots. The community data were split into four subsets: all plant species recorded in the plots, all plant species without Pinus canariensis, all plant species without Lotus campylocladus ssp. hillebrandii, all plant species without P. canariensis and Lotus campylocladus ssp. hillebrandii, because these two species gained dominance in the canopy or in the field layer, respectively. Overall, fire impact accounted for between 1.7% and 4.3% of the variance in Bray–Curtis dissimilarity, and topography from 18.1% to 24.7%. The biggest percentages of explained variance were attained in the data subset including only P. canariensis.
Forests 12 01638 g005
Figure 6. Plots with more than 10% cover of Lotus campylocladus ssp. hillebrandii (left) and below 10% (right) and their (a) Species richness, (b) Local contributions to beta diversity (LCBD), and (c) Elevation. All the differences between Lotus-cover groups were significant (Wilcoxon test).
Forests 12 01638 g006
Figure 7. Species contributions to beta diversity (SCBD) based on Bray–Curtis dissimilarity, grouped by legume species vs. non-legume species (“Nitrogen Fixer”), and herbaceous vs. woody species. Nitrogen-fixing legume species contributed more to local beta diversity than other herbs did. The same is true for herbaceous species compared to woody species. Nitrogen fixing species, while making up only 25% of species, contribute 59.5% of species cover and were responsible for 75% of SCBDs, and non-legumes for 25% of SCBDs. Herbaceous plants (81% of species) contributed 78% to SCBDs while contributing only 61% of cover. Woody plants are responsible for 22% of SCBDs, while making up 19% of species and 39% of species cover.
Forests 12 01638 g007
Table 1. Measured environmental variables. Cover values were estimated for all species within each plot. Additionally, Canopy cover, Shrub cover, Herb cover, and Rock cover were estimated. Basal area was measured using angle count sampling [69]. Diameter at breast height (DBH) was measured for ten trees within the plot. Aspect and Inclination were recorded using a compass with an inclinometer. Aspect was also converted from degrees to both ‘Northness’ and ‘Eastness’ which were calculated by applying the cosine and the sine function respectively to the measured aspect. Litter depth was calculated by pushing a thin metal rod into the litter until soil or bedrock was hit. Litter depth was measured at four random points within the plot. For both DBH and Litter depth, a mean value and the standard deviation of all measurements were calculated for use in the statistical analysis.
CategoryVariableUnitSource
VegetationSpecies cover%Field measurement
Herb/shrub cover estimates%Field measurement
Canopy cover%Field measurement
Litter depthcmField measurement
Basal aream2/haField measurement
Diameter at breast height (DBH)cmField measurement
TopographyRock cover%Field measurement
Inclination%Field measurement
ElevationmCabildo Insular DEM (2m resolution)
AspectNorthness and EastnessField measurement, converted with the cosine and sine function
Table 2. Model coefficients of the different GLMs: species richness modelled first by Elevation + Elevation2, then by ΔNDVI + ΔNDVI2, then by Tree cover from remote sensing, and finally by the multi-predictor GLM Elevation + Elevation2 + Tree cover (field) + Tree cover (field)2 + Northness + Eastness + DBH mean + Litter depth mean + ΔNDVI + ΔNDVI2 + Tree cover (RS). DBH mean is the mean diameter at breast height of ten trees in the plot.
Species Richness~EstimateStd. Errorz valuePr (>|z|)Significance
(Intercept)11.72.374.92<0.001***
Elevation−0.0120.00363−3.3<0.001***
Elevation23.57 × 10−61.37 × 10−62.610.009**
R2 Nagelkerke0.81 AIC464.68
Species richness~EstimateStd. Errorz valuePr (>|z|)
(Intercept)2.720.4855.62<0.001***
ΔNDVI5.052.551.980.0476*
ΔNDVI 28.93.232.750.0059**
R2 Nagelkerke0.33 AIC565.9
Species richness~EstimateStd. Errorz valuePr (>|z|)
(Intercept)
Tree cover (RS)
1.27
0.018
0.107
0.00179
11.9
10.1
<0.001
<0.001
***
***
R2 Nagelkerke0.70 AIC565.9
Species richness~EstimateStd. Errorz valuePr (>|z|)
(Intercept)7.632.992.550.0108*
Elevation−0.01020.00457−2.230.0255*
Elevation23.02 × 10−61.71 × 10−61.770.0763
Tree cover (field)0.01010.01350.7460.456
Tree cover (field)2−0.0003820.000201−1.90.0578
Northness0.220.08442.610.00898**
Eastness−0.1660.108−1.540.123
DBH mean0.02090.006773.090.00202**
Litter depth mean0.1260.0472.660.00774**
ΔNDVI−6.22.77−2.240.0252*
ΔNDVI2−6.073.65−1.660.0963
Tree cover (RS)0.006190.002262.740.0062**
R2 Nagelkerke0.935 AIC400
The last column marks the level of significance of variables, with *** representing a p-value < 0.001, ** below 0.01 and * below 0.05.
Table 3. Mantel test statistic between Bray–Curtis dissimilarity, difference in ΔNDVI between plots (ΔΔNDVI), the Topographic distance, and the Euclidian distance between sampling points in terms of their environmental variables. Topographic distance means the “real” distance between datapoints following the surface of a digital elevation model. ΔΔNDVI represents the difference between the ΔNDVI values of sampling points and therefore the difference in fire severity between different plots. Numerical values represent the Mantel R. The Mantel test revealed significant correlations (marked by asterisks) between the Bray–Curtis dissimilarity and both the topographic distance and the environmental distance.
Bray–Curtis
Dissimilarity
ΔΔNDVITopographic DistanceEnvironmental Distance
Bray–Curtis
Dissimilarity
-0.020.31 *0.35 *
ΔΔNDVI0.02-−0.120.17 *
Topographic
Distance
0.31 *−0.01-0.18 *
Environmental Distance0.35 *0.17 *0.18 *-
* p-value below 0.05.
Publisher’s Note: MDPI stays neutral with regard to jurisdictional claims in published maps and institutional affiliations.

