
Abstract
A better understanding of the cathode active material (CAM) plays a crucial role in the improvement of lithium-ion batteries. We have previously reported the structural properties of the model cathode material LiNiO2 (LNO) in dependence of its calcination conditions and found that the deviation from the ideal stoichiometry in LiNiO2 (Ni excess) shows no correlation to the 1st cycle capacity loss. Rather, the morphology of LNO appears to be decisive. As CAM secondary agglomerates fracture during battery operation, the surface area in contact with the electrolyte changes during cycle life. Thus, particle morphology and especially the primary particle size become critical and are analyzed in detail in this report for LNO, using an automated SEM image segmentation method. It is shown that the accessible surface area of the pristine CAM powder measured by physisorption is close to the secondary particle geometric surface area. The interface area between CAM and electrolyte is measured by an in situ capacitance method and approaches a value proportional to the estimated primary particle surface area determined by SEM image analysis after just a few cycles. This interface area is identified to be the governing factor determining the 1st cycle capacity loss and long-term cycling behavior.
Export citation and abstract BibTeX RIS

Content from this work may be used under the terms of the Creative Commons Attribution 4.0 licence. Any further distribution of this work must maintain attribution to the author(s) and the title of the work, journal citation and DOI.
In part I of this study, 1 the impact of the crystal structure on the initial reversibility of Li1-zNi1+zO2 was investigated and it was shown that, for small off-stoichiometry (z = 0.016–0.037), the excess Ni2+ in the Li layer does not explain the observed differences of the 1st cycle capacity loss. Besides the crystal structure, a key property of cathode active materials (CAMs) is their morphology. For commonly used CAMs, e.g., the commercially relevant layered transition metal oxides Li(Ni1-x-y Cox Mny )O2 (NCM) and Li(Ni1-x-y Cox Aly )O2 (NCA), the morphology can be subdivided into the secondary particle and primary particle scale. 2 The secondary particle morphology can typically be described as approximately spherical agglomerates in the size range of 5− 15 μm that are built up from primary particles in the size range of a few hundred nm, with the primary particles in turn consisting of one or a few crystal domains. 3 The size of the secondary particle agglomerates is set during precipitation of the transition metal precursor, 4–6 and the primary particle size is determined by the calcination conditions as well as the chemical composition and morphology of the respective precursor. 7–10 In the first part of this study, it was found that there is some correlation, albeit not fully satisfactory, between the 1st cycle capacity loss and the average crystallite size determined by Rietveld refinement of synchrotron powder X-ray diffraction patterns. However, it was also highlighted that the refined crystallite size values just reflect averages over the whole powder samples.
Particle morphology of NCM materials has been in the focus of many recent studies, reporting improved electrochemical performances for "single crystal" materials 11–15 or materials with tailored orientation of the primary particles in regard to their secondary particle microstructure. 16–18 Liu et al. reported a correlation of the 1st cycle capacity loss of Ni-rich CAMs with increasing primary and secondary particle sizes. 19 However, a quantitative analysis of the particle size influence is still lacking. Thus, in this study a quantitative evaluation of the primary particle size distribution using an automated SEM image analysis is performed on a set of 18 LNO samples. The resulting primary particle size distributions as well as the secondary particle size distributions determined by laser scattering are compared to the outcome of krypton physisorption measurements for the pristine CAM powders. Furthermore, it is shown that post-processing of the CAM can change the specific surface area, for example by washing, which is often applied in industry to reduce the amount of Li residual salts after calcination. 20–22
Using an in situ capacitance measurement approach introduced by Oswald et al., 23 the interface area between CAM and electrolyte is monitored in half-cells during the initial cycles. For LNO it has repeatedly been reported that fracturing of the secondary particle agglomerates occurs when cycled over a critical voltage cut-off 24,25 and the concurrent intrusion of the electrolyte into the inner parts of the secondary particle structure increases the said interface area. Thus, as shown by Ruess et al., the increased interface area leads to a decrease of the areal current density when referenced to the electrochemically active surface area, and thus to improved lithiation kinetics during discharge. 26 Here, we report that the interface area becomes proportional to the primary particle specific surface area estimated by SEM image segmentation, and therefore remarkably impacts the electrochemical properties. In this regard, the differences in 1st cycle capacity loss for a large set of LNO samples can be explained. Further correlations with key electrochemical parameters (resistance build-up, cycling stability) have also been found and will be described. Finally, the importance of morphological control in future studies is highlighted.
Experimental
Sample preparation
The investigated LNO samples were synthesized by a solid-state reaction starting from LiOH monohydrate and Ni(OH)2 precursors, as described in part I of this study. 1 The secondary particle size of the Ni(OH)2 precursor (nominally 4 μm and 12 μm), the maximum calcination temperature (680 °C, 700 °C and 720 °C), and the number of Li equivalents per mol of Ni (0.98, 1.01, 1.04) were varied.
Scanning electron microscopy (SEM) imaging
For the measurement of top-view images, a small amount of cathode powder was fixed on a SEM pin holder (Agar Scientific, Ltd.) covered with conducting carbon cement (Plano GmbH). It was coated with a 6 nm thick platinum layer by sputter deposition (SCD 500 Sputter Coater, Bal-Tec AG). Measurements were performed using a SEM with a thermal field emission cathode and an Everhart-Thornley secondary electron detector at an operating voltage of 5 kV (Ultra 55, Carl Zeiss AG). Samples for cross section measurements were prepared by initially mixing 2 g of epoxy resin and 0.5 g of epoxy hardener (Buehler, ITW Test & Measurement GmbH), adding a few drops of the mixture to a small amount of cathode powder in a gelatine capsule, followed by 2 min of mixing with a spatula. Afterwards, the slurries were cast onto an Al-foil using a manual coater with a gap size of 0.5 mm and dried in an oven (Heraeus Holding GmbH) at 40 °C over night. Smaller sections were prepared with a scalpel, mounted on a customized mask and aligned with an optical microscope. Then, the samples were transferred to an ion milling system (ArBlade 5000, Hitachi, Ltd.), and cross sections were prepared by milling with an Ar ion beam at an operating voltage of 6 kV for two h. Images were taken as described above for the top-view measurements.
Image segmentation
The algorithm used for image segmentation is based on a convolutional neural network using the U-Net architecture, which was initially developed for applications in biomedical image segmentation.
27
The algorithm takes the measured SEM intensity image as input and generates a score image, which assigns every pixel to an index of the particle it belongs to. A training data set was manually generated to train the algorithm with exemplary SEM images depicting typical CAM secondary agglomerates in the desired magnification. Raw lengths and areas were reported in the dimension of pixels and were afterwards converted to actual lengths and areas using a calibration factor from the image metadata. To increase the robustness of the segmentation, a post-processing step was performed. Firstly, regions touching the boundary of the image were rejected. Secondly, only objects were quantitatively evaluated, which fulfilled the following three criteria: the object had to have an area of 200 pixels or more, the compactness (ratio between the object's area and its convex hull) had to be ≥ 0.8, and the circularity (4π times the area divided by the perimeter squared; circularity equals one for a perfect circle) had to be ≥ 0.6. These criteria ascertained that only primary particles which did not deviate too much from the expected nearly spherical shape were recognized. The size of a primary particle was quantified by taking the area of the particle ( ) after segmentation and calculating the diameter of a circle with the same area, referred to as equivalent diameter deq in Eq. 1.

Ten top view SEM images in 20 k magnification were measured for each of the 18 LNO samples to have a sufficient amount of particles for proper statistical evaluation.
To validate that the segmentation model worked properly for the LNO samples under study and to exclude any potential bias of the algorithm, a comparison with manually segmented images was made. For this purpose, manual segmentation was done for three representative samples and three images per sample using the ImageJ software. 28,29 Moreover, for a comparison of the particle size distribution between the surface of a secondary particle and its inner parts, cross section SEM images were analyzed for the same three representative samples again using the manual segmentation method with ImageJ.
Particle size distribution by laser scattering
Samples were prepared by dispersing a small amount of cathode powder in deionized H2O. Measurement of the particle size distribution was performed using laser scattering based on the Mie scattering theory (Mastersizer 2000, Malvern Panalytical GmbH). The cathode particles were assumed to have a refractive index of 2.19 (refractive index of NiO as specified by the supplier), and 1.33 was taken for deionized H2O as dispersant. The intensity of the scattered laser beam was measured as a function of the scattering angle for particle sizes in the range of 0.05 μm to 70 μm (a combination of red and blue light was utilized). Three measurements per sample were performed, and average values were calculated.
Physisorption
Physisorption measurements were performed to analyze the specific surface area of the pristine CAM powders. For this purpose, ∼1 g of CAM was filled into the chamber of a gas sorption analyzer (Autosorb-iQ, Quantachrome Instruments, Anton Paar GmbH). Prior to the measurement, the powders were degassed at 120 °C for three hours. Krypton was used as adsorptive due to its higher accuracy when measuring low surface areas (typically < 1 m2 for CAMs and small sample amounts), and the temperature during experiments was set to 77 K. Specific surface areas could be extracted from the adsorption isotherms in the relative pressure range of 0.05 < p/p0 < 0.30 using the Brunauer-Emmet-Teller (BET) theory.
Washing of CAMs was performed by adding deionized H2O in a CAM:H2O weight ratio of 1:5 and stirring for 20 min at a stirring speed of 200 rpm on a magnetic stirrer plate at room temperature. Afterwards, the washed CAMs were filtrated and dried in a glass oven (B585, Büchi Labortechnik AG) at 120 °C under dynamic vacuum for 12 h.
Electrode preparation
Electrodes for electrochemical characterization were prepared by mixing the sample powders with conductive carbon (C65, Imerys Graphite & Carbon) and PVDF binder (Solef 5130, Solvay GmbH) at a 94:3:3 mass ratio. For this, a 7.5 wt% binder solution in N-methyl-2-pyrrolidone (NMP, BASF SE) was mixed with additional NMP and the conductive carbon, and mixed for at least 24 min at 2000 rpm in a planetary mixer (ARE 250, Thinky Corporation). The CAM powders were added to the obtained slurry and were mixed for additional 10 min. The solid content of the final slurries was 61 wt%. The slurries were cast onto an Al-foil (thickness 20 μm, Nippon Light Metal Co., Ltd.) using a box-type coater (wet-film thickness 100 μm, width 6 cm, Erichsen GmbH & Co. KG) and an automated coating table (5 mm s−1, Coatmaster 510, Erichsen GmbH & Co. KG). The coated tapes were placed in a vacuum oven (VDL 23, Binder GmbH) and heated to 120 °C under dynamic vacuum for drying overnight. The dried cathode tapes were compressed using a calender (CA5, Sumet Systems GmbH) at a set line force of 30 N mm−1 and a roller speed of 0.5 m min−1. Circular electrodes with a diameter of 14 mm were punched out using a high-precision handheld punch (Nogamigiken Co., Ltd). After weighing, the electrodes were transferred to an Ar filled glovebox for cell assembly. An average loading of (8.0 ± 0.5) mg cm−2 and an electrode density of (3.0 ± 0.2) g cm−3 were obtained (corresponding to a porosity of ∼35%).
Half-cell testing
Coin half-cells were built using a 2032 coin cell geometry. The cell stack consisted of the cathode, a glass fiber separator (ø 17 mm, 300 μm thickness, GF/D, VWR International, LLC.) soaked with 95 μl electrolyte (LP57, BASF SE), and a pre-punched lithium metal anode (ø 15.8 mm, thickness 0.58 mm, purity 99.9%, Shandong Gelon LIB Co., Ltd). After assembly the cells were crimped and closed in an automated crimper (Hohsen Corp.). The cells were then transferred to a climate chamber (Binder GmbH) and connected to a battery cycler (Series4000, MACCOR, Inc.). All tests were performed at 25 °C and the C-rate was chosen according to 1 C ≡ 200 mAg−1. To calculate the 1st cycle capacity loss, the cells were charged at C/10 to 4.3 V and discharged at C/10 to 3.0 V.
Moreover, a test protocol was applied to calculate the capacitance of the half-cells as a function of cycle number, which will be described in detail in an upcoming publication.
30
Briefly, the cells were continuously cycled at C/10 with 4.3 V as upper voltage cut-off and a discharge to 2.5 V followed by a constant voltage step until the current dropped below C/250; in this fully lithiated state, the charge transfer resistance of layered transition metal oxide based CAMs becomes very large, leading to a so-called blocking condition response of the impedance.
23
In this condition, an alternating current with an amplitude of C/50 and a frequency of  = 100 mHz was modulated onto the C/250 base current. Both the modulated current and the respective voltage response were fitted to sine functions, from which the phase shift (θ) between voltage and current as well as the voltage/current amplitude ratio (Ê/Î) were obtained. These in turn were used to compute the imaginary part of the impedance at 100 mHz (Im(Zf
) = Ê/ηsin(θ)). As shown by Oswald et al.,
23
the electrode capacitance (C) of CAMs is well represented by a single impedance measurement under blocking condition at frequencies near 180 mHz (C ≈ −1/(2π·f·Im(Zf
)); normalizing this value to the mass of the electrode yields the specific capacitance of the electrode (in units of F g−1
electrode). As proven in a separate study,
30
the imaginary part of the impedance of the lithium counter electrode in this frequency range is neglibible, so that the determined capacitance closely corresponds to that of the cathode electrode. To account for the contribution of conductive carbon and PVDF binder to the measured electrode capacitance, electrodes without CAM were prepared at the same C:PVDF weight ratio of 1:1 as in the electrode, and half-cells were built as described above. Their impedance at 2.5 V and at a frequency of 100 mHz was measured with an impedance analyzer (VMP3, BioLogic GmbH & Co.KG), yielding a carbon-only electrode capacitance of 1.68 F g−1
electrode (note the higher specific capacitance in comparison to Oswald et al. due to the utilization of a carbon with higher specific surface area
23
); based on the weight fraction of C and PVDF in the LNO electrodes (i.e., 6 wt%), the contribution of carbon and binder to the LNO electrode capacitance is estimated to be 0.107 F g−1
electrode allowing then for the determination of the specific capacitance of the LNO active material only (in units of F g−1
LNO).
= 100 mHz was modulated onto the C/250 base current. Both the modulated current and the respective voltage response were fitted to sine functions, from which the phase shift (θ) between voltage and current as well as the voltage/current amplitude ratio (Ê/Î) were obtained. These in turn were used to compute the imaginary part of the impedance at 100 mHz (Im(Zf
) = Ê/ηsin(θ)). As shown by Oswald et al.,
23
the electrode capacitance (C) of CAMs is well represented by a single impedance measurement under blocking condition at frequencies near 180 mHz (C ≈ −1/(2π·f·Im(Zf
)); normalizing this value to the mass of the electrode yields the specific capacitance of the electrode (in units of F g−1
electrode). As proven in a separate study,
30
the imaginary part of the impedance of the lithium counter electrode in this frequency range is neglibible, so that the determined capacitance closely corresponds to that of the cathode electrode. To account for the contribution of conductive carbon and PVDF binder to the measured electrode capacitance, electrodes without CAM were prepared at the same C:PVDF weight ratio of 1:1 as in the electrode, and half-cells were built as described above. Their impedance at 2.5 V and at a frequency of 100 mHz was measured with an impedance analyzer (VMP3, BioLogic GmbH & Co.KG), yielding a carbon-only electrode capacitance of 1.68 F g−1
electrode (note the higher specific capacitance in comparison to Oswald et al. due to the utilization of a carbon with higher specific surface area
23
); based on the weight fraction of C and PVDF in the LNO electrodes (i.e., 6 wt%), the contribution of carbon and binder to the LNO electrode capacitance is estimated to be 0.107 F g−1
electrode allowing then for the determination of the specific capacitance of the LNO active material only (in units of F g−1
LNO).
Full-cell testing
Coin full-cells were built using a 2032 coin cell geometry. The cell stack consisted of the cathode, a polypropylene separator (ø 17 mm, C2500, Celgard, LLC.) soaked with 21 μl electrolyte (LP57, BASF SE), and a commercial graphite anode (ø 15 mm, loading of 7 mg cm−2 and density of 1.5 g cm−3, Elexcel Co.). To compensate for the thinner separator and anode compared to the half-cells, an additional stainless-steel spacer was added. All other steps were performed analogously to coin half-cells. All tests were performed at 25 °C and the C-rate was chosen according to 1 C ≡ 200 mAg−1.
The cells were first charged to 4.2 V and discharged to 3.0 V at constant current (CC) at a rate of C/10. In all following cycles, the charging condition was set to CCCV, with a constant current at C/2 to 4.2 V and a constant voltage (CV) step (until the current dropped below C/100 or after a CV time of 30 min). The cells were discharged at CC to 3.0 V and the discharge rate was varied with two cycles at C/10 and C/3, respectively, and 26 cycles at 1 C before repeating this procedure until a total number of 127 cycles was reached. At each second C/10 cycle, the cells were initially discharged to 50% state-of-charge (SOC, calculated relating to the discharge capacity of the former C/10 cycle) and a C/2 current pulse was applied for 30 s to calculate the direct current internal resistance (DCIR) of the cell, which was determined from the difference of the potentials just before the pulse and after a pulse time of 30 s.
Results and Discussion
Secondary particle morphology
Figure 1e shows the particle size distributions of the nominal 4 μm (green) and 12 μm (blue) Ni(OH)2 precursors and the respective calcined materials using 1.01 Li equivalents and 700 °C calcination temperature as measured by laser scattering. Numerically, the size distribution can be illustrated in terms of the percentile values, which represent the particle diameter below which 10%, 50% or 90% of all particles of the sample volume are found (d10, d50, d90), as shown in Table I. The width of the distribution is represented by the so-called span, which is calculated as (d90–d10)/d50. For the two Ni(OH)2 precursors, a clear particle size difference is observed with span values < 1. For the calcined samples, both the d50 values and the respective spans increase. This confirms that during calcination not only intraparticle, but also interparticle growth happens, leading to agglomeration of the secondary particles that can be discerned by comparing the top-view SEM images of the precursors (Figs. 1a and 1b) with those of the respective CAMs (Figs. 1c and 1d). Considering the close-to-spherical shape of the secondary agglomerates of the precursor and the final LNO particles, their specific surface area (SSA) can be estimated by the spherical approximation for monodisperse solid and smooth spheres, using their d50 values given in Table I and considering the density of the Ni(OH)2 precursor (ρ = 4.1 g cm−3) or of the final LNO CAM (ρ = 4.77 g cm−3):

For the nominal 4 μm and 12 μm diameter precursors, this SSA estimation on the basis of the d50 values in Table I results in SSA values of 0.34 and 0.13 m2 g−1, respectively; for the LNO CAMs derived from the 4 μm and 12 μm precursors, these estimated SSA values decrease to 0.14 and 0.09 m2 g−1, respectively. However, in reality the secondary particles can not be described as perfectly dense, smooth, and spherical, particularly in the case of the LNO CAMs where the above discussed agglomeration leads to porosity and surface roughness. In addition, for a more precise estimate (even in the case of solid and smooth spheres), the particle size distribution would have to be considered in Eq. 2. Therefore, the here given SSA values are only a first-order estimate and as such are expected to somewhat deviate from SSA values obtained by the krypton physisorption measurements that will be discussed later.

Figure 1. Secondary particle morphology of the Ni(OH)2 precursors and selected lithiated and calcined (1.01 Li equivalents and 700 °C) LNO CAM samples from this study. SEM images of: (a) the nominal 4 μm precursor; (b) the nominal 12 μm precursor; (c) the LNO CAM based on the nominal 4 μm precursor; and (d) the LNO CAM based on the nominal 12 μm precursor. All images were recorded in 20 k magnification with an acceleration voltage of 5 kV. For better contrast, on top of all samples a 6 nm thick Pt layer was sputtered. The length of the white scale bar equals 20 μm. (e) Volume based particle size distribution measured by laser scattering of the nominal 4 μm (green) and 12 μm (blue) samples before (light) and after (dark) lithiation and calcination. As underlying model, the Mie scattering theory was used.
Download figure:
Standard image High-resolution imageTable I. The percentiles d10, d50, d90 and spans (calculated as (d90 —d10)/d50)) of the Ni(OH)2 precursors and two selected lithiated and calcined LNO materials from this study (with Li:Ni = 1.01, calcined at 700 °C) as measured by laser scattering.
| Sample | d10 [μm] | d50 [μm] | d90 [μm] | Span |
|---|---|---|---|---|
| 4 μm Ni(OH)2 | 2.7 | 4.3 | 6.7 | 0.9 |
| 4 μm CAM | 3.9 | 9.1 | 21.8 | 2.0 |
| 12 μm Ni(OH)2 | 7.7 | 11.1 | 15.9 | 0.8 |
| 12 μm CAM | 7.8 | 13.6 | 21.1 | 1.2 |
Primary particle morphology
The primary particle size is more difficult to access as there is no direct way to measure its distribution. Although Rietveld refinement using powder X-ray diffraction (PXRD) data and an appropriate structural model yields values for the crystallite size, as was done in part I of this study, only average values are obtained and no information on the size distribution can be gained. In general, the primary particle morphology of CAMs is mainly investigated by the use of SEM imaging. Representative top-view SEM images for the LNO materials prepared with the nominal 12 μm Ni(OH)2 precursor are depicted in Fig. 2. A clear impact of the calcination temperature and the number of Li equivalents per mol of Ni on the primary particle size was found, with an increase of both synthesis parameters leading to larger primary particle sizes. However, this approach only delivers a qualitative information and might lead to wrong conclusions if the examined section of the secondary particle agglomerate is not representative for the whole sample.

Figure 2. Top-view SEM images of the nominal 12 μm LNO samples made with different Li equivalents and at different calcinations temperatures (see legends). All images were recorded in 20 k magnification with an acceleration voltage of 5 kV. A 6 nm thick Pt layer was sputtered onto all samples. The length of the white scale bar equals 1 μm.
Download figure:
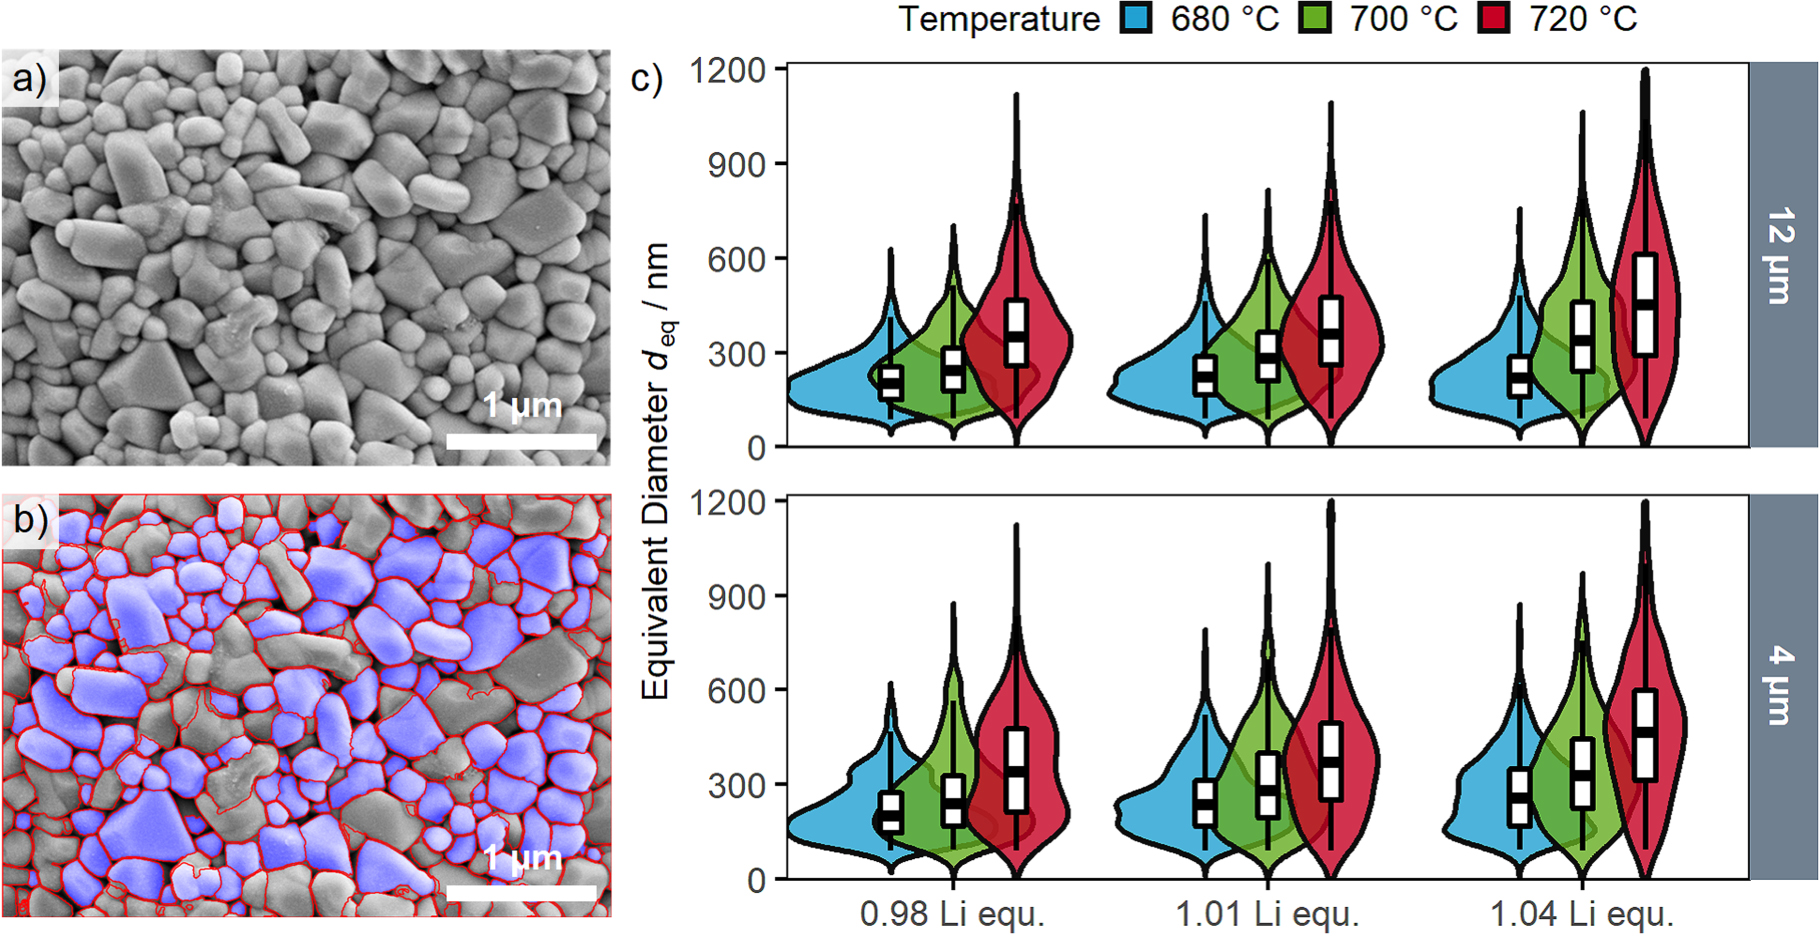
Standard image High-resolution imageA quantitative information of the primary particle size was obtained by segmentation and subsequent determination of the primary particles' dimensions. By use of image processing software (ImageJ), this segmentation was done manually. However, for a thorough statistical analysis, a large number of SEM images and primary particles needs to be processed and segmentation merely by hand is a tedious and time-consuming task. With the ongoing improvements of computer vision methods and convolutional neural networks, such segmentation processes can now be automatized, which is applied in various research fields from biomedicine to mineral characterization. 27,31 The feasibility of this method was further demonstrated for nanoscale agglomerated inorganic particles. 32 Hence, this approach was also used in this study, and an automatized segmentation of 10 top-view SEM images in 20 k magnification was performed for each sample to analyze a sufficiently large number of primary particles. Figures 3a and 3b show one top-view SEM image before and after the segmentation process for one representative LNO sample (nominally 12 μm precursor, with a Li:Ni molar ratio of 1.01, calcined at 700 °C). On average, more than 700 primary particles per LNO sample were evaluated, with a smaller number of primary particles being identified in case of larger primary particle sizes (less particles visible in the images). Table II shows the numerical results of this SEM analysis for the differently synthesized LNOs, viz., the equivalent primary particle diameter and its standard error of the mean for a given sample (deq), the volume/surface averaged diameter (dv/a as described later), the resulting primary particle SSA, and the number of segmented particles per sample that were used to determine these values.
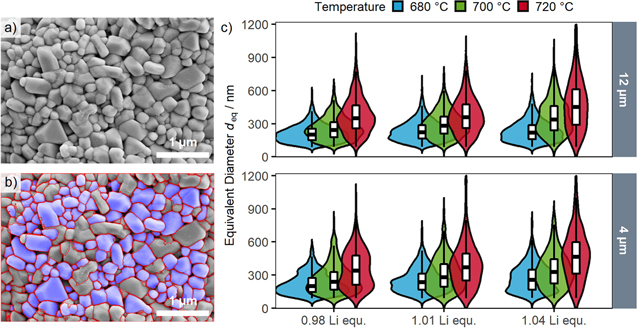
Figure 3. Analysis of the primary particle size distribution by top-view SEM analysis. (a) Top-view SEM image of an LNO sample (nominally 12 μm precursor, 1.01 Li equivalents, calcined at 700 °C) before and (b) after primary particle segmentation. The segmented particles are highlighted with a blue overlay. 10 images of individual secondary particles per sample were analyzed. (c) Violin plots of the primary particle size distributions derived from the automated image segmentation of all 18 LNO samples in this study. The upper panel depicts the samples prepared from the nominal 12 μm precursor, the lower panel the samples from the nominal 4 μm precursor, with the colors indicating the calcination temperature (blue: 680 °C, green: 700 °C, red: 720 °C). The y-axis shows the equivalent diameter and the width in x-axis direction indicates the probability density distribution as a kernel smoothed histogram. The boxes indicate the median as well as the 25% and 75% percentiles, with the whiskers extending to the 10% and 90% percentiles.
Download figure:
Standard image High-resolution imageTable II. Results from the top-view SEM image analysis by segmentation for all 18 LNO samples of this study, providing the Li:Ni molar ratio and the calcination temperature (Tcalc.). The table depicts the primary particle size by means of the average equivalent diameter deq (see Eq. 1) and its standard error of the mean, the resulting volume/area averaged diameter (dv/a) for each sample (calculated with Eq. 4), and the corresponding primary particle specific surface area (SSA) calculated with Eq. 3. The last column gives the total number of segmented particles per sample.
| LNO sample Li:Ni ∣ Tcalc. | deq values [nm] | dv/a diameter [nm] | Primary part. SSA [m2 g−1] | # of segmented particles |
|---|---|---|---|---|
| Prepared from nominally 12 μm precursor | ||||
| 0.98 ∣ 680 °C | 210 ± 2 | 270 | 4.7 | 1672 |
| 0.98 ∣ 700 °C | 254 ± 3 | 335 | 3.8 | 1463 |
| 0.98 ∣ 720 °C | 371 ± 6 | 503 | 2.5 | 683 |
| 1.01 ∣ 680 °C | 234 ± 2 | 305 | 4.3 | 1598 |
| 1.01 ∣ 700 °C | 294 ± 4 | 385 | 3.3 | 1072 |
| 1.01 ∣ 720 °C | 375 ± 7 | 505 | 2.5 | 539 |
| 1.04 ∣ 680 °C | 235 ± 3 | 316 | 3.9 | 1336 |
| 1.04 ∣ 700 °C | 359 ± 6 | 487 | 2.6 | 661 |
| 1.04 ∣ 720 °C | 475 ± 12 | 701 | 1.7 | 382 |
| Prepared from nominally 4 μm precursor | ||||
| 0.98 ∣ 680 °C | 220 ± 4 | 301 | 4.2 | 649 |
| 0.98 ∣ 700 °C | 263 ± 6 | 389 | 3.0 | 447 |
| 0.98 ∣ 720 °C | 353 ± 10 | 497 | 2.4 | 274 |
| 1.01 ∣ 680 °C | 250 ± 4 | 345 | 3.6 | 594 |
| 1.01 ∣ 700 °C | 306 ± 7 | 442 | 2.8 | 418 |
| 1.01 ∣ 720 °C | 386 ± 14 | 577 | 2.1 | 192 |
| 1.04 ∣ 680 °C | 274 ± 5 | 378 | 3.3 | 498 |
| 1.04 ∣ 700 °C | 345 ± 8 | 484 | 2.5 | 386 |
| 1.04 ∣ 720 °C | 478 ± 17 | 666 | 1.7 | 171 |
The equivalent diameter as a measure for the primary particle size is depicted in Fig. 3c for all 18 LNO samples from this study as a function of the calcination temperature and of the number of Li equivalents, broken down by the size of the used Ni(OH)2 precursor. The size distributions are depicted as violin plots with overlayed box plots that show the median values and the 10%, 25%, 75% and 90% percentiles. All size distributions roughly follow a log normal distribution, which is commonly found for materials with Ostwald ripening as underlying growth mechanism. 33,34 The qualitative information from Fig. 2 can be confirmed by evaluation of the size distributions, as increasing calcination temperature and number of Li equivalents both lead to larger median primary particle sizes. Additionally, this quantitative evaluation also shows that the width of the size distribution increases as the primary particles become larger. No large differences between the two used Ni(OH)2 precursors were observed, indicating that the secondary particle size of the precursor (and thus of the final LNO CAM) is not impacting primary particle growth.
To exclude systematic errors by this newly implemented computer vision method, two additional validation tests were made. As seen in Fig. 3b, the computer vision method is not able to segment all primary particles shown in the SEM image, as it rejects particles which touch the boundaries of the image, deviate to a large extent from the expected particle shape, or for which the junctions between the primary particles are not fully clear (this occurs, e.g., when primary particles are covered with residual Li salts from the calcination process). Therefore, a manual segmentation (three selected samples and three images per sample) was performed to investigate a possible bias of the segmentation algorithm in regards of which particles are segmented and which are rejected (Fig. 4). The overall shape of the particle size distributions is similar for both methods, and a deviation < 10% for the mean primary particle sizes is found. This minor deviation can be ascribed to a selection bias (only three images were analyzed by hand) or to the fact that sometimes the junctions between particles cannot be clearly identified.
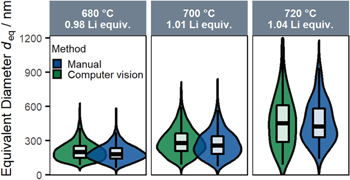
Figure 4. Comparison of the primary particle size distributions derived from top-view SEM images, obtained by the computer vision segmentation (green) and by manually mapping the primary particle segmentation (blue), shown exemparily for three LNO samples prepared from the nominal 12 μm precursor (the Li equivalents and the calcination temperature are specified in the legends). For the manual mapping, three selected SEM images in 20 k magnification were analyzed using the ImageJ software.
Download figure:
Standard image High-resolution imageAnother systematic deviation could potentially arise from differences between the size of the primary particles located on the exterior surface of the secondary particles, which are measured by top-view SEM, and the size of the primary particles located in the interior of the secondary particles, which can be accessed by FIB-cut cross-section images as shown in Fig. 5. Due to the poor contrast between the primary particles and the background, the cross-section images (three selected samples and three images per sample) were evaluated by manual segmentation. Only minor differences can be found between top-view and cross-section SEM images, which shows that the primary particle sizes on the exterior surface of the secondary particles and those located in the interior region are comparable. However, for the cross-section images it must be considered that the primary particle size could be underestimated, as the FIB-cut might not perfectly intersect the equator of the secondary particle. The cross-section images further reveal that not only the primary particle size increases with an increase of the calcination temperature and of the number of Li equivalents, but also the size of the pores inside the secondary particle agglomerates increases.
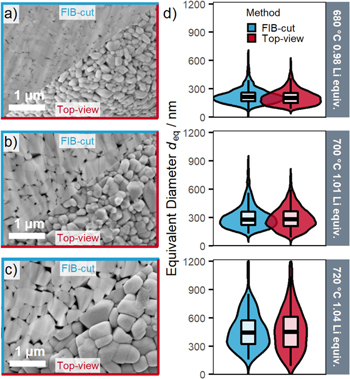
Figure 5. Comparison of the LNO primary particle size distributions obtained by analyzing top-view SEM images or SEM images obtained from ion-milled SEM cross-sections. For this, LNO samples derived from the nominal 12 μm precursor and showing the largest differences in primary particle size were chosen to compare the cross-section (blue-framed upper left sections) and top-view (red-framed lower right sections) SEM images: (a) for the sample calcined at 680 °C with 0.98 Li equivalents per mol of Ni; (b) for the sample calcined at 700 °C with 1.01 Li equivalents; and (c) for the sample calcined at 720 °C with 1.04 Li equivalents. (d) Comparison of the primary particle size distributions between cross-section (blue) and top-view (red) SEM image segmentation. For the cross-section images, particle segmentation was performed manually, using the ImageJ software.
Download figure:
Standard image High-resolution imageThe above determined SEM top-view based primary particle size distribution in terms of the equivalent diameter can now be used to estimate the SSA values of the primary particles, using the spherical approximation of solid and smooth spheres and an LNO density of ρ = 4.77 g cm−3: 35
Hereby, the volume/area averaged diameter dv/a is defined as:

The dv/a values for the different LNO samples are listed in Table II, together with the resulting primary particle SSA values based on Eq. 3. The primary particle SSA values shown in Table II range from 4.7 m2 g−1 for the smallest primary particles to 1.7 m2 g−1 for the largest primary particles, and thus are roughly one order of magnitude larger compared to the values estimated from the secondary particle sizes.
Figure 6 compares the average primary particle size values from the top-view SEM image segmentation (in terms of deq) with the crystallite diameters obtained from Rietveld refinement using synchrotron powder X-ray diffraction (PXRD) data shown in Part I of this study. 1 These two methods should yield the same primary particle size values, if a primary particle consists of only one crystal domain. As a matter of fact, a good agreement is found, with the primary particle size determined by the SEM analysis and the average crystallite size agreeing reasonably well for most of the 18 LNO samples. However, it should be noted that the observed small differences are to be expected due to the different physical nature of the two methods: in PXRD, larger crystallites contribute more to the overall diffraction pattern (volume-based method), whilst for SEM imaging each particle contributes equally to the mean (number-based method). The advantage of the latter method is that the primary particle size distribution that can be obtained from top-view SEM image segmentation allows to obtain a more accurate primary particle SSA, which is necessarily less accurate for the single size value obtained by PXRD.
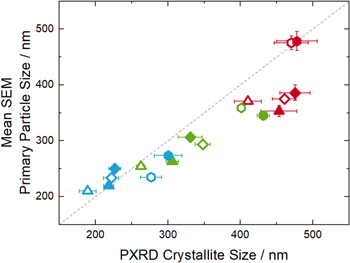
Figure 6. Comparison of the LNO average crystallite sizes obtained from Rietveld refinement using synchroton PXRD data with the mean primary particle size obtained from the segmentation of top-view SEM images. The colors refer to the three different maximum calcination temperatures (680 °C: blue, 700 °C: green, 720 °C: red), symbols indicate three different Li equivalents (0.98: triangles, 1.01: diamonds, 1.04: hexagons) and open/closed symbols represent LNO derived from the nominal 12 and 4 μm precursors, respectively. The gray dashed line represents a line through the origin with the slope of 1.
Download figure:
Standard image High-resolution imageEx situ krypton physisorption
Experimental values of specific surface areas of LNO powders are obtained ex situ from physisorption measurements, where the amount of adsorbed gaseous species to the surface of the material is measured. The accuracy of this method is limited by the used adsorptive and can be increased by the use of Kr instead of the more commonly applied N2, which is due to the lower vapor pressure of Kr at the measurement temperature of 77 K (boiling point of liquid nitrogen). In the case of low absolute surface areas of a given sample (i.e., when the total surface area of the sample is < 1 m2), only measurements using krypton can yield sufficiently accurate values. 23,36
Kr physisorption measurements (Kr-BET) were performed for six selected LNO samples (i.e., for three LNO samples for each Ni(OH)2 precursor, which exhibit large differences in primary particle size), and the results are shown in Table III, together with the SSA estimates for the secondary particle size obtained by laser scattering (using the d50 value and Eq. 2) and for the primary particle size obtained by top-view SEM segmentation (values also listed in Table II, based on Eq. 3). For the LNO powders based on the nominal 12 μm precursor, Kr-BET values between 0.18 m2 g−1 and 0.34 m2 g−1 were obtained (fourth column from the left in Table III), with an increase of specific surface area for samples with a larger primary particle size. Comparing those values with the estimated SSAs on the secondary and primary particle level for each LNO sample (second and third row from the left, respectively) reveals that the Kr-BET values are closer to the estimated SSAs of the secondary particles. This means that the inner pore structure is not accessible to the krypton adsorptive, which, e.g., may be due to residual lithium salts from the LNO synthesis blocking the pores. However, the measured Kr-BET values are still larger than the estimated SSAs of the corresponding secondary agglomerates, which is likely due to a small fraction of accessible pores in the secondary agglomerates, whereby the larger pores formed with larger primary particles (see Figs. 5a–5c) would explain the increase of the Kr-BET values with primary particle size. For the LNO powders based on the nominal 4 μm precursor, generally larger Kr-BET values were observed. This is in line with the observation that it is indeed the secondary particle structure that most affects the Kr-BET value, so that smaller secondary particles yield higher Kr-BET values.
Table III. Estimated secondary and primary particle specific surface areas (SSAs) for selected LNO samples with large differences in primary particle size, as well as the SSAs measured by krypton physisorption (Kr-BET) of the the pristine LNO powder and, in case of the LNO samples derived from the nominal 12 μm precursor, also for the washed LNO powders.
| LNO sample Li:Ni ∣ Tcalc. | Secondary particle SSA a) [m2 g−1] | Primary particle SSA b) [m2 g−1] | Kr-BET of pristine LNO powder [m2 g−1] | Kr-BET of washed LNO powder [m2 g−1] |
|---|---|---|---|---|
| Prepared from nominally 12 μm precursor | ||||
| 0.98 ∣ 680 °C | 0.09 | 4.7 | 0.18 | 1.50 |
| 1.01 ∣ 700 °C | 0.09 | 3.2 | 0.26 | 1.34 |
| 1.04 ∣ 720 °C | 0.09 | 1.7 | 0.34 | 1.24 |
| Prepared from nominally 4 μm precursor | ||||
| 0.98 ∣ 680 °C | 0.14 | 4.2 | 0.50 | — |
| 1.01 ∣ 700 °C | 0.14 | 2.8 | 0.51 | — |
| 1.04 ∣ 720 °C | 0.14 | 1.7 | 0.52 | — |
a)determined from the d50 diameter obtained by laser scattering, using Eq. 2. b)determined from segmentation of top-view SEM images, using Eq. 3 (also listed in Table II).
Given that the inner pore network appears to be likely blocked by residual Li salts, removal of these impurities is expected to increase the measurable specific surface area. The amount of residual salts can be substantially reduced by washing with H2O, subsequent filtering and drying, which was done for the three LNO samples based on the nominal 12 μm precursor. As shown in Table III (right-most column), for all of these three samples a very pronounced increase in the Kr-BET SSA can be observed, ranging between a factor of ∼4 (from 0.34 to 1.24 m2 g−1) and ∼8 (from 0.18 to 1.50 m2 g−1). A similar increase of the Kr-BET surface area upon washing was also observed for NCM811. 37
To further illustrate the emerging trends of the SSAs, Fig. 7 shows the estimates of the primary particle and secondary particle specific surface areas as well as the Kr-BET values before and after washing, plotting the data given in Table III. This makes it very obvious that the Kr-BET SSA values of the pristine LNO powders (labeled as B in Fig. 7) come rather close to the SSA estimated for the corresponding secondary particles (labeled as A). After washing, the Kr-BET SSA values are significantly increased (labeled as C) and move more towards the estimated SSA for the primary particles (labeled as D). Although the sample with the smallest primary particles (0.98 Li equivalents and 680 °C calcination temperature, marked in blue) has the largest measured Kr-BET value after washing (1.50 m2 g−1), this value is still significantly lower than the estimate for completely separated primary particles (4.7 m2 g−1). For the samples with the largest primary particles (1.04 Li equivalents and 720 °C calcination temperature, marked in red), the measured SSA after washing comes closer to the estimated primary particle SSA. The cross-section SEM images already shown in Fig. 5 can be used to explain this phenomenon: with increasing primary particle size also the average pore size between the primary particles increases (with a concomitant decrease of the overall number of pores). These larger pores can be opened more easily by washing compared to the smaller pores of samples with small primary particles, which makes more of the inner pore network accessible by an improved percolation.

Figure 7. Specific surface areas (SSAs) of the samples with large differences in primary particle sizes for LNO materials prepared from the nominal 12 μm and 4 μm Ni(OH)2 precursors. The SSA increases from the left to the right. The symbols labeled A indicate the estimated SSA of the secondary particles, based on the spherical approximation (Eq. 2 using the d50 diameter determined by laser scattering and density of the LNO calcinates from Fig. 1). Label B shows the Kr-BET SSA values of the pristine LNO powders, while label C depicts the Kr-BET SSA values of the LNO powders after washing (CAM:H2O in a weight ratio of 1:5, washed for 20 min at room temperature). Label D marks the estimated primary particle SSAs obtained from the segmentation of the top-view SEM images, using Eq. 3.
Download figure:
Standard image High-resolution imageLNO electrode and LNO CAM capacitance
As already shown by the Kr-BET data, the SSA values can experience drastic changes depending on sample treatment. However, for the electrochemical performance, the actual interface area between CAM and electrolyte is assumed to be the decisive parameter. The fracturing of the secondary particle structure during electrochemical cycling is a well-known phenomenon for Ni-rich NCM materials. 38–41 However, most investigations of this phenomenon rely on post mortem SEM analysis of the cycled electrodes, which only delivers qualitative information on a small section of the electrode and requires the destruction of the cell after cycling in order to conduct the analysis. Recently a method has been published that delivers the cathode capacitance (proportional to the electrochemically active specific interface area between CAM and electrolyte) in situ during battery operation by an impedance-based analysis in a three electrode set-up using a gold-wire reference and a prelithiated LTO anode. 23 Moreover, it will be shown in an upcoming report that similar results can be achieved in a simple two-electrode half-cell set-up using a Li metal anode, as is done in the present study. 30
To investigate the changes of the SSA during cycling, this method was applied to all 18 LNO samples of this study and the results are depicted in Fig. 8. The principle of the test procedure is shown in the voltage profile in Fig. 8a (for further details see Oswald et al. 23 ): after an initial charge to 20 mAh g−1 (referred to as "conditioning"), the cells were deep-discharged to 2.5 V followed by a CV step until the current dropped below C/250 (0.4 mA g−1). The impedance was measured by imposing a 100 mHz current perturbation with a current amplitude corresponding to C/50 on top of the baseline current and analyzing the voltage response. The cells were cycled for five more full cycles up to 4.3 V, followed again by a deep discharge to 2.5 V after each cycle and by an impedance measurement at 100 mHz.

Figure 8. Capacitance measurements of all 18 LNO samples. (a) Voltage profile of an exemplary half-cell measurement. The points at which the capacitance measurements are performed are highlighted by green diamonds. (b) Electrode capacitance evolution over 5 cycles for the LNO samples based on the nominal 12 μm precursor (left panel) and on the nominal 4 μm precursor (right panel). The electrode capacitance is normalized on the total weight of the working electrode (WE). The gray box indicates the estimated contribution of carbon black and binder to the elecrode capacitance. (c) Correlation of the specific LNO capacitance (after substraction of carbon and binder contribution and normalized on the LNO active material weight) after conditioning (left), after the 1st cycle (middle), and after the 5th cycle (right), plotted versus the primary particle specific surface area (SSA) determined by top-view SEM image segmentation. All measurements were performed in a coin half-cell setup with a lithium metal anode, an LNO working electrode, and a glass fiber separator soaked with LP57 electrolyte. The measurement temperature was set at 25 °C and cycling was conducted at C/10 (≡ 20 mA g−1). The capacitance was determined by discharging the cells to 2.5 V and holding the potential until the current drops below C/250; subsequently, a sine-wave modulated current with a frequency of 100 mHz and an amplitude corresponding to C/50 was superimposed to determine the electrode capacitance (see Experimental section).
Download figure:
Standard image High-resolution imageThe specific electrode capacitance values as a function of cycle number are shown in Fig. 8b. After the conditioning step and before the first charge to 4.3 V, the capacitance values of the LNO samples based on the nominal 4 μm precursor are generally larger compared to those based on the nominal 12 μm precursor, which is in line with the higher SSA values measured by Kr-BET. However, for all samples the capacitance values drastically increase even after the 1st cycle with 4.3 V upper cut-off voltage. After the 5th cycle, no further increase of the capacitance values is noticed. This differs from previous observations made for NCM622 materials (60% Ni content), where capacitance increase over several hundreds of cycles was measured. 23 This seems consistent with the reported larger anisotropic volume changes during cycling for LNO compared to a NCM material with less Ni content, 42,43 even though it must be considered that the difference might also arise from a lower SOC for the NCM622 material, since the volume changes of NCMs with different Ni contents only depend on the SOC rather than the voltage. 44 A clear dependence of the maximum LNO electrode capacitance values after the 5th cycle on the calcination conditions is observed (Fig. 8b), with higher capacitances obtained for lower calcination temperatures (high impact) and lower Li equivalents (moderate impact). This is in good agreement with the observed trends of primary particle growth (Fig. 3c) and respective decrease of the primary particle SSA (see Table II).
Figure 8c shows the correlation between the specific LNO capacitance after the conditioning step, after the 1st cycle, and after the 5th cycle plotted against the primary particle SSA values determined from top-view SEM image segmentation (listed in Table II). After conditioning, the measured specific LNO capacitance values depend mostly on the secondary particle size, yielding higher values for the smaller secondary particles obtained for the LNO materials based on the nominal 4 μm precursor (i.e., for the LNO samples with lower secondary agglomerate SSA), while there is no clear correlation with the primary particle SSA. After the 1st cycle, a weak correlation of specific LNO capacitance with the primary particle SSA can be observed, which is further enhanced after the full five cycles. The samples with smaller primary particles tend to show a delayed particle fracturing and a slower increase of capacitance. The nearly linear correlation after the 5th cycle indicates that the specific LNO capacitance increases to values proportional with the primary particle SSA, which means that at least a large fraction of the secondary particle structure is penetrated by the electrolyte due to crack formation between the primary particles. Therefore, it is expected that the primary particle size will have a significant impact on key electrochemical performance properties, which will be discussed in the following.
1st cycle capacity loss
In part I of this study, the comparison between the exact LNO stoichiometry (Li1-z Ni1+z O2) and the 1st cycle capacity loss was discussed, but no correlation was found for this set of samples. 1 In contrast, a weak correlation with the average crystallite size determined by Rietveld refinement was found. With an increase of interface area between the LNO active material and the electrolyte, the effective areal current density at a given C-rate is reduced. Thus, if the 1st cycle capacity loss were to be governed by a kinetic hindrance of the LNO active material at a high degree of lithiation, as suggested in the literature, 19,45,46 an increase in interface area would be expected to lead to a decrease of the 1st cycle capacity loss. In contrast, if the 1st cycle capacity loss would be caused by irreversible side reactions at the CAM surface (e.g. electrolyte oxidation or oxygen release 47,48 ), an increase in SSA would be expected to lead to in increase in the 1st cycle capacity loss.
The interface area between the LNO surface and the electrolyte can be monitored during cycling by the capacitance method, and the respective correlation to the 1st cycle capacity loss is shown in Fig. 9. Here, a clear correlation is found for the whole set of samples, with a decrease in the 1st cycle capacity loss with increasing specific LNO capacitance, i.e., with increasing interface area. Therefore, for LNO samples with small values of z (ranging between 0.016–0.037), the CAM-to-electrolyte interface area is the decisive factor determining the 1st cycle coulombic efficiency.
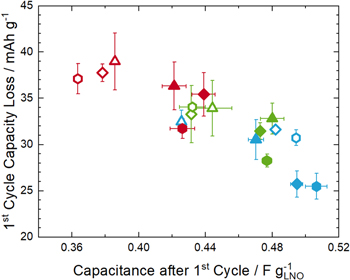
Figure 9. Correlation of the 1st cycle capacity loss with the specific LNO capacitance after the 1st cycle (taken from the middle panel of Fig. 8c). The error bars represent the deviation between two reproductions of the same test. All measurements were performed in a coin half-cell setup with a lithium metal anode, an LNO working electrode, and a glass fiber separator soaked with LP57 electrolyte. The measurement temperature was set at 25 °C and the cycle was conducted at C/10 (≡ 20 mA g−1). The meaning of the different symbols is defined in Fig. 8b.
Download figure:
Standard image High-resolution imageThis has profound implications for commercially relevant NCM and NCA materials. Here, particle fracturing is delayed over a large number of cycles due to the lower degree of delithiation when charged to an identical cut-off voltage. So far, particle fracture is often discussed as a detrimental effect on CAM performance, as it deteriorates the mechanical integrity of the cathode and increases the contact area for possible side reactions with the electrolyte. 41 However, as already concluded by Ruess et al., 26 the intrusion of the electrolyte into the secondary particle structure and the related increase of interface area results in a decrease of the areal current density and therefore improves the Li intercalation kinetics during discharge. This means that even when material degradation already sets in at the very beginning of cycle-life, a concomitant continuous increase of CAM-to-electrolyte interface area can potentially counterbalance the capacity loss by side reactions to some extent. Indeed, several authors observed an increase of discharge capacity during the beginning of cycle-life, often after the materials were modified by doping, coating, or storage experiments, all influencing morphological or surface features of the CAM. 49–55 For LNO, this is rarely reported due to the rapid increase in interface area and the comparably large primary particles in comparison to Co and Mn containing materials with less Ni content. 56 In case of samples with very small primary particles, as observed by Mesnier et al., when calcining LNO at elevated oxygen pressure, such behavior is indeed implied. 57 This also indicates that comparing different materials concerning their discharge capacity without profound knowledge of the particle morphology can result in misleading conclusions.
Charge/discharge cycling of LNO/graphite full-cells
To analyze the long-term cycling stability, full-cells were investigated for all LNO materials prepared in this study, with the results depicted in Fig. 10. The discharge capacity and the direct current internal resistance (DCIR) vs. cycle number for three exemplary LNO samples with a large variation in primary particle size distribution are shown in Figs. 10a and 10b, respectively. Although all materials are nominally "LiNiO2," distinct differences are observed, with the C/10 discharge capacity after 122 cycles ranging from 150 mAh g−1 to 170 mAh g−1 (for LNOs based on the nominal 12 μm precursor, prepared with 1.04 Li equivalents and 720 °C calcination temperature and with 0.98 Li equivalents and 680 °C calcination temperature, respectively). Despite the clear difference in the 1st cycle capacity at C/10 for all three materials, the capacity loss between the 1st and the 122nd cycle (both at C/10) is rather similar (50-65 mAh g−1). Interestingly, when comparing the capacity loss between beginning and end of cycling at 1 C (6th and 121th cycle), it has a similar magnitude, ranging between 40 mAh g−1 for the best performing material (blue symbols in Fig. 10a) and 60 mAh g−1 for the lowest performing material (red symbols).
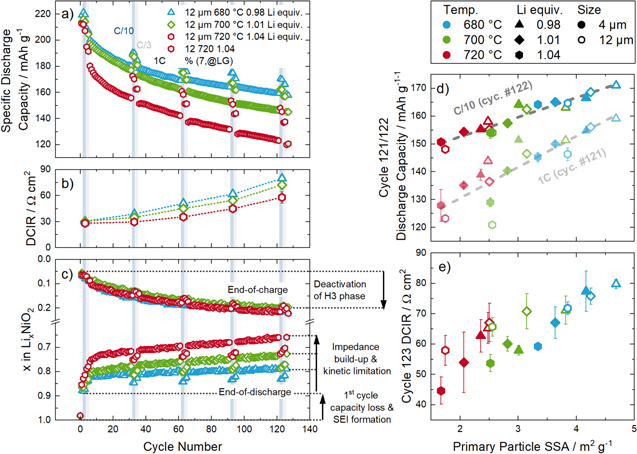
Figure 10. LNO/graphite coin cell data of the LNO samples. (a) Discharge capacity vs. cycle number at 1 C discharge, with intermittent check-up cycles at C/10 and C/3 discharge rate for three selected LNO materials with the largest difference in primary particle size based on the nominal 12 μm precursor. (b) DCIR vs. cycle number for these three LNO samples. (c) Estimated lithium content at end-of-charge and at end-of-discharge calculated from a dQ/dV analysis by determining the minimum corresponding to the single-phase region Li0.5NiO2. (d) Correlation of the 1 C and C/10 discharge capacity in cycle 121 and 122, respectively, with the primary particle SSA (from SEM analysis) and of (e) the DCIR values in cycle 123 for all 18 LNO samples. The cells consisted of a cell stack of an LNO cathode, a polypropylene separator soaked with LP57 electrolyte, and a graphite anode, with a nominal areal capacity of 1.6 ± 0.1 mAh cm−2 (based on 200 mAh gLNO −1). The cells were cycled between 3.0 and 4.2 V at a temperature of 25 °C. The CCCV charge rate was fixed to C/2 and until the current drops below C/100. The discharge rate was varied between C/10, C/3 and 1 C.
Download figure:
Standard image High-resolution imageGenerally, the degradation of the discharge capacity during repeated cycling is discussed in connection with an increase of the internal resistance of the cell, as both are related to the different degradation modes of the CAM. 37,39,58–60 When the structural degradation of the CAM leads to an impedance build-up, its overpotential at a given current increases, leading to a decrease of the capacity for a given set of upper and lower cut-off potentials. This, however, does not seem to be the case here, as an impedance build-up would more strongly affect the capacity loss at high C-rates, contrary to what is observed. Furthermore, the highest DCIR resistance increase is observed for the best performing LNO sample (with 0.98 Li equivalents and 680 °C calcination temperature; blue triangles in Fig. 10b): although all samples start with a DCIR of ∼30 Ωcm2, it increases to 60-80 Ωcm2 after 123 cycles, with the largest increase for the best performing sample. To investigate whether this behavior is correlated to the LNO particle morphology, the discharge capacity and the DCIR values of all 18 LNO samples after 122 cycles are compared to the primary particle SSA determined from the SEM image analysis, which is shown in Figs. 10d and 10e. This reveals rather obvious and striking correlations between the discharge capacities as well as the DCIR values with the primary particle SSAs, implying that these key electrochemical performance parameters seem to solely depend on the primary particle morphology. However, the observed trend that LNO materials with a high capacity retention also show a high DCIR increase over cycling seems to be contradictory at first sight, and a deeper understanding of this observation is sought.
For CAMs that exhibit no structural deterioration (LiFePO4, LiCoO2, NCM523 at low upper cut-off potentials), the main degradation mode of full-cells with these CAMs is the continuous growth of the solid electrolyte interphase (SEI) at the anode, which is connected to the consumption of cyclable lithium. 15,61,62 In such a case, the Li content of the cathode active material at the end-of-charge stays constant, while the amount of Li that is reintercalated at the end-of-discharge continuously decreases (i.e., even though the CAM could still accommodate more Li, no more lithium can be provided by the graphite anode). For Ni-rich CAMs, the amount of extractable Li during charge also decreases during cycle life. 37,59,63–65 This phenomenon has been related to the formation of a rock-salt like surface layer, which some authors suggested to increases the charge transfer resistance (and thus lower the charge capacity), 59 while other authors suggested that it would suppress the H2 to H3 phase transition (and thus the related capacity) due to the crystal lattice mismatch with the delithiated layered phase. 63 Thus, the x in Lix NiO2 at the end-of-charge would decrease during cycle life. Assuming that the formation of the rock salt-like surface layer is limited to a certain thickness (due to a diffusion limitation of the lattice oxygen from the bulk to the surface), 66 the mass fraction of the rock salt-like surface layer would increase with an increase of the accessible specific surface area of the CAM, as the surface phase grows from the surface inwards. However, if the crystal lattice mismatch is the origin of the capacity loss, the surface degradation would lead to a complete deactivation of the H3 phase formation in the bulk of the CAM particle, hence the capacity loss during charge would be independent from the primary particle size. Although larger primary particles form less of the degraded phase, the same capacity related to the H3 phase would be lost when compared to CAMs with smaller primary particles. This phenomenon would therefore not be able to explain the observed performance increase with primary particle SSA. Likewise to the loss of capacity during charge, the decreasing amount of lithium that can be reintercalated during discharge must be considered over the whole cycle life, as large differences were observed in the 1st cycle (Fig. 9).
The phase transitions of LNO can be used as a diagnostic measure to determine the absolute SOC, as has already been demonstrated in part I of this study. 1 Minima in the dQ/dV correspond to single phase regions that form due to Li ordering states. 67 In the monoclinic domain, a stable phase is reliably observed in the dQ/dV plots, corresponding to Li0.5NiO2. Following the minimum in the dQ/dV related to this phase over cycle-life, one can calculate the lithium content of LNO both at the end-of-charge and end-of-discharge, which then allows to distinguish the loss of capacity occurring at high and low state-of-charge (i.e., at low and high Li content, respectively). The thus determined Li contents of the LNO samples at the end-of-charge and end-of-discharge are shown in Fig. 10c. Indeed, for the three samples with large differences in primary particle size, the amount of extracted Li at the end-of-charge decreases absolutely identically, which in turn indicates that the observed large differences in discharge capacity arise from the amount of Li that can be reintercalated at the end-of-discharge. The decrease of discharge capacity cannot solely be explained by a loss of Li in the SEI, as a decrease of the discharge rate (1 C to C/3 to C/10) leads to an increase of measured discharge capacity (i.e., there is still sufficient active Li present in the anode). The similar fading behavior at C/10 and 1 C (Fig. 10d) also excludes an impact of the deterioration of the electrical conductivity caused by fracturing of the secondary particles (and thus contact loss between primary particles), as a difference for LNO materials with different secondary particle sizes would be expected due to shorter electronic conduction pathways into smaller cracked secondary particles. These considerations point to a kinetic limitation at a high degree of lithiation at the end-of-discharge as the decisive factor instead. The observed correlation of the reintercalatable Li with the interface area between CAM and electrolyte in the 1st cycle (see Fig. 9) thus seems to apply to the overall cycling behavior. Indeed, even after extended cycling, the amount of Li which can be reintercalated during discharge at a set C-rate still depends on the interface area between CAM and electrolyte. As the LNO secondary particle structure appears to completely fracture during the initial cycles (see Fig. 8), a very good correlation of the key electrochemical properties (i.e., 1st cycle capacity loss, capacity retention, impedance build-up) with the estimated primary particle SSA is thus found.
As already discussed above, DCIR measurements were performed at 50% SOC (referenced to the discharge capacity of the preceding C/10 cycle) to quantify the impedance build-up. At this degree of lithiation, kinetics do not have a severe impact, as the charge transfer resistance at intermediate SOCs is rather low for layered transition metal oxide CAMs. 37 Therefore, the resistance build-up will mirror other ohmic contributions, e.g., electrolyte salt depletion, formation of resistive degradation products on the CAM, SEI growth at the anode, etc. Zou et al. showed that the surface rearrangement of the layered cathode structure mostly happens at the CAM-to-electrolyte interface. 68 For LNO, where it was shown that particles thoroughly fracture during the initial cycles, samples with a larger primary particle size have a smaller interface area in contact with the electrolyte and therefore the mass fraction of the formed rock salt-like surface layer is less. The formation of this surface phase is accompanied by the evolution of gaseous species and further side reactions with the electrolyte would lead to a larger resistance increase. 47,48,69 However, by the deactivation of the H3 phase formation, the same amount of Li is lost independent of particle size. Thus, it can be explained why capacity retention and impedance build-up show inverse trends: samples with smaller primary particle sizes quickly develop larger surface areas, therefore showing a larger impedance increase, but at the same time reducing significantly the kinetic hindrance issue at low SOC. The latter effect thus dominates the performance of the here examined LNO/graphite full-cells, so that LNO samples with a large primary particle SSA (i.e., with small primary particles) have the best capacity retention despite a larger impedance build-up.
Implications for future materials design
The observations from this study can be used to make predictions and recommendations for future cathode active material research. It was shown that the CAM-to-electrolyte interface area is the governing factor for the electrochemical performance of LNO and that this property changes during cycle-life. However, the CAM-to-electrolyte interface area was shown to also change due to LNO washing (see Table III), similar to what was shown for NCAs and NCMs upon washing and calendering. 23,59,70 In this study it has been found that for LNO CAMs after just a few cycles the interface area between LNO and electrolyte increases drastically towards the primary particle SSA, which seems to be more pronounced compared to mid-Ni materials if cycled under comparable cycling conditions (e.g. when cycled up to 4.3 V against Li+/Li).
However, the extent of the interface area is always within the secondary particle and primary particle SSA limits, which represent the upper and lower boundary. These limits and the variations within these limits are schematically shown in Fig. 11. Secondary particle and primary particle size are material properties that are set by the precursor precipitation and the subsequent calcination processes. Current CAM research focusses on both polycrystalline and single crystalline morphology. Polycrystalline materials are characterized by large secondary particle agglomerates and by primary particles in the range of a few hundred nm. In contrast, single crystalline materials consist of monolithic primary particles that can have sizes of a few μm and respresent single crystal domains. Moving from a polycrystalline material to its single crystalline counterpart, the secondary particle SSA increases, while the primary particle SSA decreases until they converge to a single value.

Figure 11. Schematic representation of the specific surface areas (SSAs) for different CAM morphologies. The left side represents the secondary, the right side the primary particle SSA that act as boundaries to the minimal/maximal accessible surface area of the CAM. By processes such as mechanical compression, washing and electrochemical cycling, the SSA increases by better accessibilty of the inner pore structure. For single crystal materials, both boundaries converge to a single value.
Download figure:
Standard image High-resolution image
This leads to the conclusion that, depending on the cracking behavior, this transition to single crystalline morphology can increase or decrease the accessible surface area between CAM and electrolyte. For a mid-Ni material, e.g. NCM523, where cracking is assumed to be a minor issue, a single crystalline material can outperform the polycrystalline counterpart. However, for a Ni-rich material, where key electrochemical parameters correlate with the primary particle size due to particle cracking, a transition to single crystal materials induces a reduction in accessible surface area, which in turn leads to a reduction in achievable capacity due to the discussed kinetic limitations towards the end-of-discharge. In fact, it has been reported that cracking of cathode active materials is essential for their full utilization in a battery with a liquid electrolyte. 26,71 In contrast, for cells with a solid electrolyte, the interface between CAM and electrolyte cannot increase upon CAM fracturing, making the single crystal morphology interesting for that type of LIB, if a good contact between CAM and electrolyte can be maintained. 72,73
Conclusions
LNO regained the attention of the battery community as a model system for Ni-rich cathode active materials. In part I of this study, the frequently suggested correlation between 1st cycle capacity loss and the amount of excess Ni in the Li layer could not be confirmed for small values of z in Li1-z Ni1+z O2 (z ranging between 0.016–0.037). It was thus hypothesized that there might be a correlation with the particle morphology, which lead to the here presented in-depth study of the primary particle size distribution of differently synthesized LNOs by a top-view SEM image segmentation method that was validated against a manually conducted analysis. By means of krypton physisorption and laser scattering measurements of pristine and washed LNO powders, it could be shown that the SSAs of the LNO materials in their pristine state closely represented these of the secondary particles, while the SSAs of the washed LNO powders shifts towards (but does not reach) the specific surface area estimated for the fully separated primary particles.
Using in situ electrode capacitance measurements to characterize the CAM-to-electrolyte interface area during cycling, it was found that the primary particle specific surface area indeed determines the electrochemical performance of the synthesized LNO materials (i.e., the 1st cycle capacity loss, the cycling stability, and the impedance build-up). Particle fracturing and intrusion of the electrolyte into the pore structure lead to the convergence of this interface area towards the primary particle SSA. Although not shown in this publication, further influence of particle morphology on properties like gassing and transition metal dissolution is expected.
The main implication of this study is that the targeted design of cathode active materials cannot be performed without paying attention to particle morphology. The optimum morphology hereby depends on numerous factors, e.g., the chemical composition of the CAM, the cycling conditions, the electrode processing, the safety requirements, and the applied electrolyte. Furthermore, it must be emphasized that other material modifications in the form of doping and coating are likely to also have an impact on particle morphology, so that the latter must be considered when evaluating the intrinsic effects of dopings and coatings.
Acknowledgments
Cheuck Hin Ching and Louis Hartmann from the Chair of Technical Electrochemistry from the Technical University of Munich are gratefully acknowledged for the washing experiments and the krypton physisorption measurements. Phil Jack Holzmeister and Sebastian Michael Fritsch from the group Data Science for Chemicals from BASF SE are gratefully acknowledged for developing the image segmentation algorithm and their help with data processing.