the Creative Commons Attribution 4.0 License.
the Creative Commons Attribution 4.0 License.
 | 31 May 2022
Integrated drought risk assessment to support adaptive policymaking in the Netherlands
Marjolein J. P. Mens
Gigi van Rhee
Femke Schasfoort
Neeltje Kielen
Adaptive policymaking to prepare for current and future drought risks requires an integrated assessment of policy actions and combinations of those under changing conditions. This entails quantification of drought risks, integrating drought probability and socio-economic consequences for all relevant sectors that are potentially impacted by drought. The investment costs of proposed policy actions and strategies (various actions combined) can then be compared with the expected risk reduction to determine the cost-effectiveness. This paper presents a method to quantify drought risk in the Netherlands under changing future conditions and in response to policy actions. It illustrates how to use this information as part of a societal cost–benefit analysis and in building an adaptive long-term strategy. The method has been successfully applied to support decision making on the Netherlands' national drought risk management strategy as part of the National Delta Programme for climate change adaptation.
- Article
(718 KB) - Full-text XML
- BibTeX
- EndNote


Drought is a natural hazard that increases the water demand and at the same time reduces water availability for people, ecosystems, and economic sectors. Climate change, population growth, and upstream land use changes are projected to increase the risk of water shortage due to droughts in many countries across the globe (IPCC, 2022). Long-term strategies are needed to adapt to changing drought conditions. Such a planning process requires drought risk assessment tools (Wilhite et al., 2000), which aid in understanding drought frequency and its propagation through the hydrological system to impact water users.
Drought risk assessments are carried out to inform decision makers on the possible consequences of drought hazards and the potential benefits of risk reduction options. Drought risk is defined as the combination of drought probability and socio-economic and ecological consequences, where consequences are determined by the exposure and vulnerability of water users to water shortage. Consequences include direct effects, such as crop losses and shipping delays; indirect effects on the economy as a whole, such as unemployment and price changes; and intangible effects such as deteriorated water quality and biodiversity loss (see Logar and van den Bergh, 2012).
A risk-based approach to support drought risk management is rather new (Hagenlocher et al., 2019; Hall and Borgomeo, 2013). Much of the drought literature focuses on the quantification of meteorological or hydrological drought indicators on different temporal and spatial scales (e.g. Van Loon et al., 2016; Mishra and Singh, 2010; Veldkamp et al., 2015), and/or on the impact of drought on specific user groups like agriculture (e.g. Meza et al., 2021; Zhang et al., 2021), public water supply (e.g. Ajami et al., 2008; Connell-Buck et al., 2011; Wendt et al., 2021), or electricity production (Byers et al., 2020).
Modelling drought impacts is a complex task because of the indirect and diffuse impacts of droughts, the lack of historic drought impact data, the variety of mechanisms that cause damage for different water users, and the multicausality of impacts such as heat waves and price effects (Bachmair et al., 2016; Blauhut et al., 2015; Musolino et al., 2018; Naumann et al., 2019; Vogt et al., 2018; Wilhite et al., 2014). The majority of drought risk assessments over the past 50 years used an index-based approach (62 %) to tackle the complexity of drought risk, while only 12 % of the assessments used dynamic simulation methods (Hagenlocher et al., 2019). An index-based approach maps drought risk by combining drought indicators with weighted vulnerability factors (e.g. Blauhut et al., 2015; Carrão et al., 2016; Naumann et al., 2014). Dynamic simulation approaches on the other hand are able to capture the complex relationship between drought propagation and socio-economic impact and are considered more useful for policy support when adaptation decisions have to be made (Hagenlocher et al., 2019). However, they require integrating hydrological system knowledge with social, economic, and environmental impact mechanisms in a coupled system model. Only a few examples exist in which quantified drought risk is employed as part of a cost–benefit analysis to support decision-making on drought mitigation and adaptation policies (Hagenlocher et al., 2019; Logar and van den Bergh, 2012; Rossi et al., 2005). In many cases, water shortage has been assumed as a proxy for drought impact because of a lack of data and the complexity of the economic assessment (Rossi and Cancelliere, 2013).
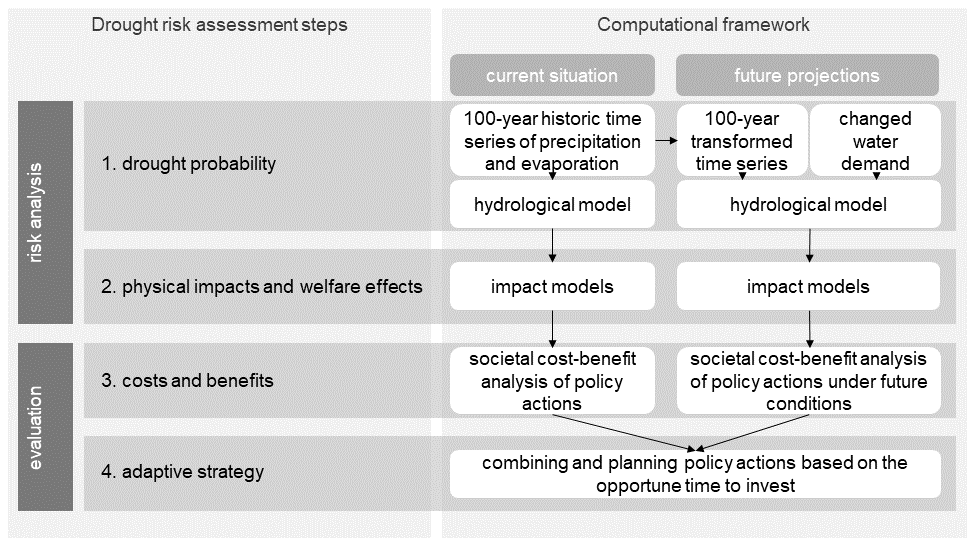
This paper presents an integrated drought risk assessment framework and a demonstration of its application for the Dutch Delta Programme, which is a long-term government programme to ensure that the Netherlands is climate-proof by 2050, including resilience to drought-induced water shortage. The presented drought risk assessment is based on dynamic simulation of the hydrological system and coupled impact models that propagate water shortage to societal and economic impact. The framework is partly based on earlier research carried out by a consortium of Dutch research institutes, consultants, and water boards for the Ministry of Infrastructure and Water Management (van der Vat et al., 2016) as well as for the European Horizon 2020 project IMPREX (IMproving PRedictions and management of hydrological Extremes) (Groot et al., 2020). The assessment framework consists of four steps (Fig. 1). To analyse drought probability (step 1), a long (100-year) daily time series of hydrological and meteorological variables, including precipitation, evapotranspiration, and river discharge, was used to represent a variety of droughts, both for historical situations and for future projections. In step 2, the time series were first simulated with a national hydrological model to obtain relevant hydrological and human responses such as river discharge, groundwater flow, irrigation, river water levels, salt concentration, groundwater extractions, and water temperature. Next, the welfare effects of water shortage were estimated by coupling economic impact models for agriculture, shipping, industry, and drinking water with the national hydrological model. The impact models first simulate the “physical” impacts on the various drought-prone sectors (e.g. agricultural yield losses in kg ha−1, reduced draught and waiting times for shipping, and water quality for drinking water and industry) and subsequently estimate the national welfare effect, considering price elasticity and other market mechanisms. In step 3, the costs of proposed policy actions were compared with the calculated change in drought risks (i.e. annual average impacts summed over the different sectors) for different future scenarios of climate change and socio-economic developments. In step 4, this information was used to determine the opportune time to invest. By comparing the costs of policy actions with the change in drought risk together with the determined opportune investment time, an adaptive strategy was built. Finally, the evaluation based on societal costs and benefits supported the decision by the minister to allocate funds for drought risk mitigation. This paper demonstrates the applicability of the framework by showing the results of a selection of policy actions for two regions in the Netherlands.
2.1 Study area
The Netherlands is a low-lying delta with peat and clay soils as well as relatively higher grounds with sandy soils. Fresh-water supply largely relies on two large transboundary rivers: the Rhine and the Meuse, a large fresh-water reservoir in the north (IJssel Lake), and groundwater reserves on the higher grounds, including the coastal dunes. The estuary in the west is susceptible to salt water intrusion when river flows are low, limiting the fresh-water intakes for industry, drinking water, and regional water management including agricultural water supply. Ancient deep salt groundwater along the coastal area causes saline seepage into the drainage system of low-lying polders, which has to be flushed away. During dry summers, river water intakes are important for irrigation, flushing the regional surface water system, and maintaining surface water levels (to prevent peat oxidation and land subsidence and to ensure stability of embankments). The focus of this paper is on two regions that depend on water supply from the main river system: the region Southwest and the region North (Fig. 2). The region North depends on water supplied from the IJssel Lake, which is in turn fed by the Rhine and has a limited buffer capacity. One of the major inlets for the region Southwest is vulnerable to salt water intrusion from the North Sea. An emergency supply route further upstream is available but with limited supply capacity.

Figure 2Study area: (a) major soil types of the Netherlands and (b) major rivers, lakes, and water supply routes of the Netherlands and the location of the two focus regions in grey, largely containing peat and clay soils.
The Dutch Delta Programme is a national climate adaptation strategy to protect the country from flooding, to mitigate the impact of extreme weather events, and to secure fresh-water supply. One of the aims is to ensure that the Netherlands remains resilient to drought-induced water shortage. Every 6 years the long-term adaptation strategy and short-term policy actions are reassessed in view of the latest insights into climate change and socio-economic developments. New funds for policy actions are released based on an evaluation of their costs and societal benefits.
2.2 Drought probability, water shortage, and impacts
2.2.1 Drought probability
Drought hazard in the Netherlands is often measured as the cumulative precipitation deficit, which is the cumulative difference between potential evapotranspiration and precipitation in the growing season (April to September), set to zero if smaller than zero (Beersma and Buishand, 2004; Philip et al., 2020). This metric is used as a first indication of the projected change in meteorological drought. Drought impacts in the Netherlands are also determined by coinciding periods of low river flows in the Rhine and/or the Meuse, which can be measured as the annual cumulative difference between daily river discharge and a user-defined threshold for the days those flows are below this threshold. This threshold was set at 1000 m3 s−1 for the Rhine and 50 m3 s−1 for the Meuse. Deficits are only counted when the duration of the low-flow period is 7 d or longer.
2.2.2 Water shortage
The National Water Model (NWM; Mens et al., 2021) was used to simulate the propagation of droughts through the hydrological system. This physically based model simulates time series of actual and potential evapotranspiration, soil moisture, and groundwater for phreatic groundwater and deeper aquifers, at a spatial resolution of 250 m ×250 m. Also, daily time series of discharge, water levels, temperature, and chloride concentration are available at several locations in the main river system. Water demand and water shortage are spatially aggregated over 17 regions and divided into three main use categories (i.e. irrigation, flushing, and water level management).
2.2.3 Impacts
Water shortage can be combined with a physical dose–effect relationship to determine the physical impact on a sector (e.g. yield loss), which can then be combined with economic data to estimate the national welfare effect. When welfare effects are combined with the probability of water shortage, a drought risk curve is obtained which shows the probability distribution of the welfare effects, and from which risk indicators can be derived such as the expected annual economic impact (Hall and Borgomeo, 2013; Logar and van den Bergh, 2012; Rossi and Cancelliere, 2013). The impact of droughts was quantified in monetary terms for shipping, drinking water, industry, and agriculture. This selection was made from a list of sectors impacted by droughts in the Netherlands, based on reported impacts of historic droughts and in consultation with several drought experts. Drought impacts on soil subsidence, instability of peat embankments, water quality, and biodiversity loss were considered relevant, but information was lacking to develop an impact model. Instead, these effects were monetized with a shadow price (under the category “other effects”). Other drought impacts, such as on recreation and urban green spaces, were not monetized because the impact was considered relatively small, or these were not expected to be affected by policy actions. Since the focus is on national welfare effects, the additional costs of consumers or producers outside the Netherlands were not included.
2.2.4 Agriculture
We used the Dutch agricultural cost model (AGRICOM) to propagate the soil moisture deficits and irrigation amounts calculated by NWM to an annual crop yield reduction and irrigation costs. AGRICOM is based on empirical studies and mathematical models, developed for the first policy analysis for water management in the Netherlands in the 1980s (Abrahamse et al., 1982) and updated in 2009 (Mulder and Veldhuizen, 2014) for use in the Dutch Delta Programme. The AGRICOM damage functions, relating crop-specific yield reduction with transpiration reduction, are comparable to those developed and applied by the Food and Agriculture Organization of the United Nations (Steduto et al., 2012). It additionally includes the cumulative effect of crop yield reduction throughout the growing season as well as yield reduction due to salinization stress. An economic tool (Polman et al., 2017, 2019) was used to assess the impact of crop yield reduction and higher irrigation costs on the national welfare, by calculating the change in consumer and producer surplus. The price elasticities in this tool are based on observed price changes during historic droughts (Briene et al., 2019) and information on the Netherlands' market share, which determines the influence on crop prices in the regional, national, or international market.
2.2.5 Inland water transport
The impact of droughts on inland water transport was estimated using the Dutch inland transport analysis model BIVAS developed by the Ministry of Infrastructure and Water Management (Rijkswaterstaat, 2019) and an economic tool. BIVAS calculates annual transport costs based on a daily time series of water levels in the main waterways (simulated by the National Water Model), a database with actual daily shipping movements for various types of vessels and assumptions on draught. Reduced water levels will result in reduced load of vessels and therefore more trips, as well as increased travel times due to detours and increased waiting time at sluices, which all results in higher transport costs. The economic module adds the costs of temporary storage of goods or transportation by other modalities. The total additional costs due to droughts were calculated by taking the difference with the total costs in a simulated year without water level restrictions. Finally, a correction was made for the costs of foreign vessels or costs paid by consumers in other countries (about 50 % in the current situation), since societal cost–benefit analyses for the Dutch Delta Programme only consider welfare effects for the Netherlands.
2.2.6 Drinking water and industry
Droughts may affect drinking water production and industrial use by deteriorating water quality. Drinking water companies in the Netherlands are obliged by the Dutch drinking water law (Articles 32–38) to provide drinking water with 100 % reliability. The drinking water production companies are therefore well-prepared for periods of droughts by maintaining sufficient buffer capacity and diversifying drinking water resources (surface water, groundwater, river bank infiltration). However, future droughts may reduce the long-term reliability of drinking water supply, and therefore the costs of drought adaptation to maintain the supply reliability represent the economic impact of (future) droughts on drinking water supply.
A similar approach was taken for industries (e.g. paper, steel, chemical) that rely on water for production or for cooling purposes. It is assumed that industry will invest in adaptation measures to keep the probability of production stops very low under changing conditions. Limitations in cooling water availability are not expected and therefore not taken into account (Briene et al., 2018). The probability of production stops due to declining water quality during droughts has been estimated at yr−1, based on historic measurements and interviews with the sector (Briene et al., 2018). For the risk analysis we have assumed that adaptation investments are aimed at maintaining this failure probability under future scenarios.
To estimate the required adaptation investment under future change, we first calculated the additional treatment capacity required by estimating the additional exceedance (in comparison with the current situation) of the concentration of six indicating substances at water intakes for water supply and industry. As a proxy for adaptation costs it has been assumed that drinking water companies and industries will implement reverse osmosis treatment as an additional step to cope with the drought-induced deterioration of water quality. In line with the agriculture and shipping impact models, we do not include the potential impact of events smaller than yr−1. Furthermore, because the demand for drinking water is inelastic, the semi-public drinking water companies will increase the consumer prices to cover for the adaptation costs. For industry supply, we also used the adaptation costs as a proxy for the welfare effect of drought.
2.2.7 Other effects
Droughts may have other societal, economic, and environmental impacts, such as the impact of reduced surface water quality causing deterioration of aquatic biodiversity, and the impact of lower (ground) water levels on terrestrial nature, infrastructure, stability of embankments, and CO2 emissions in peat areas. These impacts are monetized by multiplying the simulated water shortages for flushing and water level management in the polder systems with a shadow price of water. The shadow price of water can be defined in different ways, for example by the value of water based on all (opportunity) costs and externalities, by the value of alternative use of water, or by the marginal value of water for the farmer (Bierkens et al., 2019; Young and Loomis, 2014). In this paper, we defined the shadow price of water as the marginal value of an additional cubic metre of water during periods of water shortage. The shadow price was derived from the agricultural impact model outcomes, as a regression between crop evapotranspiration and crop yield minus the additional costs of irrigation, which represents the additional yields that can be obtained by adding 1 m3 of water. The shadow price has been calculated for five different regions in the Netherlands averaged over all irrigated crops. The implicit assumption is that the value of water for nature, infrastructure, and other functions is equal to or higher than the value of additional irrigation water for the agricultural sector. This assumption is supported by the Dutch national prioritization rules for water allocation during periods of water shortage, which states that flushing and water level control should be prioritized over irrigation. The monetized other effects were only considered in the evaluation of policy actions.
Additionally, stakeholders provided qualitative scores on effects that could not be monetized with the above modelling framework.
2.3 Future scenarios
Long-term drought risk may change due to climate change and socio-economic developments. To take this into account in policymaking, the Dutch Delta Programme develops and frequently updates so-called “Delta scenarios” (Wolters et al., 2018), which combine climate change scenarios from the Royal Netherlands' Meteorological Institute (Lenderink et al., 2014) with population and economic growth projections by the Netherlands planning agencies (CPB/PBL, 2015). Lenderink et al. (2014) distinguish four climate change scenarios: a moderate (G) or fast (W) temperature rise, combined with either low (L) or high (H) change in the circulation patterns over western Europe, resulting in drier summers. GL and WH were combined with two socio-economic scenarios and used in the model analyses. The moderate–wet climate scenario GL is combined with low and high socio-economic growth in the Delta scenarios “Rust” and “Druk”, respectively; the warm–dry climate scenario WH is combined with low and high growth in the Delta scenarios “Warm” and “Stoom” respectively (Table 1). The scenarios provide qualitative and quantitative data on the climate, water systems, water demand, and use of land. Each scenario has its own map with projected land use. The qualitative information consists of narratives that describe the backgrounds and the interconnectivity of the issues. The quantitative data include time series for various factors, including temperature, precipitation, and river discharges as well as degree of soil subsidence and salinization. To limit the number of model simulations, the effect of policy actions was analysed for the reference situation and Stoom scenario only. The reference situation represents the current climate, land use, and water management. Calculated drought risk under the reference situation was also assumed to represent the lower value of the bandwidth of future drought risk, and the Stoom scenario represents its upper value.
Table 1Overview of scenario assumptions in the projections for 2050 (adapted from Wolters et al., 2018). Climate change is relative to the average climate over the period 1981–2010 (reference).

2.4 Model input data
As input for the hydrological model, 100-year time series of precipitation, evapotranspiration, river discharge, and sea level were used (overview of data sources given in Table 2). Historical meteorological data consist of daily time series of gridded precipitation (1911–2011) and reference (Makkink) evapotranspiration calculated from sunshine duration (1911–1981) and radiation (1981–2011), developed by the Royal Dutch Meteorological Institute (KNMI). River discharge for the Rhine and the Meuse was obtained from the national monitoring network of Rijkswaterstaat. For future projections, the historical time series were transformed with a transformation tool (Bakker, 2015), which applies a change factor consistent with each climate change scenario (Sect. 2.3) and takes into account that the change in the median may differ from the change in the extremes.
Table 2Overview of measurement data sources used as model input.
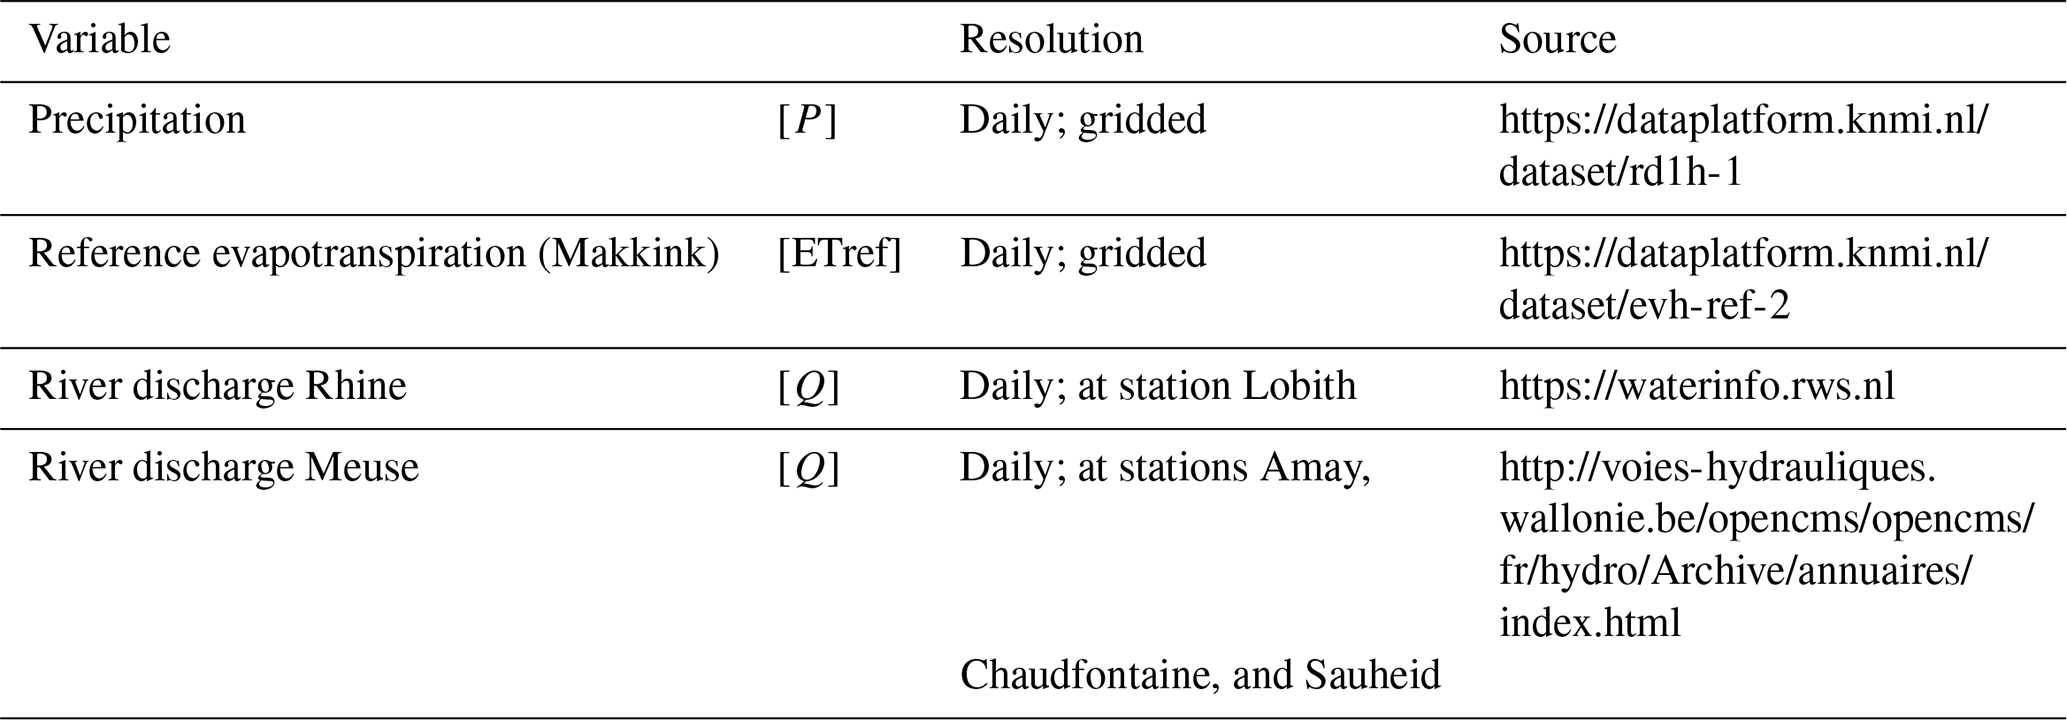
All links in the table were accessed on 1 November 2018.
2.5 Costs and benefits of policy actions
Limiting the economic and societal impact of water shortages requires collective efforts from all the government authorities with water-related tasks and fresh-water users. Within the national Delta Programme, these parties (stakeholders) jointly identify policy actions that contribute to increase long-term drought resilience. In a 6-year policy cycle, these stakeholders discuss the current and future drought risk based on the national risk analysis, build a long-term strategy, and propose short-term policy actions that will be implemented during the next policy cycle. The national government has to endorse the changes to the strategy and approve the new policy actions for the short term in order to release the required funds for implementation. In a funnelling process a long list of possible measures is narrowed down to a shorter list of preferential measures. The selection of preferential measures is not only based on the efficiency of the policy actions in terms of drought risk reduction. Other societal goals (such as solidarity and sustainability) are to be achieved as well as (political support). The final short list of proposed actions is used in the societal cost–benefit analysis. The stakeholders provide information on investment costs, operation and maintenance cost, potential hydrological effects, and a variety of other benefits which are scored qualitatively. The provided data were tested for consistency, and when information was lacking estimates were based on previous societal cost–benefit analyses or additional information provided by cost experts from Rijkswaterstaat.
The cost estimates were translated into the equal annual annuity (Eq. 1), i.e. a series of equal cash flows over the lifetime of the measure, in order to equally compare measures with different life spans, investments, and annual operational and maintenance costs.
where r is the yearly discount rate (percentage), n is the life span (yr), I is the investment costs (euro), and C represents the annual costs for operation, management, and maintenance (euros per year).
A standard discount rate of 3 %–4.5 % is prescribed by the Dutch government, where 4.5 % is for public infrastructure investments with substantial fixed costs.
The quantified risk reduction per scenario was compared with the annual cost for each policy action. With a positive balance (the avoided drought risk greater than or equal to costs), the policy action is positively evaluated from a societal welfare perspective. Both monetized effects based on calculated change in drought risk and non-monetized effects provided by the stakeholders were included. For each policy action, three evaluation outcomes are possible:
-
cost-effective, when costs are smaller than monetized effects and non-monetized effects are either positive or slightly negative;
-
indecisive, when (a) costs are slightly larger than the monetized effects and non-monetized effects are positive, or (b) costs are smaller than monetized effect and non-monetized effects are (slightly) negative;
-
not cost-effective, when costs are larger than monetized benefits and non-monetized effects are either negative or slightly positive.
2.6 Building an adaptive strategy
A drought risk management strategy is a combination of several short-term and long-term policy actions. The short-term actions involve a decision by the Dutch Government, but the long-term actions are planning options that need a decision at the end of the next policy cycle or later. Whether a policy action is included in the advised strategy for the coming 6 years (2022–2027) depends on its cost–benefit evaluation as well as its opportune time to invest. The balance of costs and benefits depends on the scenario. When policy actions are not cost-effective now but may become cost-effective under the Stoom scenario, the opportune time to invest is determined by first interpolating the results between the reference and Stoom scenarios and then averaging the effects over these scenarios (see Fig. 3). When costs and averaged effects intersect, it is assumed to be the opportune time to invest. An investment done before the opportune time means that costs may be higher than the benefits for some years, while investing after the opportune time may result in missed benefits. If the opportune time to invest was in or before 2028, the action was included in the preferred strategy for the period 2022–2027.
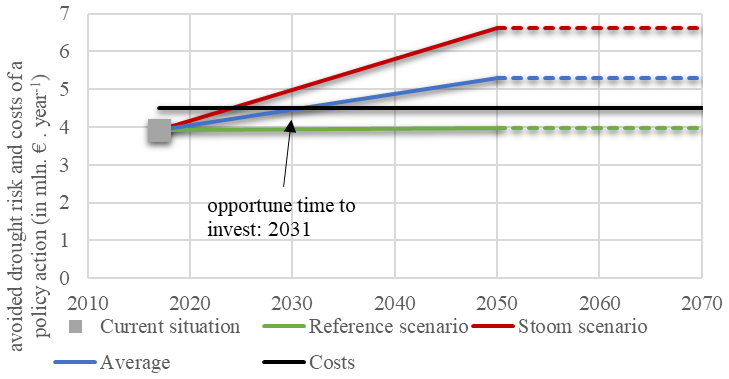
Figure 3Determination of opportune time to invest based on the time when the average avoided drought risk of the reference and Stoom scenarios intersects with the annual costs (EAA). Note that extrapolation beyond 2050 is required for societal cost–benefit analyses of public investments in the Netherlands and is limited to 100 years ahead in the analysis.
3.1 Changing drought risk when current policy is continued
A warmer climate will result in an increase in annual precipitation and reference evapotranspiration; however large uncertainty exists about the change in precipitation patterns during the growing season (April–September) and thus about increasing droughts, determined by the frequency and intensity of precipitation deficit as well as the frequency and duration of low-river-flow periods (Fig. 4). Based on the model simulations, the current drought risk in the Netherlands is estimated at EUR 372 million per year and may increase to 611 million until 2050 according to the worst-case scenario Stoom (Table 3). Drought risk in 2050 in the Warm scenario, with a similar climate change scenario but assuming limited socio-economic growth, was estimated at EUR 607 million per year. In the moderate scenarios Rust and Druk, the drought risk is estimated to remain similar to the current situation.
Table 3Current and future drought risk (in millions of euros per year, excluding VAT) in the Netherlands and the two focus regions when continuing current policy, broken down by sector. Note that n/a stands for not applicable.
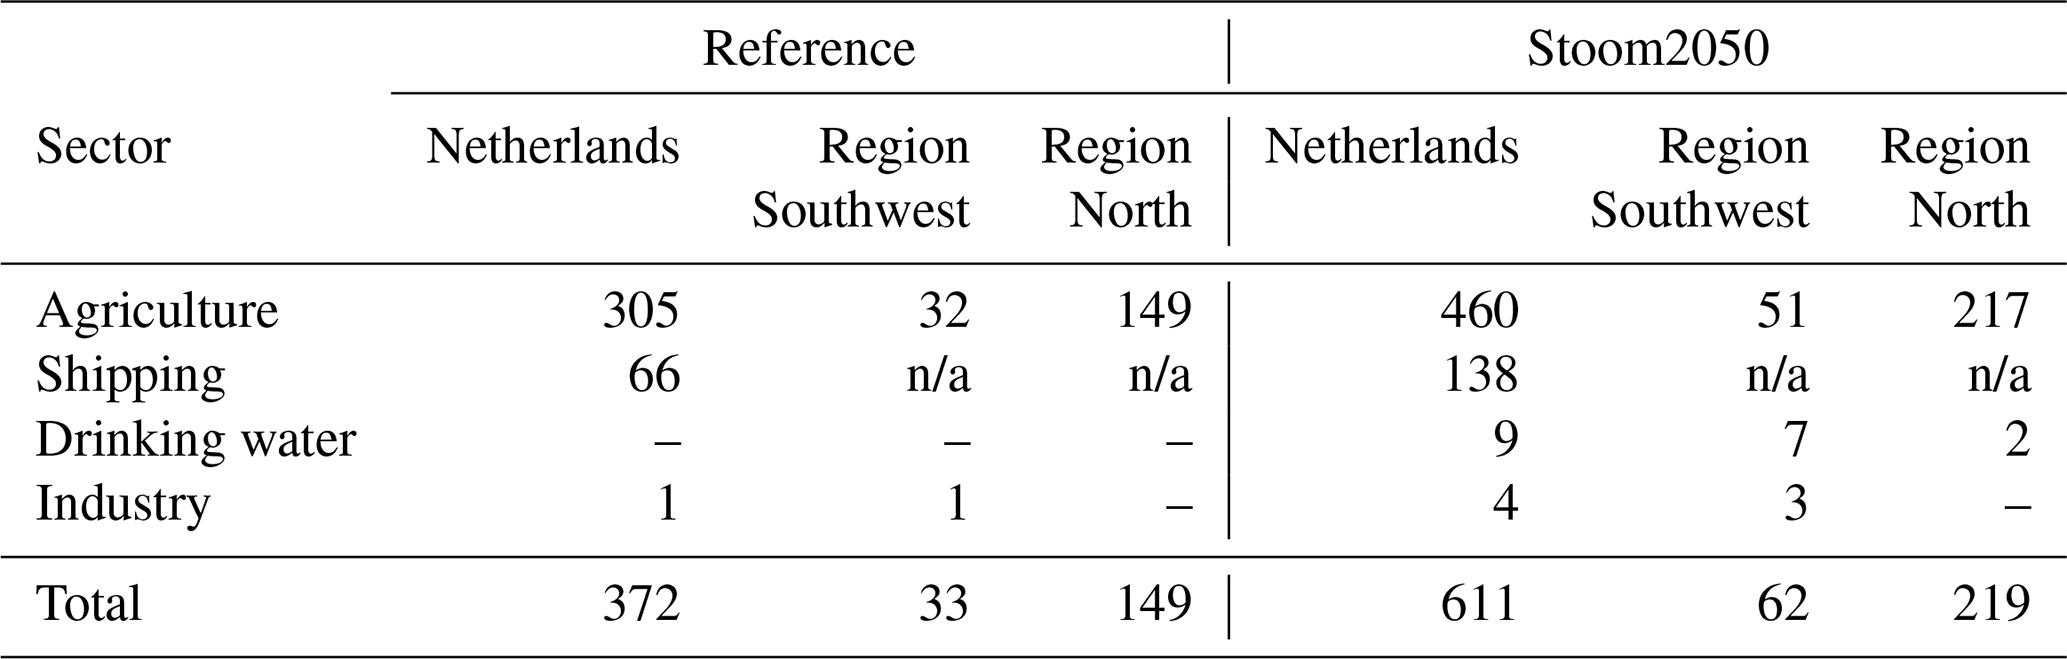

Figure 4Change in meteorological and hydrological drought probability in the two climate scenarios GL and WH, measured as the maximum cumulative precipitation deficit in millimetres (a) and the duration of low flows in the Rhine (b) and Meuse (c) in days. Only periods with a minimum duration of 7 d are considered.
The drought risk is dominated by the effect on agriculture, but the relative increase in Stoom is higher in the other sectors. The risk for agriculture may increase by EUR 155 million in 2050. Increased drought and related salt water intrusion affect all regions. The highest absolute increase of about EUR 70 million per year occurs in the region North, one of the largest regions. This increase is largely due to the extra costs of irrigation in response to a warmer climate.
Drought risk for the shipping sector is projected to double in the next 30 years in the Stoom scenario, an increase of EUR 72 million per year. This is mainly due to the increase in low-flow periods in the Rhine. Drought risk for drinking water supply is estimated to increase by about EUR 9 million per year in the Stoom scenario and industrial risk by EUR 3 million per year. The current risk for industry of EUR 1 million per year is caused by one of the largest industrial areas of the Netherlands, located in the region Southwest, which depends on a small fresh-water lake (Brielse Lake; see Fig. 2) that is vulnerable to salt water intrusion from the North Sea.
3.2 Costs and benefits of policy actions in the region North
Three policy actions were considered in the region North: (N-1) water demand reduction for flushing of sluices in the Afsluitdijk (the dam between the Wadden Sea and the IJssel Lake), (N-2) increased water supply for the eastern part of the region North through increased capacity of the inlet from IJssel Lake as well as the supply canals, and (N-3) increased supply by an additional emergency supply route from further downstream the Rhine towards IJssel Lake (see Fig. 2), which can be used during extreme drought events when the IJssel discharge is insufficient to timely refill the IJssel Lake buffer.
The evaluation of individual policy actions revealed a positive cost–benefit ratio for all actions in the Stoom scenario, but only policy action N-2 is already cost-effective in the reference (Table 4). Policy action N-3 will become cost-effective under the Stoom scenario. N-3 extracts water from the Waal, which has a negative effect on shipping in the Stoom scenario of about EUR 0.02 million per year, but this effect is much smaller than the positive effect of extra water supply for agriculture (2.16 million per year in the Stoom scenario). Because it is likely to become cost-effective before 2028 (opportune time to invest is 2021) and there are considerable positive non-monetized effects, it was advised to include it in the strategy. Policy action N-1 is not cost-effective before 2028, but it can be divided over several phases. Investing in one of the four sluices in the Afsluitdijk will reduce the water demand for flushing by 25 %. This will reduce the costs while the risk reduction in the reference remains the same. This can be explained by the fact that the calculated water shortage in the reference is small and investing in four sluices would imply overdimensioning.
Table 4Costs, benefits, and opportune time to invest for the individual policy actions in the regions North (N-1 to N-3) and Southwest (S-1 and S-2).
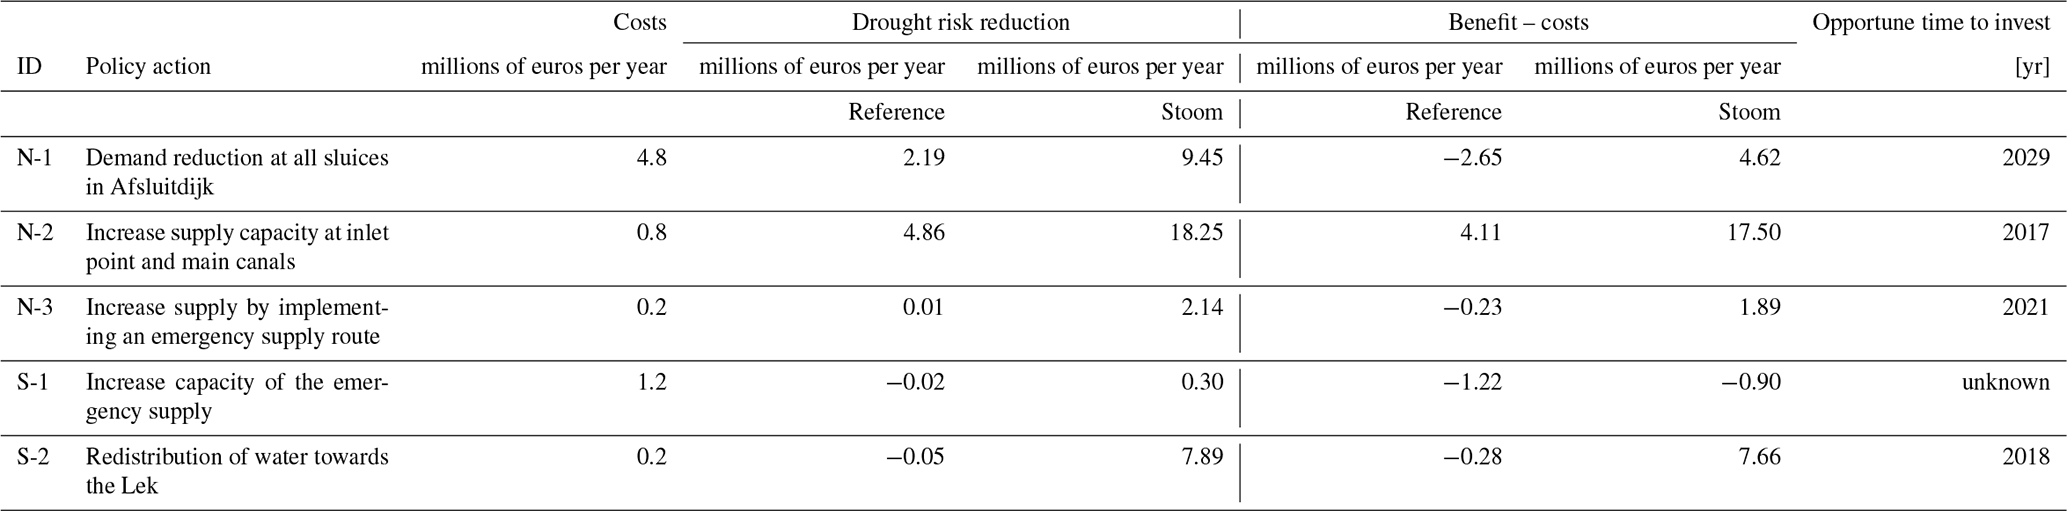
It was advised to build a strategy with all actions, but only one sluice (N-1) until 2028. Figure 5 shows the combined cost and avoided drought risk of this strategy for three points in time and how the avoided risk is distributed among the users. The avoided drought risk in 2050 is based on the Stoom scenario assuming all actions will be implemented (including the other three sluices). The lower estimate of avoided drought risk for 2050 is estimated at EUR 7.06 million per year, equal to the avoided risk in the reference.
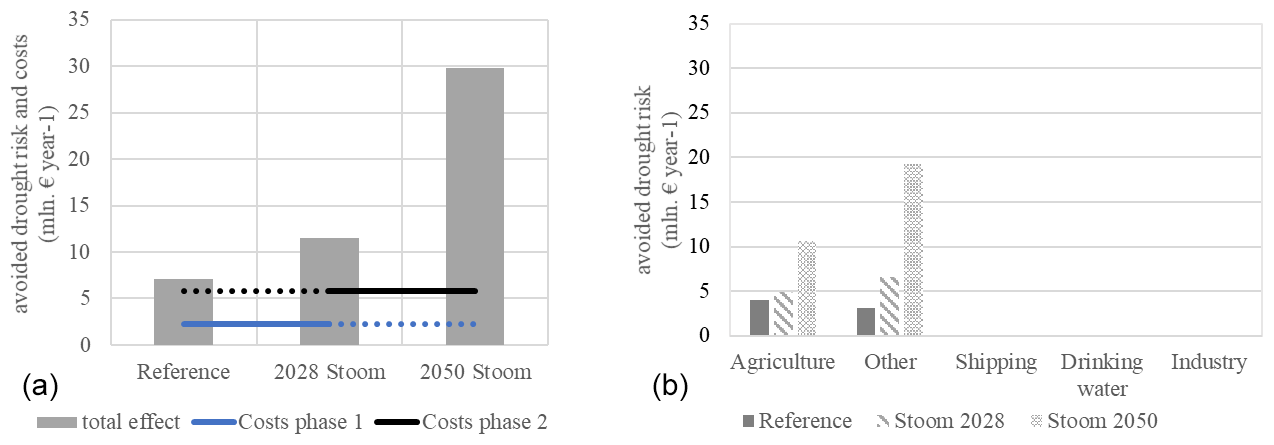
Figure 5Comparison of costs and avoided drought risk of the advised strategy in the region North. (a) Summary of costs and effects in the reference situation, in 2028 (Stoom) and in 2050 (Stoom). (b) Distribution of avoided drought risk over different user categories. “Other” refers to the combined economic effects of water shortage for flushing and water level management in peat areas.
3.3 Costs and benefits of policy actions in the region Southwest
Two policy actions were considered in the region Southwest: (S-1) increased supply by enlarging the capacity of the emergency supply route and (S-2) changed river distribution thereby increasing the discharge in the river Lek. This redistribution will reduce the risk of salt water intrusion for drinking water inlet points along the river Lek, but it will reduce water levels for economically important shipping routes. The evaluation of the individual policy actions revealed a negative balance for S-1 for both scenarios and a positive balance for S-2 only under the Stoom scenario. S-1 reduces the monetized risk (agriculture and other effects) and has considerable positive non-monetized effects. These non-monetized effects were scored by the stakeholders and involve an increase in recreational value and supply reliability as well as a reduction in urban heat stress. It is however uncertain whether the sum of effects is sufficient for a positive evaluation. S-2 mainly reduces the risk for drinking water, but it is also conditional for S-1, since the alternative supply route extracts water from the Lek. Both actions increase the risk for shipping by EUR 0.10 to EUR 0.20 million per year, depending on the scenario. Based on the evaluation of individual policy actions, it was advised to invest in S-2 in the coming period until 2028 (phase 1), because it is likely to become cost-effective (opportune time to invest was estimated to be in 2018), it has positive non-monetized effects, and it is conditional for S-1. It was further advised to postpone the investment in S-1. The resulting strategy thus includes implementing S-2 until 2028 and both actions for the period after 2028 (Fig. 6).
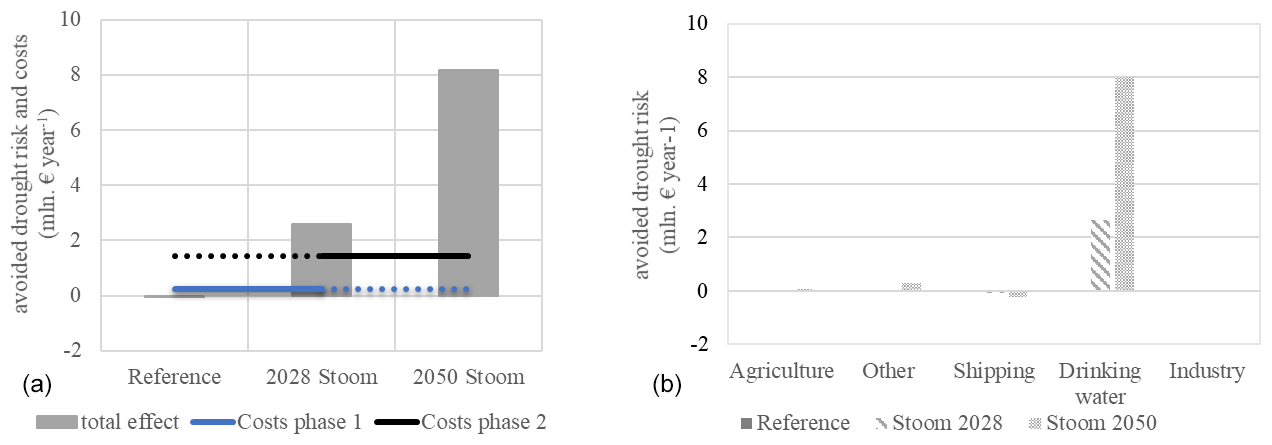
Figure 6Comparison of costs and avoided drought risk of the advised strategy in the region Southwest. (a) Summary of costs and effects in the reference situation, in 2028 (Stoom) and in 2050 (Stoom). (b) Distribution of avoided drought risk over different user categories.
4.1 Process-based drought impact modelling
This paper presents a framework for process-based, integrated drought risk assessment and illustrates it with an application for the Netherlands. The framework combines a time-series analysis with process-based hydrological models and impact models as well as economic cost–benefit analysis to quantify the change in drought risk due to changes in climate, land use, population, and policy actions. This dynamic simulation approach required the coupling of several impact models with the hydrological simulation model. This approach acknowledges the complexity of drought propagation to societal impact, but it is also data- and computation-intensive. The impact models use different market valuation techniques. For agriculture and shipping we used market price methods to estimate direct costs from simulated production losses and resulting changes in market prices. For drinking water and industry, we used the avoided cost approach to estimate the investments that would be needed to avoid future cost to deal with more frequent or severe drought. Other effects, for which impact models were not available, were monetized by multiplying modelled water shortage with an assumed shadow price of water. This category represents a range of drought impacts related to soil subsidence (carbon emissions, biodiversity, and damage to infrastructure and buildings), urban water supply (e.g. heat stress), and water quality (aquatic biodiversity). It is recommended to further improve the impact calculation for drought-induced soil subsidence, by developing a subsidence model combined with carbon prices for soil subsidence and replacement costs for buildings and infrastructure. It is further recommended to develop a method to better incorporate the impact on ecosystems and biodiversity. Literature suggests that a more complete understanding of how droughts impact ecosystems will lead to more effective plans and more sustainable communities (Crausbay et al., 2017). However, valuation of ecosystem impacts is not straightforward, and broadly accepted assessment methods are lacking (Bartkowski et al., 2015; Victor, 2020). More research is thus needed to incorporate ecological drought in integrated drought risk assessment.
Compared to index-based approaches to drought risk assessment (Carrão et al., 2016), we have shown that dynamic simulation of drought risk allows the quantitative evaluation of costs and benefits of planned drought adaptation investments. Additionally, the assessment provided insight into the distribution of drought costs and benefits over different waters users and regions. For example, the emergency supply route for the region North could further increase water shortage in the region Southwest, and adjusted distribution of river water significantly reduces the adaptation costs of the drinking water sector but increases drought risk for shipping. Insight into distribution effects could be further improved, for example by including the impact on farmers' livelihoods in addition to the quantified welfare effects for the Netherlands. This would require additional information on the financial and economic resilience of the agricultural sector. Finally, the uncertainty in quantified benefits due to the different future scenarios was translated to the opportune time to invest, which supported the decision on both short-term actions and the long-term strategy.
4.2 Model limitations
Limitations of the hydrological model are related to the large spatial scale and level of detail of the processes that are included. Considering the purpose of the national-scale model, i.e. to assess long-term scenarios and strategies, some degree of uncertainty can be accepted. On the other hand, more detail is often required for the cost–benefit evaluation of short-term policy actions. The National Water Model is relatively complex with long computation times, which limits the number of strategy–scenario combinations of policy actions that can be explored on a national scale (Mens et al., 2021). It is recommended to further improve the framework to better deal with different timescales for short-term actions and long-term strategies.
Besides uncertainties resulting from the chosen model representation of the hydrological system and from the future developments assumed in the scenarios, uncertainties are introduced in the economic impact models and cost–benefit analysis. For example, the agricultural impact model does not include the impact of lower agricultural production and resulting price changes due to simultaneous droughts in neighbouring countries. This effect may be significant. A recent inventory of farmers' income effects of the 2018 and 2019 drought in the Netherlands showed that for some crops and regions the price increase compensated for the yield reduction (Van Asseldonk et al., 2021). Also, the cost–benefit analysis is carried out with a discount rate of 4.5 %. For some effects a lower basic discount rate of 3 % would have been more appropriate as advised by the Dutch Economic Planning Agency at the time of the study. A sensitivity analysis with a discount rate of 3 % showed that the preferred strategy did not change, although absolute cost-effectiveness of the policy actions slightly improved. Finally, a dynamic impact model is lacking for the category other effects, representing the economic effect of water shortage for flushing and water level management. Instead, a shadow price of water was applied, which introduces uncertainty. The comparison of costs and benefits in the region North showed that avoided drought risk for other effects may be significant. It is therefore recommended to develop one or more dynamic impact modules for this use category in order to reduce the uncertainty.
In this paper we developed and applied a process-based method for integrated drought risk assessment in the Netherlands. By coupling hydrological models with socio-economic impact functions, we were able to monetize the impacts of drought-induced water shortage for agriculture, shipping, drinking water production, industrial water use, urban water supply, water quality, and soil subsidence. The modelling framework allowed us to quantify how drought risks will evolve under various future scenarios and to what extent proposed policy actions are able to reduce the risk against acceptable cost. We showed how this information can be used to support the development of adaptive strategies through determining the opportune time to invest, considering the uncertainty about future developments in both water supply and demand. Because drought may have an impact on a wide range of water users, it is important to couple the socio-hydrological system model with economic impact models. This allows exploration of combinations of policy actions that aim at water supply increase, demand reduction, and impact reduction for the various sectors. Furthermore, the national-scale risk assessment provided insight into how costs and benefits are distributed over the different regions and sectors.
With the application we have shown that it is possible to use a process-based drought risk assessment method to support decision-making under future uncertainty. Similar methods can be developed for other countries, but this requires hydrological models and preferably process-based impact models for a variety of water use sectors that can be connected. If process-based impact models are not available for all sectors, we showed that using shadow prices is a useful alternative to monetize societal and ecological drought impacts.
The underlying model software of the National Water Model is partly open source and partly in transition to the open domain (http://www.nhi.nu/nl/index.php/modellen/lhm/, NHI, 2022a). All model data are freely available (http://www.nhi.nu/nl/index.php/data/, NHI, 2022b).
MJPM managed and supervised the model analyses and was responsible for the draft preparation. FS coordinated the impact model development and contributed to the original draft preparation. GvR coordinated the societal cost–benefit analysis and opportune time to invest and contributed to the original draft preparation. NK coordinated the stakeholder input and contributed to the discussion of results and editing the manuscript.
The contact author has declared that neither they nor their co-authors have any competing interests.
Publisher's note: Copernicus Publications remains neutral with regard to jurisdictional claims in published maps and institutional affiliations.
This article is part of the special issue “Drought vulnerability, risk, and impact assessments: bridging the science-policy gap”. It is not associated with a conference.
We thank the entire model analysis team and the Delta Programme stakeholders for their effort in the drought risk assessment process over the past 6 years. We thank in particular Janneke Pouwels (Deltares) and Nienke Kramer (Deltares) for their help with the visualizations for this paper. We are grateful for the constructive comments of the two anonymous reviewers that greatly improved our manuscript.
This paper was edited by Gustavo Naumann and reviewed by two anonymous referees.
Abrahamse, A. H., Baarse, G., and Van Beek, E.: Policy analysis of water management for the Netherlands. Vol XII: Model for regional hydrology, agricultural water demands and damages from droughts and salinity, N-1500/12-NETH for Rijkswaterstaat, https://repository.tudelft.nl/islandora/object/uuid:9de09c40-3ef7-4bd2-9b17-a6b2bce7522c (last access: 13 December 2021), 1982.
Ajami, N. K., Hornberger, G. M., and Sunding, D. L.: Sustainable water resource management under hydrological uncertainty, Water Resour. Res, 44, 11406, https://doi.org/10.1029/2007WR006736, 2008.
Bachmair, S., Stahl, K., Collins, K., Hannaford, J., Acreman, M., Svoboda, M., Knutson, C., Smith, K., Wall, N., Fuchs, B., Crossman, N., and Overton, I.: Drought indicators revisited: the need for a wider consideration of environment and society: Drought indicators revisited, Wiley Interdiscip. Rev. Water, 3, 516–536, https://doi.org/10.1002/wat2.1154, 2016.
Bakker, A.: Time series transformation tool version 3.1 Description of the program to generate time series consistent with the KNMI'14 climate scenarios, De Bilt, the Netherlands, https://cdn.knmi.nl/knmi/pdf/bibliotheek/knmipubTR/TR349.pdf (last access: 13 December 2021), 2015.
Bartkowski, B., Lienhoop, N., Hansjürgens, B., Bartkowski, B., Lienhoop, N., and Hansjürgens, B.: Capturing the complexity of biodiversity: A critical review of economic valuation studies of biological diversity, Ecol. Econ., 113, 1–14, https://doi.org/10.1016/J.ECOLECON.2015.02.023, 2015.
Beersma, J. J. and Buishand, T. A.: Joint probability of precipitation and discharge deficits in the Netherlands, Water Resour. Res., 40, 1–11, https://doi.org/10.1029/2004WR003265, 2004.
Bierkens, M. F. P., Reinhard, S., de Bruijn, J. A., Veninga, W., and Wada, Y.: The Shadow Price of Irrigation Water in Major Groundwater-Depleting Countries, Water Resour. Res., 55, 4266–4287, https://doi.org/10.1029/2018WR023086, 2019.
Blauhut, V., Gudmundsson, L., and Stahl, K.: Towards pan-European drought risk maps: quantifying the link between drought indices and reported drought impacts, Environ. Res. Lett., 10, 014008, https://doi.org/10.1088/1748-9326/10/1/014008, 2015.
Briene, M., Van Hussen, K., and Schellekens, J.: Welvaartseffecten waterbeschikbaarheid op de sectoren drinkwater, energie en industrie [Welfare effects of droughts on drinking water supply, energy supply and industrial use], Ecorys, Rotterdam, the Netherlands, 2018 (in Dutch).
Briene, M., Van der Kooij, Susanne, Swart, L., Snippen, E., Van der Vat, M., Schasfoort, F., Mens, M., and Stokkers, R.: Validatie Effectmodule Landbouw [Validation of the agricultural drought impact model against the 2018 drought], Ecorys, Rotterdam, 2019 (in Dutch).
Byers, E. A., Coxon, G., Freer, J., and Hall, J. W.: Drought and climate change impacts on cooling water shortages and electricity prices in Great Britain, Nat. Commun., 11, 2239, https://doi.org/10.1038/s41467-020-16012-2, 2020.
Carrão, H., Naumann, G., and Barbosa, P.: Mapping global patterns of drought risk: An empirical framework based on sub-national estimates of hazard, exposure and vulnerability, Global Environ. Chang., 39, 108–124, https://doi.org/10.1016/J.GLOENVCHA.2016.04.012, 2016.
Connell-Buck, C. R., Medellín-Azuara, J., Lund, J. R., and Madani, K.: Adapting California's water system to warm vs. dry climates, Clim. Chang., 109, 133–149, https://doi.org/10.1007/S10584-011-0302-7, 2011.
CPB/PBL: The Netherlands in 2030 and 2050: two scenarios, Den Haag, the Netherlands, https://www.wlo2015.nl/wp-content/uploads/PBL_2015_WLO_Nederland-in-2030-en-2050_1558.pdf (last access: 31 March 2022), 2015 (in Dutch).
Crausbay, S. D., Ramirez, A. R., Carter, S. L., Cross, M. S., Hall, K. R., Bathke, D. J., Betancourt, J. L., Colt, S., Cravens, A. E., Dalton, M. S., Dunham, J. B., Hay, L. E., Hayes, M. J., McEvoy, J., McNutt, C. A., Moritz, M. A., Nislow, K. H., Raheem, N., and Sanford, T.: Defining Ecological Drought for the Twenty-First Century, B. Am. Meteorol. Soc., 98, 2543–2550, https://doi.org/10.1175/BAMS-D-16-0292.1, 2017.
Groot, S., Vermeulen, C.-J., Schasfoort, F., van der Vat, M., and Diermanse, F.: An approach for drought risk analysis: summary report, Deltares and HKV, Delft, https://www.stowa.nl/sites/default/files/assets/NIEUWS/Nieuwsdocs 2019/20191107 Synthesedocument IMPREX.pdf (last access: 31 March 2022), 2020 (in Dutch).
Hagenlocher, M., Meza, I., Anderson, C. C., Min, A., Renaud, F. G., Walz, Y., Siebert, S., and Sebesvari, Z.: Drought vulnerability and risk assessments: state of the art, persistent gaps, and research agenda, Environ. Res. Lett., 14, 083002, https://doi.org/10.1088/1748-9326/AB225D, 2019.
Hall, J. and Borgomeo, E.: Risk-based principles for defining and managing water security, Philos. T. R. Soc. A, 371, 20120407, https://doi.org/10.1098/RSTA.2012.0407, 2013.
IPCC: Climate Change 2022: Impacts, Adaptation, and Vulnerability. Contribution of Working Group II to the Sixth Assessment Report of the Intergovernmental Panel on Climate Change, edited by: Pörtner, H.-O., Roberts, D. C., Tignor, M., Poloczanska, E. S., Mintenbeck, K., Alegría, A., Craig, M., Langsdorf, S., Löschke, S., Möller, V., Okem, A., and Rama, B., Cambridge University Press, in press, https://www.ipcc.ch/report/sixth-assessment-report-working-group-ii/, last access: 31 March 2022.
Lenderink, G., van den Hurk, B. J. J. M., Klein Tank, A. M. G., van Oldenborgh, G. J., van Meijgaard, E., de Vries, H., and Beersma, J. J.: Preparing local climate change scenarios for the Netherlands using resampling of climate model output, Environ. Res. Lett., 9, 115008, https://doi.org/10.1088/1748-9326/9/11/115008, 2014.
Logar, I. and van den Bergh, J. C. J. M.: Methods to Assess Costs of Drought Damages and Policies for Drought Mitigation and Adaptation: Review and Recommendations, Water Resour. Manag., 27, 1707–1720, https://doi.org/10.1007/S11269-012-0119-9, 2012.
Mens, M., Minnema, B., Overmars, K., and van den Hurk, B.: Dilemmas in developing models for long-term drought risk management: the case of the National Water Model of the Netherlands, Environ. Modell. Softw., 143, 105100, https://doi.org/10.1016/j.envsoft.2021.105100, 2021.
Meza, I., Eyshi Rezaei, E., Siebert, S., Ghazaryan, G., Nouri, H., Dubovyk, O., Gerdener, H., Herbert, C., Kusche, J., Popat, E., Rhyner, J., Jordaan, A., Walz, Y., and Hagenlocher, M.: Drought risk for agricultural systems in South Africa: Drivers, spatial patterns, and implications for drought risk management, Sci. Total Environ., 799, 149505, https://doi.org/10.1016/J.SCITOTENV.2021.149505, 2021.
Mishra, A. K. and Singh, V. P.: A review of drought concepts, J. Hydrol., 391, 202–216, https://doi.org/10.1016/J.JHYDROL.2010.07.012, 2010.
Mulder, H. M. and Veldhuizen, A. A.: Agricultural Cost Model AGRICOM: theory and user manual, Wageningen, the Netherlands, http://www.alterra.wur.nl (last access: 13 December 2021), 2014 (in Dutch).
Musolino, D. A., Massarutto, A., and de Carli, A.: Does drought always cause economic losses in agriculture? An empirical investigation on the distributive effects of drought events in some areas of Southern Europe, Sci. Total Environ., 633, 1560–1570, https://doi.org/10.1016/J.SCITOTENV.2018.02.308, 2018.
Naumann, G., Barbosa, P., Garrote, L., Iglesias, A., and Vogt, J.: Exploring drought vulnerability in Africa: an indicator based analysis to be used in early warning systems, Hydrol. Earth Syst. Sci., 18, 1591–1604, https://doi.org/10.5194/hess-18-1591-2014, 2014.
Naumann, G., Vargas, W. M., Barbosa, P., Blauhut, V., Spinoni, J., and Vogt, J. V.: Dynamics of Socioeconomic Exposure, Vulnerability and Impacts of Recent Droughts in Argentina, Geosci., 2019, 39, https://doi.org/10.3390/GEOSCIENCES9010039, 2019.
NHI: LHM, http://www.nhi.nu/nl/index.php/modellen/lhm/, last access: 25 May 2022a.
NHI: Data, http://www.nhi.nu/nl/index.php/data/, last access: 25 May 2022b.
Philip, S. Y., Kew, S. F., van der Wiel, K., Wanders, N., and Jan van Oldenborgh, G.: Regional differentiation in climate change induced drought trends in the Netherlands, Environ. Res. Lett., 15, 94081, https://doi.org/10.1088/1748-9326/ab97ca, 2020.
Polman, N., Peerlings, J., and Reinhard, S.: Development of a tool to estimate the economic effects of agricultural yield losses due to drought, Wageningen, the Netherlands, 2017 (in Dutch).
Polman, N., Peerlings, J., and van der Vat, M.: Economische effecten van droogte voor landbouw in Nederland: samenvatting, Wageningen Economic Research No. 2019-038. Wageningen, the Netherlands, https://doi.org/10.18174/474376, 2019 (in Dutch).
Rijkswaterstaat: BIVAS tool, BIVAS Appl, https://bivas.chartasoftware.com/Home/BIVASApplicatie (last access: 31 March 2022), 2019.
Rossi, G. and Cancelliere, A.: Managing drought risk in water supply systems in Europe: a review, Int. J. Water Resour. Dev., 29, 272–289, https://doi.org/10.1080/07900627.2012.713848, 2013.
Rossi, G., Cancelliere, A., and Giuliano, G.: Case Study: Multicriteria Assessment of Drought Mitigation Measures, J. Water Resour. Plan. Manag., 131, 449–457, https://doi.org/10.1061/(ASCE)0733-9496(2005)131:6(449), 2005.
Steduto, P., Hsiao, T. C., Fereres, E. and Raes, D.: Crop Yield Response to Water, https://www.fao.org/3/i2800e/i2800e00.htm (last access: 13 December 2021), 2012.
Van Asseldonk, M., Stokkers, R., and Jager, J.: Economic effects of 2018 and 2019 drought on agriculture and dairy farms, Wageningen, the Netherlands, https://edepot.wur.nl/541243 (last access: 31 March 2022), 2021. (in Dutch),
van der Vat, M. , Schasfoort, F., Ter Maat, J., Mens, M., Delsman, J. R., Kok, S., van Vuren, S., van der Zwet, J., Wegman, C., Polman, N., and Ruijgrok, E.: Risicobenadering voor de Nederlandse zoetwatervoorziening (in Dutch), Delft, the Netherlands, https://edepot.wur.nl/405557, 2016.
Van Loon, A. F., Gleeson, T., Clark, J., Van Dijk, A. I. J. M., Stahl, K., Hannaford, J., Di Baldassarre, G., Teuling, A. J., Tallaksen, L. M., Uijlenhoet, R., Hannah, D. M., Sheffield, J., Svoboda, M., Verbeiren, B., Wagener, T., Rangecroft, S., Wanders, N., and Van Lanen, H. A. J.: Drought in the Anthropocene, Nat. Geosci., 9, 89–91, https://doi.org/10.1038/ngeo2646, 2016.
Veldkamp, T. I. E., Wada, Y., de Moel, H., Kummu, M., Eisner, S., Aerts, J. C. J. H., and Ward, P. J.: Changing mechanism of global water scarcity events: Impacts of socioeconomic changes and inter-annual hydro-climatic variability, Global Environ. Chang., 32, 18–29, https://doi.org/10.1016/J.GLOENVCHA.2015.02.011, 2015.
Victor, P. A.: Cents and nonsense: A critical appraisal of the monetary valuation of nature, Ecosyst. Serv., 42, 101076, https://doi.org/10.1016/J.ECOSER.2020.101076, 2020.
Vogt, J. V., Naumann, G., Masante, D., Spinoni, J., Cammalleri, C., Erian, W., Pischke, F., Pulwarty, R., and Barbosa, P.: Drought Risk Assessment and Management. A conceptual framework, Joint Research Centre, Luxembourg, https://publications.jrc.ec.europa.eu/repository/handle/JRC113937 (last access: 13 December 2021), 2018.
Wendt, D. E., Bloomfield, J. P., Van Loon, A. F., Garcia, M., Heudorfer, B., Larsen, J., and Hannah, D. M.: Evaluating integrated water management strategies to inform hydrological drought mitigation, Nat. Hazards Earth Syst. Sci., 21, 3113–3139, https://doi.org/10.5194/nhess-21-3113-2021, 2021.
Wilhite, D. A., Hayes, M. J., Knutson, C., and Smith, K. H.: Planning for drought: moving from crisis to risk management, JAWRA J. Am. Water Resour. As., 36, 697–710, https://doi.org/10.1111/J.1752-1688.2000.TB04299.X, 2000.
Wilhite, D. A., Sivakumar, M. V. K., and Pulwarty, R.: Managing drought risk in a changing climate: The role of national drought policy, Weather Clim. Extrem., 3, 4–13, https://doi.org/10.1016/J.WACE.2014.01.002, 2014.
Wolters, H., Hunink, J., Delsman, J., Lange, G. de, Schasfoort, F., Mark, R. van der, Gert Jan van den Born, E. D., Rijken, B., and Reinhard, S.: Deltascenarios: four future projections for the Delta Program, Delft, the Netherlands, https://bit.ly/3qQLyfI (last access: 31 March 2022), 2018 (in Dutch).
Young, R. A. and Loomis, J. B.: Determining the economic value of water: Concepts and methods, 2nd edition, Routledge, New York, https://doi.org/10.4324/9780203784112, 2014.
Zhang, H., Ding, J., Wang, Y., Zhou, D., and Zhu, Q.: Investigation about the correlation and propagation among meteorological, agricultural and groundwater droughts over humid and arid/semi-arid basins in China, J. Hydrol., 603, 127007, https://doi.org/10.1016/J.JHYDROL.2021.127007, 2021.