Mainstreaming Energetic Resilience by Morphological Assessment in Ordinary Land Use Planning. The Case Study of Moncalieri, Turin (Italy)

 ,
, 

Abstract
:1. Introduction
2. Materials and Methods
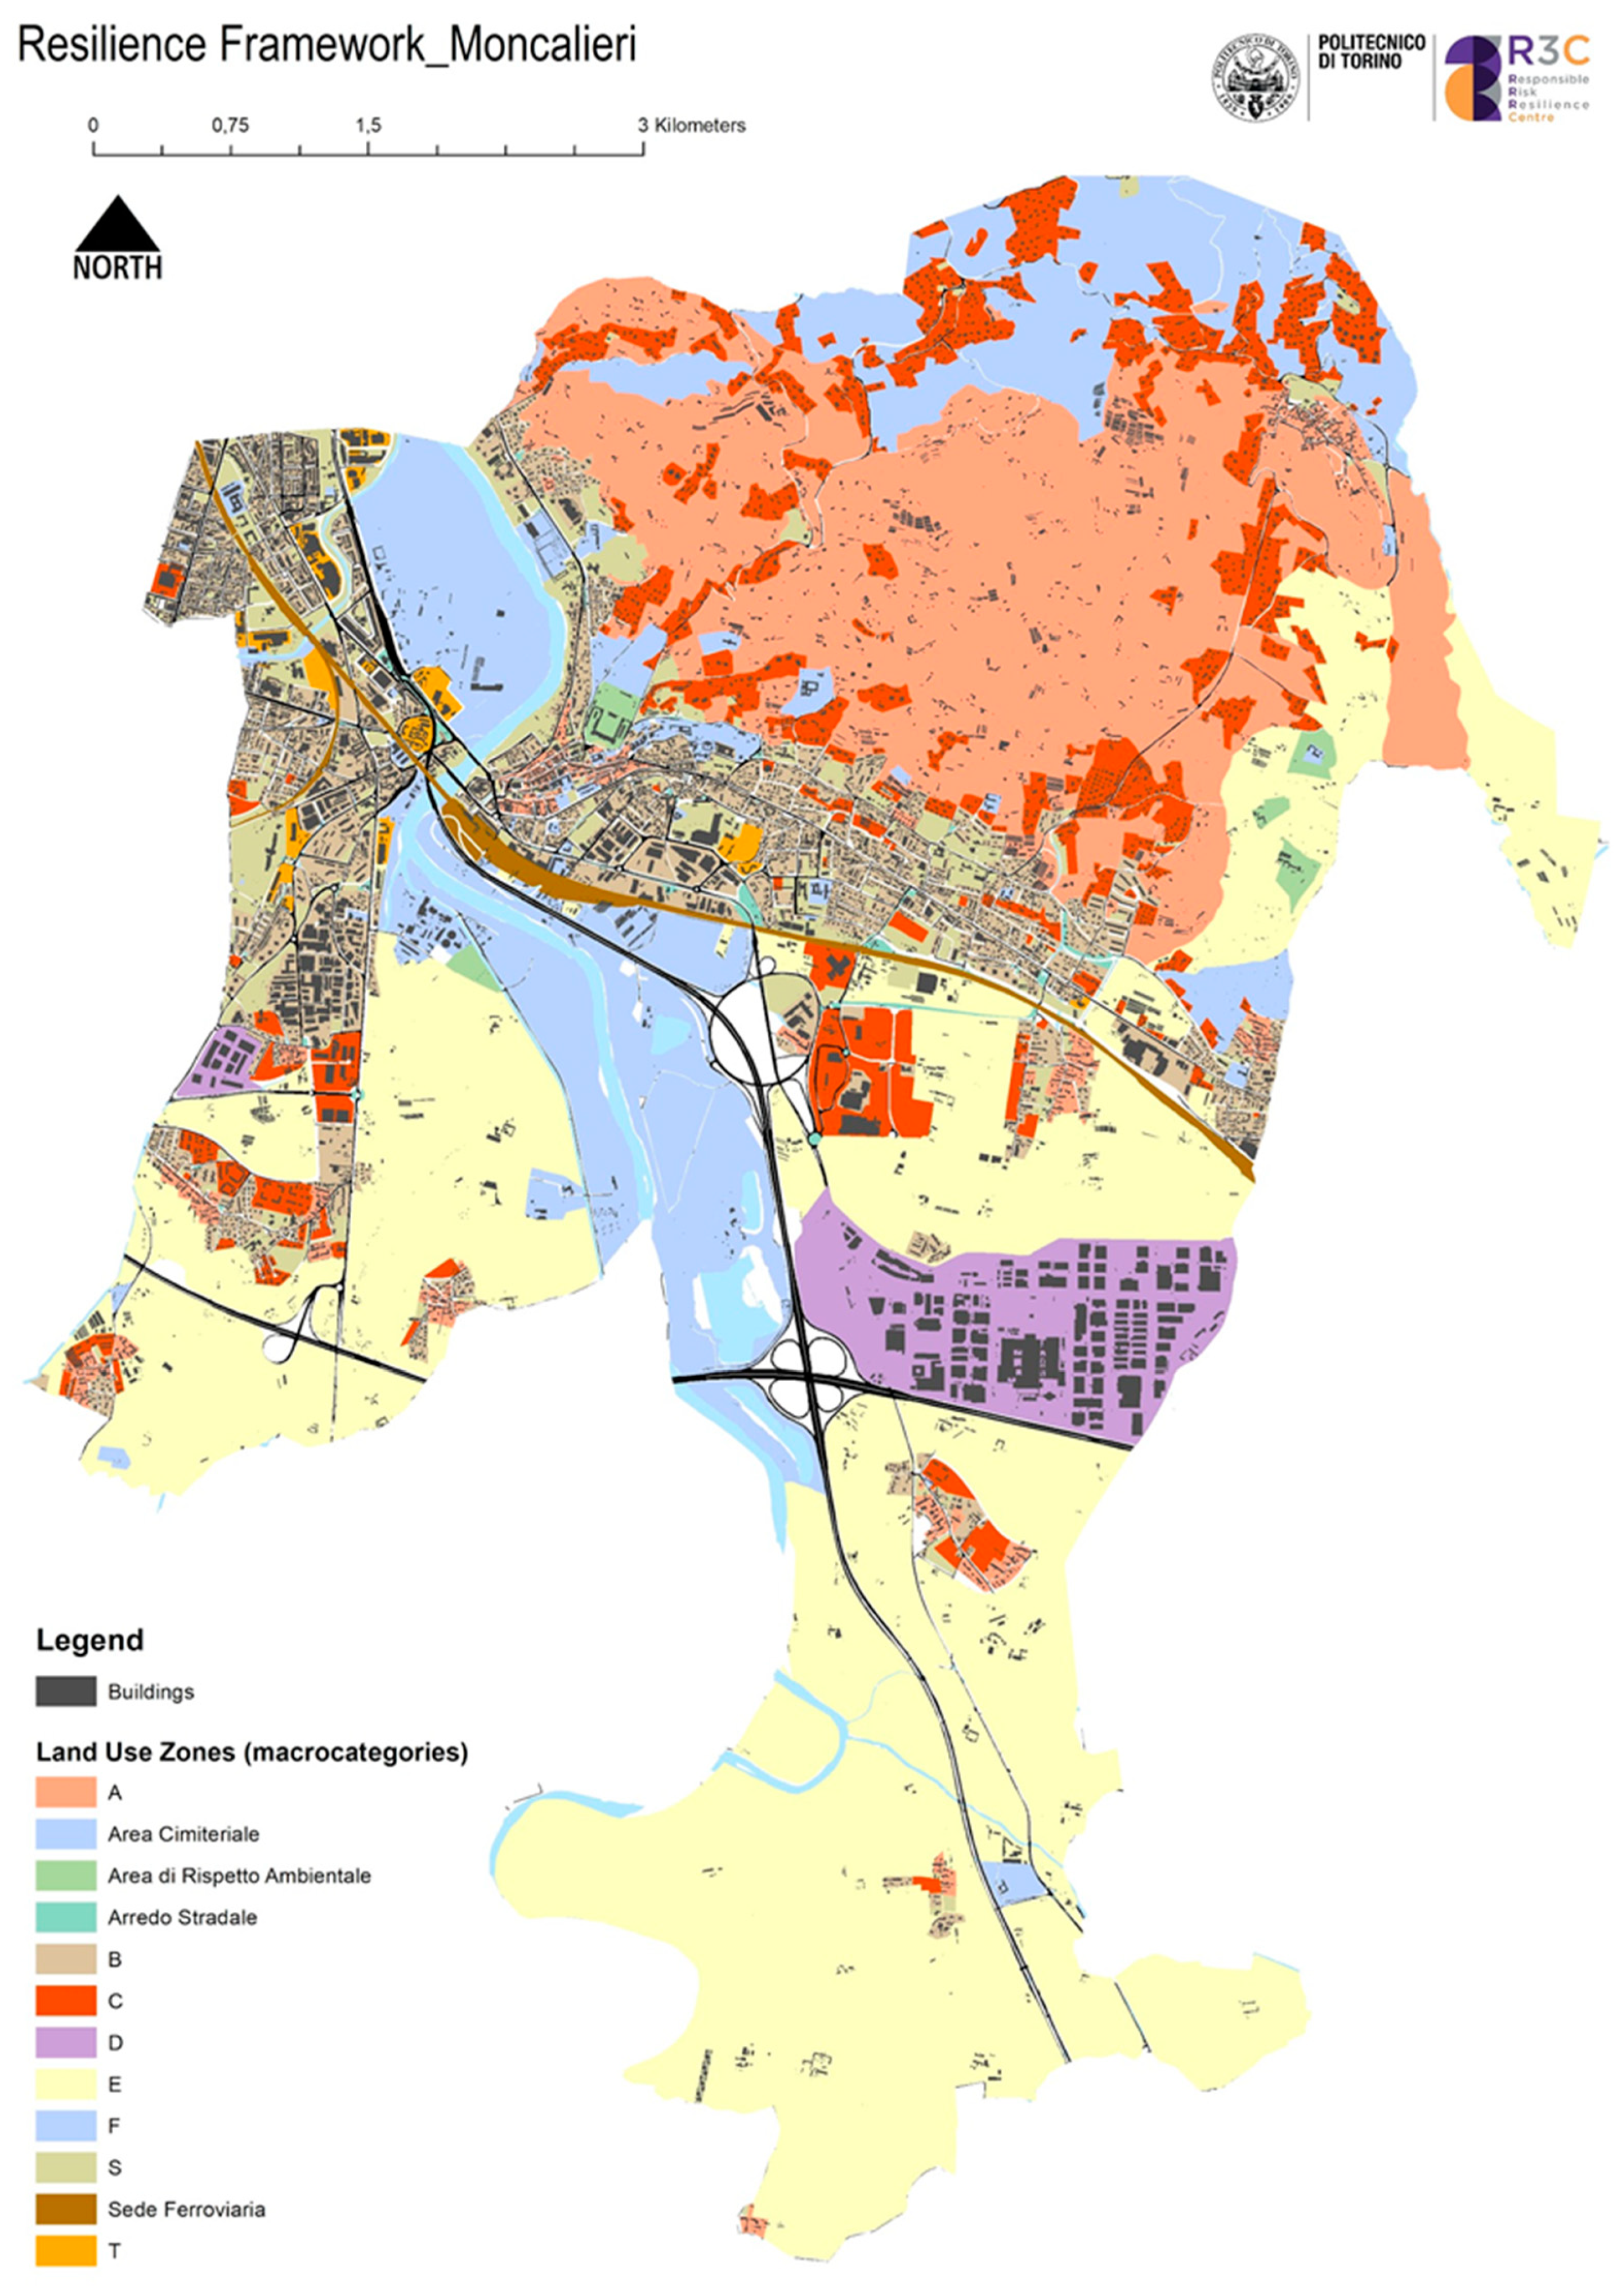
2.1. Case Study
2.2. Description of Indicators
2.3. Solar Radiation Analysis
- (i)
- the system performance ratio of 0.75; this parameter assumes that the in-situ performance of panels is lower than the performances in standard conditions in a laboratory; it should increase along with the years of utilization, and in this case, it has been assumed as a fixed parameter, and;
- (ii)
- the energy production is a function of the number of panels, the peak power installed, and the energy conversion efficiency (e.g., it was considered a monocrystalline silicon technology panel with an annual average conversion efficiency of 12.5%) [46].
3. Results
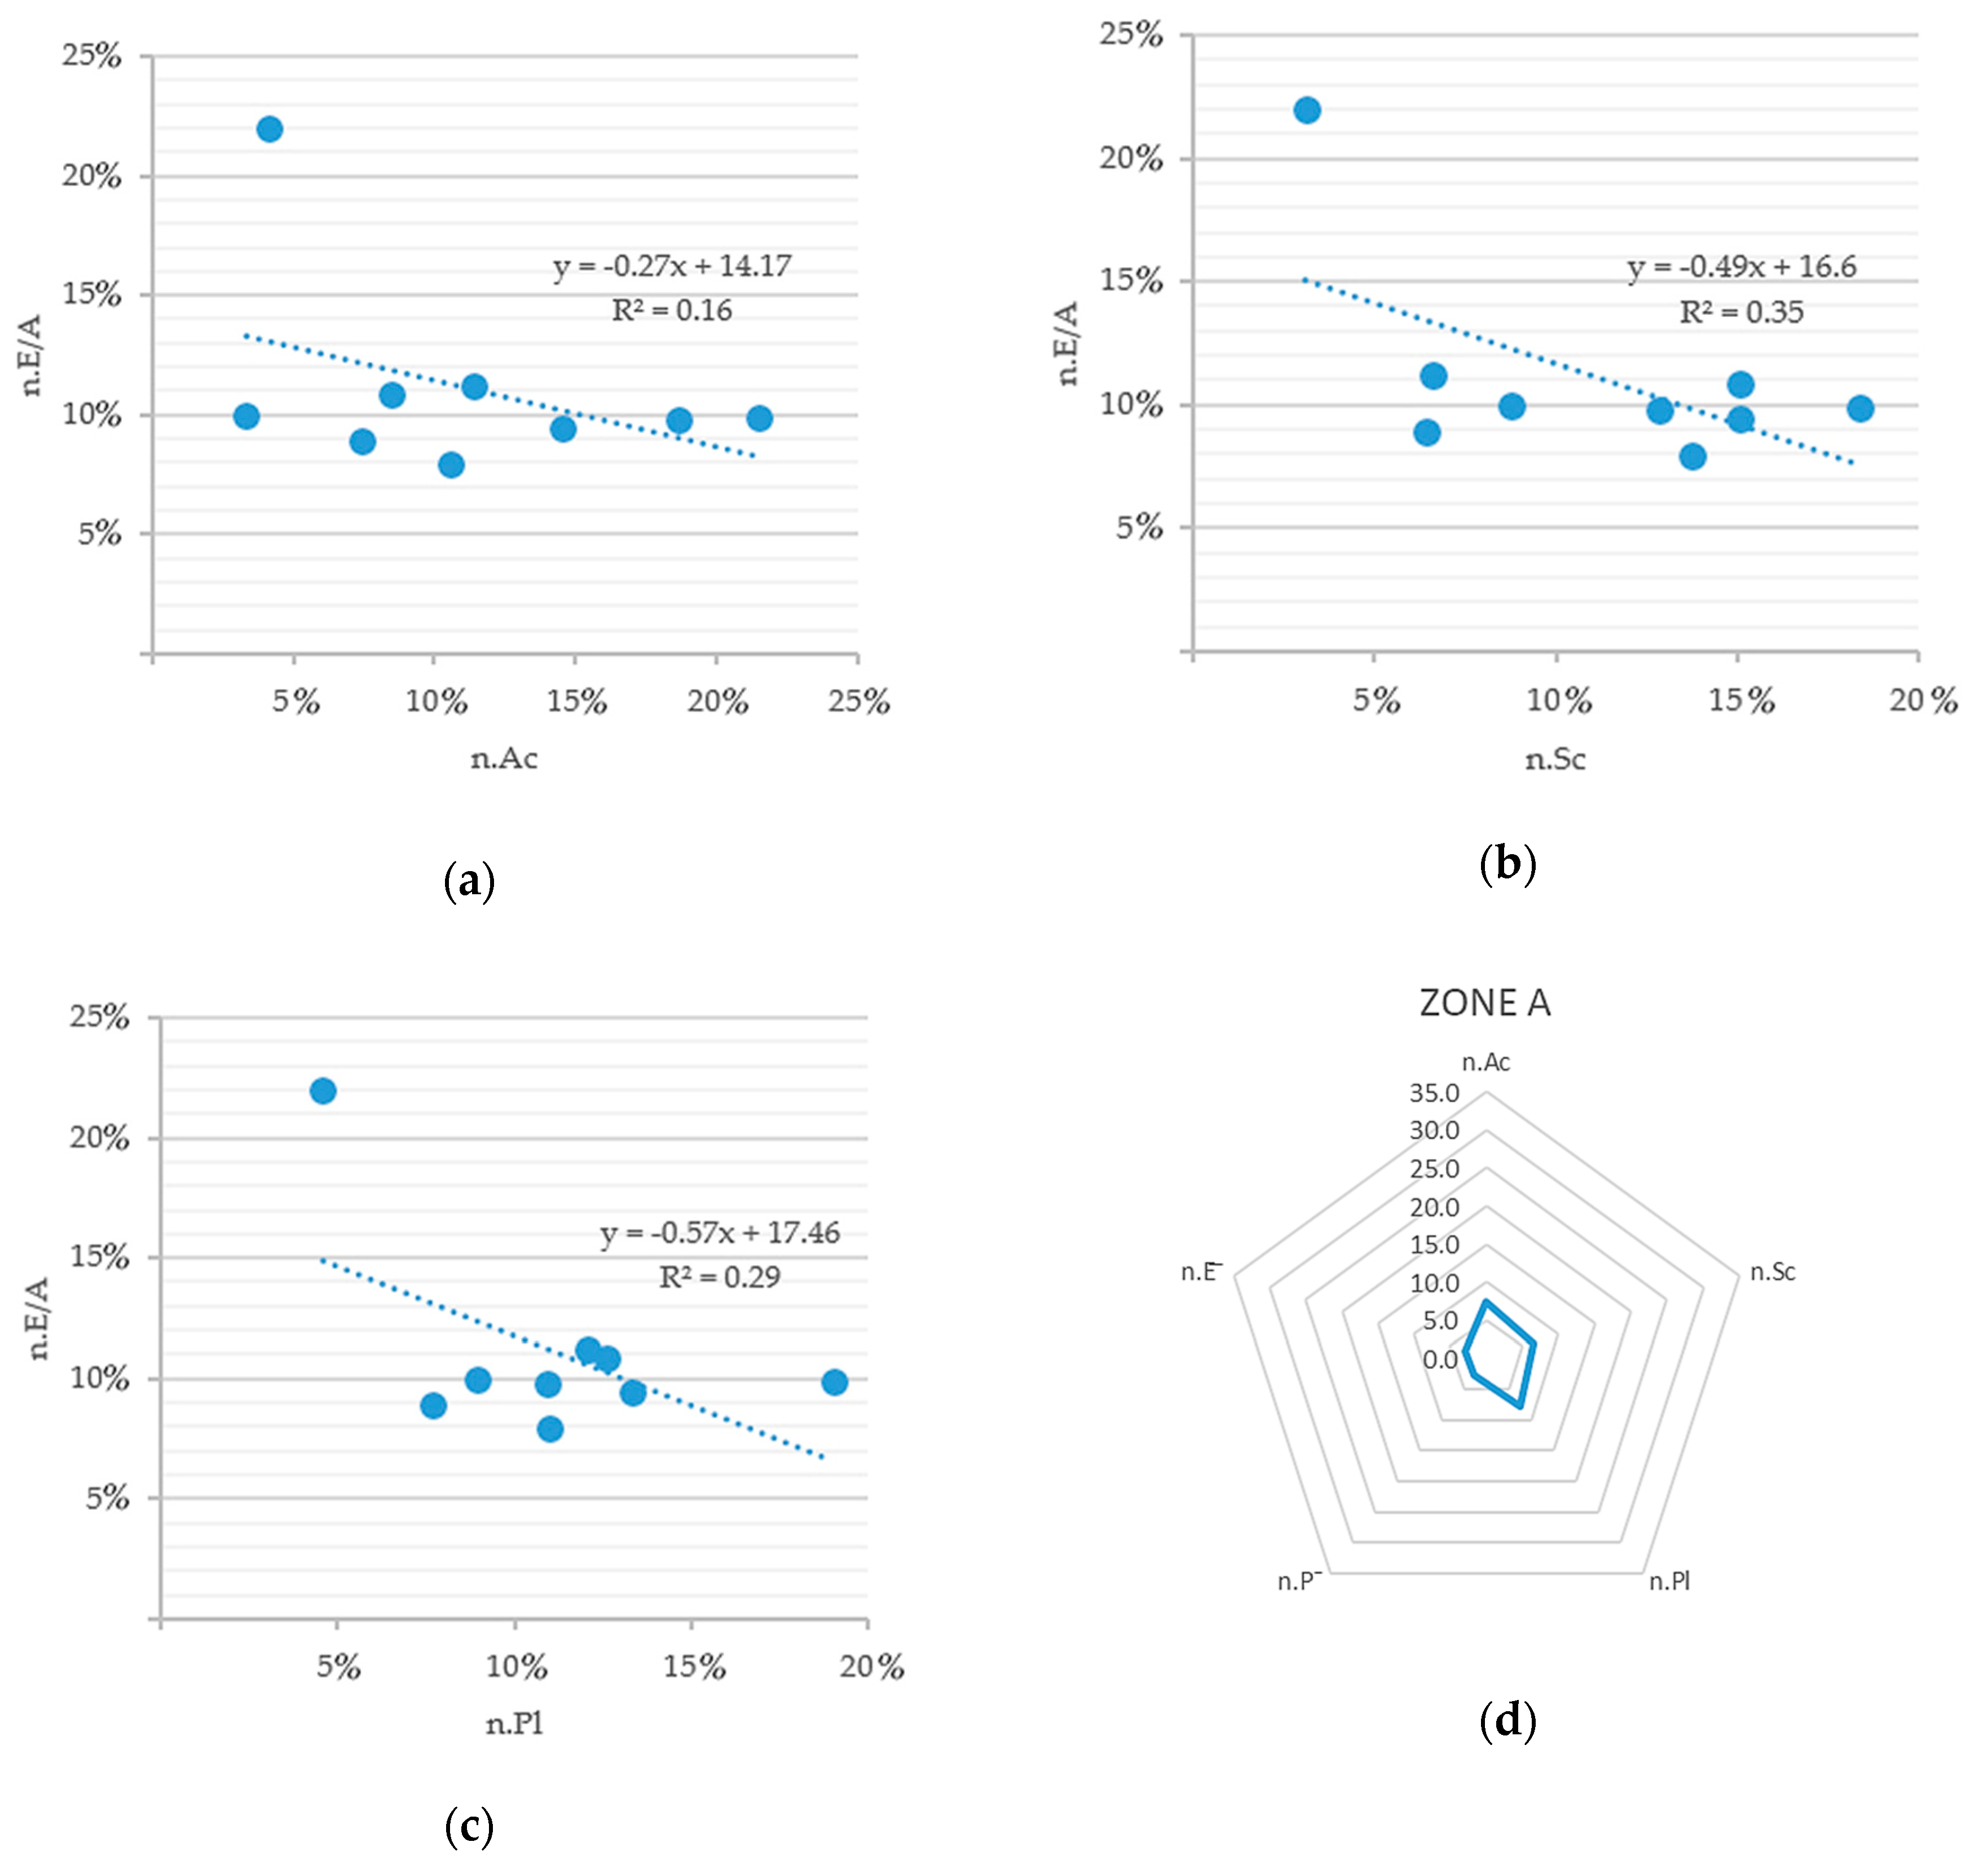
Comparative Analysis of the Energy Indicators
4. Discussion
5. Conclusions
Author Contributions
Funding
Acknowledgments
Conflicts of Interest
References
- De Pascali, P.; Bagaini, A. Energy transition and urban planning for local development. A critical review of the evolution of integrated spatial and energy planning. Energies 2019, 12, 35. [Google Scholar] [CrossRef] [Green Version]
- Jacobs, P. Energy and form, an ecological approach to urban growth. Urban Ecol. 1976, 2, 192–193. [Google Scholar] [CrossRef]
- Olgyay, V. Design with Climate; Princeton University Press: Princeton, NJ, USA, 2015. [Google Scholar]
- Clark, W.A.V.; Martin, L.; March, L. Urban Space and Structures; University Press Cambridge: Cambridge, UK, 1975; Volume 65. [Google Scholar]
- Liddell, H.L. Design With Nature; American Museum of Natural History New York: New York, NY, USA, 1976. [Google Scholar]
- Owens, S. Energy, Planning and Urban Form; Pion Ltd.: London, UK, 1986. [Google Scholar]
- Mutani, G.; Todeschi, V. An urban energy atlas and engineering model for resilient cities. Int. J. Heat Technol. 2019, 37, 936–947. [Google Scholar] [CrossRef] [Green Version]
- Sharifi, A.; Yamagata, Y. Principles and criteria for assessing urban energy resilience: A literature review. Renew. Sustain. Energy Rev. 2016, 60, 1654–1677. [Google Scholar] [CrossRef] [Green Version]
- Brunetta, G.; Ceravolo, R.; Barbieri, C.A.; Borghini, A.; de Carlo, F.; Mela, A.; Beltramo, S.; Longhi, A.; De Lucia, G.; Ferraris, S.; et al. Territorial resilience: Toward a proactive meaning for spatial planning. Sustainability 2019, 11, 2286. [Google Scholar] [CrossRef] [Green Version]
- Gibson, R.B. Sustainability assessment: Basic components of a practical approach. Impact Assess. Proj. Apprais. 2006, 24, 170–182. [Google Scholar] [CrossRef]
- Sharifi, A.; Yamagata, Y. A Conceptual Framework for Assessment of Urban Energy Resilience. Energy Procedia 2015, 75, 2904–2909. [Google Scholar] [CrossRef] [Green Version]
- Brunetta, G.; Salata, S. Mapping urban resilience for spatial planning-A first attempt to measure the vulnerability of the system. Sustainability 2019, 11, 2331. [Google Scholar] [CrossRef] [Green Version]
- Meerow, S.; Newell, J.P.; Stults, M. Defining urban resilience: A review. Landsc. Urban Plan. 2016, 147, 38–49. [Google Scholar] [CrossRef]
- Brunetta, G.; Caldarice, O. Spatial Resilience in Planning: Meanings, Challenges, and Perspectives for Urban Transition. In Sustainable Cities and Communities; Leal Filho, W., Azul, A.M., Brandli, L., Özuyar, P.G., Wall, T., Eds.; Springer International Publishing: Cham, Switzerlan, 2019; pp. 1–14. ISBN 978-3-319-71061-7. [Google Scholar]
- Meerow, S.; Newell, J.P. Urban resilience for whom, what, when, where, and why? Urban Geogr. 2019, 40, 309–329. [Google Scholar] [CrossRef]
- Meerow, S.; Newell, J.P. Spatial planning for multifunctional green infrastructure: Growing resilience in Detroit. Landsc. Urban Plan. 2017, 159, 62–75. [Google Scholar] [CrossRef]
- Grilo, F.; Pinho, P.; Aleixo, C.; Catita, C.; Silva, P.; Lopes, N.; Freitas, C.; Santos-Reis, M.; McPhearson, T.; Branquinho, C. Using green to cool the grey: Modelling the cooling effect of green spaces with a high spatial resolution. Sci. Total Environ. 2020, 138–182. [Google Scholar] [CrossRef] [PubMed]
- Parliament, E. Directive 2010/31/EU of the European Parliament and of the Council of 19 May 2010 on the energy performance of buildings. Off. J. Eur. Union 2010, 13–35. [Google Scholar]
- Parliament, E. Directive 2012/27/EU of the European Parliament and of the council of 25 October 2012 on energy efficiency, amending directives 2009/125/EC and 2010/30/EU and repealing Directives 2004/8/EC and 2006/32/EC. Off. J. Eur. Union 2012, L315/1, 1–56. [Google Scholar]
- European Union. European Parliament Directive 2009/28/EC of the European Parliament and of the Council of 23 April 2009. Off. J. Eur. Union 2009, 140, 16–62. [Google Scholar]
- Directive 2001/77/EC of the European Parliament and of the Council of 27 September 2001 on the Promotion of Electricity Produced from Renewable Energy Sources in the Internal Electricity Market. In Compendium of Sustainable Energy Laws; European Commission: Brussels, Belgium, 2010; pp. 394–401.
- Carrillo-Hermosilla, J.; Del Río, P.; Könnölä, T. Diversity of eco-innovations: Reflections from selected case studies. J. Clean. Prod. 2010, 18, 1073–1083. [Google Scholar] [CrossRef]
- European Union. Directive (EU) 2018/2001 of the European Parliament and of the Council of 11 December 2018 on the promotion of the use of energy from renewable sources. Off. J. Eur. Union 2018, 5, 82–209. [Google Scholar]
- Ministry of Economic Development Piano Nazionale Integrato per l’Energia e il Clima; Ministero dello Sviluppo Economico: Rome, Italy, 2019.
- Della Repubblica, P. Attuazione Della Direttiva 2009/28/CE Sulla Promozione Dell’ Uso Dell’ Energia da Fonti Rinnovabili, Recante Modifica e Successiva Abrogazione Delle Direttive TITOLO I FINALITA’ E OBIETTIVI; Gazzetta Ufficiale della Repubblica Italiana: Rome, Italy, 2011. [Google Scholar]
- Decreto 26 giugno 2015. Adeguamento del Decreto del Ministro dello Sviluppo Economico, 26 Giugno 2009-Linee Guida Nazionali per la Certificazione Energetica Degli Edifici. (15A05200) (GU Serie Generale n.162 del 15-07-2015-Suppl. Ordinario n. 39); Gazzetta Ufficiale: Rome, Italy, 2015.
- Mutani, G.; Casalengo, M.; Ramassotto, M.A. The effect of roof-integrated solar technologies on the energy performance of public buildings: The case study of the City of Turin (IT). In Proceedings of the INTELEC, International Telecommunications Energy Conference (Proceedings); Institute of Electrical and Electronics Engineers Inc.: Piscataway, NJ, USA, 2019; Volume 2018-Octob. [Google Scholar]
- Gancheva, M.; O’Brien, S.; Crook, N. Models of Local Energy Ownership and the Role of Local Energy Communities in Energy Transition in Europe; European Committee of the Regions: Brussels, Belgium, 2018; ISBN 9789289509893. [Google Scholar]
- Council of the European Union Proposal for A Directive of the European Parliament and of the Council on the Promotion of the Use of Energy from Renewable Sources (Recast). Available online: http://www.consilium.europa.eu/en/press/press-releases/2018/06/27/renewable-energy-council-confirms-deal-reached-with-the-european-parliament/ (accessed on 17 April 2020).
- International Energy Agency How Solar Energy Could Be the Largest Source of Electricity by Mid-Century. Available online: Http://Www.Iea.Org/Newsroomandevents/Pressreleases/2014/September/How-Solar-Energy-Could-Be-the-Largest-Source-of-Electricity-By-Mid-Century.Html (accessed on 19 April 2020).
- Legge del 30 Marzo 1976, n. 373. Norme per il Contenimento del Consumo Energetico per Usi Termici Negli Edifici. (GU Serie Generale n.148 del 07-06-1976). Available online: https://www.gazzettaufficiale.it/eli/id/1976/06/07/076U0373/sg (accessed on 27 May 2020).
- L. 9 Gennaio 1991, n. 10-Norme per L’attuazione del Piano Energetico Nazionale in Materia di Uso Razionale Dell’energia, di Risparmio Energetico e di Sviluppo Delle Fonti Rinnovabili di Energia (G.U. 16 Gennaio 1991, n. 13, S.O.)|Ministero Dell’ambien. Available online: http://www.minambiente.it/normative/l-9-gennaio-1991-n-10-norme-lattuazione-del-piano-energetico-nazionale-materia-di-uso (accessed on 17 April 2020).
- Legge Regionale-LR 24/03/2000, n.31; Disposizioni per la Prevenzione e Lotta All’inquinamento Luminoso e per il Corretto Impiego Delle Risorse Energetiche. (B.U. 29 Marzo 2000, 2° suppl. al n. 13). Available online: http://arianna.consiglioregionale.piemonte.it/base/leggi/l2000031.html (accessed on 27 May 2020).
- Decreto Legislativo-D.Lgs 3/04/2006, n.152; Norme in Materia Ambientale (G.U. n. 88 del 14 Aprile 2006). Available online: https://www.bosettiegatti.eu/info/norme/statali/2006_0152.htm (accessed on 27 May 2020).
- Legge Regionale 28 Maggio 2007, n. 13. Disposizioni in Materia di Rendimento Energetico Nell’edilizia. (B.U. 31 Maggio 2007, n. 22). Modificata da l.r. 03/2009, l.r. 20/2009, l.r. 22/2009, l.r. 30/2009, l.r. 05/2012. Available online: http://arianna.consiglioregionale.piemonte.it/base/coord/c2007013.html (accessed on 27 May 2020).
- Decreto del Presidente della Repubblica 2 Aprile 2009, n. 59 Regolamento di Attuazione Dell’articolo 4, Comma 1, Lettere a) e b), del Decreto Legislativo 19agosto 2005, n. 192, Concernente Attuazione della Direttiva 2002/91/CE sul Rendimento Energetico in. Available online: http://www.energia.provincia.tn.it/binary/pat_agenzia_energia/normativa/DPR_59_2009.1248339845.pdf (accessed on 27 May 2020).
- Decreto Legislativo-D.lgs 3/03/2011, n. 28. Attuazione Della Direttiva 2009/28/CE Sulla Promozione Dell’uso Dell’energia da Fonti Rinnovabili, Recante Modifica e Successiva Abrogazione Delle Direttive 2001/77/CE e 2003/30/CE (G.U. n. 71 del 28 Marzo 201. 2011. Available online: https://www.minambiente.it/sites/default/files/dlgs_03_03_2011_28.pdf (accessed on 27 May 2020).
- Repubblica Italiana. Legge 3 Agosto 2013, n.90-Conversione, con Modificazioni, del Decreto-Legge 4 Giugno 2013, n.63 Disposizioni Urgenti per il Recepimento della Direttiva 2010/31/UE del Parlamento Europeo e del Consiglio del 19 Maggio 2010, Sulla Prestazione Energetica ne. Available online: https://www.gazzettaufficiale.it/eli/id/2013/08/03/13G00133/sg (accessed on 27 May 2020).
- Legge Regionale 11 Marzo 2015, n.3. Disposizioni Regionali in Materia di Semplificazione. (BU 12 Marzo 2015, n. 2° suppl. al n. 10). Available online: http://arianna.consiglioregionale.piemonte.it/base/coord/c2015003.html (accessed on 17 April 2020).
- Ministero Dello Sviluppo Economico. Decreto Interministeriale 26 Giugno 2015-Applicazione Delle Metodologie di Calcolo Delle Prestazioni Energetiche e Definizione Delle Prescrizioni e dei Requisiti Minimi Degli Edifici; Ministero Dello Sviluppo Economic: Rome, Italy, 2015.
- Statistiche Istat, Popolazione Residente al 1° Gennaio 2020, Moncalieri. Available online: http://dati.istat.it/ (accessed on 17 April 2020).
- BDTre Digital Topographic Database of Piedmont Region; Regione Piemonte: Turin, Italy, 2017.
- Istituto Nazionale di Statistica, ISTAT. Censimento Della Popolazione e delle Abitazioni 2012. GU n.209 del 18/12/2012; Gazzetta Ufficiale: Rome, Italy, 2012. [Google Scholar]
- Mohajeri, N.; Upadhyay, G.; Gudmundsson, A.; Assouline, D.; Kämpf, J.; Scartezzini, J.L. Effects of urban compactness on solar energy potential. Renew. Energy 2016, 93, 469–482. [Google Scholar] [CrossRef] [Green Version]
- Mutani, G.; Vicentini, G. Evaluating the Potential of Roof-Integrated Photovoltaic Technologies Using An Open Geographic Information System; ÜBER: Turin, Italy, 2017; ISBN 978-3-9812053-6-7. [Google Scholar]
- Mutani, G.; Vodano, A.; International, M.P.I. Photovoltaic solar systems for smart bus shelters in the urban environment of turin (Italy). In Proceedings of the 2017 IEEE International Telecommunications Energy Conference (INTELEC), Broadbeach, Australia, 22–26 October 2017; pp. 20–25. [Google Scholar]
- Piedmont Region Energy Consumptions Database (2010–2017); Sustainable Energy Department: Turin, Italy.
- Il Portale Solare-Città Metropolitana di Torino. Available online: http://www.cittametropolitana.torino.it/cms/ambiente/risorse-energetiche/osservatorio-energia/portale-solare (accessed on 17 April 2020).
- Marshall, J.D. Energy-efficient urban form. Environ. Sci. Technol. 2008, 42, 3133–3137. [Google Scholar] [CrossRef] [Green Version]
- Grover, S. Energy, Economic, and Environmental Benefits of the Solar America Initiative; National Renewable Energy Laboratory: Golden, CO, USA, 2007. [Google Scholar]
- IRENA, C. The Socio-Economic Benefits of Large-Scale Solar and Wind: An econValue Report; International Renewable Energy Agency (IRENA): Abu Dhabi, UAE, 2014. [Google Scholar]
- Fritsche, U.; Berndes, G.; Cowie, A.; Dale, V. Energy and land use. Work. Pap. Glob. L. Outlook 2017, 14–15. [Google Scholar]
- Sarralde, J.J.; Quinn, D.J.; Wiesmann, D.; Steemers, K. Solar energy and urban morphology: Scenarios for increasing the renewable energy potential of neighbourhoods in London. Renew. Energy 2015, 73, 10–17. [Google Scholar] [CrossRef] [Green Version]
- Portale Atlasole, Gestore dei Servizi Energetici–GSE S.p.A. Available online: http://atlasole.gse.it/atlasole/ (accessed on 22 May 2020).
- Energy, S.O.-A. Land-Use Planning for Energy Efficiency; Elsevier: Berlin/Heidelberg, Germany, 1992. [Google Scholar]
- O’Brien, G. Vulnerability and resilience in the European energy system. Energy Environ. 2009, 20, 399–410. [Google Scholar] [CrossRef]
- Amado, M.; Poggi, F. Solar energy integration in urban planning: GUUD model. In Proceedings of the Energy Procedia; Elsevier Ltd.: Amsterdam, The Netherlands, 2014; Volume 50, pp. 277–284. [Google Scholar]


| Land Use Zones (LUZ) | Explanation |
|---|---|
| ZONE A—Urban settlements with historical-artistic or environmental character | |
| Ar1—Historical center | Built-up areas constituting the historical centers where the interventions are specified in the 1: 1000 scale works of the LUP |
| Ar2—Small settlements with environmental value | Smaller settlements, incorporated in the urban agglomeration or constituting the original settlement fabric of the villages of the agricultural plain |
| Av—Hilly areas of environmental interest | Hilly areas with relevant environmental interest. Single manufactured buildings not included in buildings of category Ar3 are also part of Av, including areas of relevance. |
| ZONE B—Parts of the territory largely or totally built-up | |
| Br—Residential areas largely built-up | Built-up areas of consolidated settlement. |
| Bp—Production areas | Areas with prominent existing production destination which are confirmed in their location. |
| Bpr1—Transformation areas with mainly tertiary use | Areas with prominent-existing production destination with a propensity for transformation from strictly productive activity to tertiary, exhibition, managerial, hospitality and residential activities (art 13, point f, LUR) |
| Bpr2—Transformation areas with mainly residential use | Areas with prominent-existing production destination with a propensity for transformation from productive activity to mainly residential use (art 13, point f, LUR) |
| ZONE C—Parts of the territory of completion or new | |
| Cr—Areas for residential use | Areas mainly for residential use or under construction |
| Crs—Areas for residence and public services | Transformation areas from public services to areas set partly to residential and partly to public services. |
| Crc—Areas for integrated shopping center | Transformation areas from public services to areas destined in part to an integrated shopping district and in part to services for trade and residence (V. Sestriere), art. 13, point e, LUR. |
| Cp—Production, commercial and tertiary areas | Production, tertiary and commercial areas |
| ZONE D—Parts of the territory destined to industry, artisans and tertiary sector | |
| D Zone | Areas with prominent production destination (art.13, point g, LUR) |
| LUP variant | Vadò Industrial Area |
| ZONE E—Parts of the territory set for agricultural use | |
| Ee—Free areas of the rural area in plain | Hilly and plain agricultural areas |
| Ep—Built-up areas used for extra-agricultural uses | Ensemble, buildings, facilities or artefacts which at the time of the adoption of the preliminary project were destined for non-agricultural production activities with the function of storage or warehouse not connected to the management of the farmlands |
| Es—Nurseries | Special agricultural areas for nursery activities |
| Es1—Permanent greenhouses | Special agricultural areas for flower activities |
| ZONE F—Facilities and facilities of general interest (art. 22 ex LUR 56/77) | |
| FV—Public park areas (Urban and District) | Areas of urban and local public parks |
| FH—Social health and hospital facilities | Areas set for existing and projected public hospital facilities |
| FHP—Social health and hospital private facilities | Areas just as FH but private |
| FI—Higher education facilities | Areas destined to facilities for the compulsory high education public-sector |
| FIP—Private higher education facilities | Areas just as FIP but private |
| Ft—Areas for technological systems | Areas destined for technological systems of general interest (ENEL, GAS, Waste Collection, Purifiers, etc.) |
| Frp—PTO area set for mixed-use and leisure | Areas for sports and leisure activities included in the Environmental Protection and Valorization Area of PO river—PTO (DCR 08/03/95 n. 981–4186) |
| Fg—Areas for general facilities of public interest | Areas destined to other general public interest facilitates specifically indicated in the cartography section (fire department, police station, magistrate’s court, library, financial offices, etc.) |
| Fe—Religious areas | Areas with existing buildings mainly destined for religious use (convents, boarding schools, etc.) |
| Fr—Areas for recreational activities included in the Po river belt | Areas for social, cultural, sporting, recreational and private activities included in the Area Plan of the System of Protected Areas of the Po River (DCR 982–4328, 08/03/95—LR 68, 13/04/95) |
| ZONE S—Public spaces (art.21 ex LUR 56/77) | |
| S—Services | Public Facilities |
| Sr—Residential services | Public areas and facilities related to residential settlements |
| Sp—Productive, commercial, tertiary and accommodation services | Public or public use areas for facilities serving the production, tertiary, management and commercial settlements |
| Srp—Private residential services | Existing areas just as SR but private |
| ZONE T—Special transformation areas | |
| TCR—Areas for tertiary activities, residence and services | Areas of transformation from services to residence, tertiary, and commercial activities, and services (art.13, points e–g, LUR) |
| TR—Areas for management and tertiary activities | Transformation area from residence, mixed industrial and handicraft uses of mainly directional and receptive areas, with residence (beginning of C. Trieste) (Art.13, point e, LUR) |
| TE—Areas with a predominantly exhibition tertiary sector | Areas already with services that can be transformed mainly into tertiary, exhibition and/or residential areas |
| OTHERS—Other zones | |
| Railway site | Railway site |
| Cemetery area | Cemetery areas |
| Environmental Protection Area | Areas under restrictions for the protection of natural beauty or for the protection of areas of particular environmental interest |
| Street furniture | Street furniture (junctions, medians, traffic circles, streamside trees, etc.) |
| Category | Indicator | Abbreviation | Formula | Unit | Variables |
|---|---|---|---|---|---|
| Indicators of Energy | Regulatory Minimum for Solar Power (Total Amount for the LUZ) The indicator refers to the Minimum requirement by the Italian D. Lgs 28/2011 (KW). This value is calculated using the formula of the Attachment n. 3 to the National Decree, to measure the minimum energy power installed in relation to the total building surface in a certain land zone area and the “K” coefficient equal to 50. The formula assumes that all buildings are installing photovoltaic modules for electrical energy production after the 1st January 2017. | P | kW | S = total building footprint of the zone (m2) K = corrective coefficient (m2/kW) | |
| Regulatory Minimum for Solar Power (Average Amount for a Representative Building in the LUZ) The indicator, in line with the previous one, refers to the Minimum requirement by the Italian D. Lgs 28/2011 (KW). The difference, in this case, is related to the scale: is an average value referred to a representative building in the land use zone. | kW | P = Regulatory minimum for solar power (total amount for the zone) n = number of buildings in the normative zone | |||
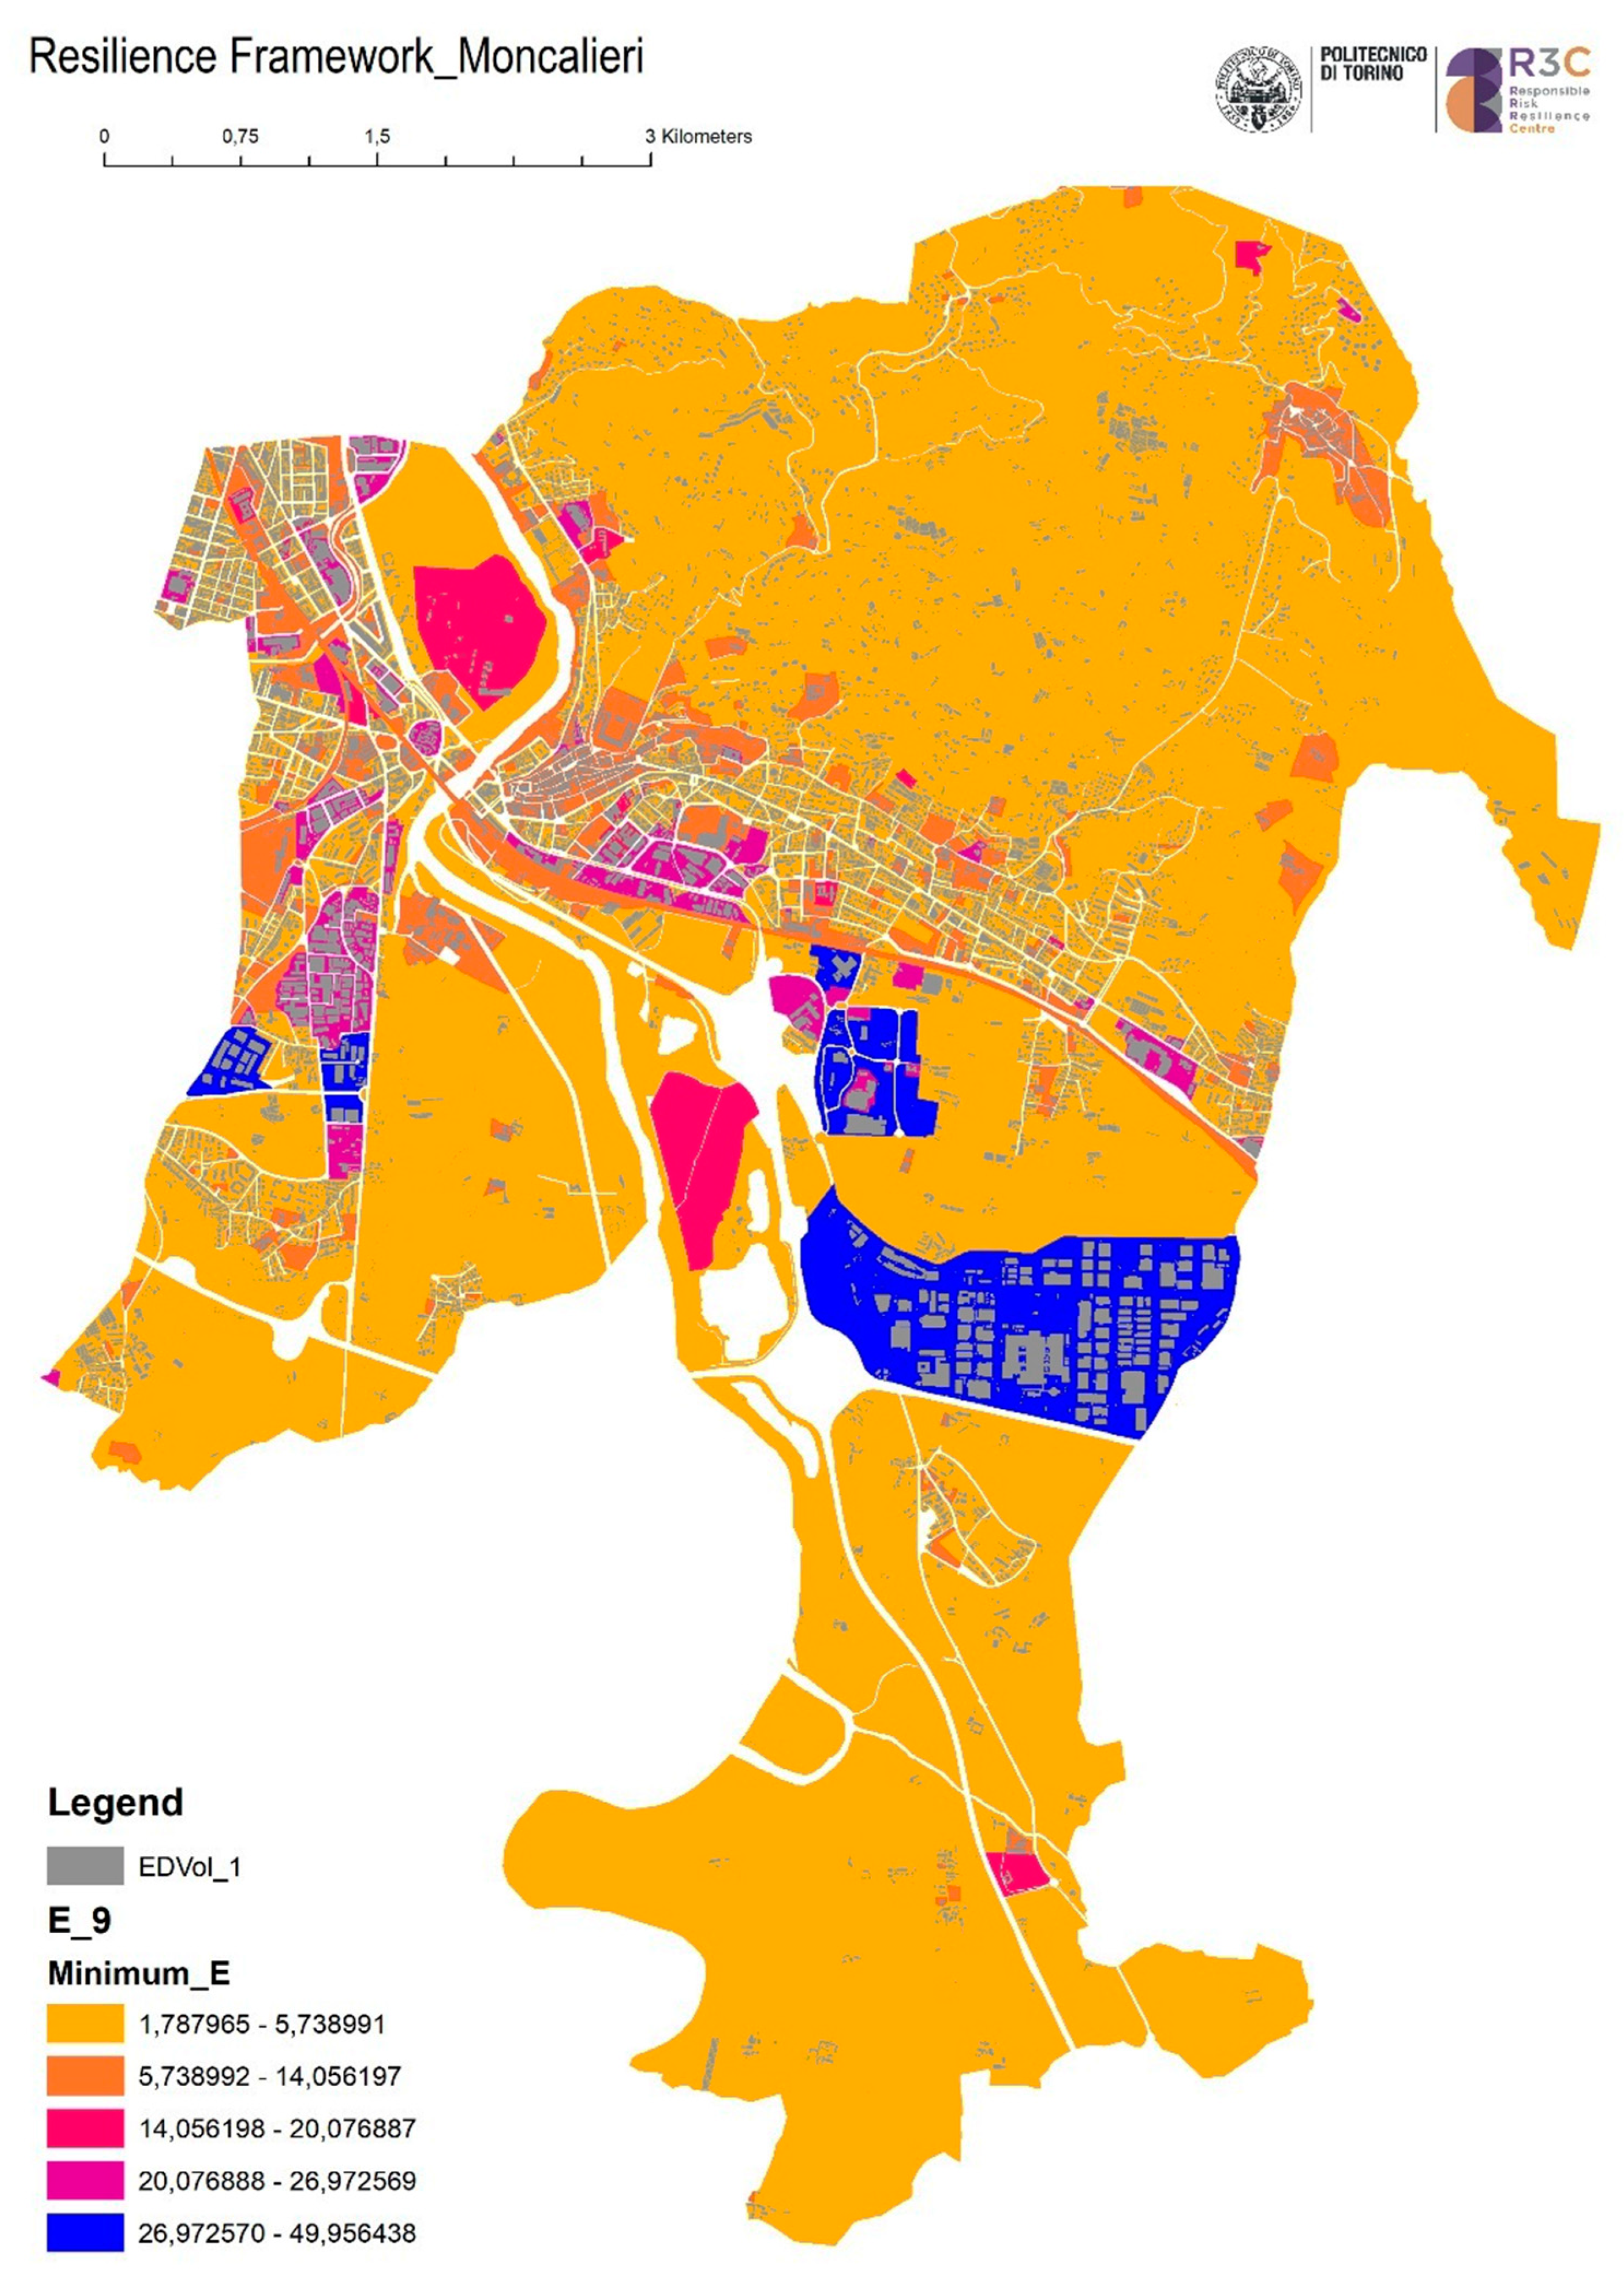
| Total Solar Energy Production Potential of the LUZ This indicator relates the annual solar irradiation in the normative zone (kWh/m2/a) and the net surface of the panels installed in the zone (m2), with respect to the index of the system performance and the conversion efficiency of the panel. The value represents the capacity of solar irradiation which can be turned into solar energy, without remaining simply at the minimum thresholds suggested by the national law. It has been calculated starting from the annual solar irradiation in the normative zone, and thus, represents the whole land use zone energy potential. | E | kWh/year | PR = index of the system performance Hs = accumulated annual solar irradiation in the normative zone (kWh/m2a) S = net efficient surface of the panels installed in the zone (m2) η = conversion efficiency of the panel (m−4) | ||
| Average Solar Energy Production Potential of the LUZ The indicator, in line with the previous one, refers to the average annual solar irradiation in the normative zone (kWh/m2/a) related to the average surface of the panels installed in the zone (m2). Focusing on the average value, it refers to a representative building in the land use zone. | kWh/year | = average efficient surface of the panels installed in the zone (m2) | |||
| Indicators of Morphology | Absolute Compactness This indicator refers to the total building volume in a LUZ (m3), divided by the LUZ total area (m2). It gives the potential quantity of cube meters that are built in each LUZ, therefore representing the compactness of settlements. | Ac | m2 | V = sum of the buildings’ volume in the normative zone (m3) A = total land area of the zone (m2) | |
| Plot Ratio The indicator refers to the total gross floor area (GLA) in a land use zone divided by the total area of a land use zone in which the buildings have been built. The average of GLA (m2) captures the average of gross floor area per land use of a site. For instance, a one-story building that extends on an entire site has a high gross floor area which, in turn, is reduced when floors of the building increase. The indicator is a key variable to control and regulate land use zoning and development control of certain areas, since it regulates the built-up density among different LUZ. | Pl | ratio | GLA = gross floor area of the buildings in the zone (m2) | ||
| Site Coverage The indicator is based on the relation between the total building footprint on the LUZ and the total surface of the LUZ. Being based on the building-footprint and land-coverage, it can also be considered as the bi-dimensional representation of building footprints on a site. The horizontal distribution of built forms is crucial to understand the level of compactness of buildings and consequently, the physical conditions determining the solar energy producibility. | Sc | ratio | S = total building footprint of the zone (m2) |
| Normative Area | E (kWh/Year) | P (kW) | (kWh/Year) | (kW) | Ac (m2) | Sc Ratio | Pl Ratio |
|---|---|---|---|---|---|---|---|
| Ar1 | 7,251,843.42 | 1732.97 | 10,664.48 | 1.54 | 2.29 | 0.28 | 0.63 |
| Ar2 | 7,938,326.26 | 2296.66 | 8656.84 | 1.52 | 1.33 | 0.28 | 0.37 |
| Cemetery area | 9803.27 | 212.65 | 9803.27 | 0.63 | 0.70 | 0.15 | 0.24 |
| Environmental Protection Area | 1,826,377.54 | 512.91 | 28,990.12 | 3.51 | 0.81 | 0.07 | 0.25 |
| Street furniture | 765,407.53 | 143.89 | 12,547.66 | 1.27 | 0.26 | 0.05 | 0.08 |
| Av | 12,938,375.19 | 6118.48 | 12,722.10 | 2.22 | 0.17 | 0.04 | 0.05 |
| Bp | 25,124,828.24 | 7233.49 | 75,779.95 | 6.14 | 2.92 | 0.42 | 0.52 |
| Bpr1 | 3,570,421.28 | 1004.90 | 84,064.95 | 5.05 | 3.09 | 0.48 | 0.76 |
| Bpr2 | 2,245,036.75 | 655.04 | 25,104.18 | 3.02 | 2.01 | 0.43 | 0.62 |
| Br | 60,903,302.93 | 19,093.38 | 15,363.80 | 2.12 | 2.67 | 0.31 | 0.78 |
| Cp | 6,112,824.33 | 1393.46 | 105,097.36 | 11.81 | 0.27 | 0.15 | 0.20 |
| Cr | 22,701,407.24 | 6965.30 | 12,329.69 | 2.03 | 0.58 | 0.12 | 0.18 |
| Crc | 650,321.96 | 211.16 | 81,290.25 | 7.82 | 0.67 | 0.43 | 0.71 |
| Crs | 628,703.64 | 194.84 | 13,017.42 | 1.89 | 0.14 | 0.09 | 0.16 |
| D | 1,869,508.36 | 670.60 | 54,985.54 | 21.63 | 1.32 | 0.31 | 0.39 |
| Ee | 14,457,837.48 | 4927.15 | 15,546.06 | 1.99 | 0.06 | 0.02 | 0.02 |
| Ep | 1,524,901.92 | 389.52 | 30,498.04 | 3.61 | 1.74 | 0.30 | 0.35 |
| Es | 181,398.31 | 46.42 | 90,699.15 | 6.63 | 0.83 | 0.39 | 0.76 |
| Es1 | 106,300.39 | 24.13 | 35,433.46 | 4.83 | 1.57 | 0.63 | 0.63 |
| Fe | 1,076,069.35 | 273.51 | 40,800.25 | 3.38 | 1.17 | 0.12 | 0.36 |
| Fg | 1,034,831.13 | 255.31 | 29,566.60 | 4.91 | 2.05 | 0.36 | 0.74 |
| Fh | 438,061.65 | 80.47 | 41,035.03 | 1.52 | 3.95 | 0.30 | 1.22 |
| Fhp | 64,626.40 | 14.97 | 64,626.40 | 1.00 | 0.20 | 0.02 | 0.06 |
| Fi | 880,981.07 | 282.78 | 51,822.42 | 5.54 | 2.62 | 0.23 | 0.83 |
| Fip | 1,182,791.57 | 303.96 | 15,906.72 | 2.17 | 1.83 | 0.18 | 0.54 |
| Fr | 1,144,473.75 | 319.86 | 34,850.70 | 3.20 | 0.07 | 0.02 | 0.02 |
| Frp | 341,091.83 | 96.76 | 10,554.40 | 2.85 | 0.26 | 0.05 | 0.08 |
| Ft | 2,843,457.26 | 694.14 | 25,857.56 | 2.41 | 2.03 | 0.18 | 0.38 |
| Fv | 3,245,660.78 | 1035.81 | 36,627.89 | 1.51 | 0.04 | 0.01 | 0.01 |
| S | 49,353.94 | 14.42 | 6169.24 | 0.72 | 0.02 | 0.01 | 0.00 |
| Railway site | 2,371,320.36 | 238.94 | 30,016.71 | 1.11 | 0.16 | 0.03 | 0.05 |
| Sp | 896,358.06 | 80.63 | 57,924.64 | 2.78 | 0.10 | 0.04 | 0.05 |
| Sr | 15,521,895.56 | 3463.24 | 29,706.28 | 2.31 | 0.79 | 0.12 | 0.23 |
| Srp | 1,352,786.36 | 140.73 | 37,860.70 | 2.99 | 1.49 | 0.15 | 0.47 |
| Tcr | 4,196,030.14 | 1340.97 | 65,318.25 | 5.56 | 2.67 | 0.39 | 0.59 |
| Te | 2,734,825.43 | 851.05 | 62,020.04 | 8.26 | 1.54 | 0.39 | 0.56 |
| Tr | 683,306.65 | 192.49 | 28,093.23 | 4.48 | 1.21 | 0.22 | 0.26 |
| LUP variant | 38,611,870.42 | 11,207.22 | 143,006.93 | 14.61 | 2.32 | 0.29 | 0.38 |
| Normative Area | (kWh/Year) | Minimum (kWh/Year) | Difference (kWh/Year) |
|---|---|---|---|
| Ar1 | 10,664.48 | 1848 | 8816.48 |
| Ar2 | 8656.84 | 1824 | 6832.84 |
| Cemetery area | 9803.27 | 756 | 9047.27 |
| Environmental Protection Area | 28,990.00 | 4212 | 24,778.00 |
| Street furniture | 12,547.00 | 1524 | 11,023.00 |
| Av | 12,722.00 | 2664 | 10,058.00 |
| Bp | 75,779.00 | 7368 | 68,411.00 |
| Bpr1 | 84,064.00 | 6060 | 78,004.00 |
| Bpr2 | 25,104.00 | 3624 | 21,480.00 |
| Br | 15,363.00 | 2544 | 12,819.00 |
| Cp | 105,097.00 | 14,172 | 90,925.00 |
| Cr | 12,329.00 | 2436 | 9893.00 |
| Crc | 81,290.00 | 9384 | 71,906.00 |
| Crs | 13,017.00 | 2268 | 10,749.00 |
| D | 54,985.00 | 25,956 | 29,029.00 |
| Ee | 15,546.00 | 2388 | 13,158.00 |
| Ep | 30,498.00 | 4332 | 26,166.00 |
| Es | 90,699.00 | 7956 | 82,743.00 |
| Es1 | 35,433.00 | 5796 | 29,637.00 |
| Fe | 40,800.00 | 4056 | 36,744.00 |
| Fg | 29,566.00 | 5892 | 23,674.00 |
| Fh | 41,035.00 | 1824 | 39,211.00 |
| Fhp | 64,626.00 | 1200 | 63,426.00 |
| Fi | 51,822.00 | 6648 | 45,174.00 |
| Fip | 15,906.00 | 2604 | 13,302.00 |
| Fr | 34,850.00 | 3840 | 31,010.00 |
| Frp | 10,554.00 | 3420 | 7134.00 |
| Ft | 25,857.00 | 2892 | 22,965.00 |
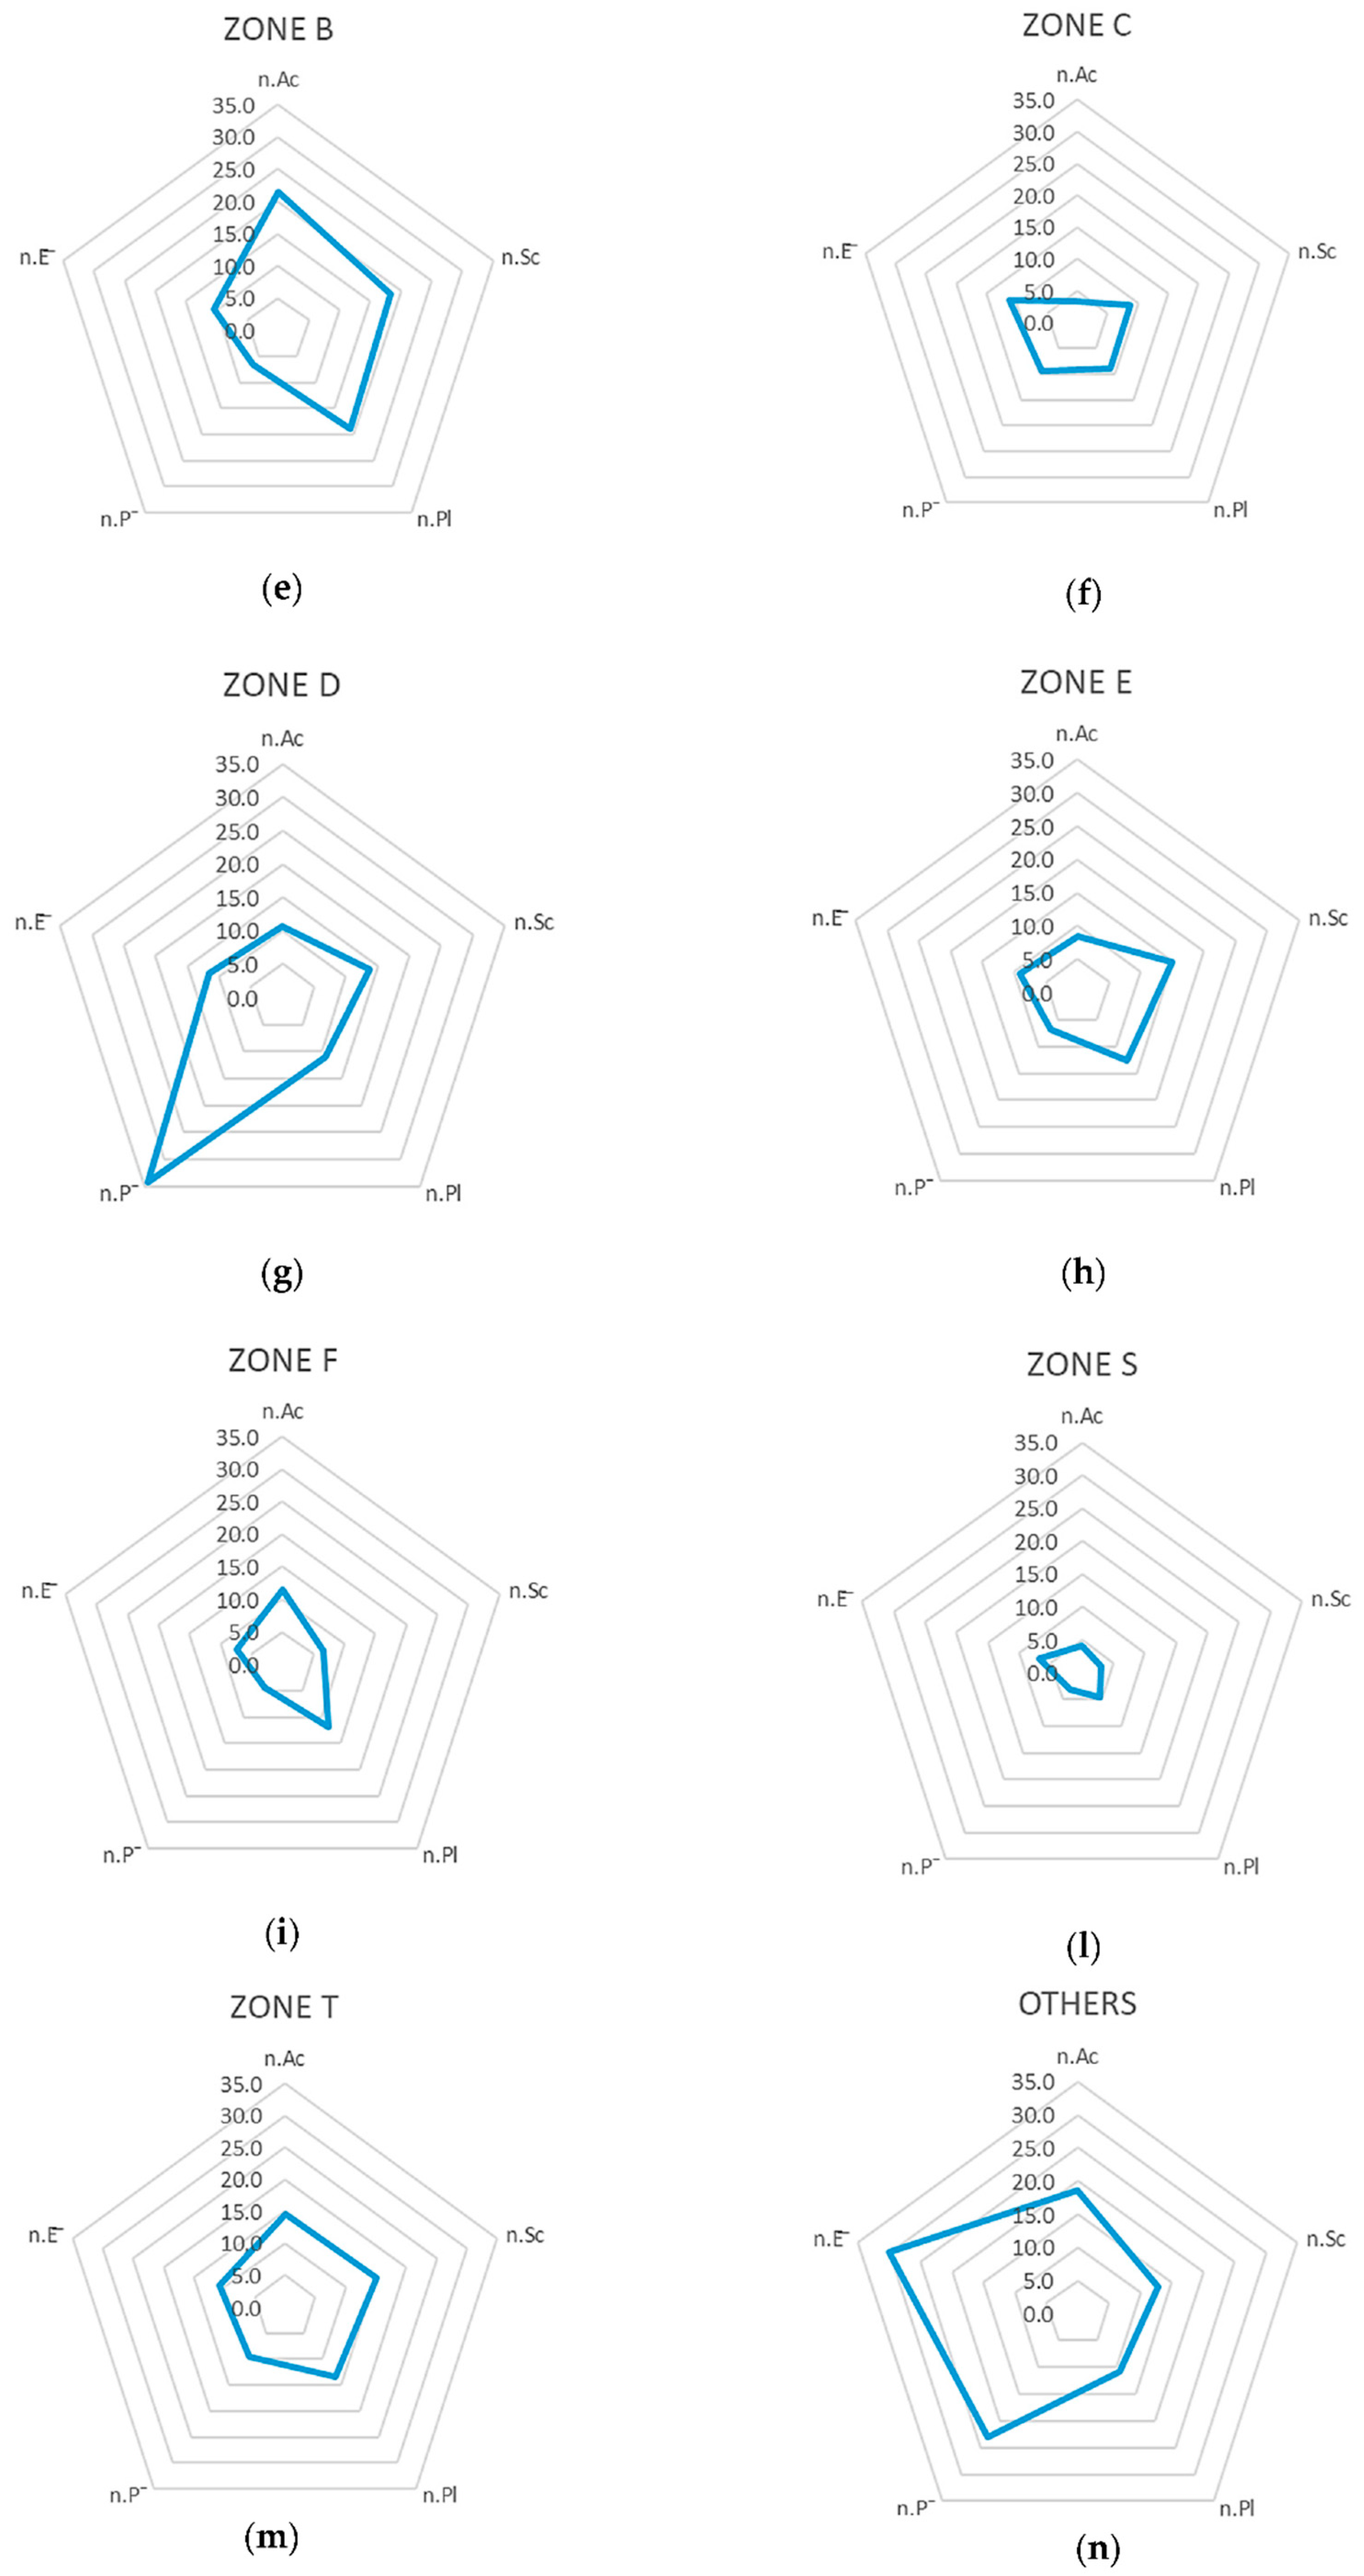
| Zone | n.Ac | n.Sc | n.Pl | ||
|---|---|---|---|---|---|
| A | 7.4 | 6.4 | 7.7 | 2.8 | 2.9 |
| B | 21.5 | 18.4 | 19.0 | 6.5 | 10.5 |
| C | 3.3 | 8.8 | 8.9 | 9.3 | 11.1 |
| D | 10.6 | 13.8 | 11.0 | 34.2 | 11.5 |
| E | 8.4 | 15.1 | 12.6 | 6.7 | 9.0 |
| F | 11.4 | 6.6 | 12.0 | 4.5 | 7.4 |
| S | 4.1 | 3.1 | 4.6 | 3.1 | 6.8 |
| T | 14.5 | 15.0 | 13.3 | 9.7 | 10.9 |
| V | 18.7 | 12.9 | 10.9 | 23.1 | 30.0 |
© 2020 by the authors. Licensee MDPI, Basel, Switzerland. This article is an open access article distributed under the terms and conditions of the Creative Commons Attribution (CC BY) license (http://creativecommons.org/licenses/by/4.0/).
Share and Cite
Mohabat Doost, D.; Buffa, A.; Brunetta, G.; Salata, S.; Mutani, G. Mainstreaming Energetic Resilience by Morphological Assessment in Ordinary Land Use Planning. The Case Study of Moncalieri, Turin (Italy). Sustainability 2020, 12, 4443. https://doi.org/10.3390/su12114443
Mohabat Doost D, Buffa A, Brunetta G, Salata S, Mutani G. Mainstreaming Energetic Resilience by Morphological Assessment in Ordinary Land Use Planning. The Case Study of Moncalieri, Turin (Italy). Sustainability. 2020; 12(11):4443. https://doi.org/10.3390/su12114443
Chicago/Turabian StyleMohabat Doost, Danial, Alessandra Buffa, Grazia Brunetta, Stefano Salata, and Guglielmina Mutani. 2020. "Mainstreaming Energetic Resilience by Morphological Assessment in Ordinary Land Use Planning. The Case Study of Moncalieri, Turin (Italy)" Sustainability 12, no. 11: 4443. https://doi.org/10.3390/su12114443