
Herbicide applications increase greenhouse gas emissions of alfalfa pasture in the inland arid region of northwest China
- Published
- Accepted
- Received
- Academic Editor
- Xinfeng Wang
- Subject Areas
- Agricultural Science, Soil Science, Environmental Impacts
- Keywords
- Herbicides, Weeds, Control, Greenhouse gases, Alfalfa
- Copyright
- © 2020 Shi et al.
- Licence
- This is an open access article distributed under the terms of the Creative Commons Attribution License, which permits unrestricted use, distribution, reproduction and adaptation in any medium and for any purpose provided that it is properly attributed. For attribution, the original author(s), title, publication source (PeerJ) and either DOI or URL of the article must be cited.
- Cite this article
- 2020. Herbicide applications increase greenhouse gas emissions of alfalfa pasture in the inland arid region of northwest China. PeerJ 8:e9231 https://doi.org/10.7717/peerj.9231
Abstract
Herbicides are used to control weeds in agricultural crops such as alfalfa (Medicago sativa L.), which is a forage crop. It is unclear what, if any, effect herbicides have on greenhouse gas (GHG) emissions when used on alfalfa. Our study was conducted in 2017 and 2018 to investigate the effects of two herbicides (Quizalofop-p-ethyl, QE and Bentazone, BT) on methane (CH4), carbon dioxide (CO2) and nitrous oxide (N2O) emissions from soil planted with alfalfa. QE is used to control grasses and BT is used for broadleaf weed control. Soil CO2 emissions and soil uptake of CH4 increased significantly in both years following the QE and BT treatments, although CO2 emissions differed significantly between the trial years. N2O emissions decreased relative to the control and showed no significant differences between the trial years. The application of QE and BT on alfalfa resulted in a significant increase in CO2 emissions which contributed to a significant increase in GHG emissions. The application of QE influenced GHG emissions more than BT. We demonstrated the potential effect that herbicide applications have on GHG fluxes, which are important when considering the effect of agricultural practices on GHG emissions and the potential for global warming over the next 100 years.
Introduction
Large amounts of agrochemicals, including herbicides, insecticides and fungicides, are used to control agricultural threats like weeds, pests and pathogens (Dennis et al., 2018). The average worldwide use of agricultural pesticides amounted to 2.63 kg·ha−1 in 2017. However, the average use in China peaked at 13.07 kg·ha−1 in the same year (The Food and Agriculture Organization, 2017). We predict that the use of herbicide in crop production will continue to increase globally, particularly in developing countries, due to a shortage of manual labor for hand weeding that affects their crop yields (Gianessi, 2013). Herbicides can quickly and effectively inhibit the growth of weeds and increase crop yield, but also indirectly affect the flux of soil GHG by changing vegetation-soil interactions (Ahmed, Chauhan & Humphreys, 2013). GHG, particularly CH4, CO2 and N2O, have aroused considerable concern in recent decades because of the acknowledged contribution of these gases to global warming. Agricultural soils are major anthropogenic sources of GHG and account for approximately 60% of CH4, 15% of CO2 and 61% of N2O emissions (IPCC, 2013). Herbicides influence the interspecific competition between crops and weeds and affects the composition of the vegetation (Kökten & Tükel, 2009), which affects soil moisture and temperature (Leuschner & Lendzion, 2010). Herbicides may change the structure and function of the soil’s microbial communities by affecting their levels of enzymatic activity (Crouzet et al., 2010). This, in turn, impacts the activity of fungi and bacteria associated with the decomposition of plant matter and ultimately all soil GHG emissions (Wang et al., 2017).
Herbicidal research has focused on the mode of action (Mithila et al., 2011), efficacy (James et al., 2018; Karimmojeni et al., 2013), and resistance of plants to herbicides (Owen, Martinez & Powles, 2014; Yu & Powles, 2014). Relatively little attention has been paid to the impact of herbicide use on GHG emissions to date. Gianessi (2013) demonstrated that the use of herbicides reduced GHG emissions by reducing the fuel consumption of traditional farming machinery that would otherwise be used to manage weeds. Jiang et al. (2015) demonstrated that the application of Butachlor and Bensulfuron-methyl in winter wheat fields reduced N2O emissions. The application of these herbicides to irrigated rice fields significantly reduced CH4 and N2O fluxes. Although single applications of Bensulfuron-methyl and Pretilachlor reduced GHG emissions, the combination of these two herbicides was shown to increase the emissions of N2O and CH4 (Das, Ghosh & Adhya, 2011). Oyeogbe et al. (2017) demonstrated that strategic nitrogen fertilizer use and integrated weed management reduced GHG emissions. Chemicals play an important role in GHG emissions and mitigation, but these effects are still not well known in grassland ecosystems as the majority of research has focused on cropland ecosystems. Most grasslands studies have concentrated on annual grass crops rather than perennial and legume crops. Legumes (e.g., alfalfa) are important crops owing to their yield-forming potential and high protein value (Staniak & Harasim, 2018). Alfalfa is widely grown all over the world and is the largest forage crop sown in China. The majority of these crops are grown in the northwest arid region of China, including Gansu, Xinjiang, Ningxia, and Inner Mongolia. Alfalfa protects the ecology of the northwest arid region of China and contributes to the development of animal husbandry (Feng et al., 2016). It covers a total area of 4,745 × 103 ha in China (Wei et al., 2018) and herbicide application is necessary to produce a maximum yield.
Quizalofop-p-ethyl (QE) is a commonly used selective herbicide that systemically protects leguminous forage from grass weeds (Fan, Sun & Fan, 2001). Bentazone (BT) is a post-emergence herbicide used for the selective control of broadleaf weeds and sedges in beans, rice, corn, peanuts and other crops (Ribeiro et al., 2011). Although these two herbicides are widely used in alfalfa crops throughout the world, their effects on GHG emissions in soil planted with alfalfa remains unknown. The aims of this study were: (1) to investigate the effect of the application of QE and BT on GHG emissions of alfalfa pasture and (2) to analyze the mechanisms of effect these chemicals had on GHG emissions and to provide a best-practice reference for the management of alfalfa for forage production.
Materials and Methods
Site description
Field trials were conducted from 2017 to 2018 at the Linze Grassland Agriculture Station of Lanzhou University, located in the core area of the Heihe Oasis in Hexi Corridor, Northwest China (100°02′E, 39°15′N; 1,390 m above sea level). The area has a temperate continental climate with distinct seasons that include long, cold winters, short, hot summers, rapid warming in the spring and slow cooling in autumn. The annual average temperature is 7.7 °C, with a ≥0 °C accumulated temperature of 3,026 °C. The annual average precipitation is 118.4 mm and the evaporation rate is 1,830.4 mm. More than 70% of the precipitation occurs from May to September. Specialized intensive cropping production systems and extensively integrated crop-livestock production systems dominate the agricultural practices of this region (Hou et al., 2008).
Plantago asiatica L., Agropyron cristatum Gaertn., Digitaria sanguinalis Scop., Chenopodium glaucum L., Portulaca oleracea L., Setaria viridis Beauv., Echinochloa crusgalli Beauv., Suaeda glauca Bunge and Ixeris denticulata Stebbins were the dominant weeds found in the study area. Many of these weeds are annual and seeds begin heading in the latter half of August and mature after August and September.
Experimental design
Our experiment was randomized with three replicates per treatment. Each test plot (8 m × 10 m) was separated by a guarding row. Alfalfa (var. Algonquin) was sown randomly in three 50 m × 60 m plots in August of 2012 and 2013, respectively. On September 5, 2017 and August 12, 2018, two herbicides (QE and BT) were applied using a knapsack sprayer to the alfalfa trial plots using their recommended application rates (QE, 0.9 L·ha−1 in 4.5 L water·ha−1; BT, 30 L·ha−1 in 150 L water·ha−1). Water with no herbicide was applied to the control plots (CK).
GHG, soil, and aboveground biomass sampling and analysis
Measurements of CH4, CO2 and N2O, the three principal GHGs, were collected using three static opaque chambers on each plot. The aboveground biomass was first cut to eliminate the inference of alfalfa photosynthesis and respiration on the gas samples. Samples were taken between 09:00–11:00 AM (Liu et al., 2017) for 3 weeks after the herbicides were applied. Samples were taken on day 2, day 4, day 6, day 10 and day 15 in 2017 and on day 2, day 4, day 6, day 8, day 10, day 15 and day 20 in 2018. Each chamber measured 30 cm × 30 cm × 30 cm and was constructed to be gas-proof by fitting the base of its walls into a water-filled collar inserted 30 mm into the soil. Each chamber was equipped with a battery-operated fan to mix the gases. Gas samples were collected through a three-way tap using a 50 ml syringe and were then transferred to a 500 ml aluminum foil gas collection bag. Four gas sample bags were collected per each sampling process and samples were taken 0, 10, 20 and 30 min after placing the chamber to represent the daily average GHG flow. Approximately 300 ml of the gas from each gas sample was brought back to the laboratory for analysis. The temperature inside the chamber and the soil temperature (ST, °C at a depth of 50 mm) was measured simultaneously during gas sampling.
A CH4/CO2 analyzer (DLT-100, Model No. 908-0011-0001) was used to determine the concentration of CH4 and CO2 and a CO/N2O analyzer (Model No. 908-0015-0000) was used to determine the N2O concentration. We used the gas flux calculation formula from Song et al. (2003), and the specific calculation formula is as follows: Where F is the gas flux (μg·m−2·h−1 or mg·m−2·h−1); ρ is the gas density at STP (standard temperature and pressure: CO2, CH4 and N2O: 1.977, 0.717 and 1.978 kg·m−3, respectively); V is the chamber volume (m3); A is the base area of the static chamber (m2); PS is the atmospheric pressure (kPa) at the sampling sites; P0 is the atmospheric pressure at STP (101.325 kPa); T0 is the temperature at STP (273.15 K); T is the temperature inside the chamber (K), and dCt/dt is the rate of change in gas concentration over time.
The cumulative amount of CH4, CO2 and N2O emissions were sequentially determined from the emissions recorded from each set of two subsequent days. The effect of GHG emissions from herbicide use is expressed in terms of global warming potential (GWP or CO2 equivalent). The GWP of CH4 and N2O was founded to be 25 times and 298 times that of CO2, respectively, on the 100-year horizon. (Chen et al., 2011; Liu et al., 2017).
The aboveground biomass (g·m−2) of alfalfa and weeds was sampled in 2017 and 2018 using three randomly placed quadrats (1 m × 1 m) along a diagonal transect in each plot on day 0, day 2, day 6 and day 15 following the application of herbicides.
Three soil samples were taken from each plot at the time of gas collection using a soil drill with a diameter of 50 mm to depths of 0–10 cm. Fresh samples were used to determine the percentage of soil moisture (SM, %) (Song, 1993).
Statistical analyses
Statistical analyses were conducted using SPSS 20.0 (SPSS, Inc., Armonk, NY, USA) with significance levels set at 0.05. Differences in the soil moisture, soil temperature, CH4, CO2 and N2O fluxes caused by the herbicides, days and application years were examined by ANOVA. The differences in the cumulative CH4, CO2 and N2O emissions between the treatments and years were examined using Duncan’s new multiple range test and an independent-sample t-test, respectively. The analysis of interactions between the soil moisture, soil temperature, aboveground biomass of alfalfa and weeds and cumulative GHG emissions were examined using general linear models.
A structural equation model (SEM) was developed using IBM SPSS Amos version 17 (Amos Development Company, Greene, Maine, USA; SPSS Inc., Chicago, IL, USA), which was used to quantify the relationship between the treatments and GHG emissions. We considered all the endogenous variables, including treatments (QE, BT and CK), soil moisture, soil temperature and the aboveground biomass of alfalfa and weeds on the GHG fluxes (CO2, CH4 and N2O). The chi-square test was used to evaluate the fit of the model indicated by 0 ≤ χ2/df ≤ 2 and 0.05 < P ≤ 1.
Results
Soil moisture and soil temperature
The soil moisture content varied greatly throughout the field trials (Figs. 1A and 3B), however, no significant difference in soil moisture was observed between the treatments (P > 0.05) (Fig. 1B). Soil moisture increased on the day 10 in 2017 after a rainfall of 9.9 mm. High-intensity precipitation (28.4 mm on day 7 and 28 mm on day 19) in 2018 also resulted in an increase in moisture on days 9 and 20 of the herbicide applications when compared to days 6 and 15. There was no significant difference in soil temperature between the treatments (P > 0.05) (Figs. 1C and 1D).
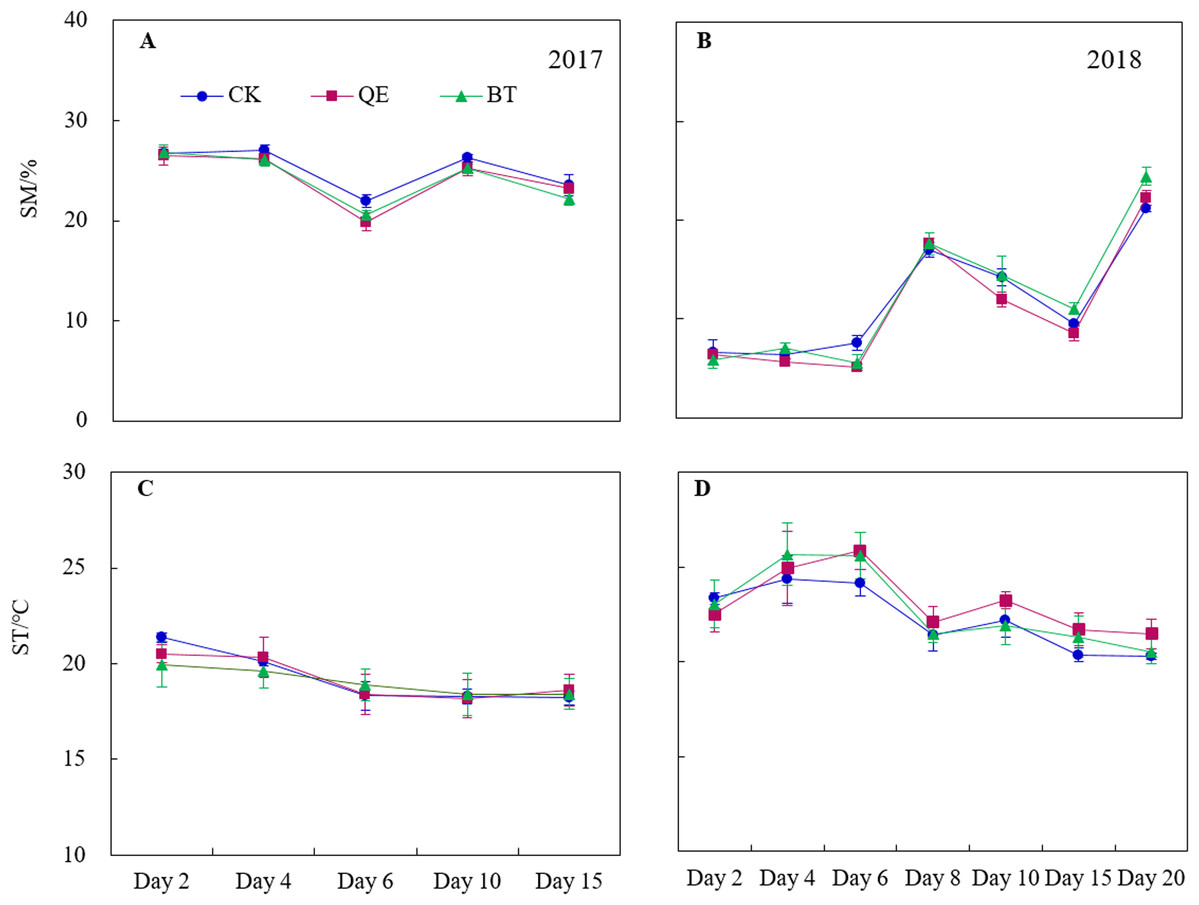
Figure 1: Daily dynamics of the soil moisture (SM) (A and B) and soil temperature (ST) (C and D) throughout the field trials in the two years (2017 and 2018).
For the SM and ST, points with no mark are not significantly different between treatment in the same sampling time (P > 0.05).
There was a significant effect of the year, treatment, sampling time, the interaction between year and sampling time, the interaction between treatment and sampling time and interaction between year, treatment and sampling time for soil moisture (P < 0.05) (Table 1). There was a significant effect of the year, sampling time and interaction between year and sampling time for soil temperature (P < 0.05) (Table 1).
| Variable | Soil moisture | Soil temperature | ||
|---|---|---|---|---|
| F | P | F | P | |
| Y | 2,651.76 | <0.001 | 117.82 | <0.001 |
| T | 9.88 | <0.001 | 1.01 | 0.37 |
| S | 181.75 | <0.001 | 6.14 | <0.001 |
| Y × T | 0.04 | 0.96 | 1.48 | 0.23 |
| Y × S | 64.69 | <0.001 | 2.78 | <0.05 |
| T × S | 3.05 | <0.01 | 0.60 | 0.83 |
| Y × T × S | 3.70 | <0.001 | 0.63 | 0.75 |
Note:
Y, year; T, treatment; S, sampling time; Y × T, interaction between year and treatment; Y × S, interaction between year and sampling time; T × S, interaction between year and sampling time; Y × T × S, interaction between year, treatment and sampling time.
Aboveground biomass of alfalfa and weeds
There was no significant effect on aboveground alfalfa biomass following the application of herbicides (P > 0.05) (Figs. 2A–2D). The biomass of aboveground weeds was significantly reduced after the application of herbicides (P < 0.05) (Fig. 2H). There was no significant difference in the aboveground biomass of weeds between the CK and both herbicides on day 0, day 2 and day 6 following herbicide application (Figs. 2E–2G). The aboveground weed biomass decreased compared to the CK by 28.23% (P = 0.148) and 37.61% (P = 0.098) following the QE treatment on day 6 in 2017 and 2018, respectively. The aboveground weed biomass decreased compared to the CK by 27.44% (P = 0.186) and 26.64% (P = 0.074) following BT treatment on day 6 in 2017 and 2018, respectively. However, on day 15, after the application of QE, the aboveground weed biomass was significantly lower than that of the CK by 115.82% (P = 0.002) in 2017 and by 117.72% (P = 0.001) in 2018, whereas after the BT treatment, the aboveground weed biomass decreased by 117.0% (P = 0.002) in 2017 and 80.77% (P = 0.000) in 2018.
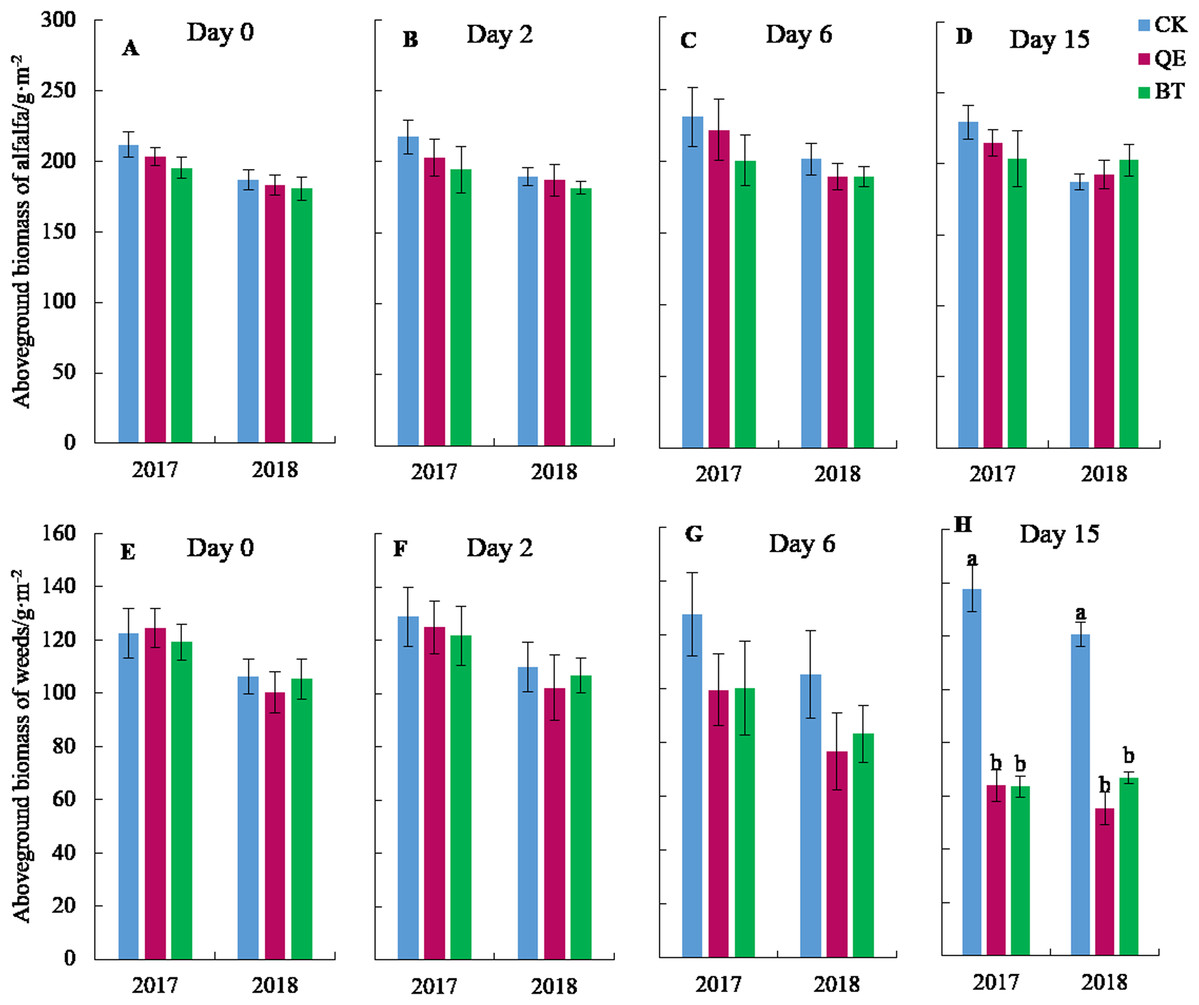
Figure 2: Daily dynamics of aboveground biomass of alfalfa (A–D) and weeds (E–H) at the sampling time after herbicide application in the two years (2017 and 2018).
For the aboveground biomass of alfalfa (A–D), columns with no letters are not significantly different (P > 0.05). For the aboveground biomass of weeds (E–H), columns with no letters are not significantly different (P > 0.05), and with different lowercase letters are significantly different (P < 0.05).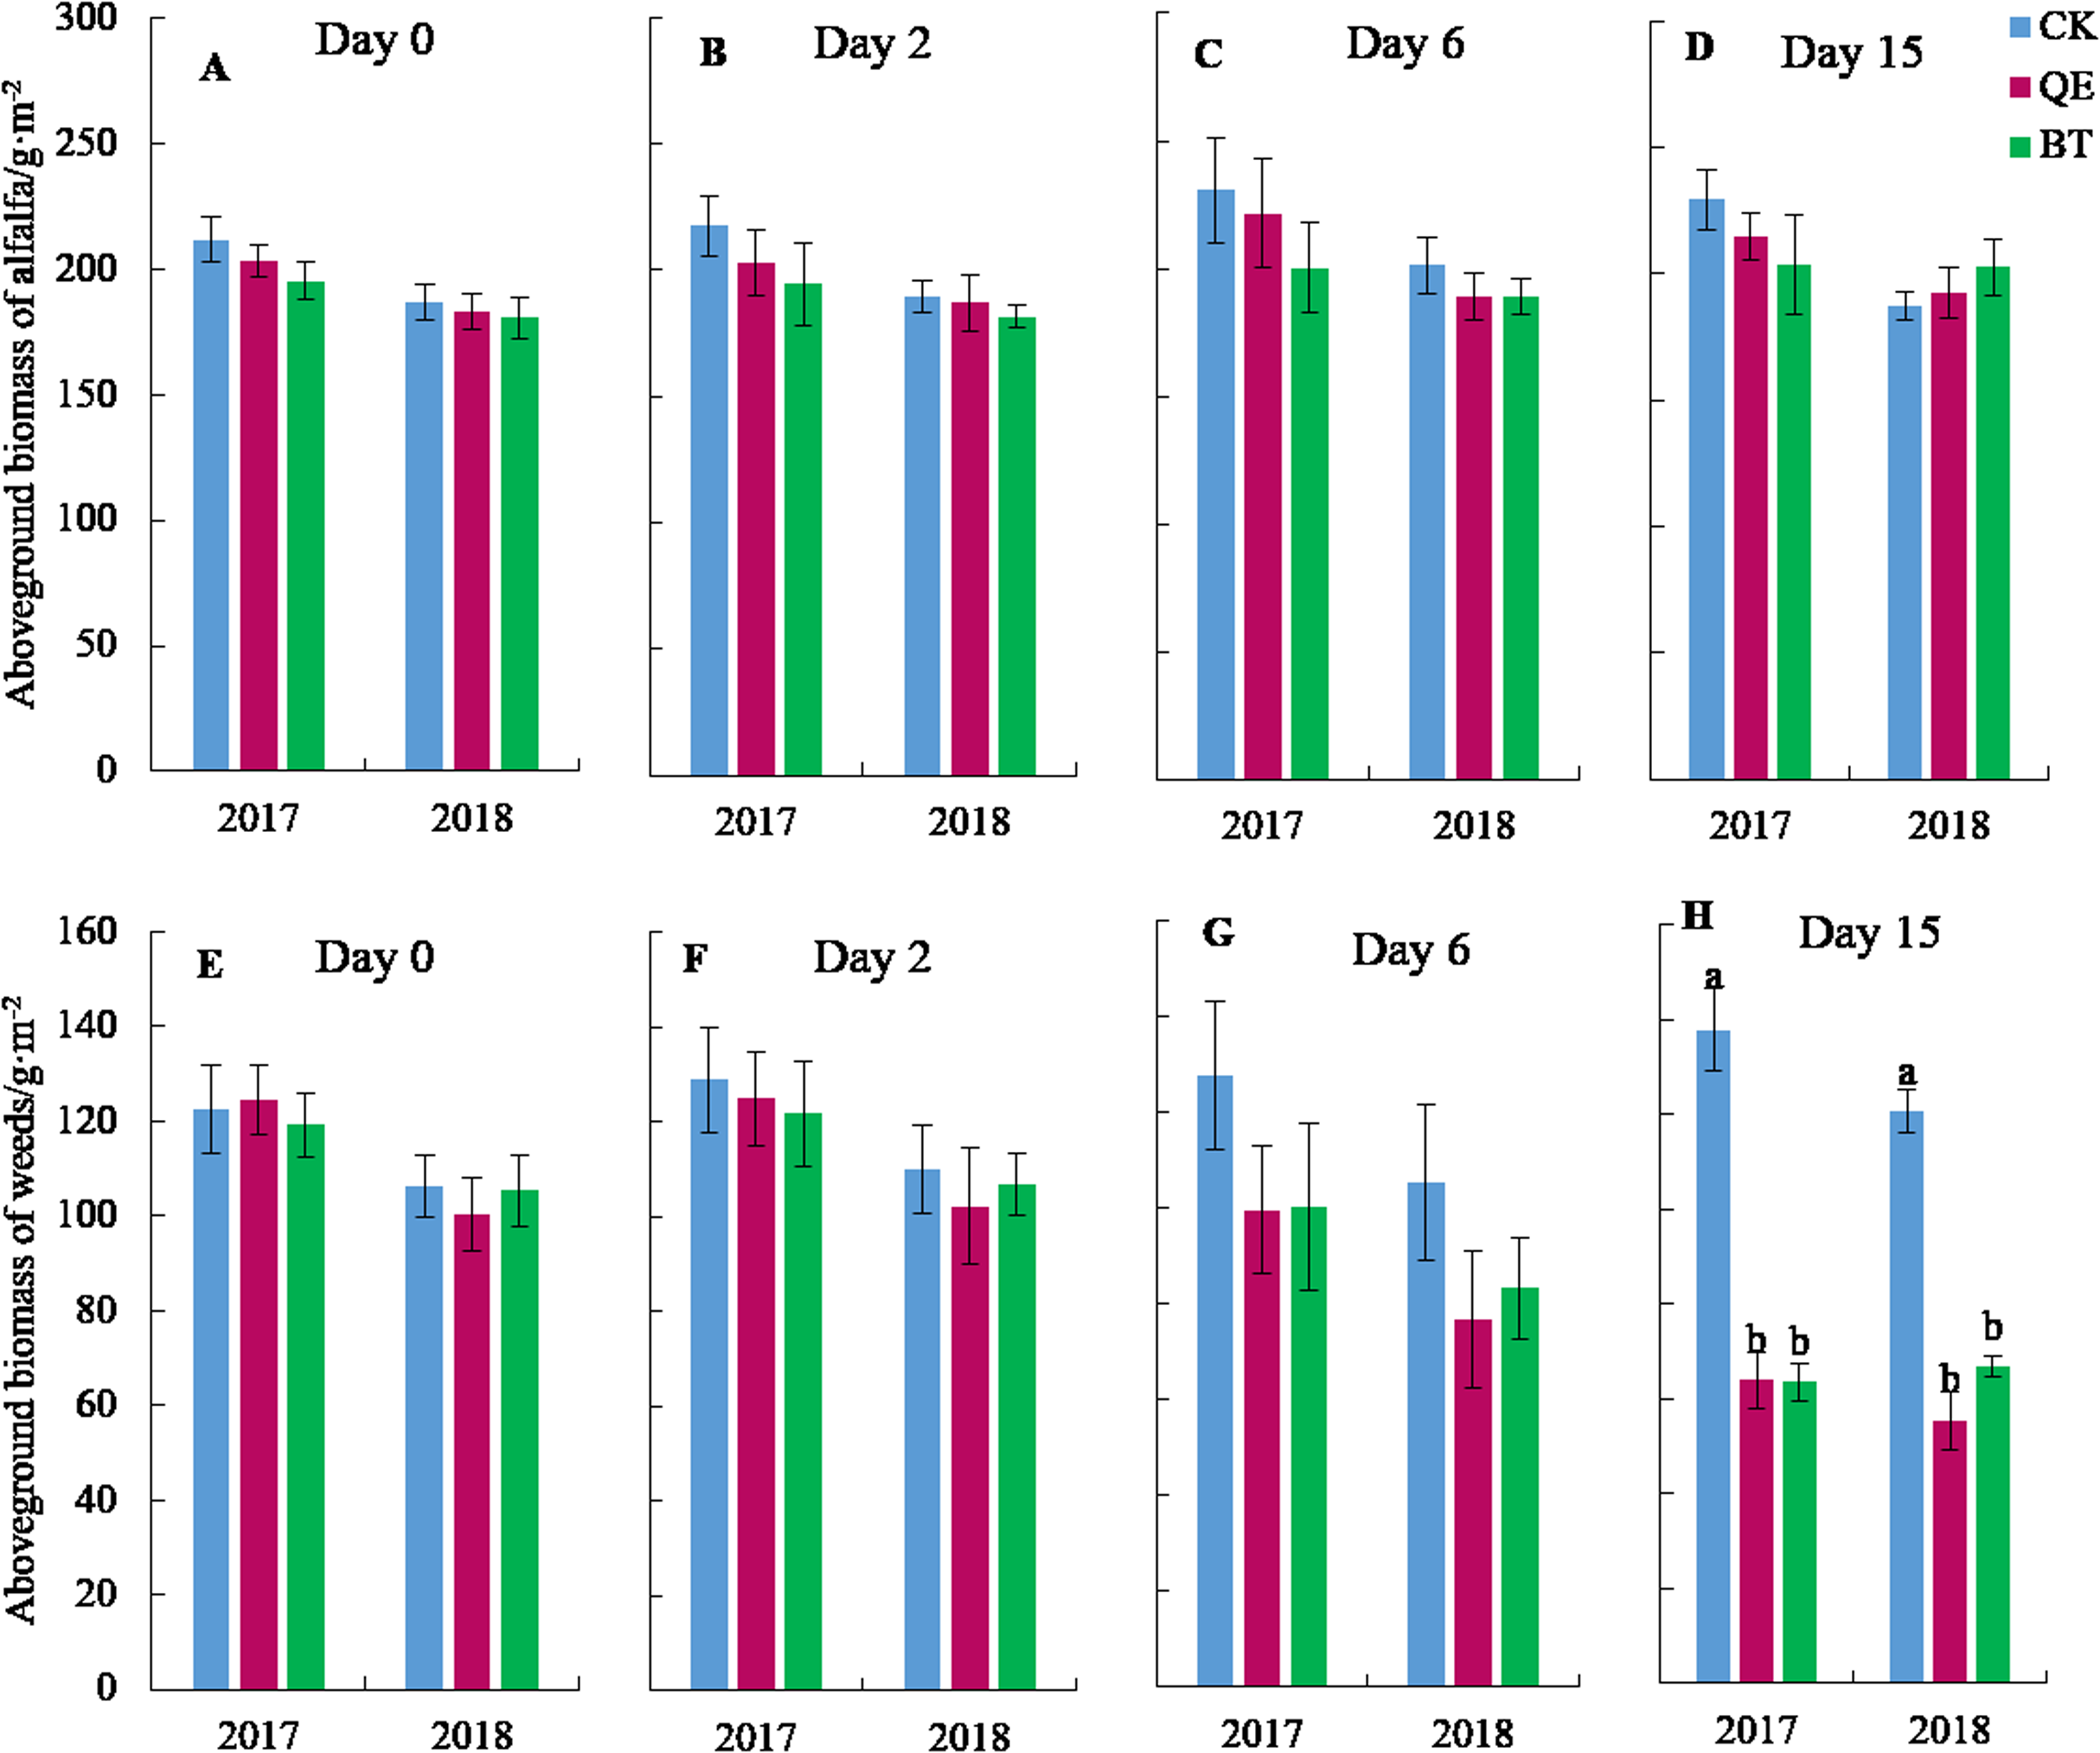
The year had a significant effect on the aboveground biomass of alfalfa. The year, treatment, sampling time, interaction between treatment and sampling time had significant effects on the aboveground biomass of weeds (Table 2).
| Variable | Alfalfa | Weeds | ||
|---|---|---|---|---|
| F | P | F | P | |
| Y | 4.750 | <0.05 | 14.929 | <0.001 |
| T | 0.861 | 0.431 | 29.695 | <0.001 |
| S | 0.562 | 0.575 | 19.562 | <0.001 |
| Y × T | 0.419 | 0.661 | 0.586 | 0.562 |
| Y × S | 0.221 | 0.803 | 1.045 | 0.362 |
| T × S | 0.204 | 0.934 | 8.807 | <0.001 |
| Y × T × S | 0.058 | 0.994 | 0.150 | 0.962 |
Note:
Y, year; T, treatment; S, sampling time; Y × T, interaction between year and treatment; Y × S, interaction between year and sampling time; T × S, interaction between year and sampling time; Y × T × S, interaction between year, treatment and sampling time.
GHG fluxes
The application of herbicides on alfalfa did not change the dynamics of CH4 uptake in the soil (Figs. 3A and 3B), but it significantly increased the capacity of soil to absorb CH4 (P < 0.05). CH4 fluxes all decreased significantly within 6 days and 8 days following the QE and BT treatments in 2017 and 2018, respectively (P < 0.05), compared with the CK. There was no significant difference shown between the other sampling times. Peak CH4 uptake occurred on day 6 in 2017 and 2018 after the herbicide applications and there was no significant difference in CH4 fluxes between the QE and BT treatments in both years (P > 0.05).
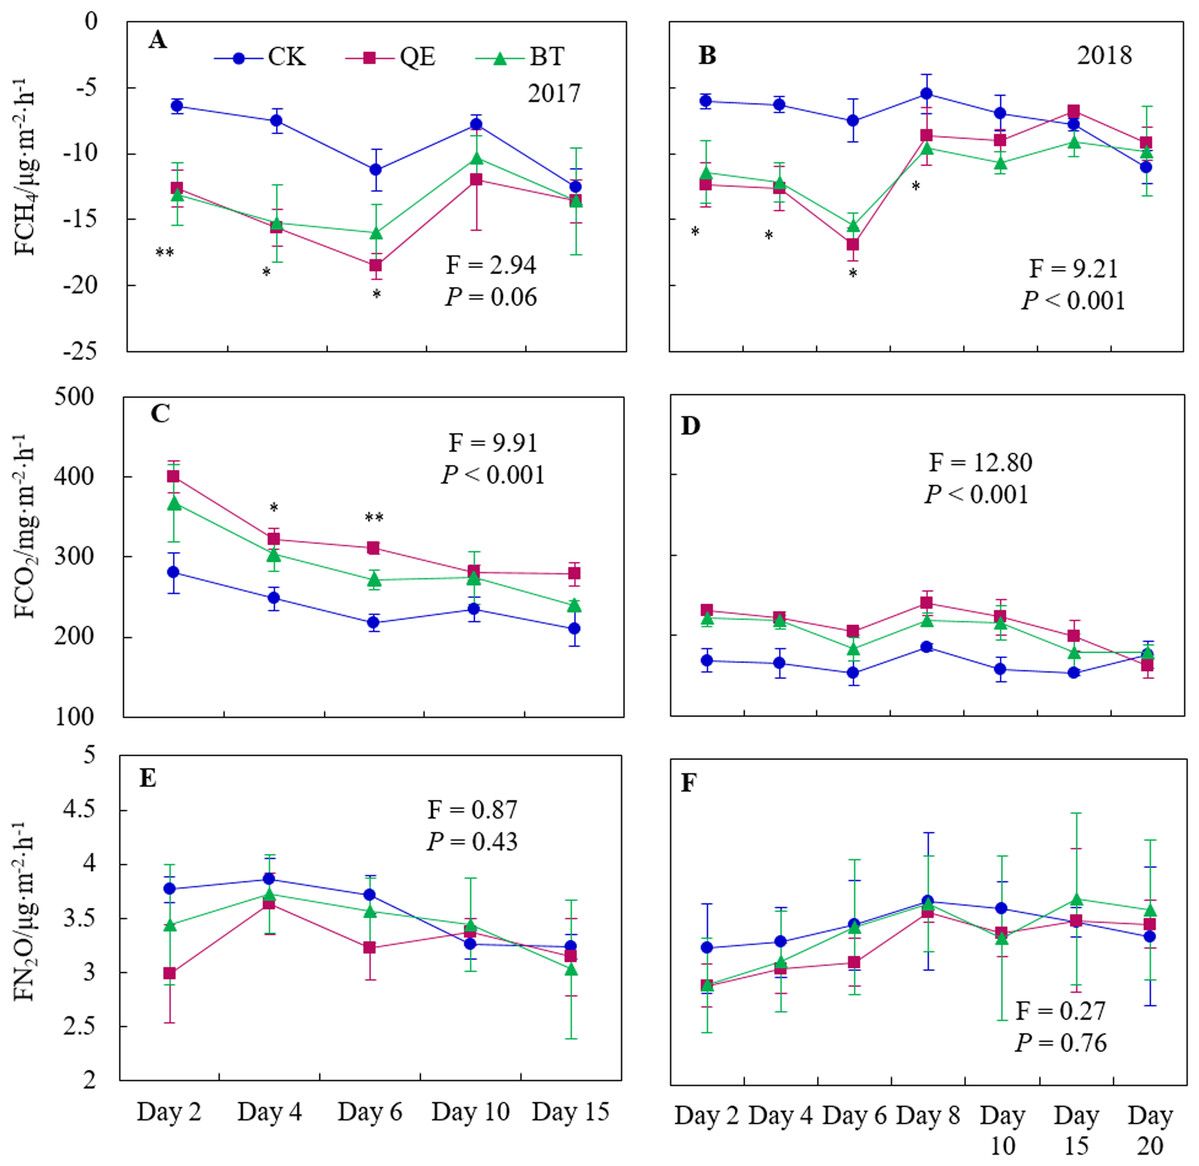
Figure 3: Daily dynamics of the CH4 fluxes (A and B), CO2 fluxes (C and D) and N2O fluxes (E and F) throughout the field trials in the two years (2017 and 2018) from soil planted with alfalfa.
*Significant at P < 0.05; **Significant at P < 0.01.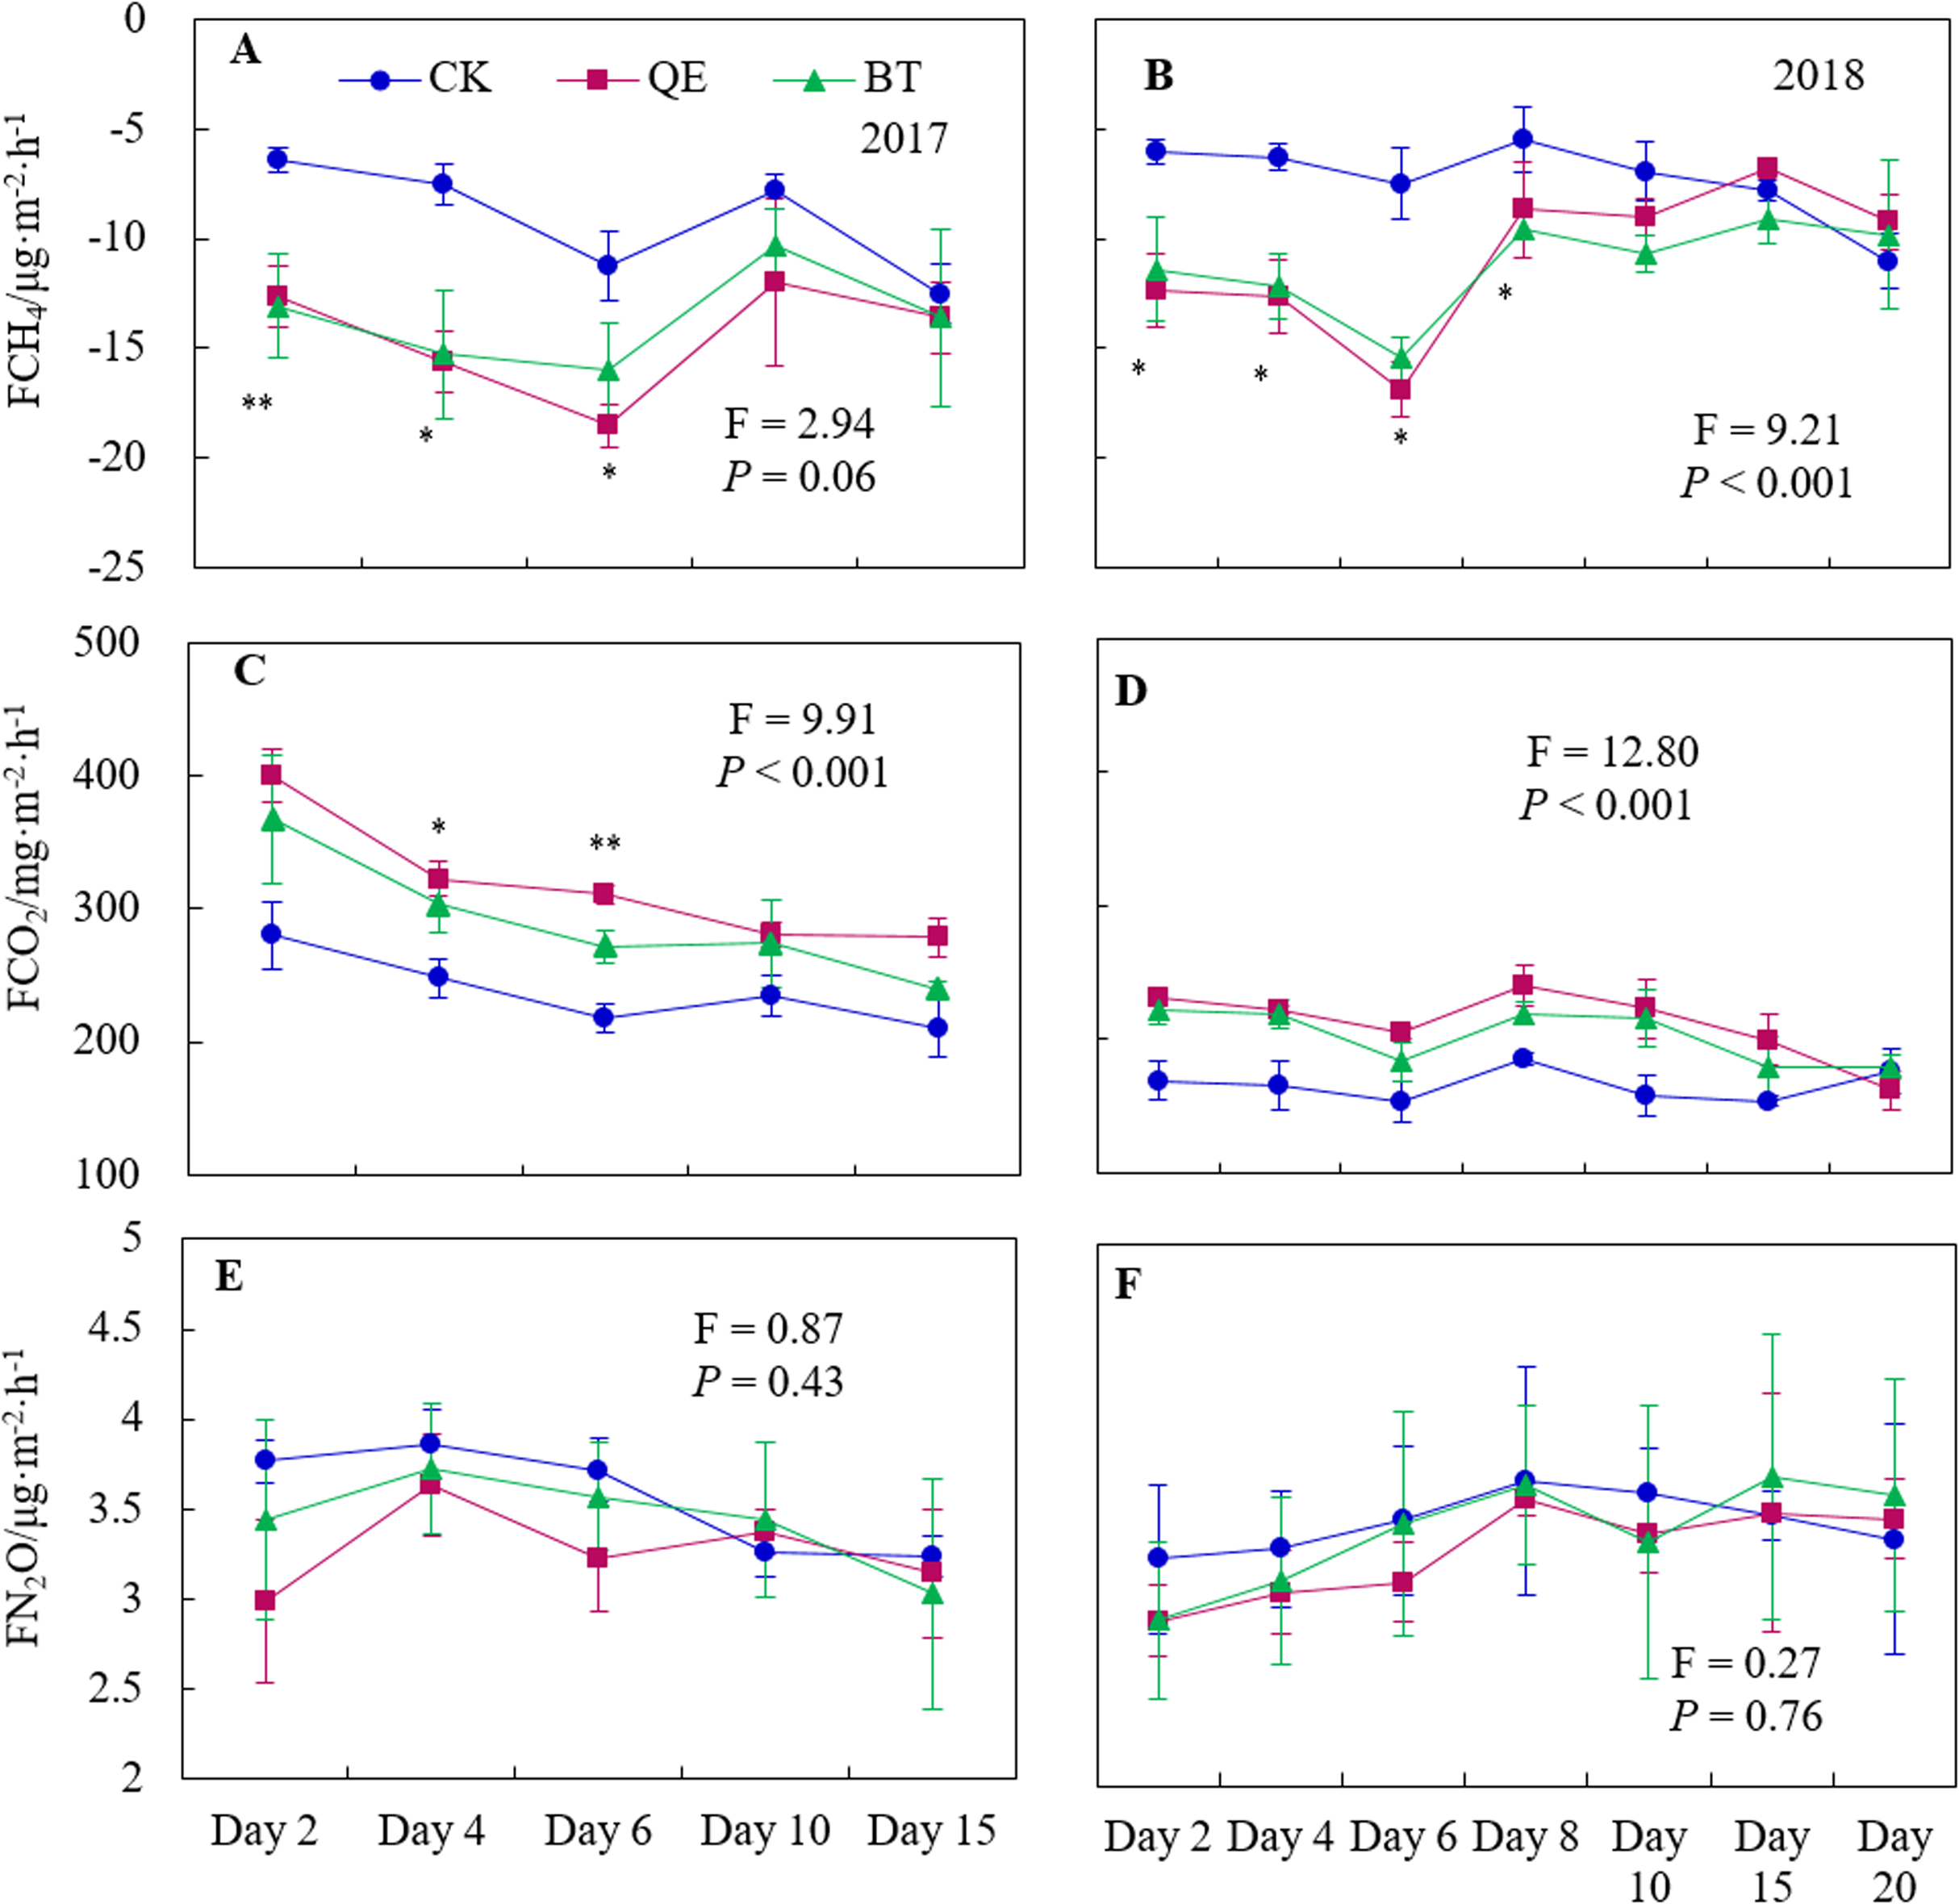
Significantly more CO2 emissions were recorded following the application of QE and BT than in the CK (Figs. 3C and 3D). CO2 emissions were significantly higher on days 4 and 6 in 2017 after the herbicide application than in the CK (P < 0.05). In 2018, the CO2 fluxes were significantly higher than those of the CK within 8 days after the herbicide applications (P < 0.05). The application of QE and BT had no significant influence on CO2 emissions relative to the CK in the subsequent samples.
Herbicide applications did not change the dynamics of N2O emissions from the soil beneath the alfalfa (Figs. 3E and 3F). N2O fluxes were lower than those of the CK in the first 6 days after herbicide application in 2017 but the difference was not significant (P > 0.05). The N2O emissions from 2018 were lower for the first 4 days after the herbicide treatments than those in the CK, but this difference was not significant. There were no significant differences in N2O fluxes between treatments (P > 0.05) for the remaining sampling time.
GHG cumulative emissions during the sampling times and the integrated evaluation of GHG emissions
There was no significant difference in the cumulative uptake of CH4 between years in all three treatments (P > 0.05) (Table 3). In 2017, the cumulative CH4 uptake following the application of QE and BT increased by 59.63% (P = 0.002) and 50.46% (P = 0.003), respectively, compared with those in the CK and were ordered as: QE > BT > CK. In 2018, the cumulative CH4 uptake increased by 47.97% (P = 0.002) and 52.85% (P = 0.007) following the application of QE and BT, respectively, compared to the CK, and were ordered as: CK > QE > BT.
| Year | Treatments | CH4 (g·ha−1) | CO2 (kg·ha−1) | N2O (g·ha-1) | Total GWP | ||||
|---|---|---|---|---|---|---|---|---|---|
| 2017 | CK | −10.94 ± 0.52Aa | 285.71 ±11.96Ac | 4.28 ± 0.04Ba | 286.71 ± 11.96Ac | ||||
| QE | −17.36 ± 0.76Ab | 382.25 ± 4.29Aa | 3.93 ± 0.16Ba | 382.99 ± 4.31Aa | |||||
| BT | −16.37 ± 0.92Ab | 349.38 ± 4.10Ab | 4.13 ± 0.13Ba | 350.20 ± 4.08Ab | |||||
| F | 21.165 | 40.521 | 2.100 | 40.312 | |||||
| P | <0.01 | <0.001 | 0.204 | <0.001 | |||||
| 2018 | CK | −12.27 ± 0.57Aa | 285.55 ± 5.81Ab | 5.81 ± 0.15Aa | 286.97 ± 5.87Ab | ||||
| QE | −18.17 ± 0.59Ab | 355.77 ± 2.40Ba | 5.54 ± 0.06Aa | 356.97 ± 2.41Ba | |||||
| BT | −18.79 ± 1.13Ab | 340.57 ± 5.83Aa | 5.73 ± 0.31Aa | 341.81 ± 5.88Aa | |||||
| F | 20.058 | 55.705 | 0.449 | 54.420 | |||||
| P | <0.01 | <0.001 | 0.658 | <0.001 | |||||
| Variable | CH4 | CO2 | N2O | GWP | |||||
| F | P | F | P | F | P | F | P | ||
| Y | 13.099 | <0.01 | 160.459 | <0.001 | 0.368 | 0.546 | 4.608 | 0.053 | |
| T | 18.303 | <0.001 | 33.574 | <0.001 | 0.649 | 0.526 | 86.830 | <0.001 | |
| S | 5.562 | <0.001 | 8.363 | <0.001 | 0.465 | 0.832 | – | – | |
| Y × T | 0.187 | 0.830 | 1.649 | 0.199 | 0.022 | 0.978 | 2.126 | 0.162 | |
| Y × S | 0.800 | 0.529 | 8.782 | <0.001 | 1.224 | 0.308 | – | – | |
| T × S | 1.938 | <0.05 | 0.986 | 0.471 | 0.169 | 0.999 | – | – | |
| Y × T × S | 0.272 | 0.973 | 0.332 | 0.951 | 0.055 | 1.000 | – | – | |
Note:
Y, year; T, treatment; S, sampling time; Y × T, interaction between year and treatment; Y × S, interaction between year and sampling time; T × S, interaction between year and sampling time; Y × T × S, interaction between year, treatment and sampling time. Different lowercase letters represent significant differences between the treatments at P < 0.05 in the same year, and different capital letters represent significant differences between the years at P < 0.05 in the same treatment. GWP, global warming potential.
Aggregate CO2 emissions from both years were: QE > BT > CK (Table 3). The cumulative CO2 emissions following treatment with QE in 2017 were significantly higher than those in 2018 (P = 0.006). In 2017, the cumulative CO2 emissions following the application of QE and BT were significantly higher than those of the CK (34.15% (P = 0.002) and 22.27% (P = 0.007), respectively). In 2018, cumulative CO2 emissions in the plots treated with QE and BT were 24.59% (P = 0.000) and 19.27% (P = 0.003) above those of the CK, respectively.
The cumulative N2O fluxes were: CK > BT > QE in 2017 and 2018 (Table 3). In 2017, the cumulative N2O emissions following the application of QE and BT were below those of the CK (8.73% (P = 0.106) and 3.68% (P = 0.313), respectively). In 2018, the cumulative N2O emissions following the application of QE and BT were below those of the CK (4. 63% (P = 0.169) and 1.50% (P = 0.818), respectively).
The global warming potential (GWP), expressed as the 100-year total CO2 equivalent, was used to comprehensively evaluate the GHG emissions from different herbicide treatments. The application of QE and BT significantly increased GWP by 25.14% (P = 0.002) and 22.15% (P = 0.007) compared with the CK in 2017, respectively. In 2018, the application of QE and BT resulted in a significant increase of 24.39% (P = 0.000) and 19.11% (P = 0.003), respectively, relative to the CK. A significant difference in the GWP was recorded following the application of QE in 2017 and 2018 (Table 3).
The year, treatment and sampling time had significant effects on CH4 and CO2 fluxes (Table 3). The interaction between year and treatment had a significant effect on the CO2 fluxes, as did the interaction between treatment and sampling time.
Structural equation model
A SEM was used to analyze direct and indirect relationships among multiple variables. The direct effects of herbicide applications on the aboveground biomass of weeds and CH4 fluxes were highly significant (Fig. 4) (P < 0.01). The aboveground biomass of the alfalfa and weeds had direct positive effects on the soil moisture (P < 0.05). The soil moisture had an extremely significant and direct effect on the soil temperature and CO2 fluxes (P < 0.001). There was an extremely significant and direct positive effect on the CH4 fluxes through N2O fluxes (P < 0.05), and CH4 fluxes had a significant and direct negative effect on CO2 fluxes. The SEM results show that herbicides may affect CH4 uptake from alfalfa pasture and affect the greenhouse soil gas emissions by indirectly affecting the aboveground biomass of vegetation and environmental factors, such as soil moisture and soil temperature.
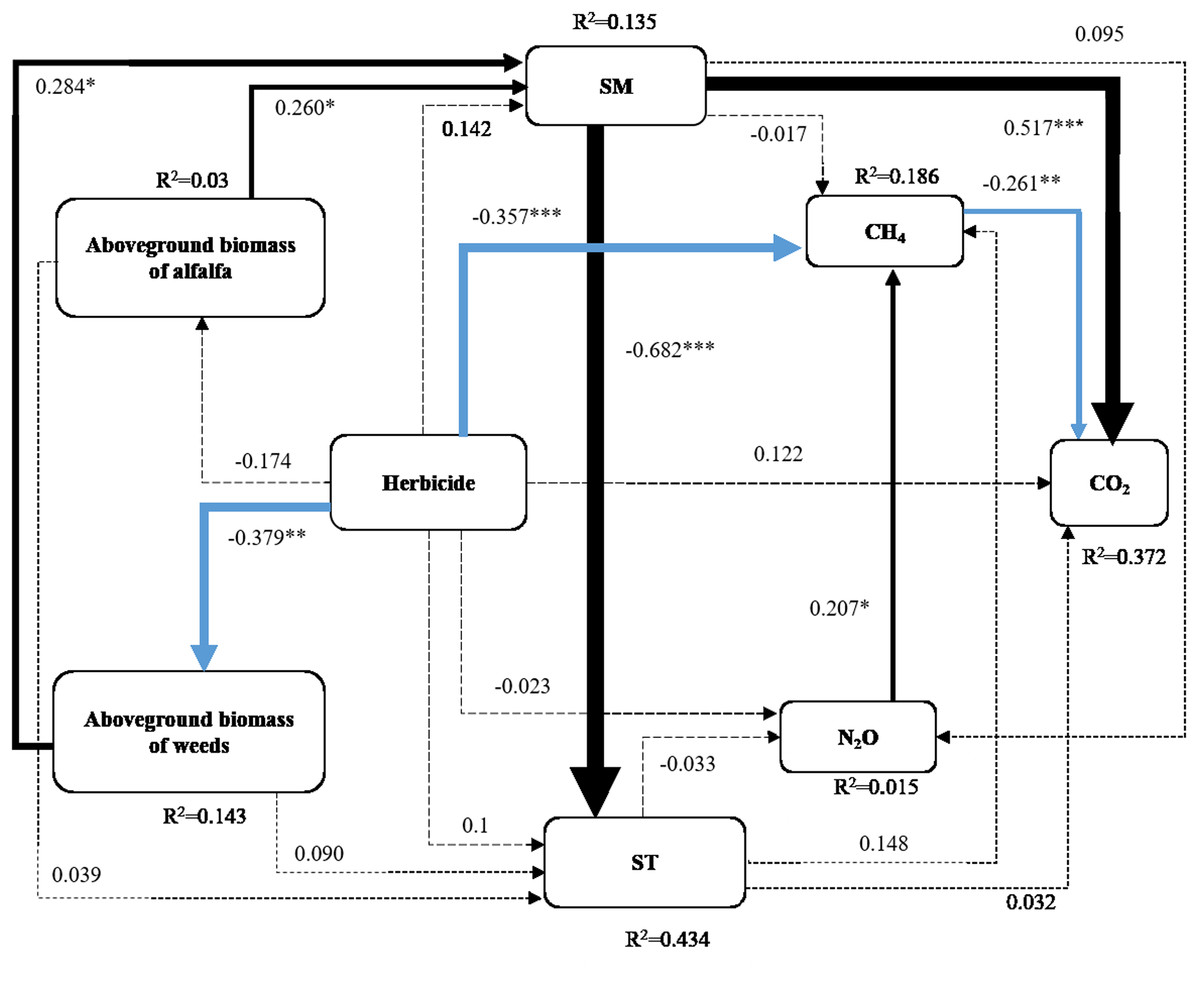
Figure 4: Structural equation model based on the data in this study.
Structural equation modeling shows the effects of herbicide treatments on soil moisture (SM), soil temperature (ST), CH4 fluxes, CO2 fluxes and N2O fluxes. Solid and dotted lines represent the direct and indirect effects, respectively. The arrows reflect the causal relationships, and the thickness of the black (positive) and blue (negative) paths is proportional to the range-standardized path coefficients with significance levels indicated as ***P < 0.001; **P < 0.01, and *P < 0.05. Insignificant paths are indicated by dashed arrows (P > 0.05). The model shows a fitted result (χ2 = 4.959, df = 8,P = 0.762).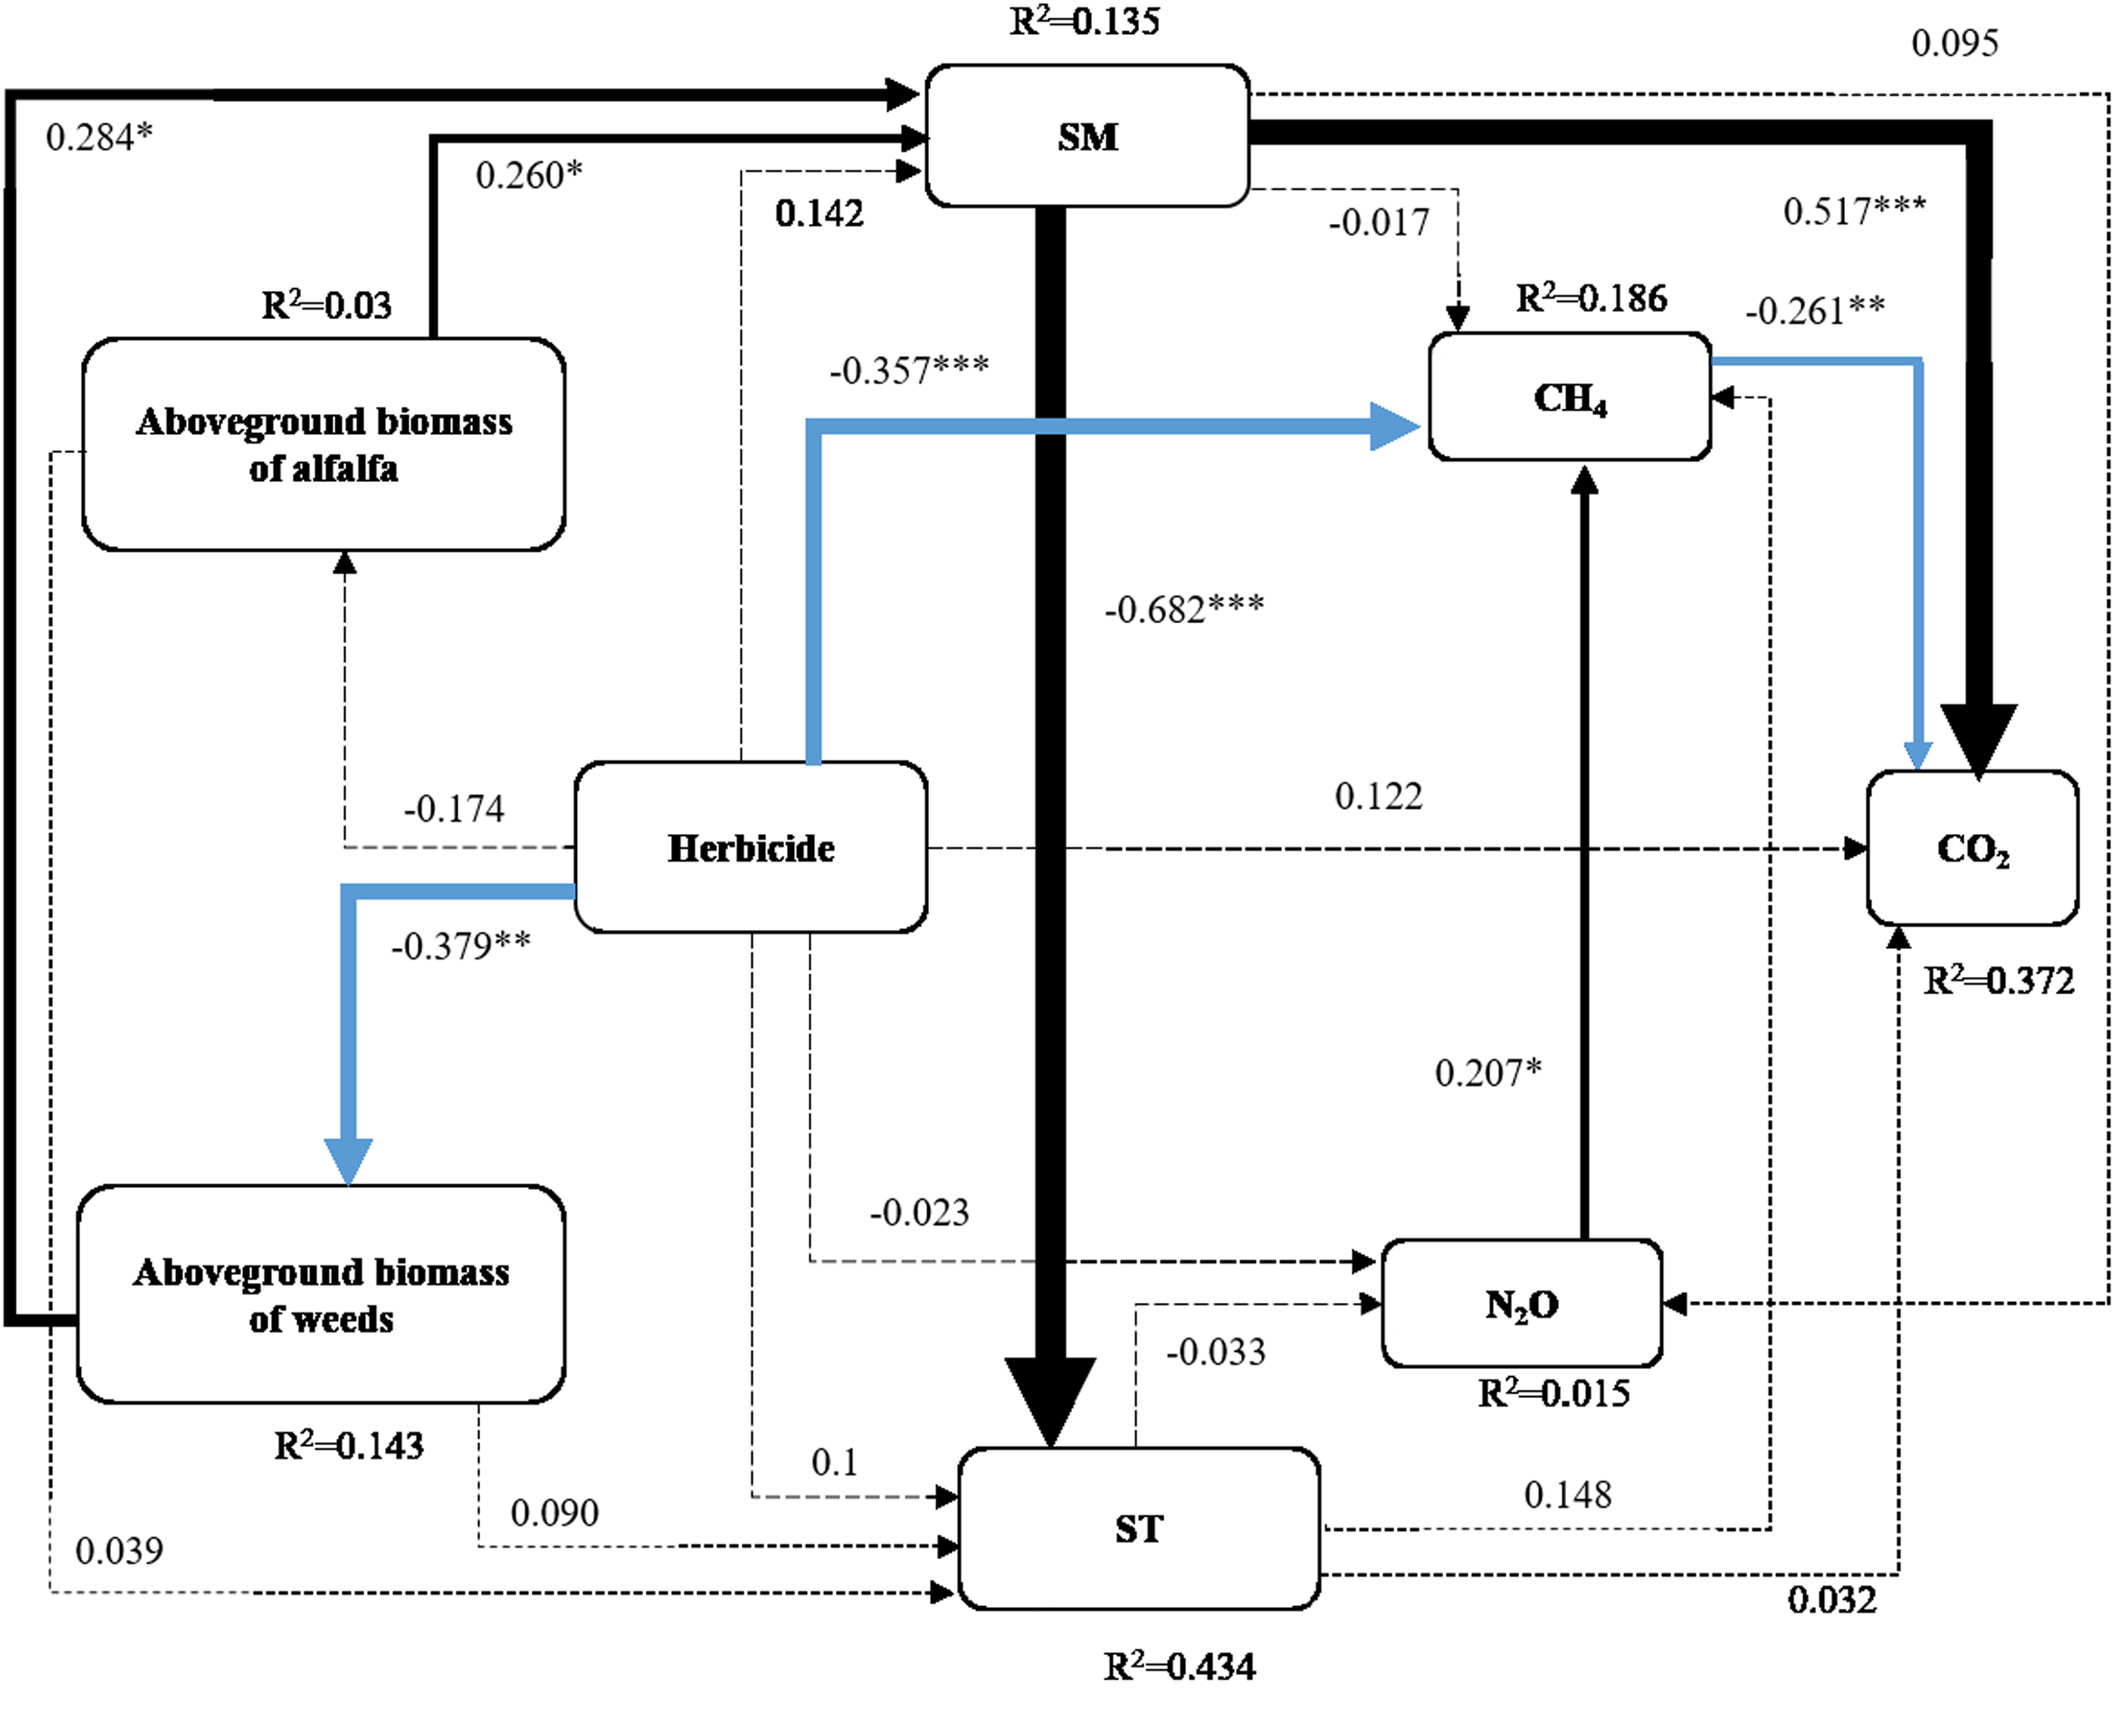
Discussion
Effect of herbicides on methane fluxes in the soil of alfalfa pastures
Our field study demonstrated that CH4 uptake was enhanced following the application of QE and BT (Figs. 3A and 3B), which is similar to the increase in CH4 uptake as a result of the application of Prosulfuron observed by Kinney et al. (2004b). Soil treated by herbicides maintained a relatively higher oxidation-reduction potential than those of the CK, which resulted in smaller CH4 fluxes following the application of QE and BT and increased CH4 uptake by pasture soil. Mohanty et al. (2001) demonstrated that oxidation–reduction potential is negatively correlated with the CH4 fluxes. Therefore, increased CH4 uptake after the application of herbicides is due to the advance of the soil oxidation–reduction process (Das, Ghosh & Adhya, 2011).
Soil temperature affects CH4 emissions primarily by affecting the soil microbial activity and gas diffusion rates (Bates et al., 2009). CH4 fluxes were indirectly affected by the application of herbicides (Fig. 4). CH4 uptake may increase with higher soil temperatures in arid areas due to the limited ability of soil microorganisms to oxidize CH4 (Fang et al., 2009). However, when one or more environmental factors limit the formation of CH4 this effect is not manifested (Chen et al., 2011). Our research found that soil moisture had significant and direct effects on CH4 fluxes and soil moisture was significantly and directly affected by the aboveground biomass of alfalfa and weeds (Fig. 4). The application of herbicides reduced the aboveground biomass of weeds (Fig. 2H), leading to more exposed surface area, an increase in soil moisture evapotranspiration, and a decrease in soil moisture (Jia et al., 2007). The activity of CH4 oxidizing bacteria was inhibited and the uptake of CH4 was increased (Jiao et al., 2014). CH4 fluxes were significantly and directly affected by N2O fluxes (Fig. 4). N2O is generated by denitrification and nitrification and the anaerobic conditions of denitrification aid the activity of CH4 oxidizing bacteria, thereby resulting in the increases of the CH4 fluxes (Dang et al., 2015).
Effect of herbicides on carbon dioxide fluxes in the soil of alfalfa pastures
The application of QE and BT significantly increased CO2 emissions (Figs. 3C and 3D). This effect may be related to the selective herbicide use in pastures that causes the partial necrosis of pasture weeds, transforming them into litter (Fig. 2H). The carbon input from the pasture litter increased following herbicide treatments compared with that of the CK, which provided a carbon source for soil microbial activities, increasing in CO2 emissions (Figs. 3C and 3D) (Zheng et al., 2018). Alternatively, weed growth was inhibited by the use of herbicides (Fig. 2H) and the interspecific competition between the weeds and alfalfa was reduced, allowing water into the soil to be absorbed and utilized by the alfalfa, resulting in increased soil moisture following herbicide treatments compared with the CK (Figs. 1A and 1B), and promoting CO2 emissions from the soil (Fig. 4). These findings are consistent with those of Wang et al. (2013). The application of QE and BT can also activate urease activity, leading to the production of CO2 by catalyzing the decomposition of urea in the soil (Sannino & Gianfreda, 2001).
CO2 emissions from grassland ecosystems originated primarily from soil respiration, which includes respiration by plant roots and microorganisms and the CO2 produced by the microbial decomposition of organic matter (Yevdokimov et al., 2010). Soil moisture had a significant and direct effect on CO2 emission (Fig. 4). Soil CO2 emissions increased with the increase in soil moisture within a certain range and were the highest when soil moisture was close to field capacity (Yu & Fang, 2010). Respiration stagnated at both the saturation and permanent wilting points (Vargas et al., 2014). CO2 fluxes were significantly and directly affected by CH4 (Fig. 4). A previous study indicated that CH4 absorbed by the soil can provide a carbon source for CO2 emissions (Peng et al., 2015).
Effect of herbicides on global warming potential in the soil of alfalfa pastures
We demonstrated the potential importance of herbicide applications on the modulation of GWP relative to soils, climate, and other agricultural practices (Kinney et al., 2004a). The application of two herbicides significantly affected the fluxes of CH4 and CO2. However, the most important increase in total GWP was caused by an increase in the flux of CO2, which accounted for the majority of increased GWP (Table 3). Herbicide use could be responsible for some of the variation in soil gas fluxes (Kinney et al., 2004b). Temperature, precipitation and other agricultural practices over time may lead to inter-annual variations in GWP following QE (Shang et al., 2016).
The global use of agrochemicals was expected to rise 2.7 times over the next 50 years, owing to their irrefutable economic benefits in agricultural practices (Jiang et al., 2015). Different herbicides vary in their effects on greenhouse gas emissions due to differences in their mechanism of action and molecular structures. The actual effects of the combined application of herbicides on GHG fluxes of alfalfa pastures may differ from the results of this study. Therefore, the effects of widely used herbicides on GHG fluxes must be studied to determine the best combination of herbicides to ensure crop yields and reduce the greenhouse effect. Additional studies should evaluate the risks to soil environmental associated with herbicide contamination.
Conclusions
This field study demonstrates that the application of herbicides on alfalfa increases soil GHG emissions. The application of Quizalofop-p-ethyl and BT had significant effects on increasing soil CH4 uptake and soil CO2 emissions, but it did not affect N2O emissions. Our results showed that the effect of Quizalofop-p-ethyl was greater than that of BT on GHG emissions. Additional studies should focus on separate applications of the herbicides Quizalofop-p-ethyl and BT to determine the mechanisms that govern the observed increases in the CH4 uptake and CO2 emissions. Furthermore, our study suggests that herbicide use is vital when considering the effect of agricultural practices on GHG fluxes.