
A new 12-gene diagnostic biomarker signature of melanoma revealed by integrated microarray analysis
- DOI
- 10.7717/peerj.49
- Published
- Accepted
- Received
- Academic Editor
- Alfonso Valencia
- Subject Areas
- Bioinformatics, Cell Biology, Computational Biology, Genomics, Dermatology
- Keywords
- Gene biomarker, Microarray, Bioinformatics, Genome, Nevi, Skin, Melanocytes, Melanoma, Metastasis, Immunochemistry
- Copyright
- © 2013 Liu et al.
- Licence
- This is an open access article distributed under the terms of the Creative Commons Attribution License, which permits unrestricted use, distribution, and reproduction in any medium, provided the original author and source are credited.
- Cite this article
- 2013. A new 12-gene diagnostic biomarker signature of melanoma revealed by integrated microarray analysis. PeerJ 1:e49 https://doi.org/10.7717/peerj.49
Abstract
Genome-wide microarray technology has facilitated the systematic discovery of diagnostic biomarkers of cancers and other pathologies. However, meta-analyses of published arrays often uncover significant inconsistencies that hinder advances in clinical practice. Here we present an integrated microarray analysis framework, based on a genome-wide relative significance (GWRS) and genome-wide global significance (GWGS) model. When applied to five microarray datasets on melanoma published between 2000 and 2011, this method revealed a new signature of 200 genes. When these were linked to so-called ‘melanoma driver’ genes involved in MAPK, Ca2+, and WNT signaling pathways we were able to produce a new 12-gene diagnostic biomarker signature for melanoma (i.e., EGFR, FGFR2, FGFR3, IL8, PTPRF, TNC, CXCL13, COL11A1, CHP2, SHC4, PPP2R2C, and WNT4). We have begun to experimentally validate a subset of these genes involved in MAPK signaling at the protein level, including CXCL13, COL11A1, PTPRF and SHC4 and found these to be over-expressed in metastatic and primary melanoma cells in vitro and in situ compared to melanocytes cultured from healthy skin epidermis and normal healthy human skin. While SHC4 has been reported previously to be associated to melanoma, this is the first time CXCL13, COL11A1, and PTPRF have been associated with melanoma on experimental validation. Our computational evaluation indicates that this 12-gene biomarker signature achieves excellent diagnostic power in distinguishing metastatic melanoma from normal skin and benign nevus. Further experimental validation of the role of these 12 genes in a new signaling network may provide new insights into the underlying biological mechanisms driving the progression of melanoma.
Introduction
Melanoma is a cancer involving the transformation and uncontrolled growth of melanocytes (Miller & Mihm, 2006) and can originate in skin, mucosa, uvea, and leptomeninges (Eigentler & Garbe, 2006). Since the mid-1960s the reported incidence of melanoma has increased every year by up to 8% (Lens, 2008). Malignant melanoma metastasizes quickly and only 14% of patients with metastatic disease can expect to live for 5 years (Miller & Mihm, 2006). While some new therapies are coming on stream (e.g., ipilimumab) (Postow et al., 2012), the cure rate largely depends on early detection and tumor removal by surgery. Metastatic potential is mainly related to tumor thickness (Rigel & Carucci, 2000), and a greater than 90% cure rate is possible if the tumor is less than 1 mm thick when removed (Gremel et al., 2009).
A robust genetic marker signature should greatly advance both the diagnosis and targeted treatment of melanoma in clinical practice. To that end, microarray technology has been used as an advanced high-throughput strategy for the discovery of diagnostic gene signatures of human diseases at the genome-wide scale. The genome-wide discovery of such a signature would provide important insights into the underlying biological mechanisms driving melanomagenesis. A significant amount of microarray data has been produced and deposited in publically-available data repositories recently, including Gene Expression Omnibus (GEO) (Barrett et al., 2011) and ArrayExpress Archive (Parkinson et al., 2011). These repositories allow scientists to advance the discovery of diagnostic and prognostic gene signatures by means of data integration and bioinformatics analysis. Lukk et al. (2010) constructed a global map of human gene expression by integrating microarray data from 5,372 human samples representing 369 different cell and tissue types, disease states and cell lines. While microarray technology has also been applied to comparative analyses of different stages in melanoma development and have identified various gene signatures (Hoek, 2007), there is poor congruence between gene signatures generated by different microarray-based melanoma studies (John et al., 2008; Bittner et al., 2000; Tímár, Gyorffy & Rásó, 2010). Unsurprisingly therefore, microarray-based melanoma gene biomarkers have had poor translation to clinical practise, and melanoma diagnosis is still based on clinical and histopathological features of the tumor (Schramm et al., 2011).
Meta-analysis approaches have been used to seek out and reveal often latent data complexity and connectivity, and so have the potential to increase the robustness of data interpretation (Ramasamy et al., 2008; Hong & Breitling, 2008; Cochran & Conn, 2008). Choi and co-workers (Choi et al., 2003) have demonstrated that meta-analysis can positively influence statistical significance by amending the false negative rate of individual studies. Using this approach, Rhodes and colleagues successfully identified 50 over-expressed and 103 under-expressed genes in an enhanced signature of prostate cancer (Rhodes et al., 2002). Similarly, Parmigiani and co-workers built a cross-study comparison for lung cancer (Parmigiani et al., 2004), while Park and Stegall revealed the true involvement of cytokine genes of human kidney disease by combining their own microarray data with other public sources (Park & Stegall, 2007).
Two very recent reviews and meta-analyses of melanoma microarray studies (Tímár, Gyorffy & Rásó, 2010; Schramm et al., 2011) revealed some strikingly contradictory results. Tímár et al. compared signatures derived from four microarray datasets of human melanoma tissue, but found very little overlap between the signatures, both within and between these studies (Tímár, Gyorffy & Rásó, 2010). They attributed much of this lack of congruence to sample heterogeneity. By adding 5 additional studies, Schramm and colleagues however demonstrated some significant over-represented functions among the melanoma gene signatures (Schramm et al., 2011); especially those related to the immune response. A ‘leave-one-out’ cross validation with a low average error rate (28%) across all validation expression data was achieved for the gene signature of Mann, Pupo & Campain (2013).
To identify a more robust gene biomarker signature for melanoma we propose a new model that measures the genome-wide relative significance (GWRS) and genome-wide global significance (GWGS) of gene expression. This new model enables the integrative analysis of microarray datasets produced by different platforms and protocols. We examined microarray-based melanoma studies published between 2000 and 2011 and retrieved five microarray datasets that study differential gene expression between normal skin and/or benign nevi and metastatic melanoma (Hoek et al., 2004; Smith, Hoek & Becker, 2005; Riker et al., 2008; Scatolini et al., 2010; Rose et al., 2011). The integrated analysis of these five microarray datasets identified a robust biomarker signature of 12 genes for melanoma, which includes six previously-unreported genes. Our integrated investigation combines a computational approach with experimental validation.
Methods
Microarray datasets
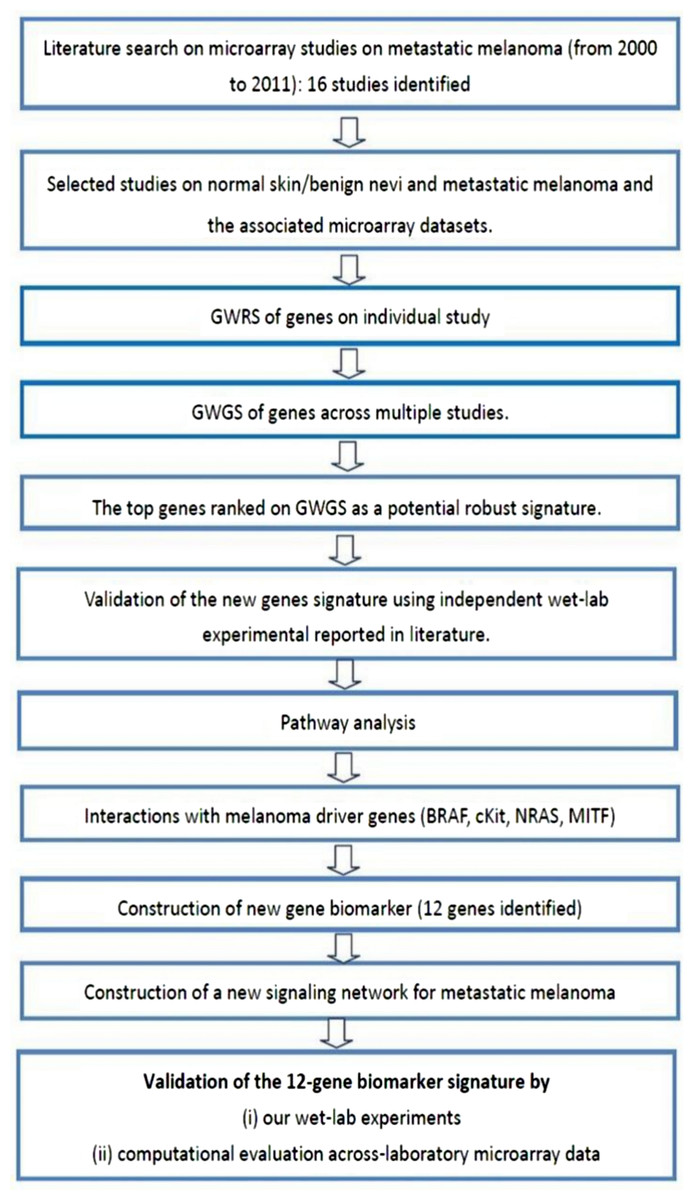
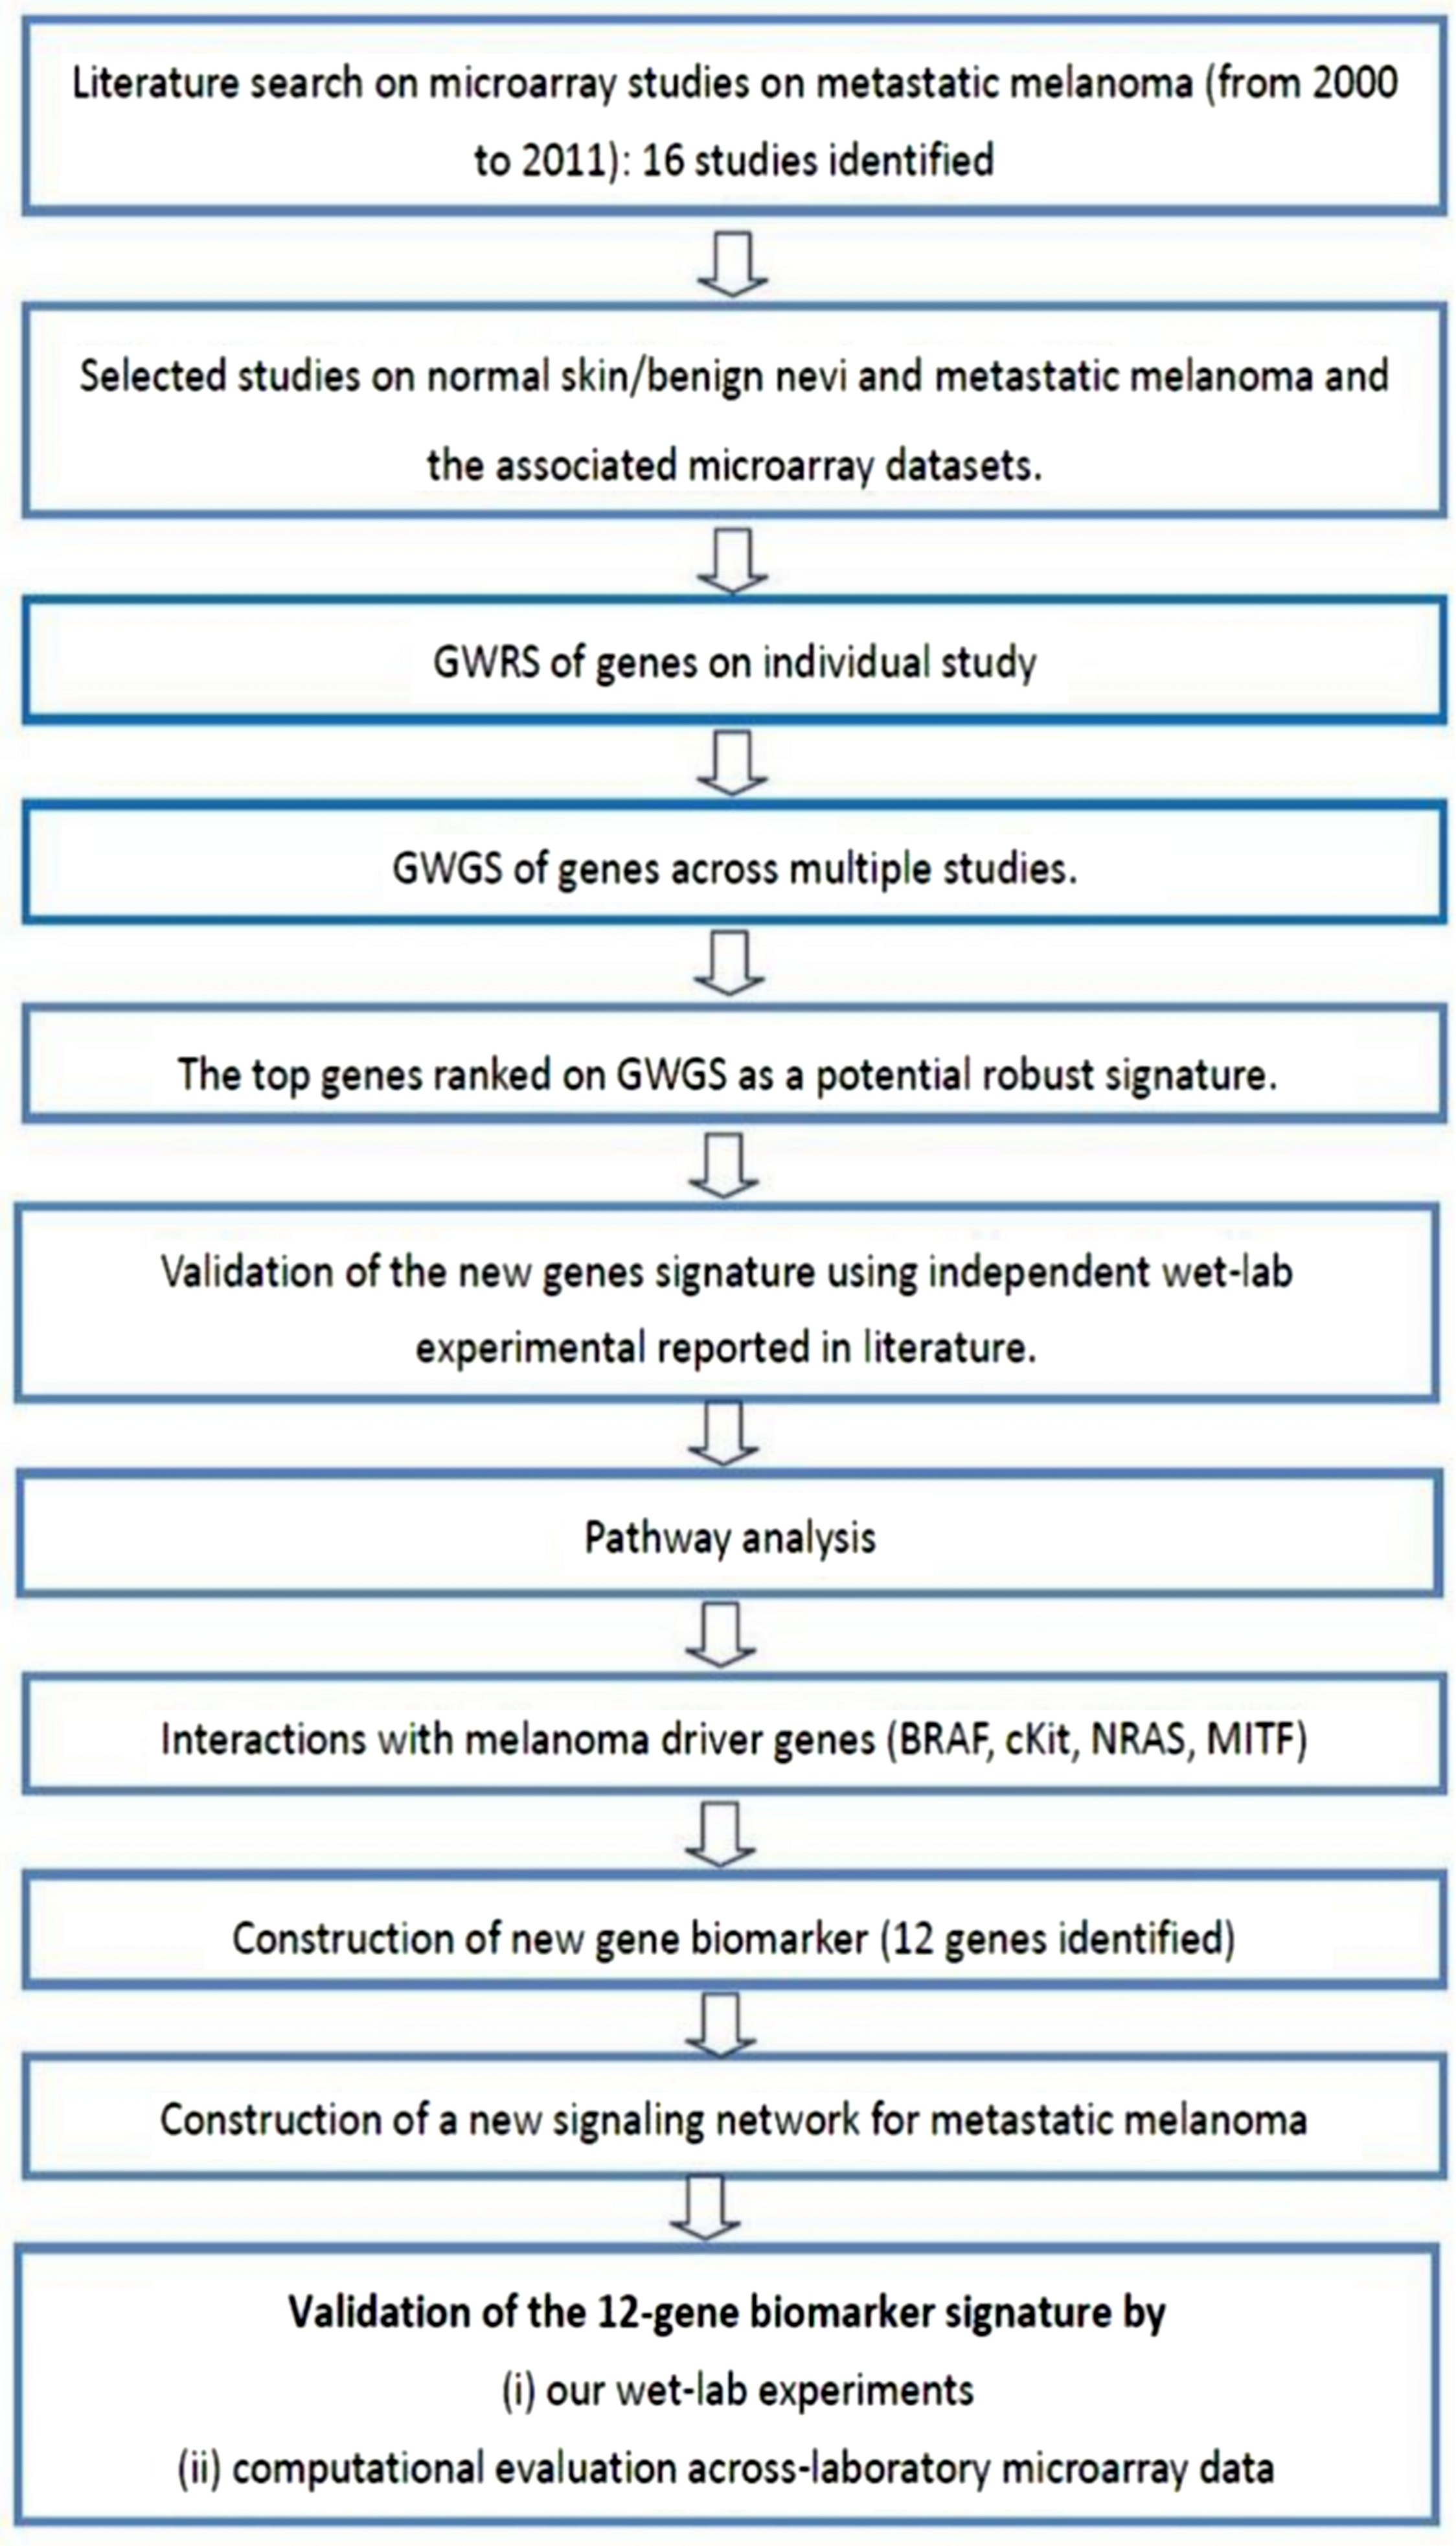
This study examines the differential expression of genes between normal skin and/or benign nevi, and metastatic melanoma using a meta-analysis approach. The experimental protocol of this study is shown in Fig. 5 and commenced with the identification of 16 microarray studies on metastatic melanoma published 2000 to 2011. Microarray data included in these studies are shown in Table S5. In the current study, we focused our attention on the differential gene expression between normal skin and/or benign nevi and metastatic melanoma. On this basis four microarray datasets were extracted (GEO access number: GSE7553, GSE4587, GSE4579, and GSE12391). An additional GSE22301 dataset was extracted from Rose et al. (2011), but while this study did not provide a gene signature of metastatic melanoma (and so was not included in the meta-analysis of 16 studies) it did include 14 samples of metastatic melanoma data and so was included in our integrative analysis. Thus, a total of five microarray datasets of normal and/or benign nevi and metastatic melanoma were used in this study (Table S6).
Genome-wide relative significance (GWRS) and Genome-wide global significance (GWGS) for integrated analysis of cross-laboratory microarray data
A relatively simple method of integrative meta-analysis was proposed by Rhodes et al. in 2002 that combines independent microarray studies based on the p-value of each individual gene: where pi, i = 1–n, is the p-value of a gene in the i-th independent study. However, this method has at least two significant limitations: (1) many microarray studies are based on a small number of samples, for which the p-value can therefore be problematic and (2) the large variation in p-values across different studies leads to the data with smallest p-value determining the outcome of Sp.
We propose a new approach based on measuring the genome-wide relative significance (GWRS) and genome-wide global significance (GWGS) of expressed genes. We measure the GWRS of a gene using its ranking position (Jurman et al., 2008) on a genome-wide scale (r value) based on a differential expression measure, which can be the fold change, t-test p-value, SAM (Significance Analysis of Microarray data) p-value etc. Most existing meta analysis methods focus on the top-k genes (e.g. Jurman et al., 2008), while our method counts the ranking of genome-wide genes in total. Compared to the model of Rhodes and co-workers the proposed approach possess two important enhancements: (1) it can apply multiple different methods for measuring the degree of differential expression of a gene (e.g. fold change, t-test, Anova or SAM p-values) and (2) it uses a ranking r value instead of the test statistic (i.e., fold change, or p-value) to avoid the influence of high variation test statistics.
Data preparation
Pre-processing of microarray data is performed by extracting the expression value for each individual gene from the associated probe-sets. When a probe-set is mapped to multiple genes, e.g. ‘209994_s_at’ associated to two genes ‘ABCB1 / ABCB4’ in GSE4570, both genes are given the expression of the ‘209994_s_at’ probe-set.
For a gene appearing in multiple probe-sets, the most significant differential expressed probe-sets are assigned to this gene. We tested the results of using mean-, median-, and maxim-based methods to deal with the situations were multiple probe-sets are associated to a gene. We observed that the maxim-based method was able to retrieve the most significant probe-set of a gene, and would reflect our aim of extracting the most competitive genes across multiple studies. By contrast, use of a mean- or median-based probe-set value of a gene would drag the expression level down, and may introduce bias in follow-up analysis. As a result, a list of unique genes (G) from the datasets was retrieved. The number of datasets was denoted by n, while the number of unique genes across n datasets was denoted by m, i.e. m = |G|. The value ‘NA’ was applied in cases where a gene is absent from an individual study. We removed a gene from G where NA is bigger than δ (δ = 2 in this study), i.e. a gene was removed if it is absent for more than two of five datasets. This resulted in m = 24,097 and n = 5.
Measuring the GWRS of genes in each single microarray database
For each gene in the list of unique genes (G), we measured the degree of differential expression that can be measured by fold-change, t-test (p-value), SAM or other statistical test. However, fold-change is used in the current study, as our computational evaluation indicated that this produces more reliable results, probably due to the limited number of samples in some of the datasets. For each gene in G, we assigned a rank number (in descending order starting from 1 to m) according to their corresponding degree of differential expression i.e. a gene with a high degree of differential expression was ranked more highly and so with a smaller ranking number. An m∗n matrix (R) was thus created in which rij is the ranking number of the i-th gene in the j-th dataset. We measure the GWRS of the i-th gene in the j-th dataset by: where rij, i = 1–m, j = 1–n, is the rank number of the i-th gene in the j-th study. The range of GWRS value (sij) is between 0 and −2log(1/m). For a gene with ‘NA’ value the sij is set to be ‘NA’.
Measuring the GWGS of a gene across multiple microarray datasets
We estimated the GWGS () of a gene based on its corresponding GWRS across n datasets, by where ωj represents the relative weight of the j-th dataset, and . The value of weight (ωj) can be assigned based on the data quality of the j-th datasets (e.g. the level of data noise. The value of ωj can also be used to reflect the differential importance of biopsy versus cell line samples that biological scientists may wish to take into account. In this study, we treated all the dataset equally, thus the weight of each datasets was set equally to be 1/n for j = 1–n. We also selected only the top 200 genes from the full gene list for further analysis (i.e. selected genes with the greatest sr value) by empirical evaluation of the classification performance (accuracy ratio). This was determined using the ‘wrapper-feature selection’ after multiple rounds of gene addition (ranging from 20 genes up to 500 genes) in order to distinguish melanoma from normal skin/benign nevus. We observed that using more than 200 genes yielded no improvement in classification ratio values, and so we consider 200 genes as an optimal gene set with the smallest number of genes that still can achieve a similar level of classification performance.
Pathway analysis
We performed a pathway analysis to assess functional relevance of the new 200 gene signature based on the DAVID database (Hosack et al., 2003). DAVID provides a useful tool to analyze large gene lists, including via gene ontology and pathway analysis. We applied our top 200 genes to this database in order to detect potentially over-represented KEGG pathways. Before inputting into the DAVID database, we extracted the corresponding probe-sets of the 200 genes for the corresponding microarray platforms of each dataset. In comparison with the gene signature in the original 16 studies, we also extracted their associated probe-sets. We retrieved 31 pathways from the KEGG database where 12 genes (i.e., EGFR, FGFR2, FGFR3, IL8, PTPRF, TNC, CXCL13, COL11A1, CHP2, SHC4, PPP2R2C, and WNT4) in this 200-gene signature were found to closely interact with the 4 melanoma driver genes (see Results section).
Immunocytochemistry (ICC)
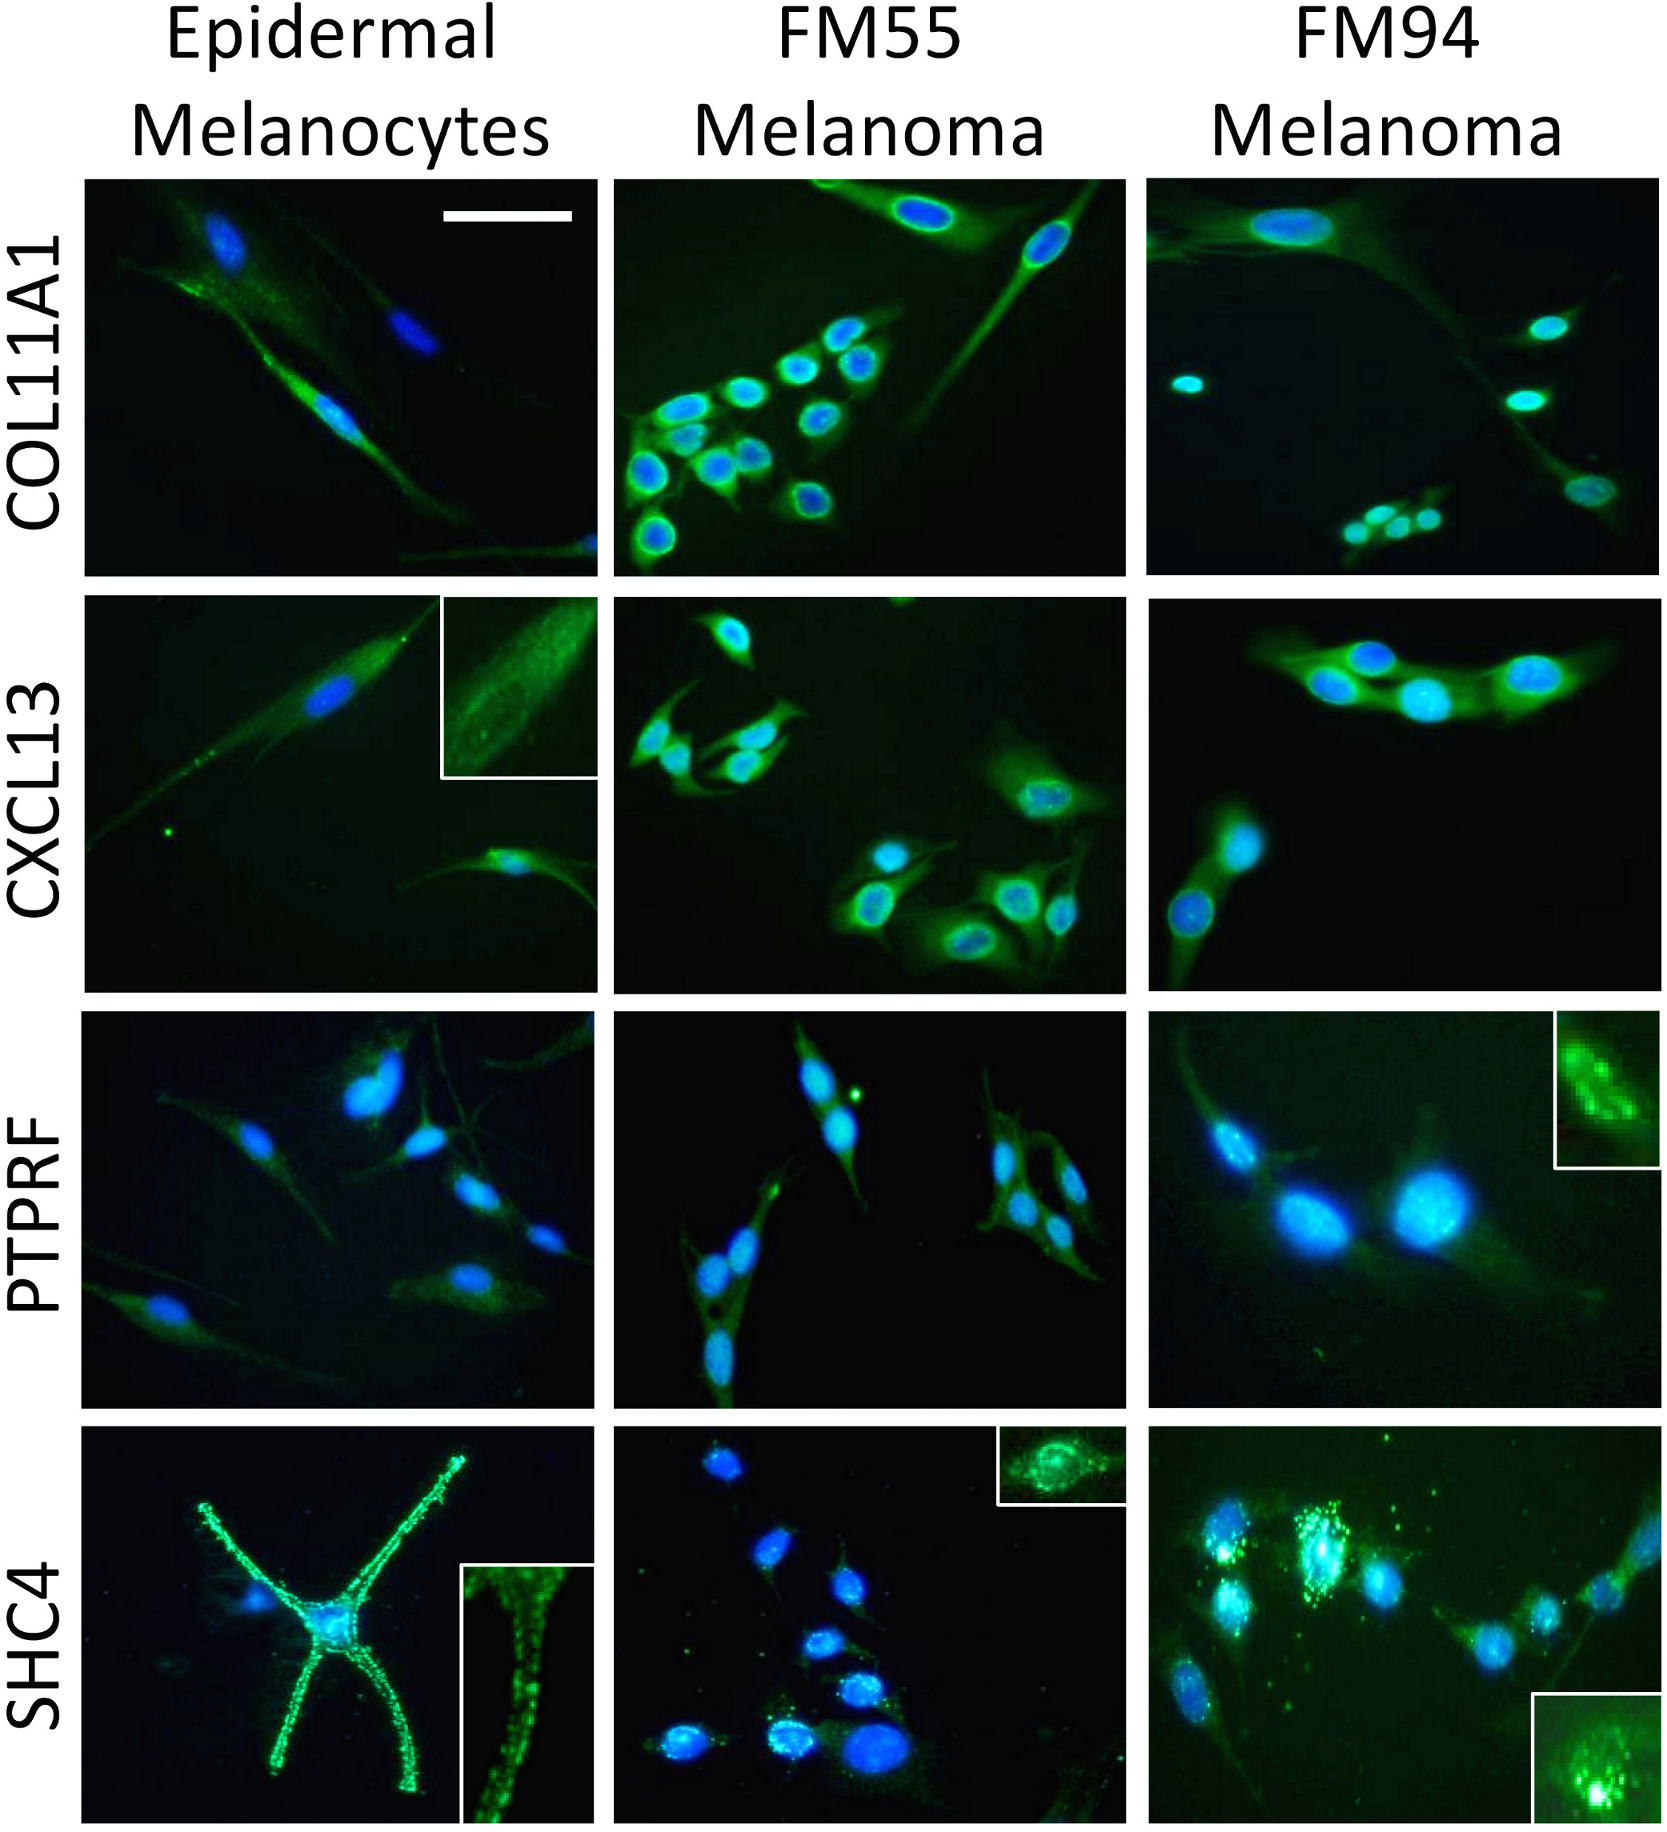
Primary epidermal melanocyte (EM) (female 44y), moderately pigmented human melanoma cells (FM55), and highly pigmented human melanoma cells (FM94) (melanoma cells were a gift of Dr Janis Ancans, University of Latvia) were cultured as previously described (Gledhill et al., 2010). The cells were fixed in ice-cold methanol (Sigma, Poole, Dorset, UK) for 10 min before air drying and rehydration in PBS. The cells were blocked with 10% donkey serum (DS) for 1 h, washed with PBS before incubation with respective primary antibodies to four test antigens from this 12-gene signature. These included: COL11A1 (Abcam, ab64883), CXCL13 (R & D Systems, AF801), PTPRF (NeuroMab, 75-193), SHC4 (Proteintech, 12641-1-AP), which were incubated overnight at 4 °C followed by secondary antibody (1:300) for 1 h (donkey anti-goat (Invitrogen, A11055), donkey anti-mouse (Invitrogen, A21202), donkey anti-rabbit (Invitrogen, A21206), Alexa green). The slides were cover-slipped by VECTASHIELD mounting medium with DAPI and photographed using a Nikon Eclipse 80i fluorescence microscope and imaged with a Nikon Digital Sight DS-U1 camera. A full assessment of all 12 proteins in our melanoma signature is beyond the scope of the current study, but will be assessed in detail in a follow-up studies.
Double immunohistochemistry (IHC)
Paraffin-embedded primary melanoma in situ (nose) and metastatic melanoma (lower leg) were deparaffinized and boiled in sodium citrate buffer (10 mM, 0.05% Tween 20, pH 6.0) for antigen retrieval. Acetone-fixed cryosections of normal human facial skin (Female 52 yrs) were used as control samples. All tissues were blocked with 10% donkey serum (DS) for 1 h, washed with PBS before 2 h incubation with NKi/beteb antibody raised against the melanocyte lineage-specific marker gp100 as a positive pigment cell control (Monosan; Mon7006-1) (1:15) followed by each of the 4 test antibodies at room temperature.
Data Access
The microarray data used in this study were retrieved from Gene Expression Omnibus (GEO) with the following access numbers: GSE4570, GSE4587, GSE7553, GSE12391, and GSE22301. The 16 signatures of melanoma reported in the literature between 2000 and 2011 were extracted from the associated publication and is presented in Table S2.
Results
Gene signatures of melanoma (2000 to 2011) share few common genes
A meta-analysis conducted on gene signatures of metastatic melanoma reported in 16 independent microarray-based studies (ranging from 5 to 589 genes/study) from 2000 to 2011, showed remarkably few shared genes (Table 1, and Supplementary Information Table S1).
| Alonso et al., 2007 (243) | Bogunovic et al., 2009 (209) | Haqq et al., 2005 (19) | Hoek et al., 2004 (589) | Jaeger et al., 2007 (308) | Jeffs et al., 2009 (96) | John et al., 2008 (21) | Kabbarah et al., 2010 (30) | Kashani-sabet et al., 2009 (5) | Koh et al., 2009 (14) | Mandruzzato et al., 2006 (71) | Okamoto et al., 2005 (20) | Riker et al., 2008(65) | Scatolini et al., 2010 (455) | Smith, Hoek & Becker, 2005 (94 of 100) | Winneperninckx et al., 2006 (235) | |
|---|---|---|---|---|---|---|---|---|---|---|---|---|---|---|---|---|
| Alonso et al., 2007 (243) | 2 | 1 | 12 | 4 | 2 | 0 | 1 | 1 | 0 | 0 | 0 | 1 | 5 | 1 | 7 | |
| Bogunovic et al., 2009 (209) | 1 | 9 | 3 | 2 | 0 | 2 | 0 | 0 | 6 | 0 | 2 | 1 | 0 | 6 | ||
| Haqq et al., 2005 (19) | 7 | 1 | 0 | 0 | 0 | 0 | 0 | 0 | 0 | 0 | 1 | 1 | 1 | |||
| Hoek et al., 2004 (589) | 34 | 19 | 0 | 7 | 1 | 2 | 5 | 2 | 8 | 17 | 6 | 4 | ||||
| Jaeger et al., 2007 (308) | 3 | 0 | 1 | 2 | 0 | 1 | 1 | 27 | 84 | 9 | 14 | |||||
| Jeffs et al., 2009 (96) | 0 | 0 | 0 | 0 | 2 | 2 | 0 | 0 | 2 | 1 | ||||||
| John et al., 2008 (21) | 0 | 0 | 0 | 0 | 0 | 0 | 0 | 0 | 1 | |||||||
| Kabbarah et al., 2010 (30) | 0 | 0 | 0 | 0 | 2 | 1 | 0 | 3 | ||||||||
| Kashani-sabet et al., 2009 (5) | 0 | 0 | 0 | 1 | 0 | 1 | 0 | |||||||||
| Koh et al., 2009 (14) | 0 | 0 | 0 | 0 | 1 | 0 | ||||||||||
| Mandruzzato et al., 2006 (71) | 0 | 0 | 3 | 0 | 3 | |||||||||||
| Okamoto et al., 2005 (20) | 0 | 0 | 0 | 0 | ||||||||||||
| Riker et al., 2008 (65) | 16 | 7 | 4 | |||||||||||||
| Scatolini et al., 2010 (455) | 4 | 14 | ||||||||||||||
| Smith, Hoek & Becker, 2005 (94 of 100) | 1 | |||||||||||||||
| Winneperninckx et al., 2006 (235) |
Notes:
There were 84 genes common to two of the signatures (Scatolini et al., 2010; Jaeger et al., 2007), while 14 common genes appeared in three studies (Scatolini et al., 2010; Jaeger et al., 2007; Riker et al., 2008). Strikingly, while there were only 2 genes (KRT15, RORA) in common in four of the 16 studies (Scatolini et al., 2010; Jaeger et al., 2007; Riker et al., 2008; Smith, Hoek & Becker, 2005), we have recognized four genes in our 200 gene set (i.e. KRT15, MAGEA6, RORA and SULF1) that appeared in 4 different studies of the 16. No gene was common in five or more independent studies (Table S2). This finding suggested that there may be some fundamental issues with either the manner in which these microarray studies were designed, or with the meta-analyses conducted. On this basis we set about designing a new more robust model for meta-analysis.
Integrated analysis of cross-laboratory microarray data reveal a new melanoma gene signature
We applied our new approach to integratively analyze five independent microarray studies (Hoek et al., 2004; Smith, Hoek & Becker, 2005; Riker et al., 2008; Scatolini et al., 2010; Rose et al., 2011) (see Methods). The genome wide ‘global significance’ or GWGS of a gene (i.e., across all five datasets) was measured by the GWGS (sr) as defined above (see Methods). A gene with a large sr value is considered to be significant across multiple independent studies (i.e., globally significant). The 200 genes with largest sr value were selected as the starting point for our new proposed gene signature of melanoma, as listed in Table 2 and Table S3. This set of 200 signature genes was empirically determined, based on the classification accuracy ratio after various rounds of gene additions (using the ‘wrapper feature selection’ approach) in order to distinguish melanoma from normal skin cells and/or benign nevus. As the classification accuracy ratio was improved very little by adding more than 200 genes, we applied this gene set as the smallest number of genes to retain the optimal classification accuracy performance.
| No. | Genes | No. | Genes | No. | Genes | No. | Genes |
|---|---|---|---|---|---|---|---|
| 1 | DCD | 51 | GAGE7 | 101 | DKFZP434B061 | 151 | AQP3 |
| 2 | MAGEA3 | 52 | DGAT2 | 102 | PPP1R14C | 152 | C1orf116 |
| 3 | MAGEA2 | 53 | FGFR3 | 103 | AKR1C3 | 153 | RGS4 |
| 4 | MAGEA2B | 54 | MICALCL | 104 | C19orf33 | 154 | GRHL3 |
| 5 | CSAG3 | 55 | KRT15 | 105 | FGFR2 | 155 | GPR115 |
| 6 | CSAG2 | 56 | CTAG2 | 106 | IGL@ | 156 | SERPINA3 |
| 7 | GAGE12F | 57 | ANK3 | 107 | SERPINB5 | 157 | LAD1 |
| 8 | GAGE12G | 58 | HMGA2 | 108 | CYP3A5 | 158 | FLI37464 |
| 9 | GAGE12I | 59 | MYOZ2 | 109 | LEP | 159 | HLA-DRB4 |
| 10 | GAGE2A | 60 | AADACL2 | 110 | CHST6 | 160 | TMEM79 |
| 11 | GAGE2B | 61 | SCGB2A2 | 111 | TF | 161 | ZNF750 |
| 12 | GAGE2C | 62 | ISG20 | 112 | MIA | 162 | IGHV4-31 |
| 13 | GAGE2E | 63 | DST | 113 | HLA-DQB1 | 163 | TP63 |
| 14 | GAGE4 | 64 | IL13RA2 | 114 | GPR87 | 164 | LOC124220 |
| 15 | CTAG1B | 65 | APOC2 | 115 | RHBDL2 | 165 | RASGRF1 |
| 16 | KRT77 | 66 | TNC | 116 | SGPP2 | 166 | KRT5 |
| 17 | THRSP | 67 | FMN2 | 117 | SCARA5 | 167 | LAMB4 |
| 18 | CTAG1A | 68 | SHC4 | 118 | SAA1 | 168 | SCML4 |
| 19 | GAGE5 | 69 | FSTL5 | 119 | RNASE2 | 169 | CYP4B1 |
| 20 | GAGE6 | 70 | PTPRF | 120 | SLAMF7 | 170 | HLA-DRB3 |
| 21 | MAGEA12 | 71 | KRTAP19-1 | 121 | SAA2 | 171 | NEBL |
| 22 | MAGEA6 | 72 | CXCL13 | 122 | PPP2R2C | 172 | IGSF9 |
| 23 | XAGE1A | 73 | GAGE1 | 123 | GBP5 | 173 | KLK11 |
| 24 | XAGE1B | 74 | EYA1 | 124 | AKR1C1 | 174 | CHP2 |
| 25 | XAGE1C | 75 | HLA-DRB2 | 125 | ENTHD1 | 175 | MAGEA10 |
| 26 | XAGE1D | 76 | LOC100133484 | 126 | EPHA3 | 176 | CYP26B1 |
| 27 | XAGE1E | 77 | LOC100133661 | 127 | KRT6B | 177 | EREG |
| 28 | PRAME | 78 | LOC100133811 | 128 | CCDC3 | 178 | DLX1 |
| 29 | C4orf7 | 79 | LOC730415 | 129 | BTBD16 | 179 | LOC285986 |
| 30 | GAGE12B | 80 | ZNF749 | 130 | ANKRD35 | 180 | TRIM7 |
| 31 | GAGE12C | 81 | KRT14 | 131 | HLA-DQA1 | 181 | GAD1 |
| 32 | GAGE12D | 82 | IGFL2 | 132 | C10orf116 | 182 | LOR |
| 33 | GAGE12E | 83 | SCEL | 133 | JUP | 183 | EXPH5 |
| 34 | GAGE12H | 84 | GAGE3 | 134 | IGFBP5 | 184 | TMEM154 |
| 35 | GAGE12J | 85 | GATA3 | 135 | KRT25 | 185 | LASS3 |
| 36 | GAGE2D | 86 | DSP | 136 | SULF1 | 186 | HLA-DRB5 |
| 37 | GAGE8 | 87 | WNT4 | 137 | TKTL1 | 187 | LOC100126583 |
| 38 | WFDC5 | 88 | TACSTD2 | 138 | IL1F7 | 188 | CYP4F8 |
| 39 | IL8 | 89 | CAPNS2 | 139 | C6orf218 | 189 | SDC1 |
| 40 | COL17A1 | 90 | MAL2 | 140 | HEY1 | 190 | SCGB1D2 |
| 41 | FOXQ1 | 91 | DGAT2L3 | 141 | MGST1 | 191 | RORA |
| 42 | ZIC1 | 92 | PIP | 142 | ABCA13 | 192 | SH3RF2 |
| 43 | ELMOD1 | 93 | AKR1C2 | 143 | RAPGEFL1 | 193 | LGALS7 |
| 44 | ELOVL3 | 94 | IGF2 | 144 | TFPI2 | 194 | MMP1 |
| 45 | SERPINA12 | 95 | MPP7 | 145 | TRIM29 | 195 | MAGEC1 |
| 46 | DSC3 | 96 | IGHG1 | 146 | ALDH1A3 | 196 | FRMD5 |
| 47 | MAGEA1 | 97 | NMU | 147 | ATP6V1C2 | 197 | SERPINB7 |
| 48 | DMKN | 98 | EGFR | 148 | COL11A1 | 198 | FGF13 |
| 49 | INS-IGF2 | 99 | APOC4 | 149 | RSPO1 | 199 | LOC645323 |
| 50 | C1orf172 | 100 | MGP | 150 | PLA1A | 200 | COL9A3 |
Validation of a new 200-gene signature based on experimental studies reported in the literature
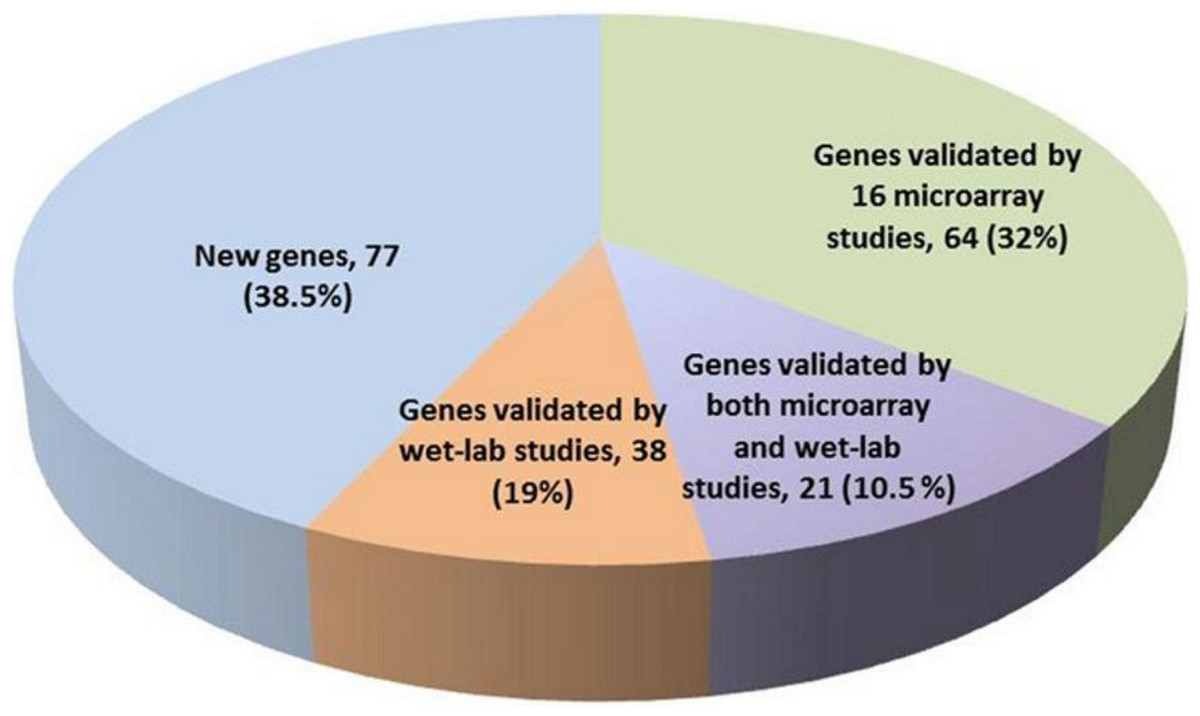
The 200 genes found to have genome-wide global significance in our study were compared with the gene signatures identified in previously-published reports (Table S5). Our new 200-gene signature was first validated by (i) comparing it with 16 signatures proposed in the referred to set of microarray studies (Table S1), (ii) checking if any experimental validation of these genes was published in the literature (PubMed, last access: 16 April 2012). This analysis revealed that (a) 85 genes in our 200-gene signature were reported in at least one of the 16 microarray studies, and (b) 21 genes of the 200-gene signature were reported in both microarray studies and wet-lab experimental studies (Table S4, labeled yellow background). We also found that 38 genes of this 200-gene signature were not reported in any of the 16 reference studies, but had in fact been previously validated in independent wet-lab studies (Table S4 and discussion section). Importantly, our new gene signature reported an additional subset of 77 genes that were not previously reported anywhere in the literature in association with melanoma (Fig. 1). The ranking positions of these 77 genes shows that 39% appear in the top 100 and 34% in bottom 50 (see Table S7). These genes may represent ‘novel genes’ as they were not previously identified in published microarray studies. We further investigated the characteristics of the 85 genes reported in at least 1 of the 16 reference microarray studies (Table S3). Forty-four were reported in ≥ 2 studies, while 17 genes have been reported in ≥ 3 of the 16 studies (Table S3). KRT15, MAGEA6, RORA and SULF1 were the most frequently reported genes appearing in 4 of the 16 studies. Thus, using our method, we are able to pick up 4 of the 7 most frequently reported genes in the 16 studies by using just our top 200 genes (i.e., 30% less than the next best list of 308 genes in Jaeger et al. (2007)). In this way the methodology to select the top 200 genes in our study is more powerful than previously reported on the component 16 published signatures used for the source data (Table 1).
Interaction of a new 200-gene signature with melanoma ‘driver’ genes informs a new signaling network in melanoma
We investigated the interaction between genes within our 200-gene signature with the four known melanoma ‘driver’ genes (i.e., NRAS, BRAF, MITF and cKIT). Of these driver genes, NRAS is mutated in 13–25% of melanoma cases (Goel et al., 2006; Schubbert, Shannon & Bollag, 2007), while BRAF (located downstream of NRAS), is mutated in up to 45% of malignant melanomas (Hocker & Tsao, 2007; Flaherty & McArthur, 2010). MITF, a master transcription factor in melanocyte function, cooperates when mutated with BRAF in melanomagenesis (Garraway et al., 2005; Taylor et al., 2011). Recent studies show that mutant cKIT can activate the Ras/Raf/Mek/Erk pathway and also activate MITF (Monsel et al., 2009; Phung et al., 2011). The four well-known melanoma driver genes did not appear on our list. This is due most likely to these four driver genes being associated with melanoma at the gene mutation level, rather than at the gene expression level.
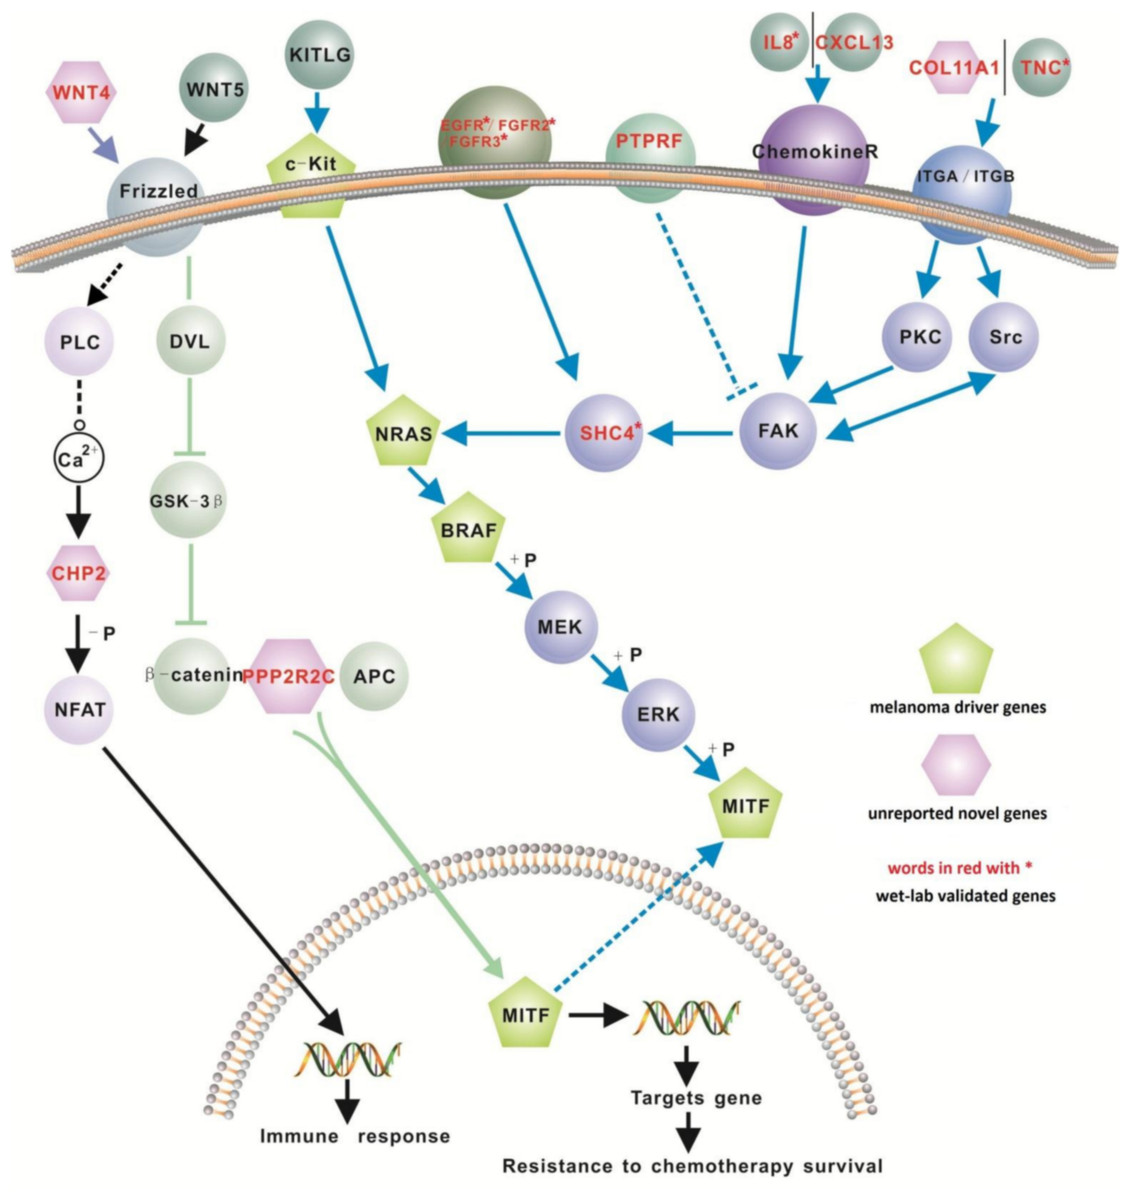
We retrieved 31 pathways from the KEGG database where 12 genes in our proposed 200-gene signature were found to closely interact with the 4 melanoma driver genes in the MAPK, Ca2+ and WNT signaling pathways (Table 3). These 12 genes are EGFR, FGFR2, FGFR3, IL8, PTPRF, TNC, CXCL13, COL11A1, CHP2, SHC4, PPP2R2C, and WNT4. Based on these interactions we propose a new signaling network for melanoma (Fig. 2). Of these 12 genes, CXCL13, SHC4, WNT4 and CHP2 were detected only using our computational method (i.e., not reported before in melanoma microarray studies) but exhibit important positions in melanoma driver gene signaling pathways (Fig. 2). The biological pathways involving chemokine receptors, WNT, Ca2+ and MAPK signaling will have implications for melanomagenesis and metastatic progression.
| No. | Pathways | Driver genes assocated pathway (BARF, NRAS, c-KIT, MITF) | IL8 | FGFR3 | PTPRF | TNC | SHC4 | CXCL13 | EGFR | WNT4 | FGFR2 | PPP2R2C | CHP2 | COL11A1 |
|---|---|---|---|---|---|---|---|---|---|---|---|---|---|---|
| 1 | hsa04010 | MAPK signaling pathway | ✓ | ✓ | ✓ | ✓ | ||||||||
| 2 | hsa04012 | ERBB signaling pathway | ✓ | ✓ | ||||||||||
| 3 | hsa04060 | cytokine-cytokine receptor interaction | ✓ | ✓ | ✓ | |||||||||
| 4 | hsa04062 | chemokine signaling pathway | ✓ | ✓ | ✓ | |||||||||
| 5 | hsa04115 | p53 signaling pathway | ||||||||||||
| 6 | hsa04144 | endocytosis | ✓ | ✓ | ✓ | |||||||||
| 7 | hsa04360 | axon guidance | ✓ | |||||||||||
| 8 | hsa04370 | VEGF signaling pathway | ✓ | |||||||||||
| 9 | hsa04510 | focal adhesion | ✓ | ✓ | ✓ | ✓ | ||||||||
| 10 | hsa04530 | tight junction | ✓ | |||||||||||
| 11 | hsa04540 | GAP junction | ✓ | |||||||||||
| 12 | hsa04650 | natural killer cell mediated cytotoxicity | ✓ | ✓ | ||||||||||
| 13 | hsa04660 | T cell receptor signaling pathway | ✓ | |||||||||||
| 14 | hsa04662 | B cell receptor signaling pathway | ✓ | |||||||||||
| 15 | hsa04720 | long-term potentiation | ✓ | |||||||||||
| 16 | hsa04722 | neurotrophine signaling pathway | ✓ | |||||||||||
| 17 | hsa04810 | regulation of actin cytoskeleton | ✓ | ✓ | ✓ | |||||||||
| 18 | hsa04910 | insulin signaling pathway | ✓ | ✓ | ||||||||||
| 19 | hsa04912 | GnRH signaling pathway | ✓ | |||||||||||
| 20 | hsa04916 | melanogenesis | ✓ | |||||||||||
| 21 | hsa05160 | hepatitis C | ✓ | ✓ | ✓ | |||||||||
| 22 | hsa05166 | HTLV-1 infection | ✓ | |||||||||||
| 23 | hsa05200 | pathways in cancer | ✓ | ✓ | ✓ | ✓ | ✓ | |||||||
| 24 | hsa05212 | pancreatic cancer | ✓ | |||||||||||
| 25 | hsa05213 | endometrial cancer | ✓ | |||||||||||
| 26 | hsa05214 | glioma | ✓ | ✓ | ||||||||||
| 27 | hsa05215 | prostate cancer | ✓ | ✓ | ||||||||||
| 28 | hsa05218 | melanoma | ✓ | |||||||||||
| 29 | hsa05219 | bladder cancer | ✓ | ✓ | ✓ | |||||||||
| 30 | hsa05220 | chronic myeloid leukemia | ✓ | |||||||||||
| 31 | hsa05223 | non-small cell lung cancer | ✓ |
Experimental validation of a MAPK pathway-associated subset in our 12-gene melanoma signature
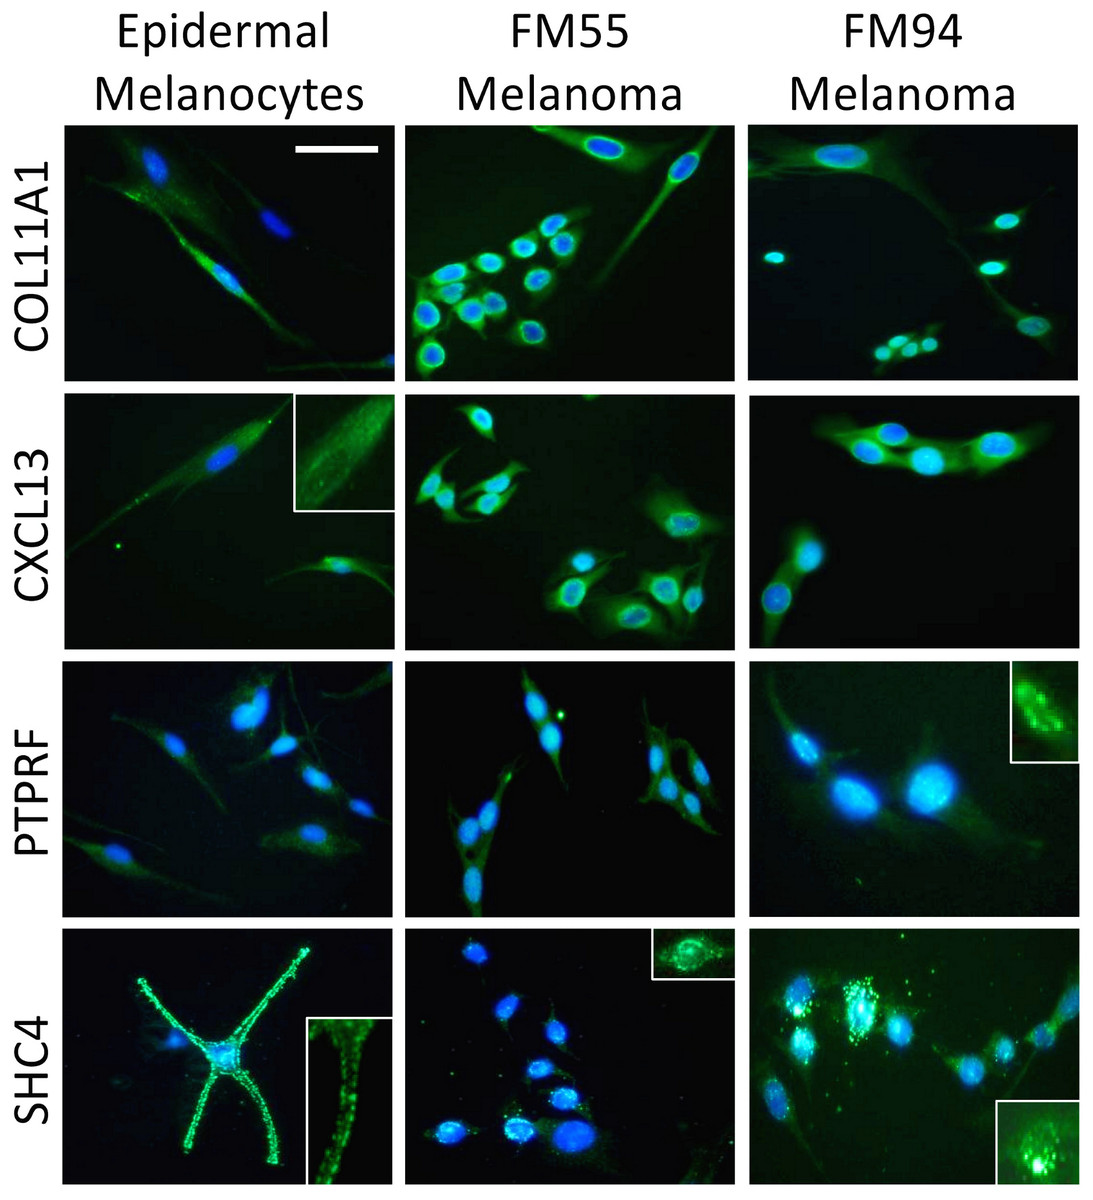
Four genes in our proposed 12-gene biomarker signature that appear in the MAPK signaling pathway (i.e., COL11A1, CXCL13, PTPRF, and SHC4) were selected for laboratory validation. Note that COL11A1, CXCL13, and PTPRF have not previously been reported to be associated with melanoma experimentally. COL11A1, CXCL13, PTPRF, and SHC4 were found to be over-expressed in two human melanoma cell lines (i.e., FM55 and FM94) compared to normal human epidermal melanocytes in vitro (Fig. 3). A significant degree of heterogeneity was observed in the expression pattern for these markers. For example, COL11A1, a secreted collagen protein, was observed at low levels in the cytoplasm of normal melanocytes, but more intensely in the perikayon of moderately-pigmented FM55 melanoma cells, and unexpectedly exhibited a nuclear/nuclear membrane association in the pigmented FM94 melanoma cells. Similarly, a weak cytoplasmic localization of CXCL13 in normal melanocytes appeared to shift towards the perikayon and nucleus of FM55 and FM94 melanoma cells respectively, as evidenced by co-localization with DAPI staining. Low level PTPRF expression in normal epidermal contrasted with higher expression (both cytoplasmic and nuclear) in melanoma cells. Finally, SHC4 expression was membranous in normal melanocytes contrasting with some punctuate nuclear membrane expression in melanoma cells (Fig. 3).
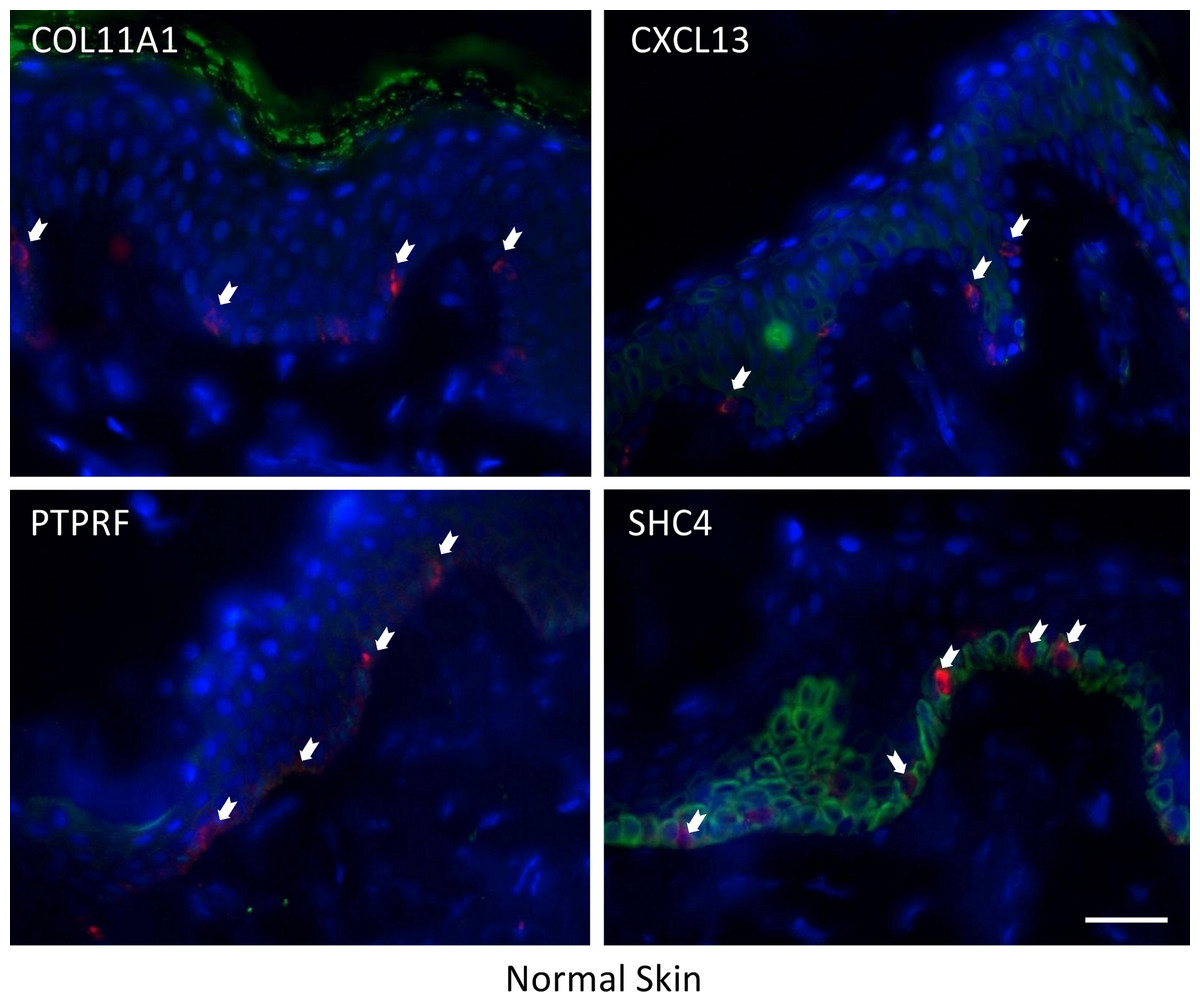
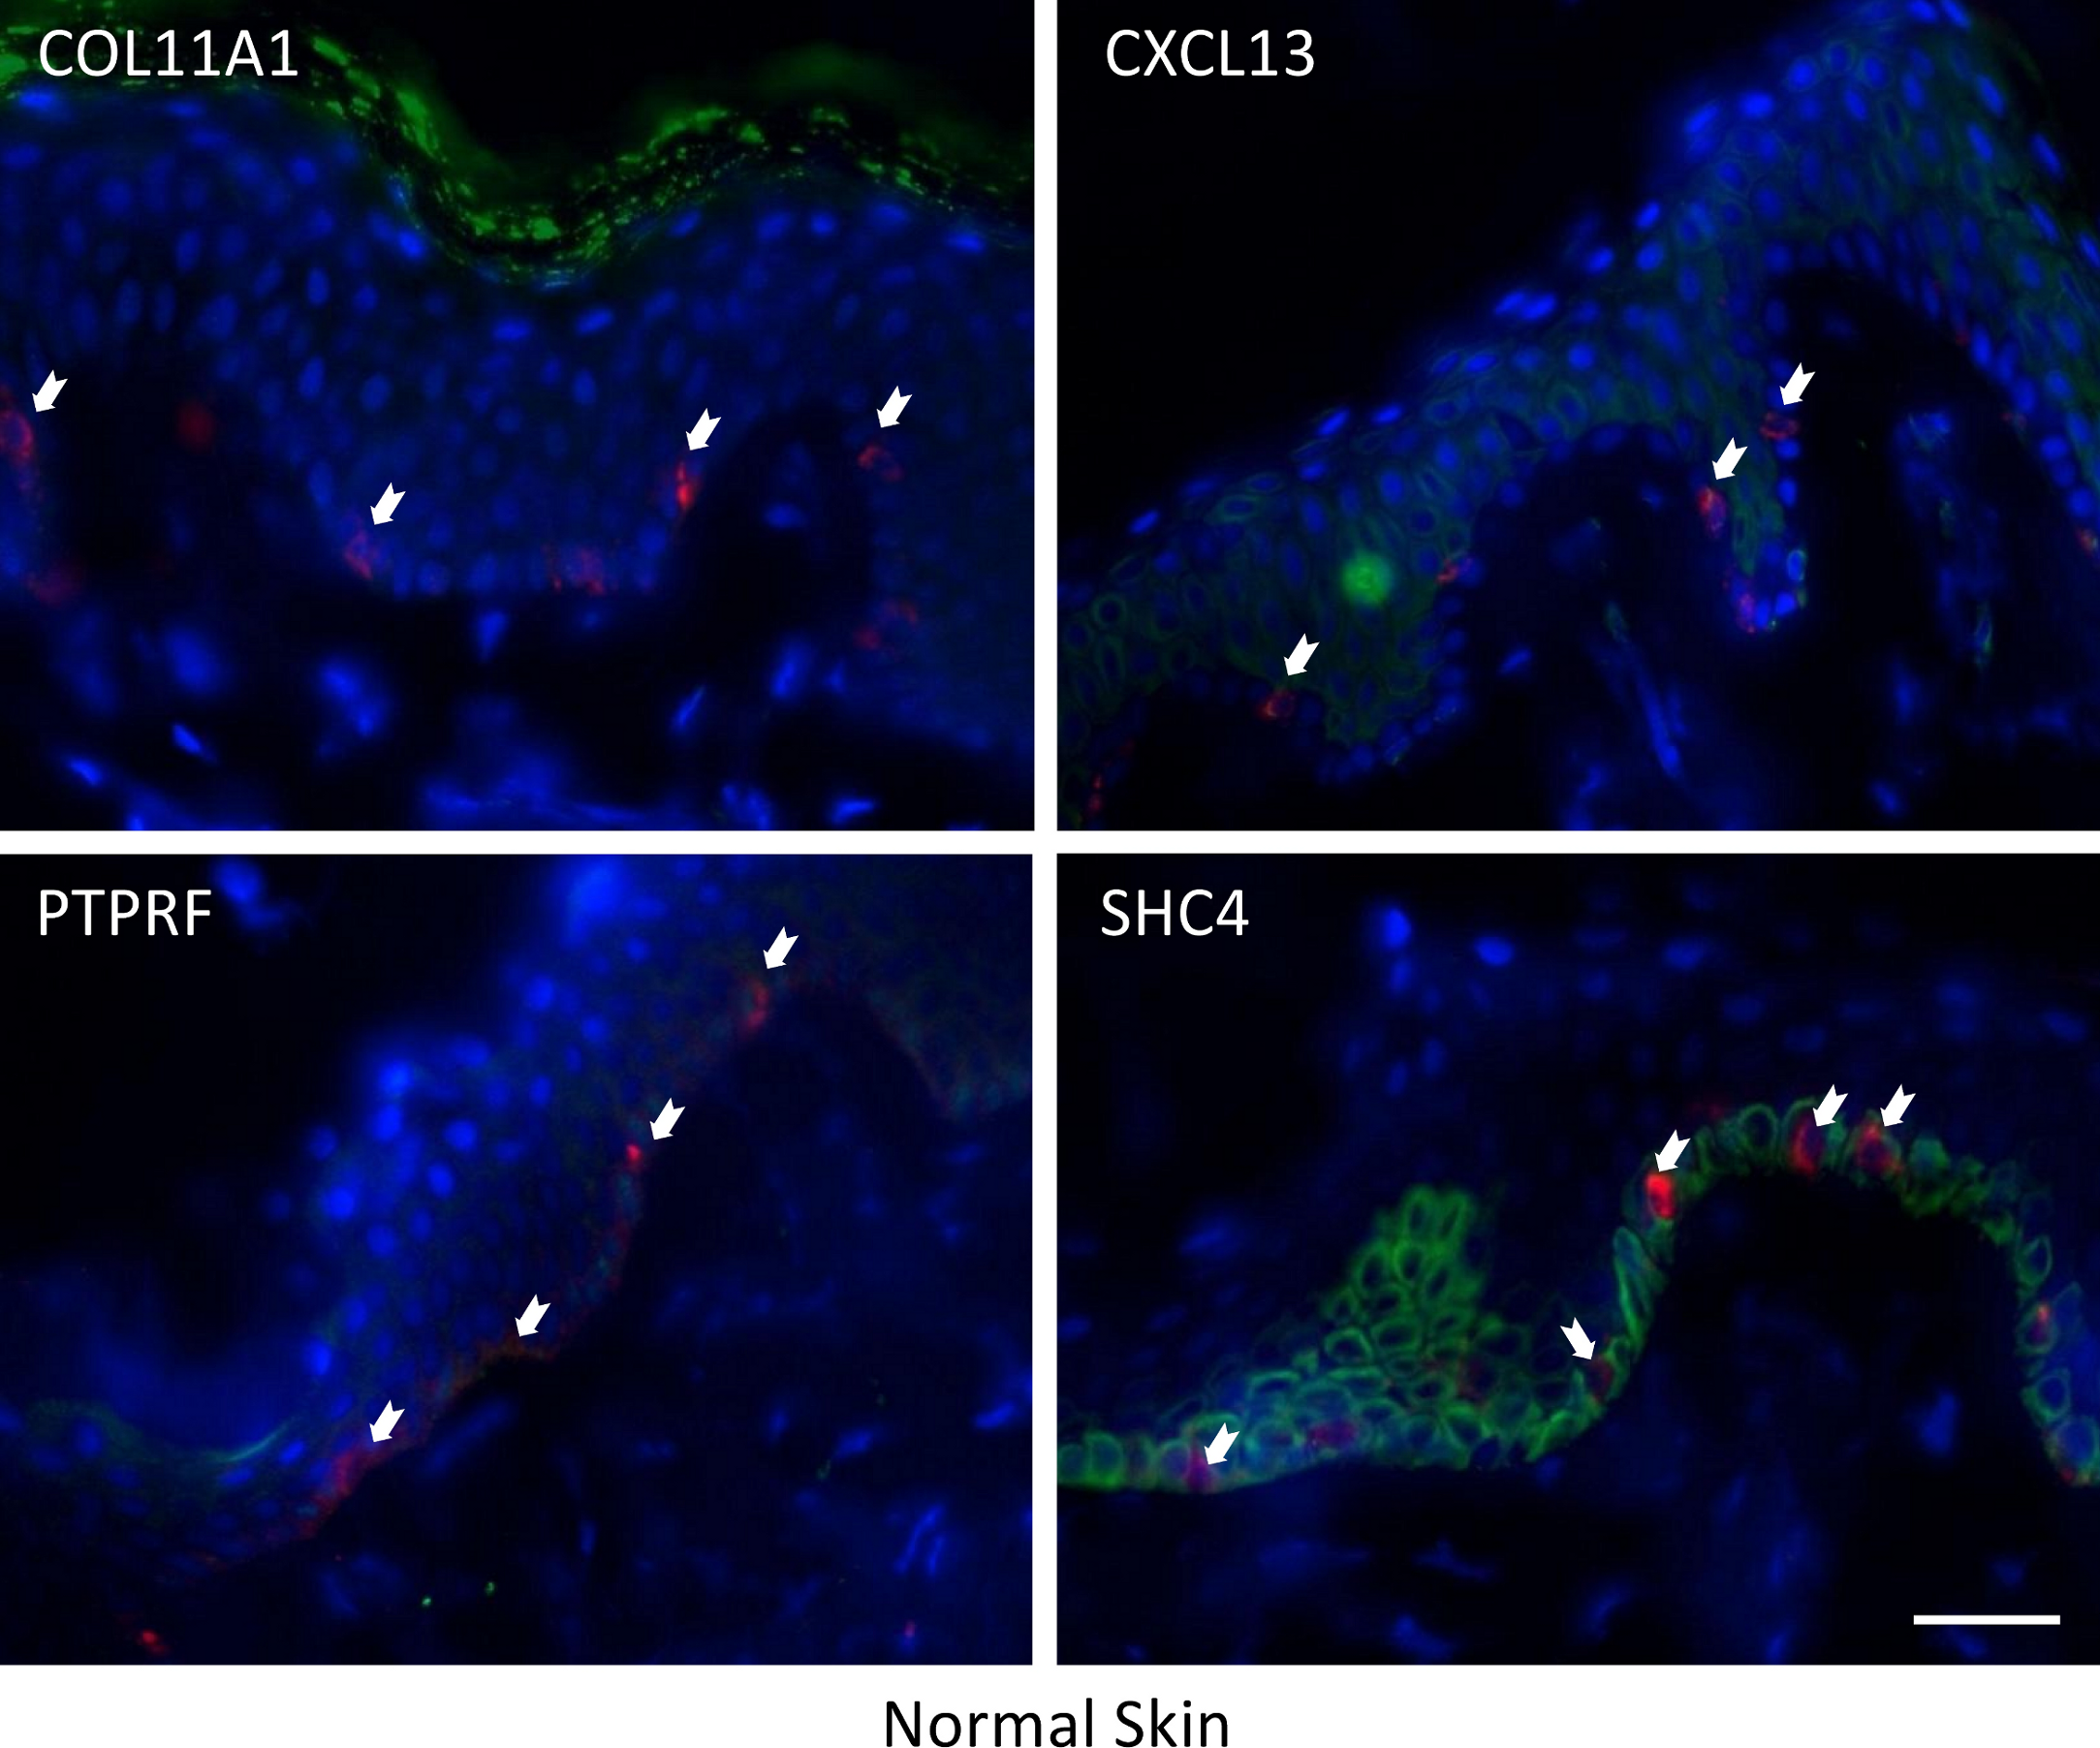
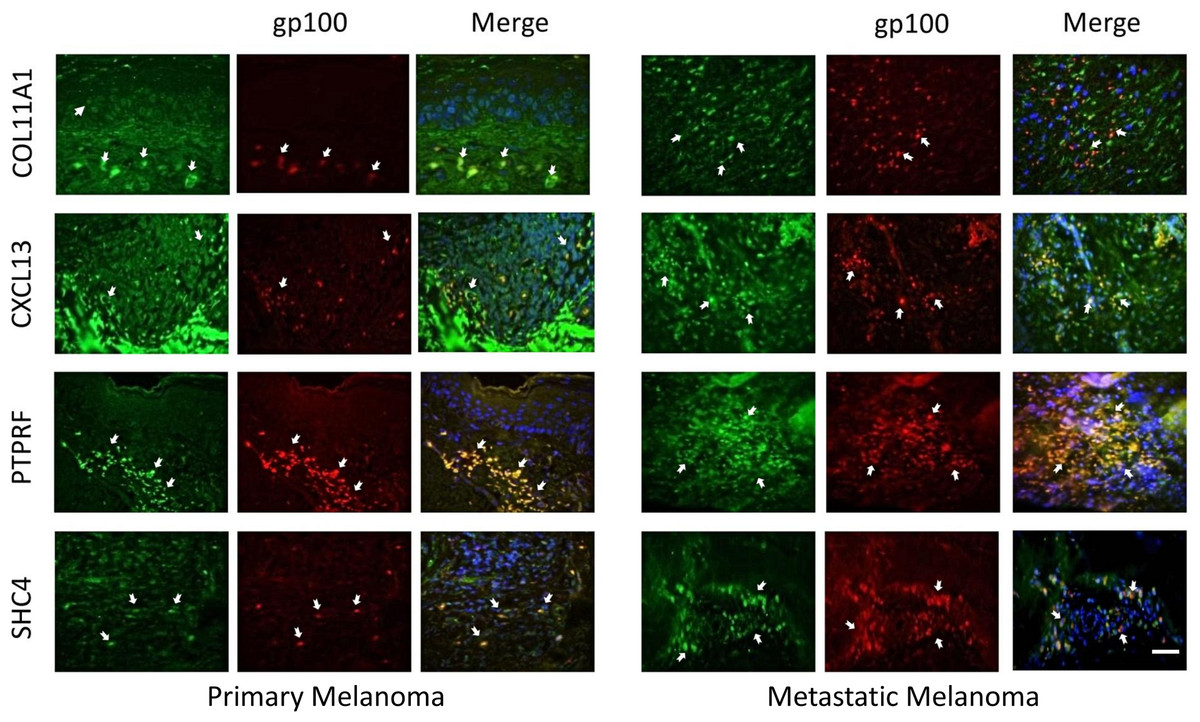
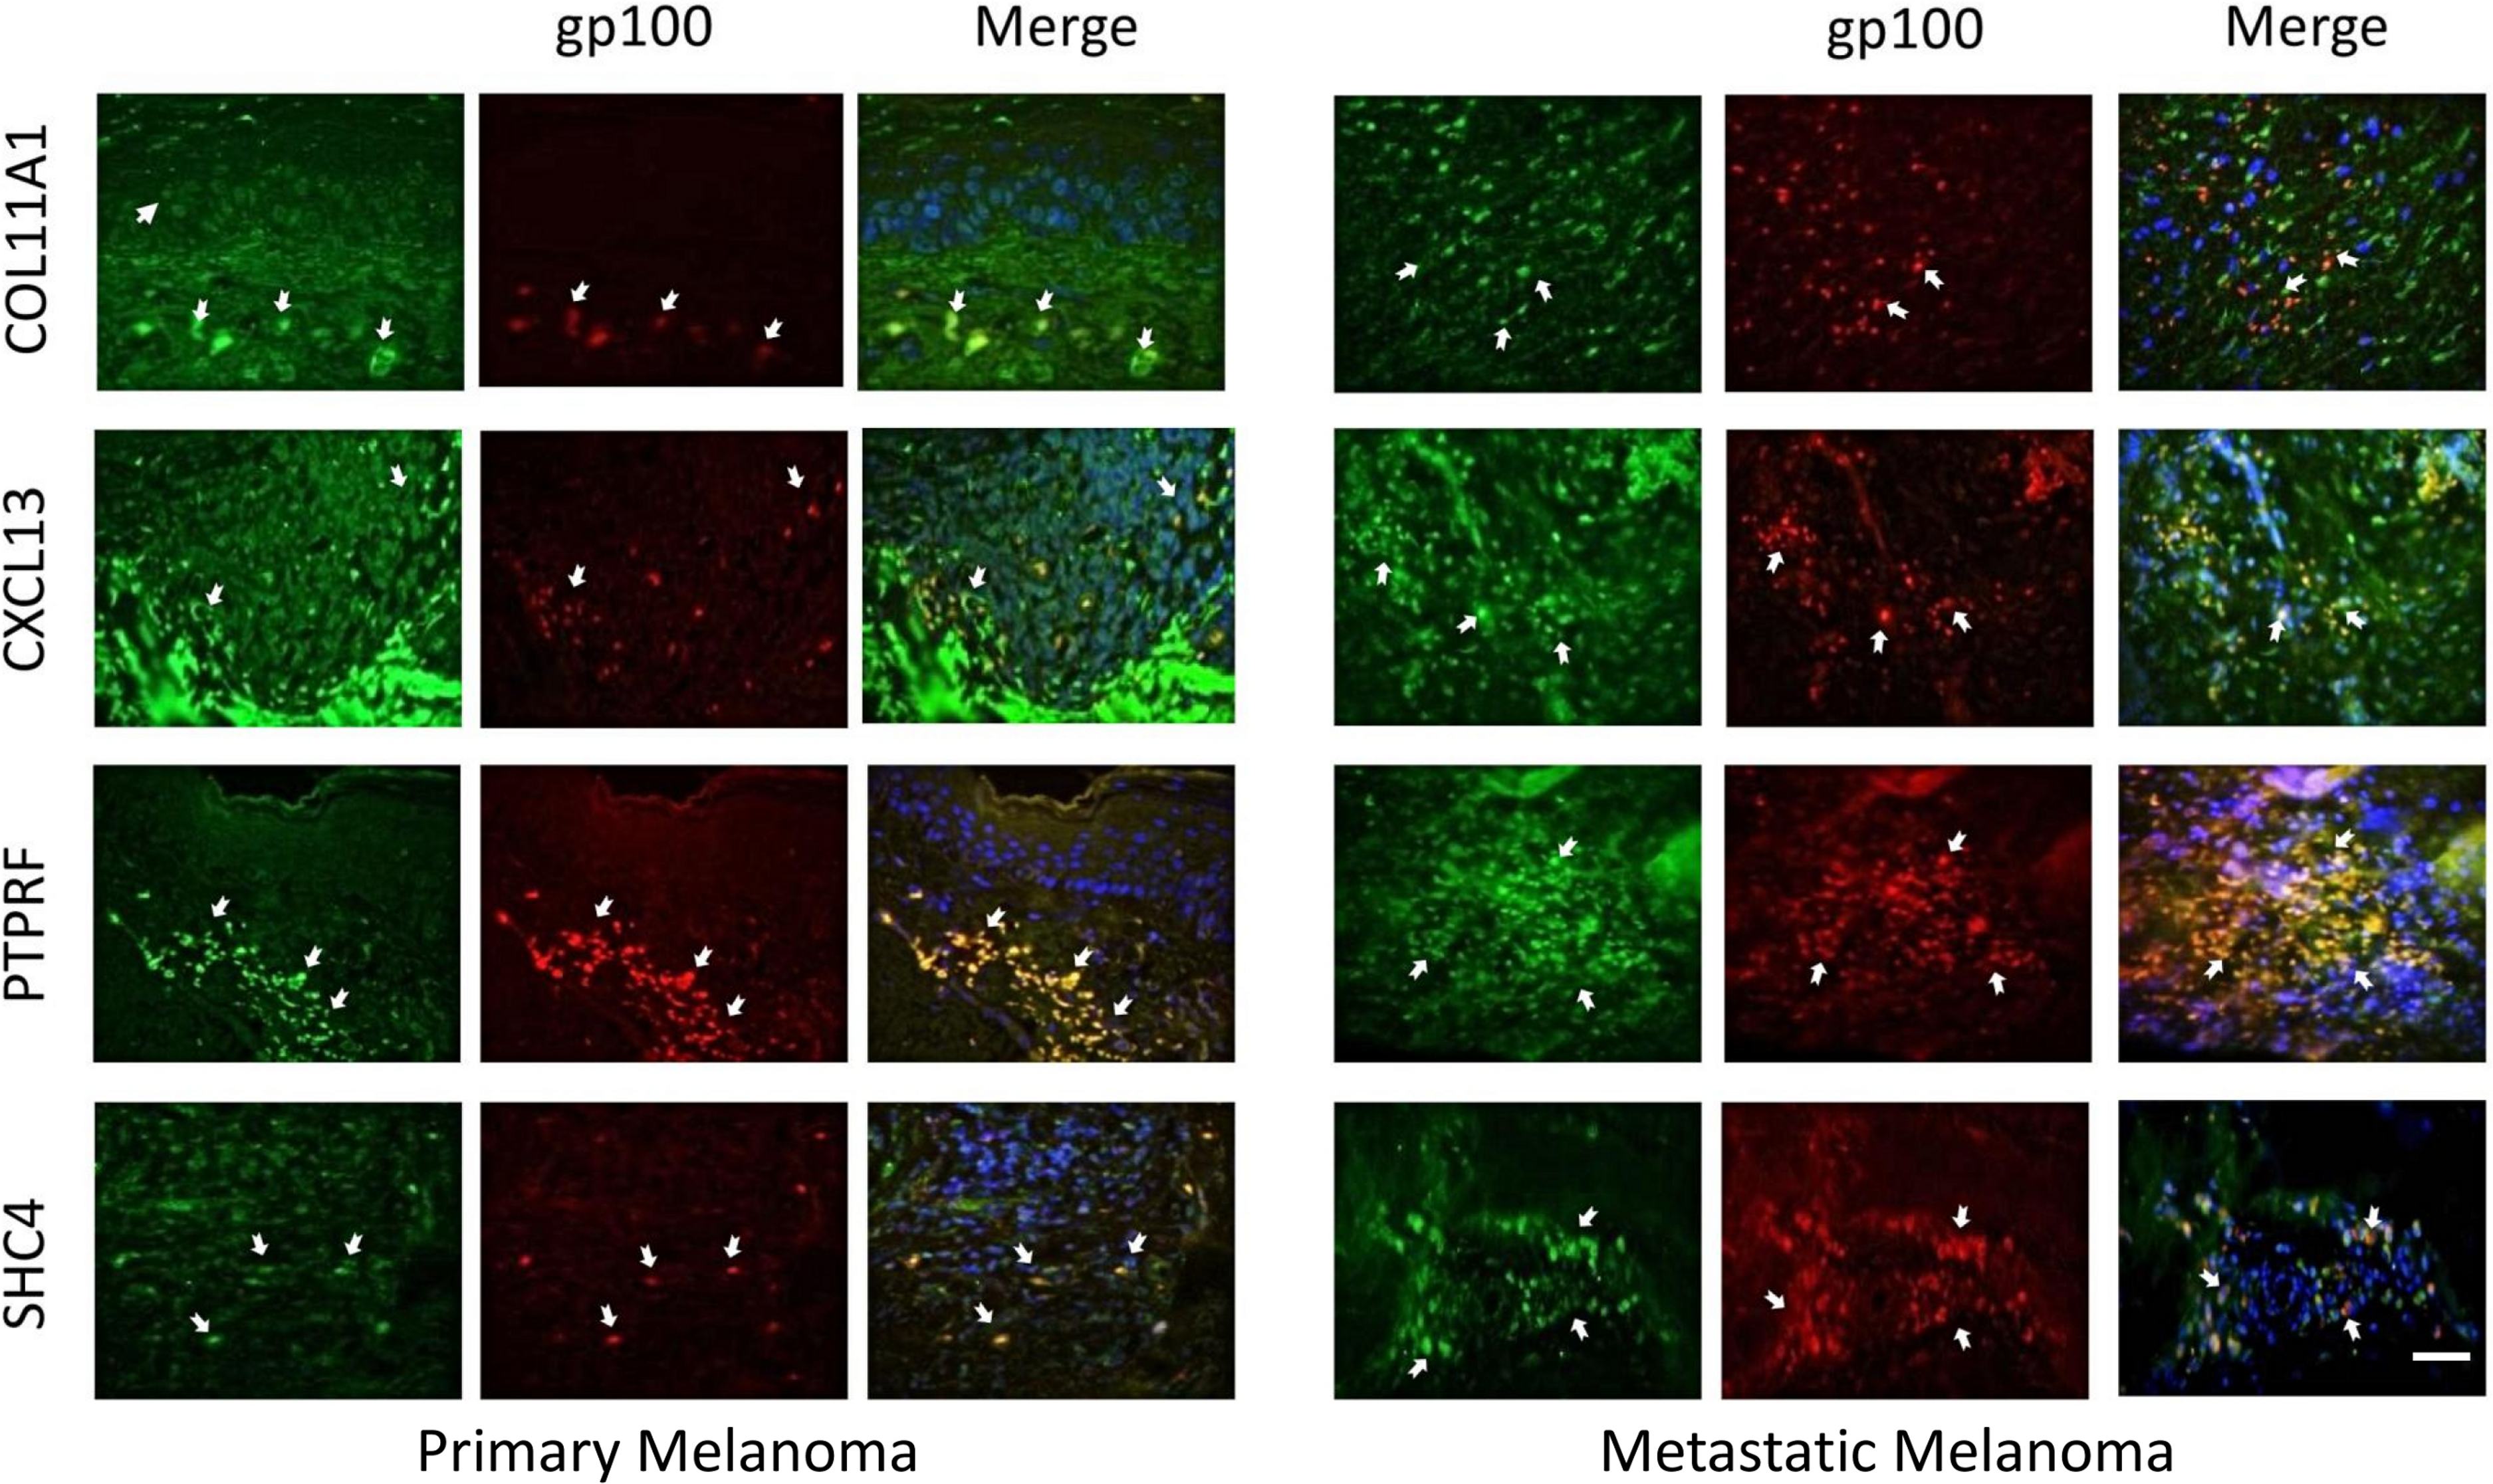
The expression of these four proteins was also assessed in normal human healthy skin and in melanoma patient tissue (both primary and metastatic melanoma). Using double immunofluorescence with a melanocyte lineage marker gp100, we assessed the relationship of the four test proteins with melanocytes or melanoma cells in these tumor biopsies. We included primary melanoma (in addition to metastatic melanoma) in our immunohistochemistry validation study because the expression levels for the 12 genes in our signature exhibited several fold level changes between primary melanoma and normal skin/benign nevi across 5 microarray datasets (Table S8).
COL11A1, CXCL13 and PTPRF were not detected in normal human epidermal melanocytes in situ (Fig. 4a). Some low level expression of SHC4 was detected in these normal pigment cells. By contrast, COL11A1 was expressed intensely by melanoma cells located in the dermis of both primary and metastatic melanoma (Fig. 4b). CXCL13 was strongly expressed in a minor subpopulation of tumor cells in primary melanoma, while a greater fraction of cells in metastatic melanoma tissue expressed this protein. By contrast, PTPRF was intensely expressed in the majority of tumor cells of both primary and metastatic melanoma cells. Finally SHC4 was found to be expressed in minor fraction of primary gp100-positive melanoma, but in most metastatic gp100-positive melanoma cells.
Computational evaluation of the robustness of a proposed 12-gene biomarker signature in distinguishing melanoma from normal skin and/or benign nevi
A computational evaluation of robustness of the proposed 12-gene signature, based on melanoma driver gene association, was performed for distinguishing melanoma from normal skin and/or benign nevi using cross-laboratory published data. This data evaluation is important to verify the robustness of a new biomarker for potential diagnostic application and/or possible therapeutic development. The support vector machine (so-called SVM model) classification model (Brown et al., 2000) and the ‘leave-one-out method’ are used to classify microarray datasets (Hoek et al., 2004; Smith, Hoek & Becker, 2005; Riker et al., 2008; Scatolini et al., 2010; Rose et al., 2011). Our results showed that these 12 genes achieved excellent classification accuracy ratios across these five datasets (i.e., average of 99.1%, Table 4). This result indicated that our 12-gene biomarker achieved a classification accuracy ratios that was identical or near identical to the classification accuracy ratios of the original individual studies. Importantly, the 12-gene biomarker signature achieved a much better performance on average than the signatures of Smith, Hoek & Becker (2005), Riker et al. (2008) and Scatolini et al. (2010), and very slightly less (0.44% less) classification accuracy than the signature of Hoek et al. (2004). It should be noted that the signature of Hoek et al. (2004) consisted of 589 genes, while our biomarker signature is very much shorter at just 12 genes.
| Original signatures | GSE4570 (2004) | GSE4587 (2005) | GSE7553 (2008) | GSE12391 (2010) | GSE22301 (2011) | Average |
|---|---|---|---|---|---|---|
| (Hoek et al., 2004) (589) | 100% | 100% | 97.78% | 100% | 100% | 99.56% |
| (Smith, Hoek & Becker, 2005) (100) | 71.43% | 100% | 97.78% | 100% | 100% | 93.84% |
| (Riker et al., 2008) (65) | 71.43% | 100% | 95.56% | 100% | 100% | 93.40% |
| (Scatolini et al., 2010) (455) | 85.71% | 100% | 97.78% | 100% | 100% | 96.70% |
| New 12-gene biomarkers | 100% | 100% | 95.56% | 100% | 100% | 99.11% |
Discussion
There is poor congruence between gene signatures generated by different microarray-based melanoma studies (John et al., 2008; Bittner et al., 2000; Tímár, Gyorffy & Rásó, 2010). Unsurprisingly therefore, microarray-based melanoma gene biomarkers have had poor translation to clinical practice, and melanoma diagnosis is still based on clinical and histopathological features of the tumor (Schramm et al., 2011). To perform a meta-analysis on microarray gene expression data, Rhodes et al. (2002) introduced a model for combination of differentially-expressed genes based on their p-value in a statistical test. Here we propose a new and universally-applicable method to overcome some limitations of the Rhodes model (see Methods). Our new method measures firstly the ‘genome-wide relative significance’ (GWRS) as defined in an individual dataset followed by a ‘genome-wide global significance’ (GWGS) as defined as an assessment across multiple datasets. The robustness and effectiveness of our approach can be supported by several lines of evidence and validation.
First, a considerable number of novel genes (e.g., GTAG1A/1B/2, GAGE1-8/12B-J, XAGE1A-E, IL8, IGF2/INS-IGF2, SHC4, LEP, TF, CYP3A5, TP63 and GBP5) revealed by our method were not identified as significant genes in the previous 16 melanoma microarray studies published between 2000 and 2011, but have still been confirmed as melanoma-associated by independent ‘wet-lab’ studies in the literature (Table S4).
Second, our method identified a core signature of 12 genes (i.e., EGFR, FGFR2, FGFR3, IL8, PTPRF, TNC, CXCL13, COL11A1, SHC4, CHP2, PPP2R2C and WNT4) that are closely associated with known melanoma driver genes. However, six signature genes (i.e., IL8, SHC4, COL11A1, CHP2, PPP2R2C and WNT4) were not reported previously by microarray-based melanoma studies, although two (i.e. IL8 and SHC4) have been identified in independent wet-lab studies (Zhang et al., 2011; Fagiani et al., 2007; Pasini et al., 2009). This leaves WNT4, CHP2, PPP2R2C and COL11A1 which have not been previously reported to be associated with melanoma. However, Fedida-Metula recently suggested a relationship between Ca2+ signaling members and PP2A and melanoma tumor growth (Fedida-Metula et al., 2012). CHP2 (‘calcineurin-like EF hand protein’) is involved in calcium signaling, while PPP2R2C is a member of the PP2A family.
Third, we validated the expression of MAPK-associated members (COL11A1, CXCL13, PTPRF, SHC4) of the 12-gene biomarkers in a comparative analysis of normal melanocytes and melanoma cells in vitro and in primary versus metastatic melanoma biopsy tissue in situ. All four markers were found to be preferentially associated with melanoma, being differentially expressed in primary and metastatic melanoma. Strikingly, COL11A1, CXCL13, and PTPRF were not detectable in epidermal melanocytes of normal healthy human skin epidermis. SHC4 was expressed at low levels in normal epidermal melanocytes, as previously shown (Fagiani et al., 2007).
The over-expression of COL11A1, CXCL13, PTPRF, and SHC4 in melanoma cells in vitro and in situ may reflect the observed over-expression of the associated genes in our microarray meta-analysis results. The considerably higher level of SHC4 expression in the perikaryon of melanoma cells is of note, and concurs with other studies showing restricted expression in melanomas, while only weakly expressed in normal melanocytes and benign nevi (Fagiani et al., 2007). There is evidence that SHC4 is highly expressed at the transition from radial growth phase to vertical growth phase and metastatic melanomas, contemporaneous with the acquisition of melanoma migratory competence and invasive potential (Fagiani et al., 2007; Pasini et al., 2009). This protein tyrosine phosphatase acts as a signaling molecule to regulate cell growth, differentiation, mitotic cycle, and oncogenic transformation (Junta et al., 2008). PTPRF usually is expressed in the cell membrane (i.e. is a receptor-type protein tyrosine phosphatase) where it interacts with β-catenin and like β-catenin may be translocated to the nucleus upon activation. The over-expression of COL11A1, CXCL13, PTPRF and SHC4 in our melanoma cell lines and primary and metastatic tissue, and their potential association with MAPK pathways suggests they could be specific biomarkers for melanoma and so potential therapeutic targets.
Our computational evaluation indicates that this new 12-gene biomarker signature achieves excellent diagnostic power in distinguishing metastatic melanoma from normal skin and benign nevus. The integrated analysis of these five microarray datasets has identified a robust 12-gene biomarker signature that includes six previously-unreported genes in melanoma. Further experimental validation of the role of these 12 signature genes in a revised signaling network may provide new insights into the underlying biological mechanisms driving the progression of melanoma. Moreover, given that the original signatures involved much larger numbers of genes (e.g., 589, 100, 65, 455 genes per signature), an excellent classification accuracy ratio performance was achieved by our melanoma biomarker signature with just 12 genes. This supports the view that our integrated approach extracts more informative genes than the original signatures, and from a clinical perspective our 12-gene signature could be a more valuable biomarker for melanoma in the clinical setting.