
Mitochondrial genome characteristics of six Phylloscopus species and their phylogenetic implication
- Published
- Accepted
- Received
- Academic Editor
- Sankar Subramanian
- Subject Areas
- Evolutionary Studies, Genomics, Molecular Biology, Taxonomy, Zoology
- Keywords
- Phylloscopus, Mitogenome, Genome organization, Phylogeny, Divergence
- Copyright
- © 2023 Yang et al.
- Licence
- This is an open access article distributed under the terms of the Creative Commons Attribution License, which permits unrestricted use, distribution, reproduction and adaptation in any medium and for any purpose provided that it is properly attributed. For attribution, the original author(s), title, publication source (PeerJ) and either DOI or URL of the article must be cited.
- Cite this article
- 2023. Mitochondrial genome characteristics of six Phylloscopus species and their phylogenetic implication. PeerJ 11:e16233 https://doi.org/10.7717/peerj.16233
Abstract
The mitochondrial genomes of six Phylloscopus species—small insectivores belonging to the Phylloscopidae family—were obtained using the Illumina sequencing platform. The mitogenomes were closed circular molecules 16,922–17,007 bp in size, containing 13 protein-coding genes, 22 tRNA genes, two rRNA genes, and two control regions (CR1 and remnant CR2). The gene orders were conserved in 35 sampled Phylloscopus mitogenomes in the GenBank database, with a gene rearrangement of cytb-trnT-CR1-trnP-nad6-trnE-remnant CR2-trnF-rrnS. The average base compositions of the six Phylloscopus mitogenomes were 29.43% A, 32.75% C, 14.68% G, and 23.10% T, with the A+T content slightly higher than that of G+C. ATG and TAA were the most frequent initiating and terminating codons, respectively. Several conserved boxes were identified in CR1, including C-string in domain I; F, E, D, and C boxes, as well as bird similarity and B boxes, in domain II; and CSB1 in domain III. Tandem repeats were observed in remnant CR2 of the Phylloscopus fuscatus and Phylloscopus proregulus mitogenomes. A phylogenetic analysis with maximum likelihood (ML) and Bayesian inference (BI) methods, based on 13 protein-coding genes and two rRNA genes, indicated that the Phylloscopus species was divided into two larger clades, with a splitting time approximately 11.06 million years ago (mya). The taxa of Phylloscopus coronatus/Phylloscopus burkii and Phylloscopus inornatus/P. proregulus were located at the basal position of the different clades. The phylogenetic result of the cox1 gene showed that Seicercus was nested within Phylloscopus. The complete set of mitogenomes of the Phylloscopus species provides potentially useful resources for the further exploration of the taxonomic status and phylogenetic history of Phylloscopidae.
Introduction
Leaf warblers (Phylloscopus) belong to the family Phylloscopidae of the order Passeriformes (Gill, Donsker & Rasmussen, 2022). These small insectivorous songbirds have a wide distribution in the Old World (Sun, Liu & Lu, 2020). Leaf warblers have the highest number in Asia (Alström et al., 2018), with the greatest diversity in the eastern Himalayas and southern China (Price, 2010). There are currently 81 recognized species in the genus Phylloscopus (Gill, Donsker & Rasmussen, 2022). Leaf warblers had been classified into two genera (Phylloscopus and Seicercus) (Clement, Alström & Madge, 2006); however, several phylogenetic studies have shown that traditional Seicercus is nested within Phylloscopus, and is also separated into two non-sister clades. Based on the phylogeny of mitochondrial and nuclear datasets, Alström et al. (2018) supported the synonymizing of Seicercus with Phylloscopus, leading to the synonymization of Seicercus and a monogeneric Phylloscopidae. The phylogenetic relationship and divergences of Phylloscopus have also been examined using multiple molecular markers such as mitochondrial genomes (mitogenomes) (Yu et al., 2022), mitochondrial genes combined with nuclear segments (Alström et al., 2018), and genome-wide data (Zhang et al., 2021). Other research has also been carried out on leaf warblers, in relation to topics such as their biogeographic history (Johansson et al., 2007), bioacoustic differentiation (Calviño Cancela, Piña & Martín-Herrero, 2022), and migratory behavior (Adams et al., 2022).
Several molecular markers, including mitogenomes, nuclear segments, ultra-conserved element (UCE) sequences, and genomic data, have been remodeled to study avian evolution (Hosner, Braun & Kimball, 2016; Mackiewicz et al., 2019; Oliveros et al., 2019; Qu et al., 2021; Zhang et al., 2021). Among them, mitochondrial DNA (mtDNA) has demonstrated maternal inheritance and haploidy, commonly containing 13 protein-coding genes (PCGs), two rRNA genes (rRNAs), 22 tRNA genes (tRNAs), and one non-coding region (control region (CR)) in the majority of birds. Mitogenome sequences have been widely used for evolution, phylogeny, population, and phylogeography studies of the genome characteristics of different bird orders such as Galliformes (Li, Huang & Lei, 2015), Charadriiformes (Hu et al., 2017), and Passeriformes (Mackiewicz et al., 2019), and have been effective markers for the exploration of evolutionary positions. By sampling ∼300 representatives of Passeriformes mitogenomes, Mackiewicz et al. (2019) analyzed four types of gene rearrangements, including a duplicated CR with adjacent genes, indicating that the duplication was the ancestral state and was maintained in early diverged lineages. Several complete mitogenomes of Phylloscopus are available in the GenBank database, such as those for Phylloscopus tenellipes (Sun, Liu & Lu, 2020; Yu et al., 2022) and Phylloscopus proregulus (Jiao et al., 2018), whose data have been used for the analysis of phylogenetic relationships of this genus and even the whole Passeriformes order.
In this study, the complete mitogenomes of six Phylloscopus species were sequenced using the Illumina sequencing platform. Based on these data, and by obtaining other Phylloscopus complete mitogenome sequence data from GenBank, we attempted to elucidate (a) the features and structures of the mitogenomes of six Phylloscopus species, and (b) the taxonomic status of the phylogenetic relationships and divergence times of the Phylloscopus species. The newly generated complete mitogenomes may be useful resources for further in-depth studies of the phylogenetic relationships of Phylloscopus, as well as Phylloscopidae.
Materials and Methods
Sample collection, DNA extraction, and sequencing
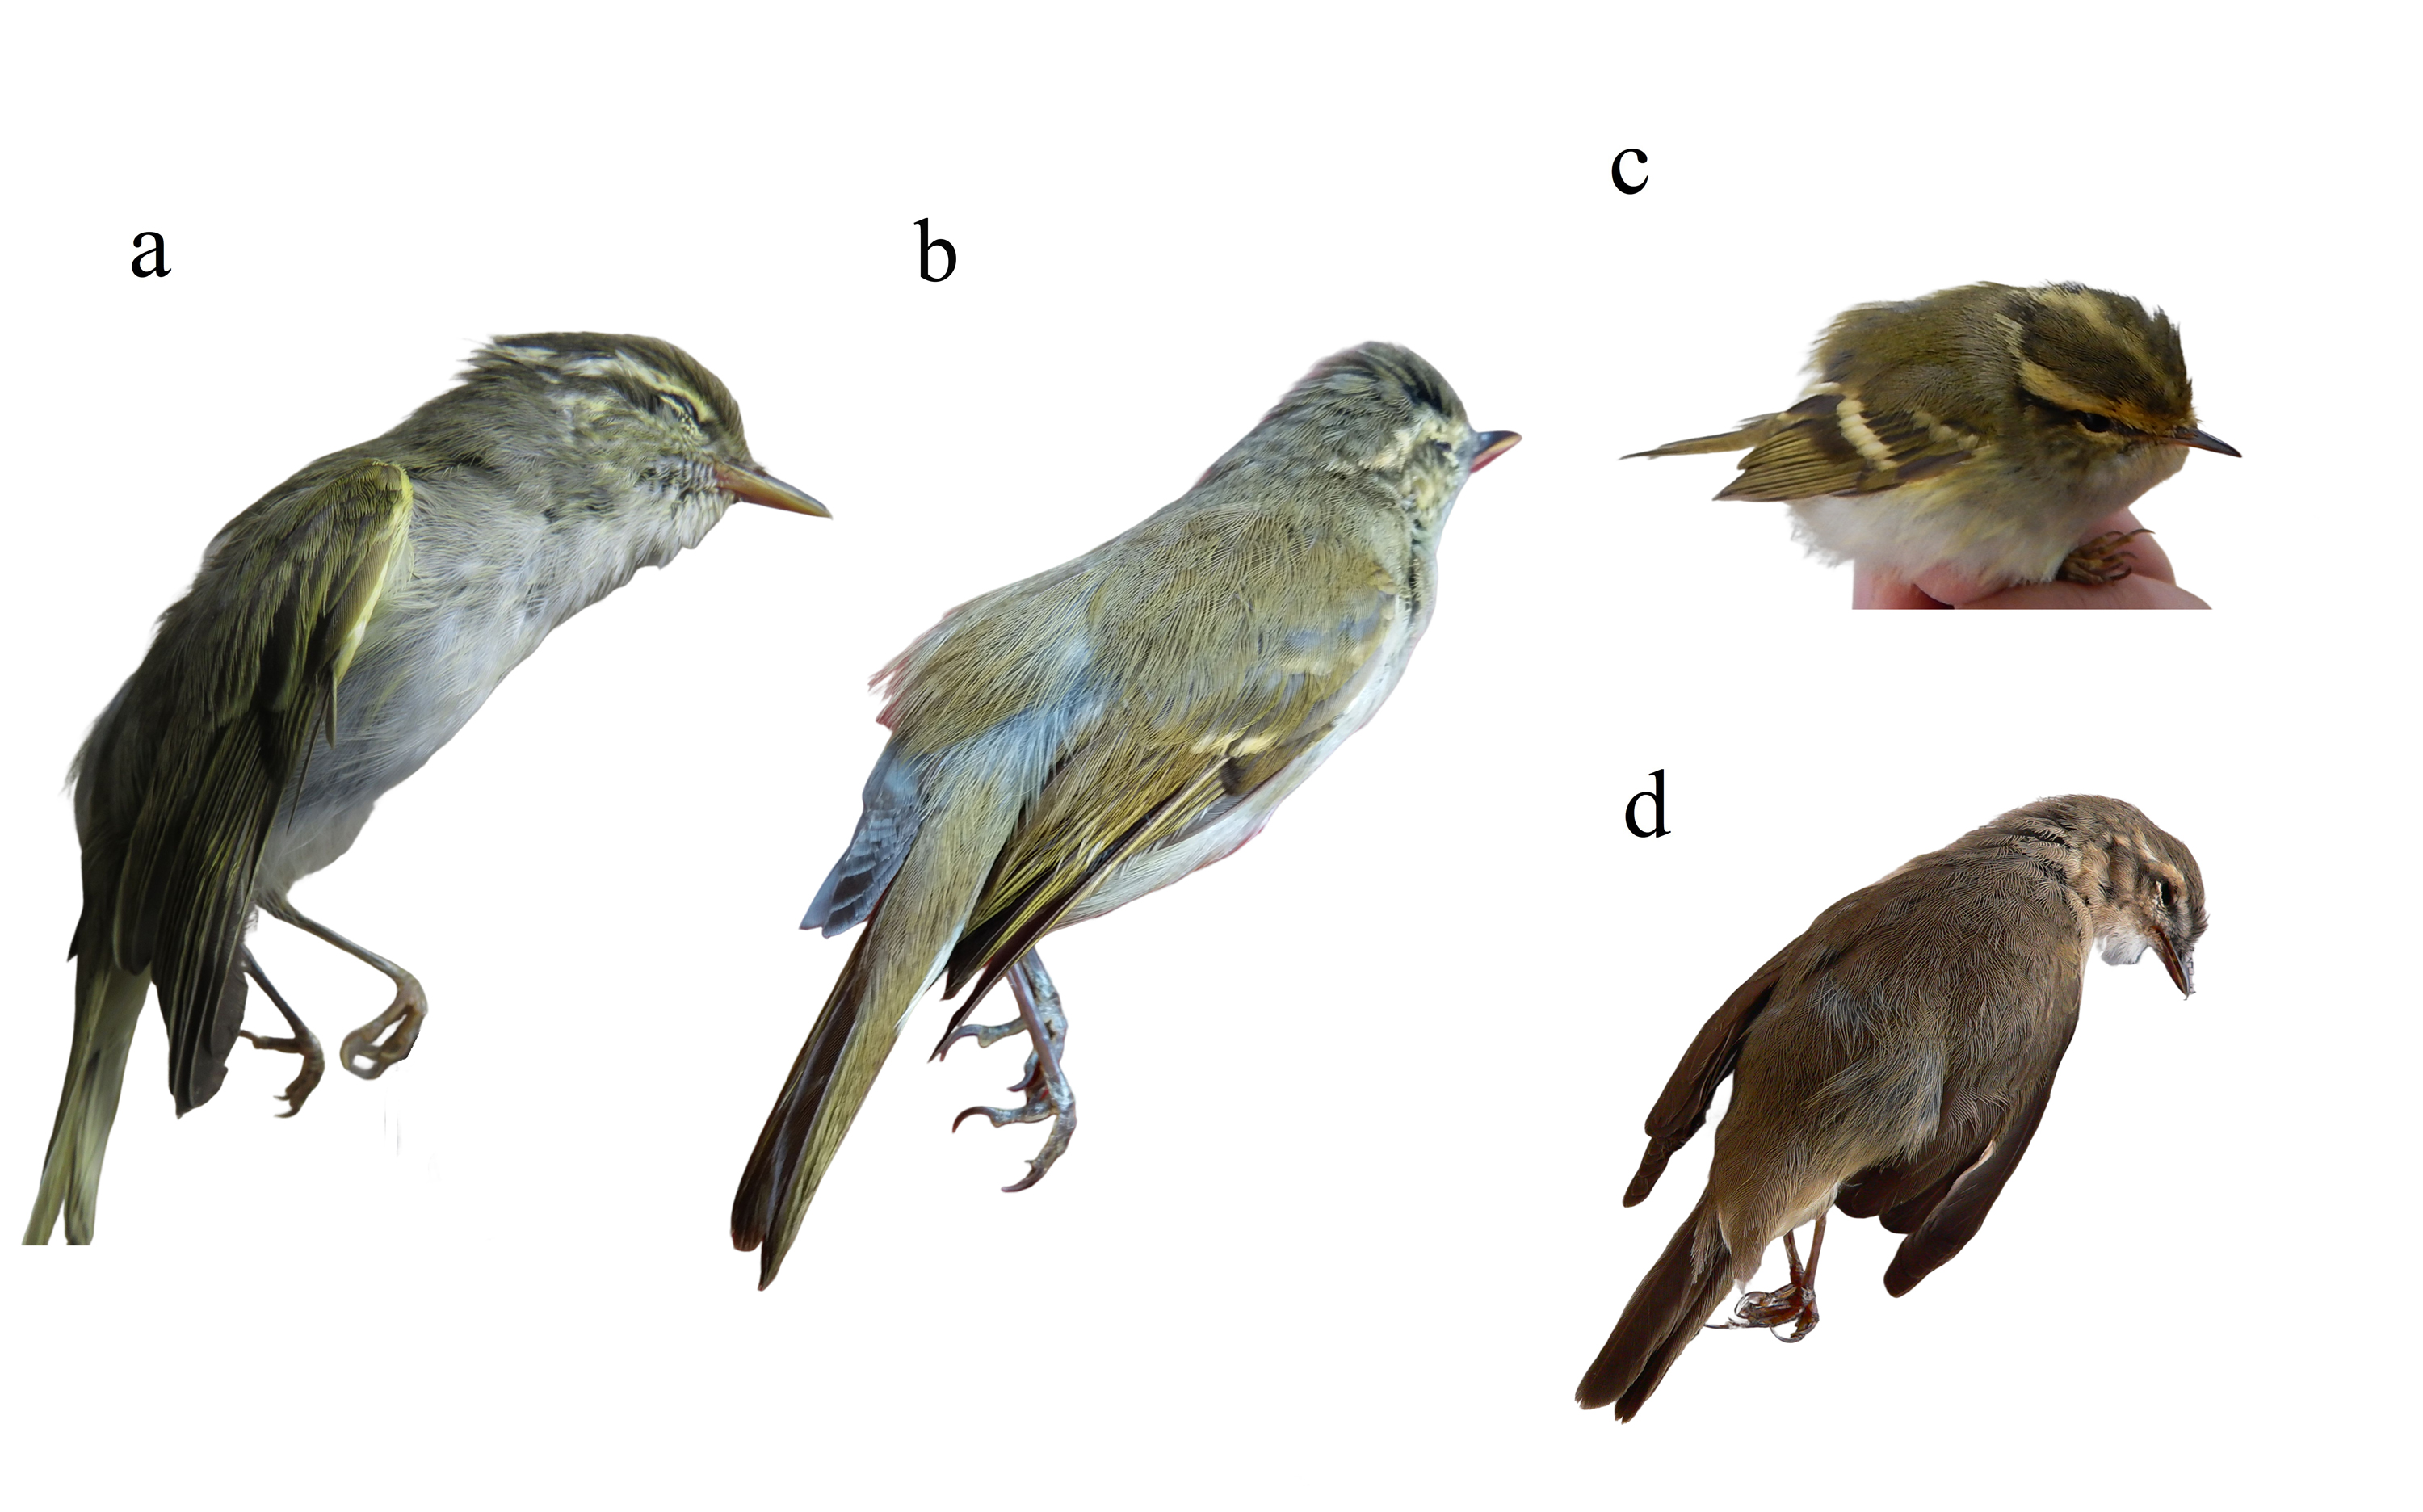
Samples of six Phylloscopus species (Phylloscopus burkii, Phylloscopus reguloides, Phylloscopus borealis, P. proregulus, Phylloscopus trochiloides, and Phylloscopus fuscatus) were naturally deceased adults (Table S1, Fig. S1). Muscle tissue was collected, preserved in 100% ethanol, and stored at −20 °C in the Shaanxi Institute of Zoology, Xi’an, China. Genomic DNA was extracted using a DNeasy kit, and the library reconstruction followed the methodology of previous studies (Yang et al., 2021; Yang et al., 2022). The mitogenomes were sequenced using the Illumina HiSeq2000 and Xten platforms, with a paired-end read of 150 bp.
Genome assembly and annotation
Mitogenome assembly was performed using MITOBim version 1.8 (Hahn, Bachmann & Chevreux, 2013) and MitoZ version 2.4 (Meng et al., 2019). Geneious version 11.1.3 was utilized for mitogenome sequence annotation (Kearse et al., 2012), with closely related species serving as references for comparison with the assembled results. Most tRNAs were identified using tRNAscan-SE version 1.21 (Lowe & Eddy, 1997), and the remaining tRNAs, rRNAs, and CRs were identified by comparison with other closely related species. The secondary structures of the tRNAs of P. fuscatus were referred to from the results of tRNAscan-SE version 1.21 (Lowe & Eddy, 1997) and other avian mitogenomes (Yang et al., 2021; Yang et al., 2022). The conserved elements in CR1 of P. fuscatus were analyzed by referencing previous studies (Yang et al., 2022).
Characteristic analysis
The circular structures of the mitogenomes were plotted using the CGView Server (Grant & Stothard, 2008). The genome size and nucleotide composition were calculated using Geneious version 11.1.3 (Kearse et al., 2012), with the nucleotide bias calculated using the following formulas: AT-skew = (A −T)/(A+T) and GC-skew = (G −C)/(G+C) (Perna & Kocher, 1995). The relative synonymous codon usage (RSCU) and p-distance were evaluated using MEGA version 11 (Tamura, Stecher & Kumar, 2021). Tandem repeat sequences in the CRs were analyzed using the Tandem Repeats Finder version 20.10.2022 (Benson, 1999).
Dataset construction, phylogeny, and divergence
On the basis of previous taxonomic relationships (Mackiewicz et al., 2019), 41 Phylloscopus individuals representing 19 species and one outgroup taxon (Aegithalos concinnus concinnus) mitogenome were downloaded from GenBank to construct the phylogenetic dataset (Table S2). The phylogenetic topologies were reconstructed using the two methods of maximum likelihood (ML) and Bayesian inference (BI) based on the combined 13 PCGs and 2 RNAs, with 14,005 bp after the alignment.
Each PCG was first aligned with amino acids using MUSCLE in MEGA version 11 (Tamura, Stecher & Kumar, 2021) and then transferred into nucleotide sequences. Two RNAs were also aligned using MUSCLE. The concatenated datasets were generated using SequenceMatrix version 1.7.8 (Vaidya, Lohman & Meier, 2011). The best-fit model (GTR+I+G) was used to reconstruct the phylogenetic trees. The ML tree was created using IQ-TREE version 2.2.0 (Nguyen et al., 2015), with 5000 bootstrap replicates. The BI tree was analyzed using MrBayes version 3.1.2 (Ronquist & Huelsenbeck, 2003), with parameter settings of 2 independent runs with four simultaneous Markov chains for 2,000,000 generations and sampling every 100 generations. The first 25% of the generations was discarded as burn-in. The effective sample size (ESS) values were estimated using Tracer version 1.5 (Rambaut, Suchard & Drummond, 2004) with an ESS >200.
To further explore the phylogenetic relationships of leaf warblers, the mitochondrial cox1 gene with a larger sampling size of 127 individuals belonging to 37 Phylloscopus species was analyzed using A. concinnus concinnus as the outgroup (Table S2). DNA sequences were aligned using MUSCLE, and Gblocks was employed to extract the conserved sites, which were used to construct the phylogenetic tree. The ML tree was reconstructed using IQ-TREE version 2.2.0 (Nguyen et al., 2015), with 5,000 bootstrap replicates.
The divergence time was estimated based on the cytb gene of the sampled Phylloscopus species. The Bayesian procedure was implemented using BEAST version 1.10.4 (Drummond & Rambaut, 2007). The calibration points were selected from the two major clades of the Phylloscopus species 11.7 million years ago (mya) (Alström et al., 2018) and 1.97 mya for Phylloscopus canariensis and Phylloscopus collybita using the TimeTree website (http://www.timetree.org/). The parameters were defined as the GTR+I+G substitution model, uncorrelated relaxed clock, lognormal relaxed distribution, and Yule prior in the analyses. The results of the runs executing 10,000,000 generations were used, with the first 25% discarded as burn-in values.
Results
Mitogenome structure and organization
The whole mitogenomes of six Phylloscopus species were sequenced (GenBank accession no. MG681101, OR030349 –OR030353); three Phylloscopus species (P. fuscatus, P. reguloides, and P. trochiloides) were the first new records for these species in the GenBank database. The three Phylloscopus species (P. burkii, P. borealis, P. proregulus) have been available in the GenBank database, with corresponding accession numbers of KX977449 in P. burkii, NC_045526 in P. borealis, and NC_037189 in P. proregulus, respectively (Table S2). Several contents, such as the length, nucleotide composition, and initiation and termination codon, were slightly different between sampled three species and that of the GenBank database. For example, the length of P. borealis was 16,898 bp in the sampled species, while 16,881 bp in the database, with corresponding nucleotide composition of 28.8% A and 33.4% C in this study, while 28.9% A and 33.3% C in the NC_037189. The initiation and termination codon of nad3 (ATG and TAA) in P. burkii were different with that of KX977449 (GTG and TAG).
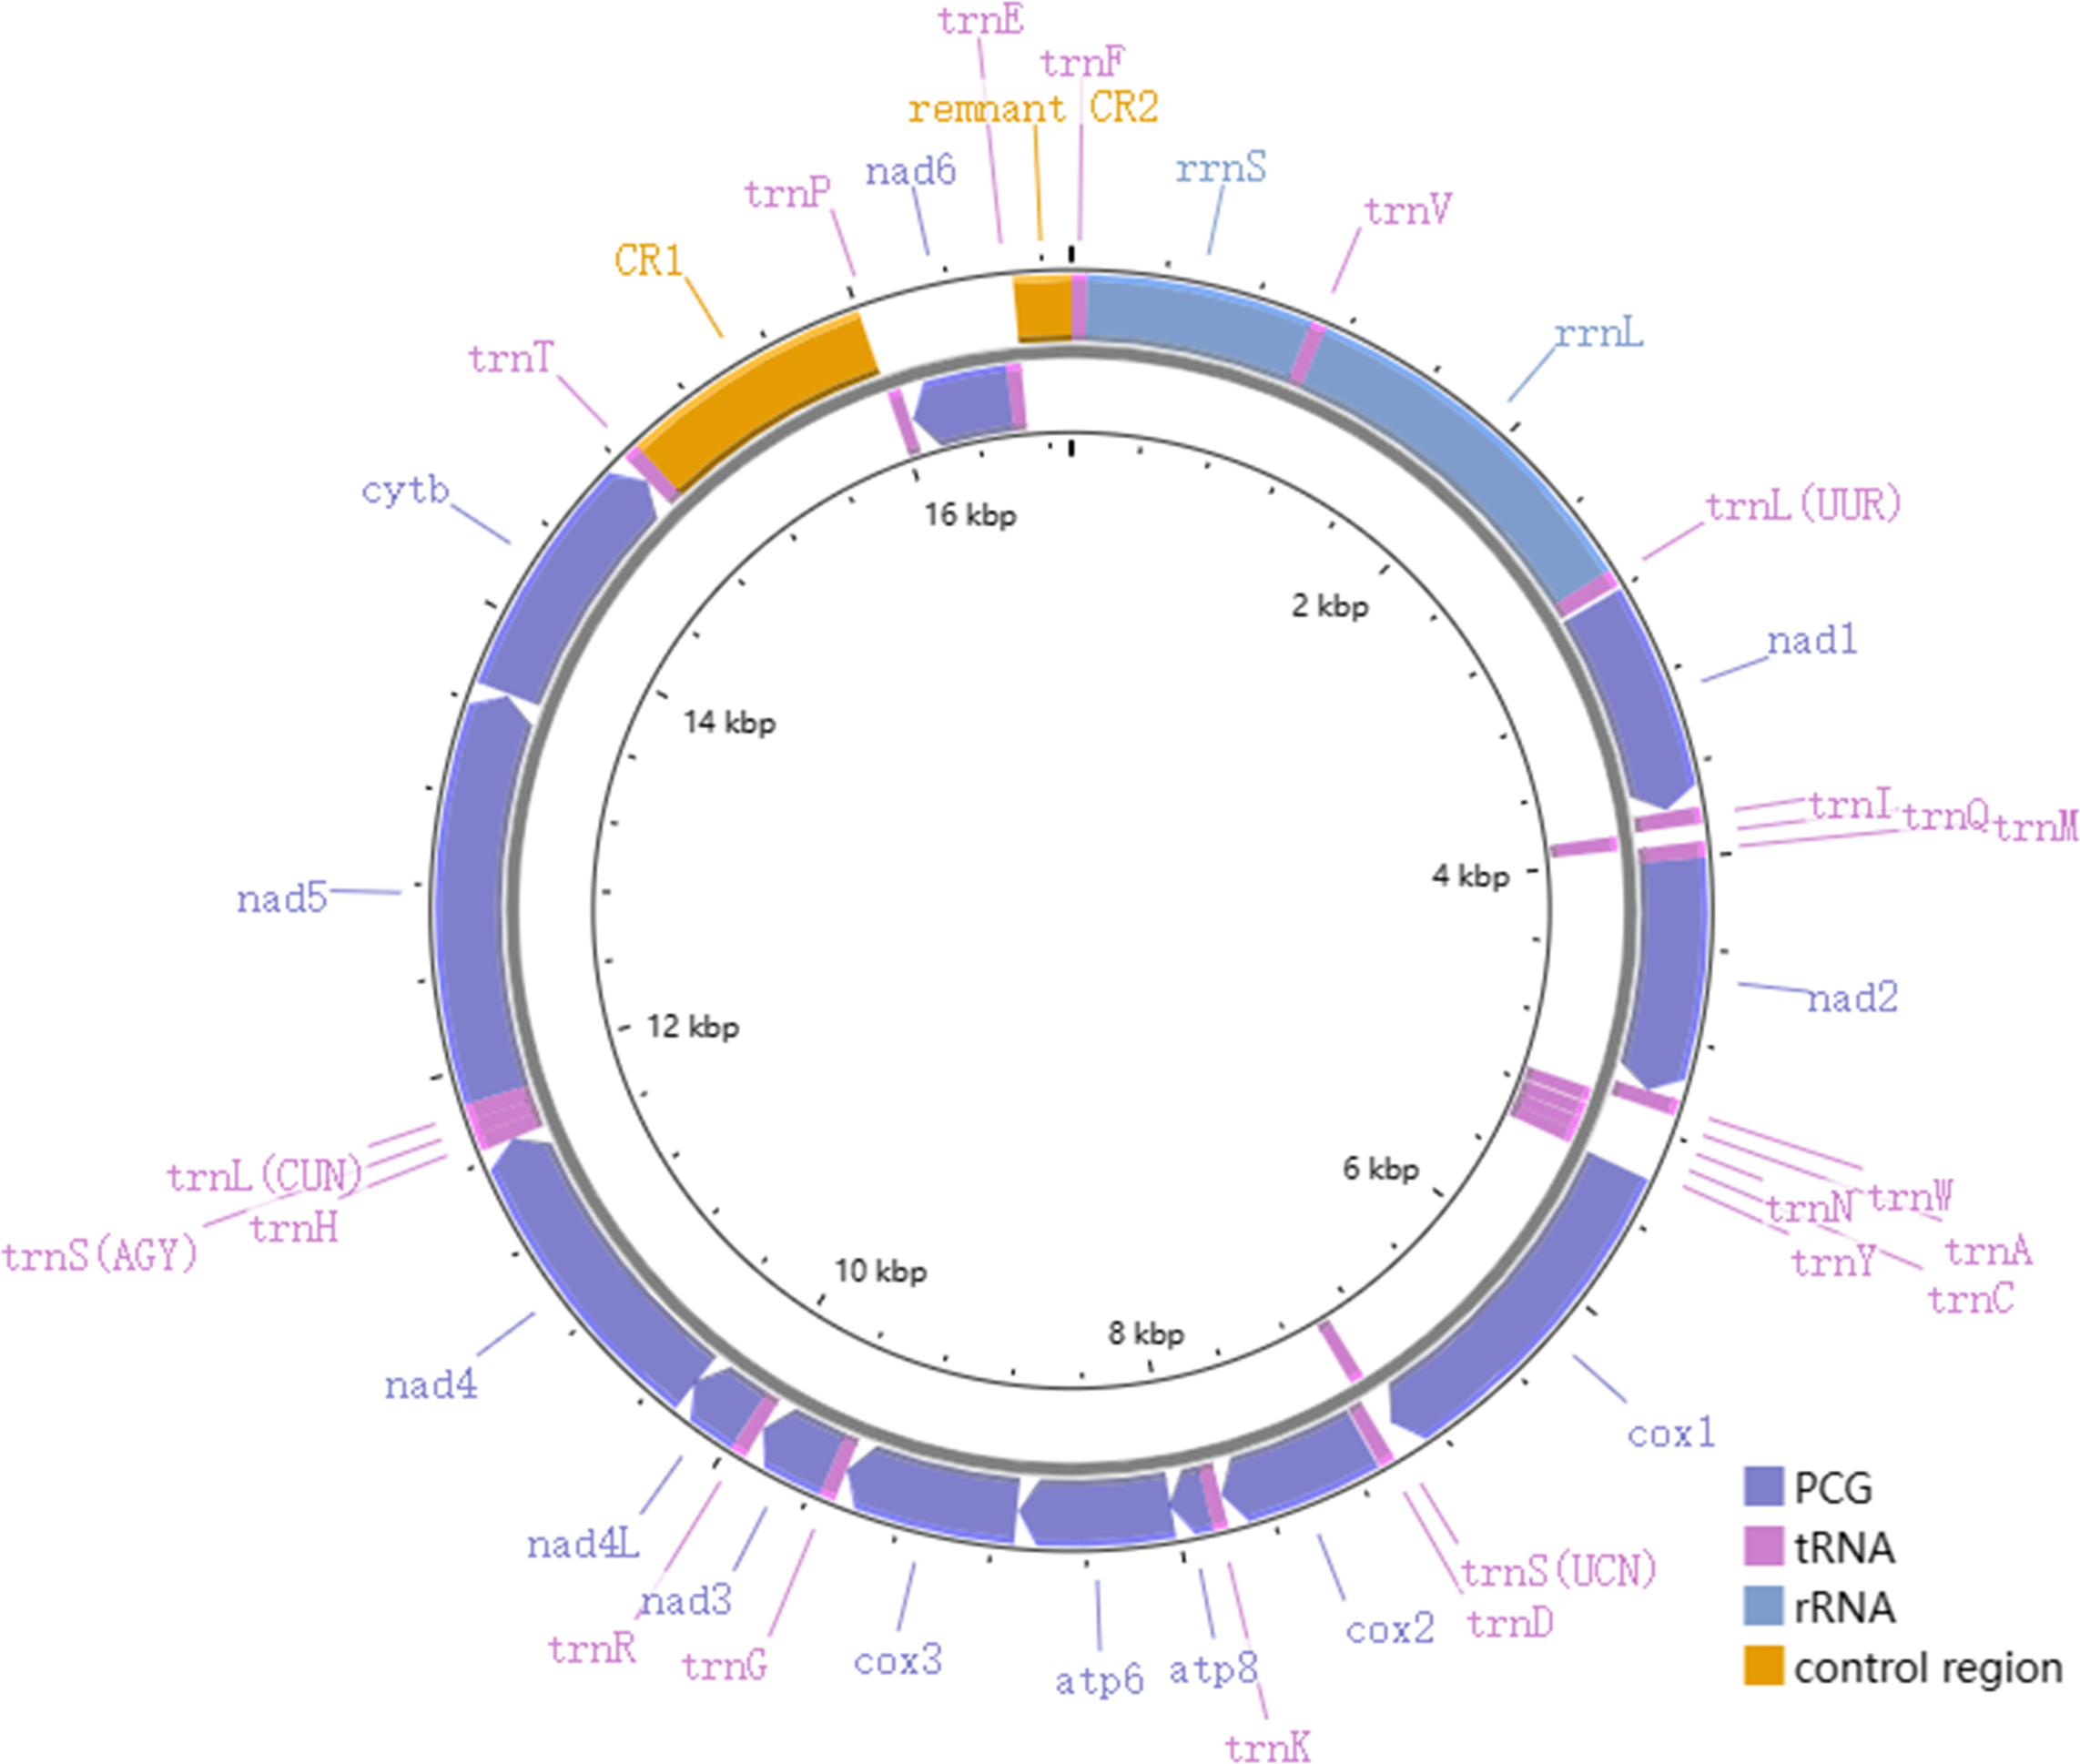
The total length of the mitogenomes ranged from 16,922 bp (P. fuscatus) to 17,007 bp (P. reguloides), similar to those of the other 35 Phylloscopus mitogenomes in the GenBank database (16,875–16,979 bp; Table S2). The length variation in the mitogenomes was probably due to the variable length of the control region, which was consistent with previous avian mitogenomic studies (Kundu et al., 2022). The mitogenomes contained 37 genes, comprising 13 PCGs, 22 tRNAs, and two rRNAs, as well as two non-coding control regions (CR1 and remnant CR2) (Fig. 1). Among them, nine genes (nad6 and eight tRNAs) were identified on the N strand; the remaining 28 genes were identified on the J strand (Fig. 1). The gene order of the six Phylloscopus mitogenomes was identical, and similar to that identified in other birds, such as P. proregulus (Jiao et al., 2018) and Alaudala cheleensis (Yang et al., 2021). The base composition of the mitogenomes was C>A>T>G in the whole mitogenome (Fig. 2A), with average values of 29.43% A, 32.75% C, 14.68% G, and 23.10% T. The A+T content (ranging from 52.3% to 53.1%) was slightly higher than that of G+C, which is typical for avian mitogenomes.

Figure 1: The mitogenome organization of Phylloscopus.
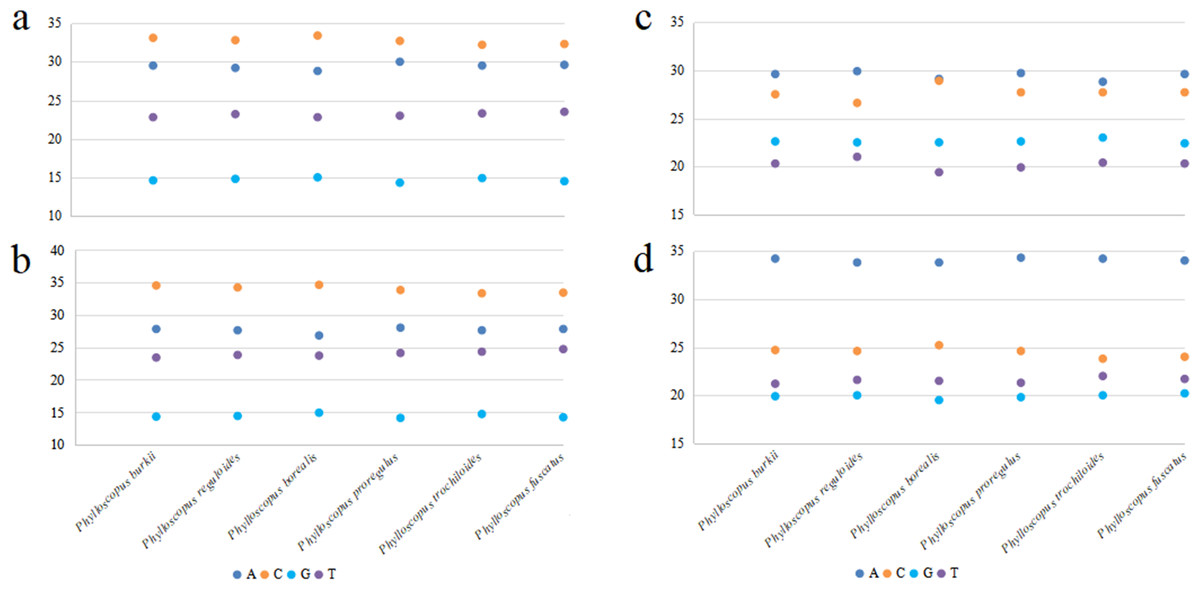
Figure 2: The base composition of mitogenomes in six Phylloscopus species.
(A) The whole mitogenome, (B) PCGs, (C) rrnS, (D) rrnL.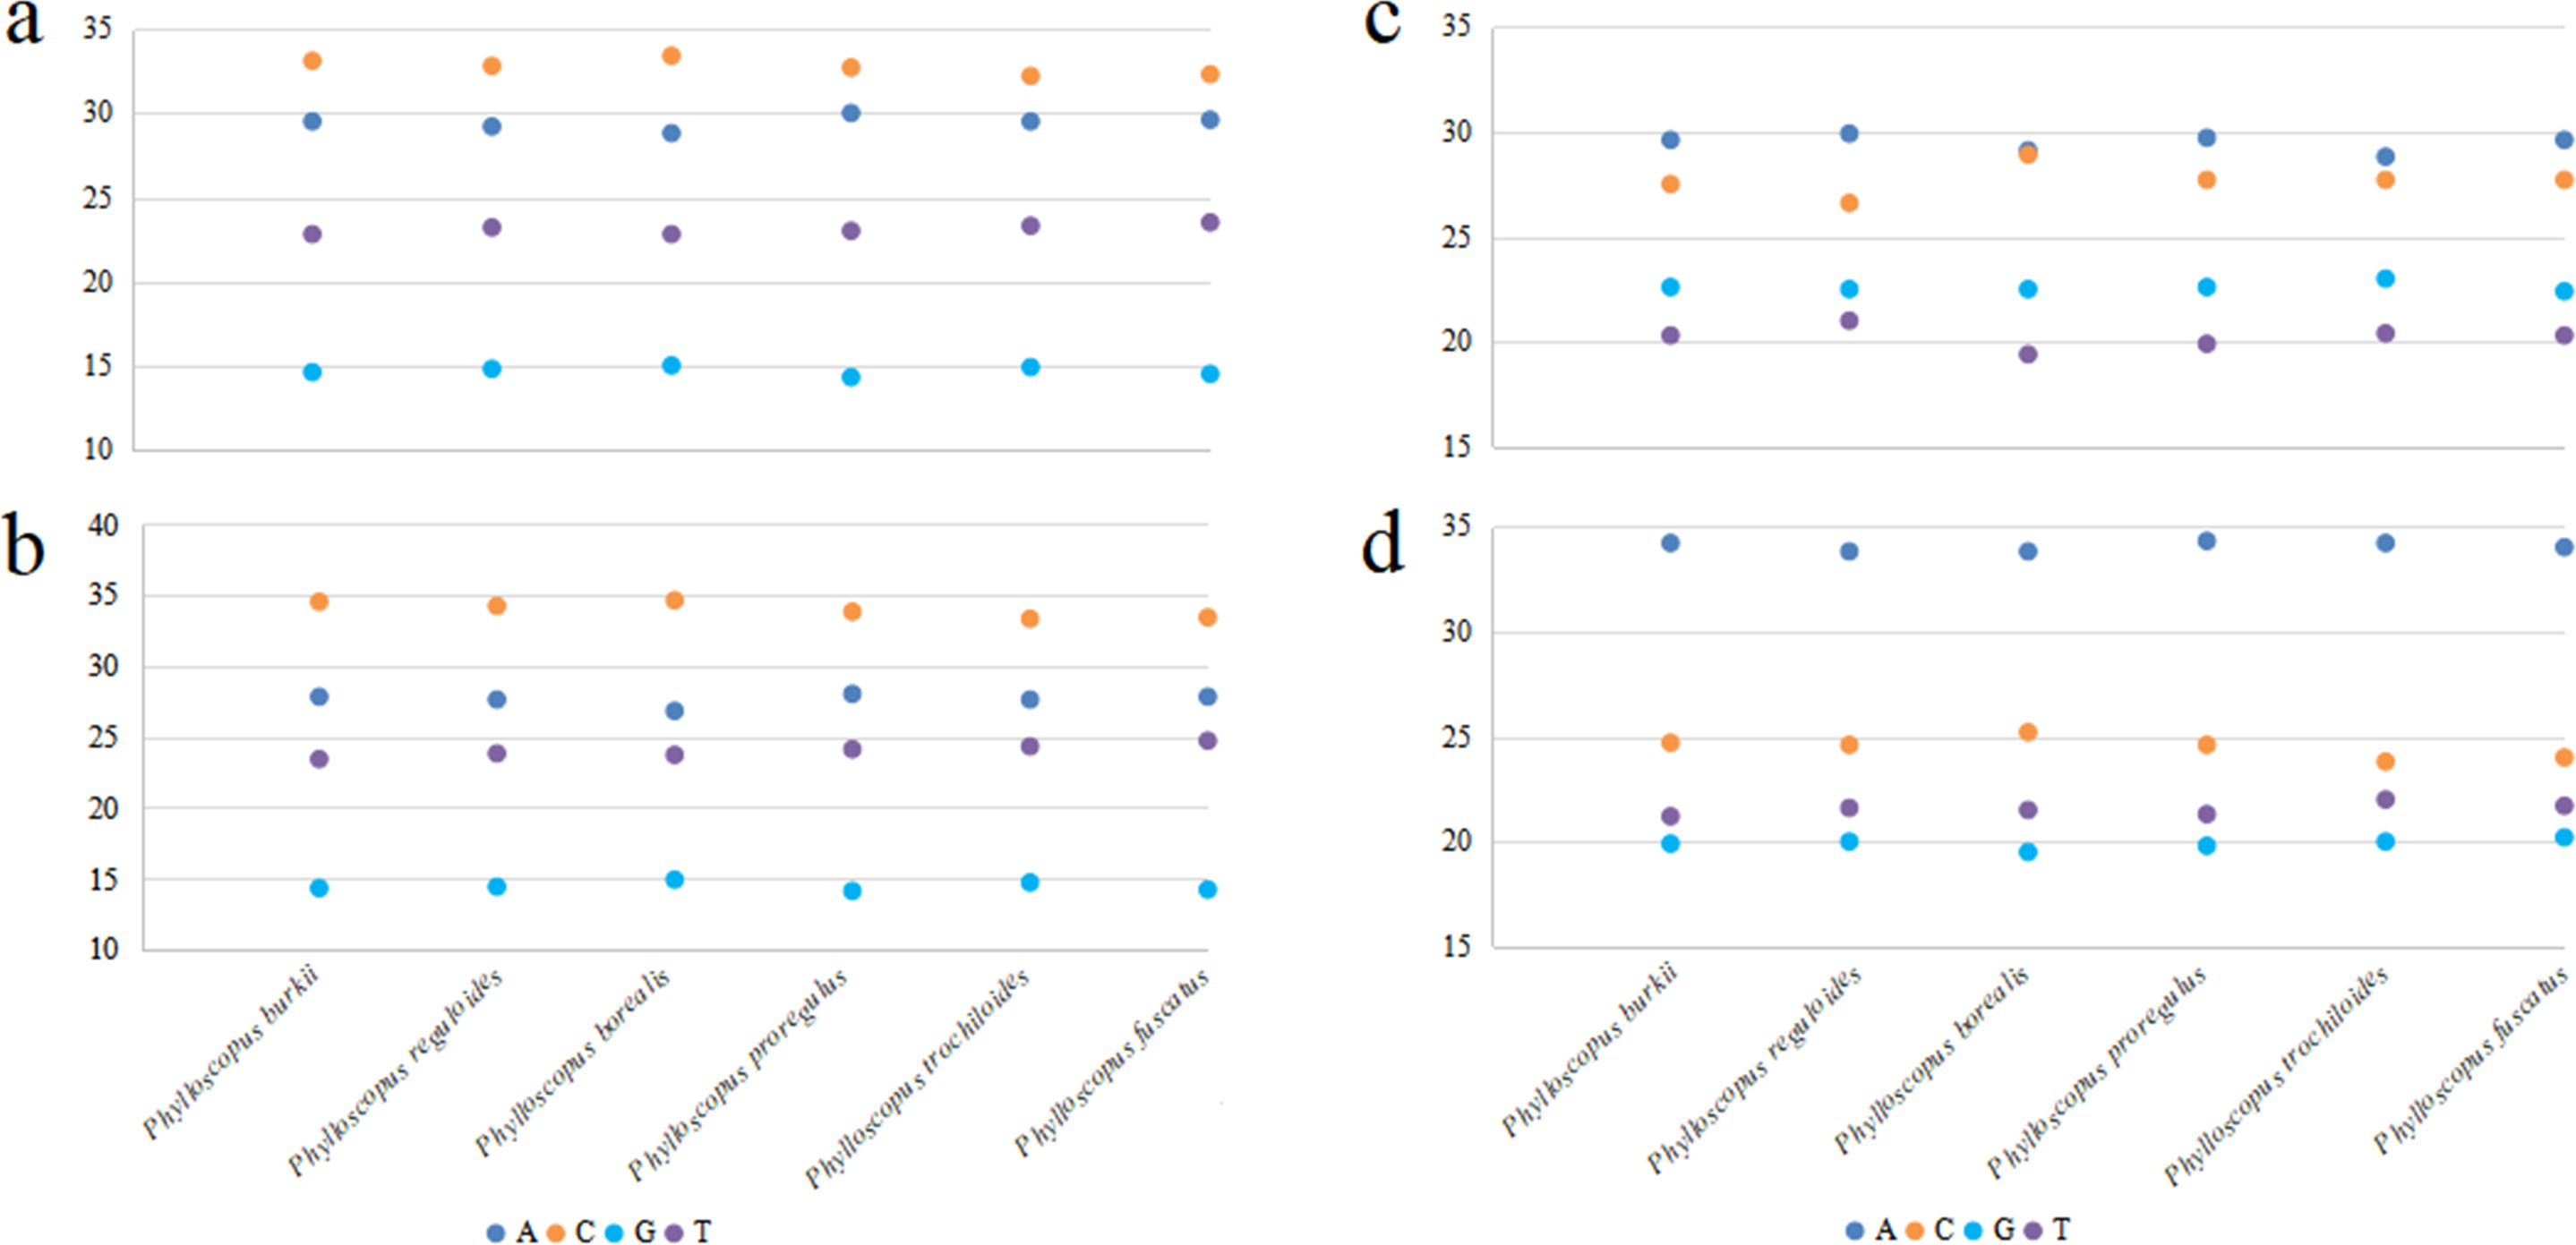
Protein-coding gene
The base composition of the PCGs (removing the termination codons) was C>A>T>G (Fig. 2B), with varied trends similar to those of whole mitogenomes. For different codon positions, the base composition C>A>G>T was observed in the first codons(Fig. S2A), T>C>A>G was observed in the second codons (Fig. S2B), and C>A>T>G was observed in the third codons (Fig. S2C).
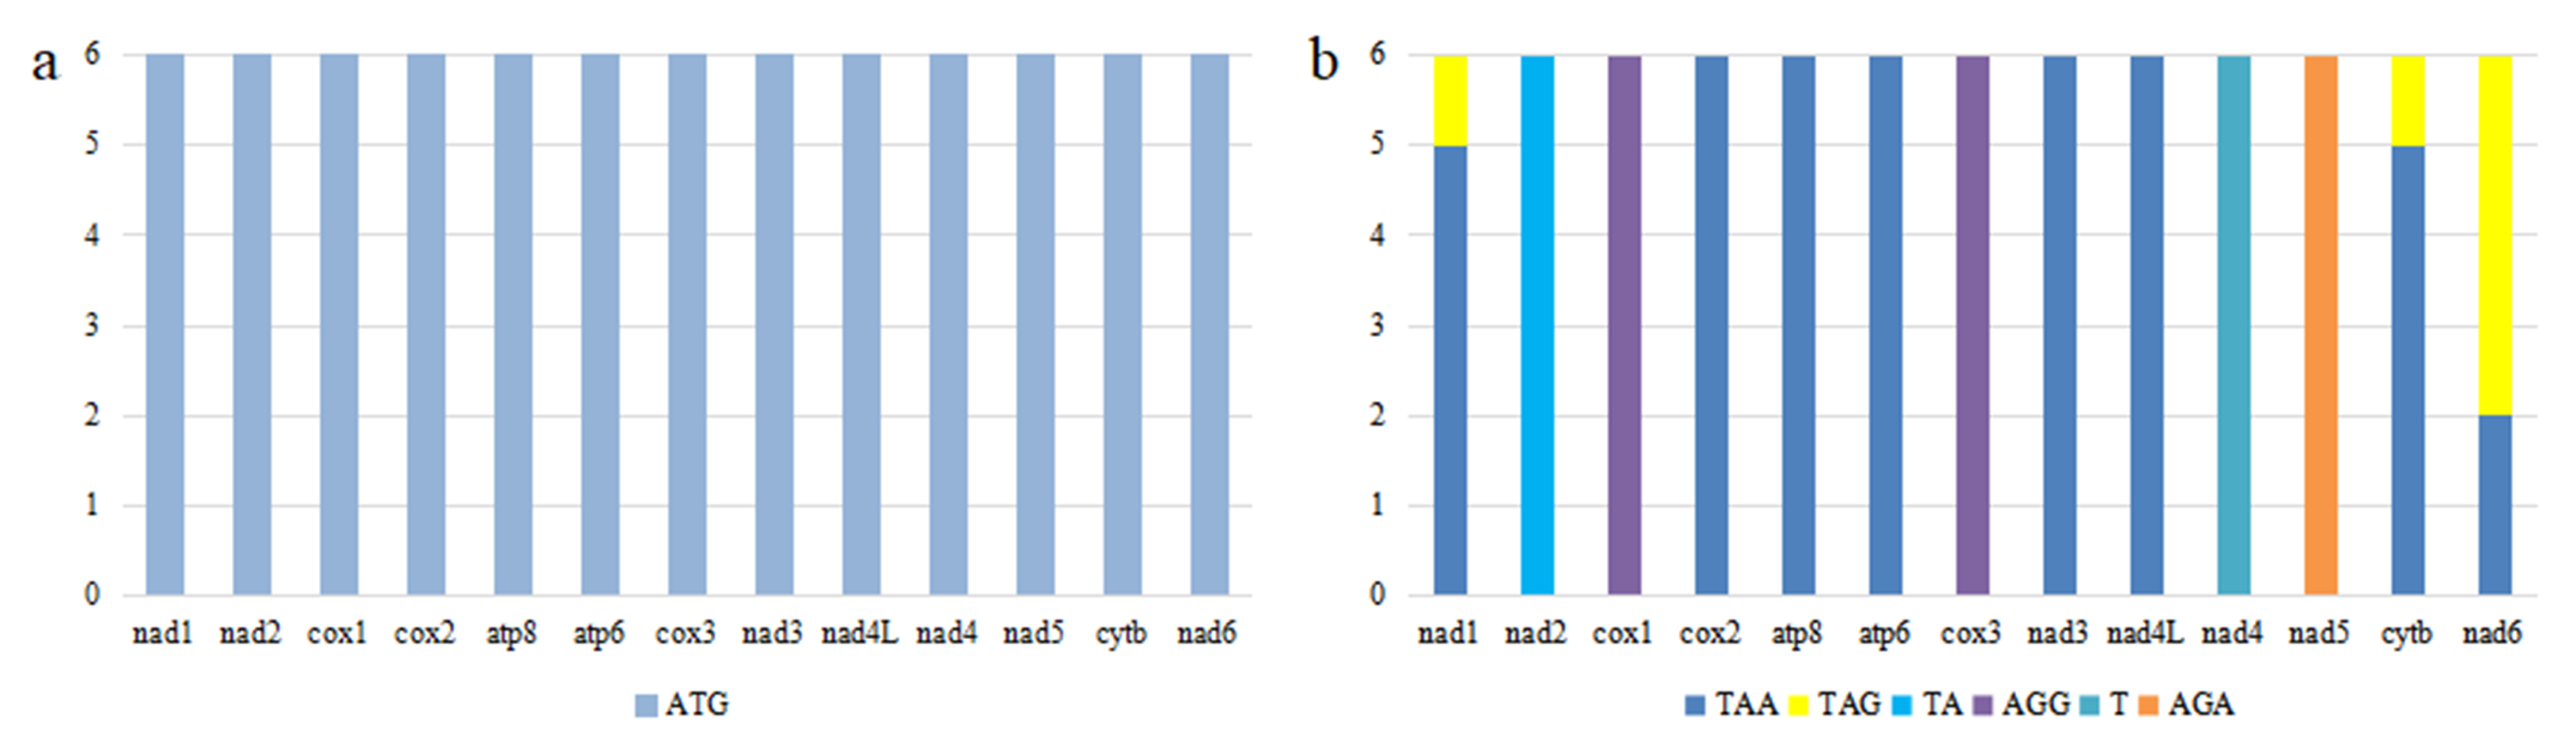
All PCGs of the six Phylloscopus species were initiated with an ATG start codon (Fig. S3A). Eight PCGs (nad1, cox2, atp8, atp6, nad3, nad4L, cytb, and nad6) had TAA or TAG as their termination codon, whereas AGG was the termination codon of cox1 and cox3, AGA was the termination codon of nad5, GAA was the termination codon of nad3, incomplete TA was the termination codon of nad2, and T was the termination codon of nad4 (Fig. S3B). The initiation codon of ATG and the termination codon of TAA are widely present in avian mitogenomic PCGs (Morinha et al., 2016; Hu et al., 2017; Yang et al., 2022). The incomplete T of nad4 has also been observed in several avian PCGs such as Pyrrhocorax pyrrhocorax and Pyrrhocorax graculus (Morinha et al., 2016). The plausible explanation for incomplete codons is the post-transcriptional polyadenylation process, which adds 3′ A residues to the mRNA, generating a TAA stop codon (Ojala, Montoya & Attardi, 1981).
The RSCU values of the PCGs were similar in the six Phylloscopus species, with L2 having the highest value and L1 having the lowest value (Fig. S4). The whole RSCU content was similar to other avian mitogenomes (Yang et al., 2021). Codons ending with A and C were more frequent than those ending with U and G, as noted in previously reported research (Yang et al., 2021). CUA(L2), CGA(R), UCC(S2), and GCC(A) were the most frequently used codons (Fig. S4).
RNA gene
All six Phylloscopus mitogenomes contained rrnS and rrnL of rRNA, and were located between trnF and trnL (UUR) and separated by trnV (Fig. 1). The total length of rrnS ranged from 974 bp (P. fuscatus) to 988 bp (P. borealis), and rrnL from 1,598 bp (P. fuscatus) to 1,602 bp (P. burkii and P. borealis). The base composition varied trend was A>C>G>T in rrnS (Fig. 2C), and the A+T content ranged from 48.5% (P. borealis) to 50.9% (P. reguloides). The base composition varied trend was A>C>T>G in rrnL (Fig. 2D), and the A+T content ranged from 56.2% (P. trochiloides) to 55.3% (P. borealis).
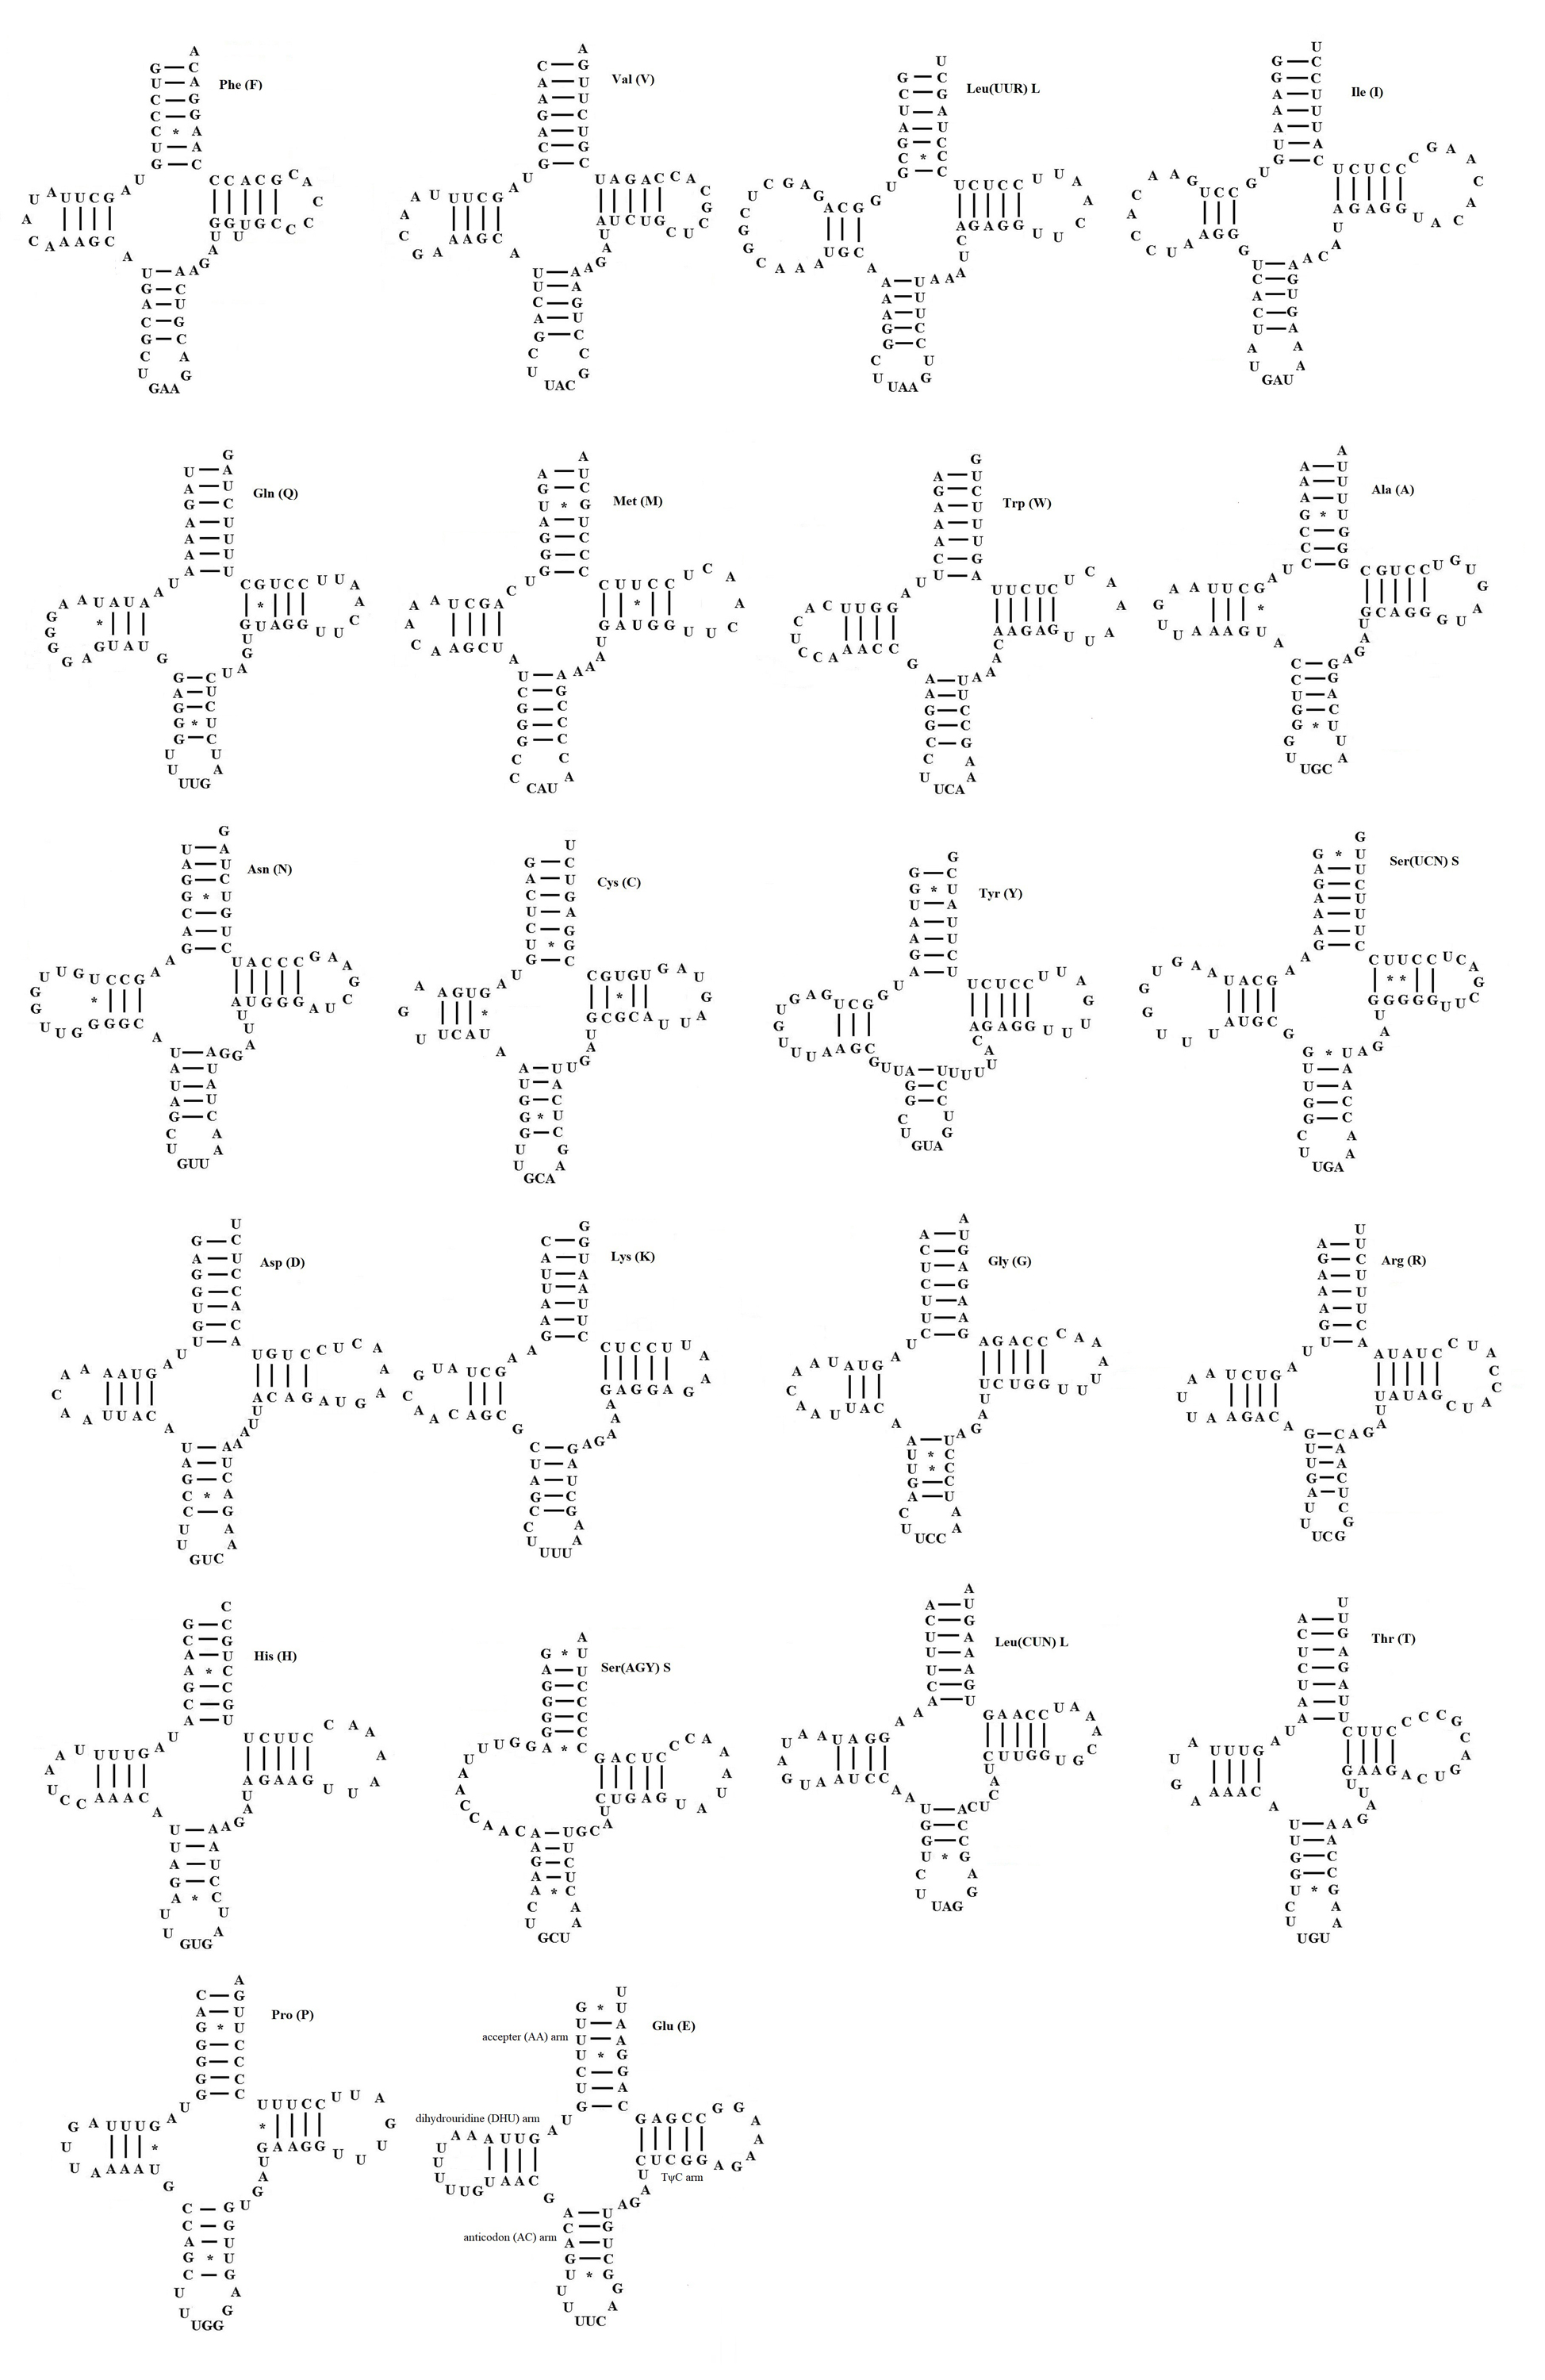
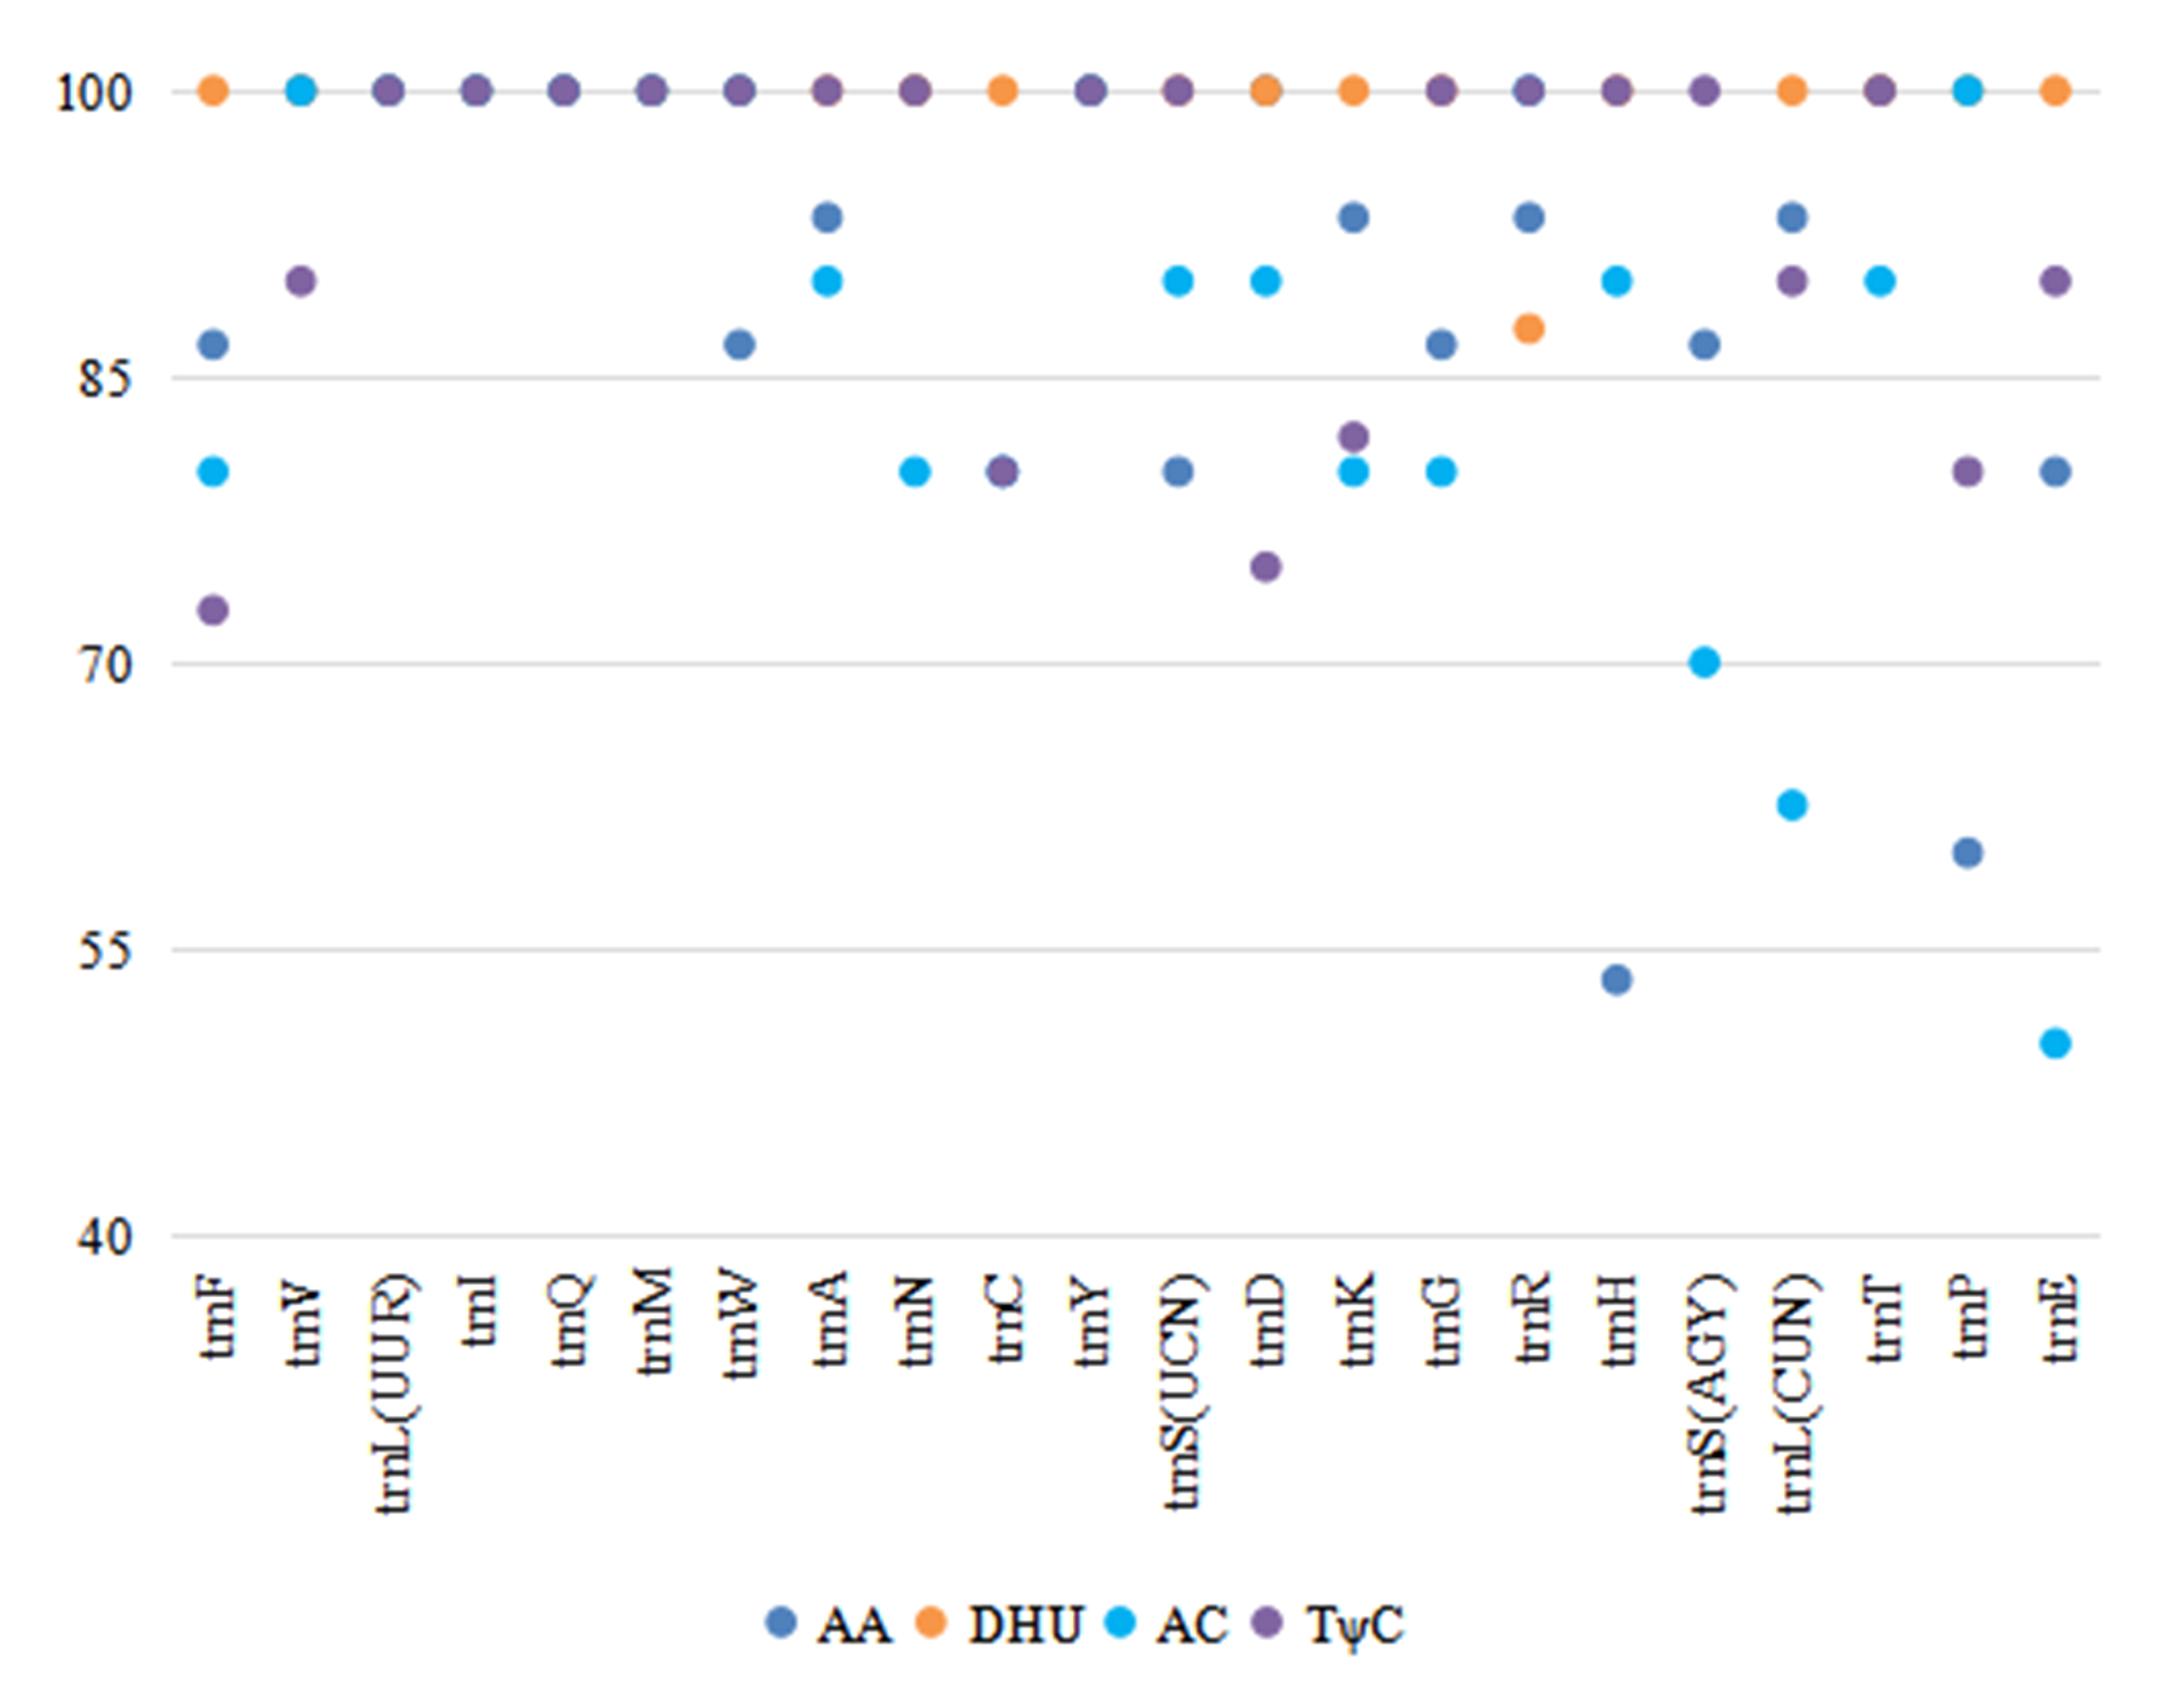
The length of the tRNA genes of the six Phylloscopus mitogenomes ranged from 66 bp (trnS (AGY)) to 75 bp (trnL (UUR)). In total, 21 tRNAs were folded into a classical clover-leaf secondary structure in the P. fuscatus mitogenome (Fig. S5). trnS (AGY) lacked the dihydrouridine (DHU) arm, which is a common feature of avian mitogenomes in Passeriformes (Gao, Huang & Lei, 2013), Galliformes (Li, Huang & Lei, 2015), Charadriiformes (Hu et al., 2017), Piciformes (Bi et al., 2019), and Accipitriformes (Jiang et al., 2019). There were several pair mismatches in the stems; G-U was the most abundant type. Other patterns were observed, such as A-C in the amino acid accepter (AA) arm of trnF, C-C in the AA arm of trnV, and U-C in the anticodon (AC) arm of trnG (Fig. S5), which could be corrected by an RNA-editing process (Lavrov, Brown & Boore, 2000). When comparing all six Phylloscopus species, the loop sequences varied more often than those of the stems. Several stem sequences were completely conserved, such as the stems in trnL (UUR), trnI, trnQ, trnM, and trnS (UCN) (Fig. S6). The highest conserved site of the four arms of tRNA was the DHU arm, whereas the lowest was the AC arm (Fig. S6).
Control region
The nucleotide composition of CR1 was C>T>A>G (Fig. S7A); that of remnant CR2 was C>A>T>G (Fig. S7B). The A+T contents of CR1 and remnant CR2 were slightly higher than in G+C, which is similar to that of A. cheleensis (Yang et al., 2021). The base skew results show that CR1 had a slight T-skew and an obvious C-skew (Fig. S7C). Remnant CR2 contained a medium A-skew and an obvious C-skew (Fig. S7D). The base composition and skew were similar to other Sylvioidea species (Yang et al., 2021).
Tandem repeats have previously been identified in avian mitogenomic CRs (Ritchie & Lambert, 2000; Mundy & Helbig, 2004; Cho et al., 2009; Omote et al., 2013; Yang et al., 2021; Kundu et al., 2022). Unique tandem repeat sequences were identified in both Fregata minor and F. magnificens, which could be used as species-specific markers (Kundu et al., 2022). For the tandem repeat sequences in the CRs of the six Phylloscopus mitogenomes, a consensus size of 46 bp (CATTTCATTAAACTCGCAAAGCCTACCAAACAACCGCATTCACACC) was observed in remnant CR2 of P. fuscatus, with a copy number of 2.0. A consensus size of 45 bp (AACCAAACCTATCCCAAACCCCCCTCCCACTAAAAAACAAACAAA) was identified in remnant CR2 of P. proregulus, with a copy number of 2.3.
P. fuscatus CR1 could be divided into three domains, including ETAS (extended termination-associated sequence) domain I (nt 1–424), central conserved domain II (nt 425–859), and CSB (conserved sequence block) domain III (nt 860–1,104). This is similar to other avian mitogenomic CRs (Bi et al., 2019; Yang et al., 2021). Conserved box sequences have previously been identified in avian CRs (Randi & Lucchini, 1998; Li, Huang & Lei, 2015; Aleix-Mata et al., 2019). Several motifs have also been observed in P. fuscatus CR1, including C-string (CCCCCCCCCTCCCCCCCC) in domain I; F (GCGCTTCTCACGAGAACCGAGCTACTCAAT), E (GTTATTGGCGTCAGGGA CAT), D (CCTCCCGTGGTAACTTCAGGACCAT), C (CTGCCCTTCACTGATACTAGTGGTC GGTT), bird similarity (CACTGATGCACTTTG), and B (TCCCATTCATGGAC) boxes in domain II; and CSB1 (TATATAATGCAATGGTCACCGGACATG) in domain III. Sequences of the bird similarity box were completely conserved in CR1 of the six Phylloscopus species. Motifs of CSB2, CSB3, the origin of heavy-strand replication (O H), and light- and heavy-strand transcription promoters (LSP/HSP) were not identified in P. fuscatus CR1, which was similar to other birds (Gao, Huang & Lei, 2013).
Phylogenetic and divergence analysis
The phylogenetic trees (ML and BI) revealed identical topologies that were supported by bootstrap values (BSs) in the ML tree (Fig. 3A) and posterior probabilities (PPs) in the BI tree at most nodes (Fig. 3B). The relationships of the genus Phylloscopus strongly supported a division into two major clades, including eight species contained in clade I (Phylloscopus coronatus, P. burkii, P. reguloides, P. trochiloides, Phylloscopus borealoides, Phylloscopus tenellipes, P. borealis, and Phylloscopus examinandus) and eleven species in clade II (Phylloscopus inornatus, P. proregulus, Phylloscopus sibilatrix, Phylloscopus occisinensis, Phylloscopus schwarzi, P. fuscatus, Phylloscopus trochilus, Phylloscopus ibericus, Phylloscopus sindianus, Phylloscopus collybita, and Phylloscopus canariensis) (Fig. 3). Compared with a previous study, the taxa included in clade I corresponded with clade α of the phylogenetic tree, based on one mitochondrial gene (cytb) and three nuclear segments (ODC, myoglobin, and GAPDH), whereas the taxa in clade II were consistent with clade β (Alström et al., 2018).
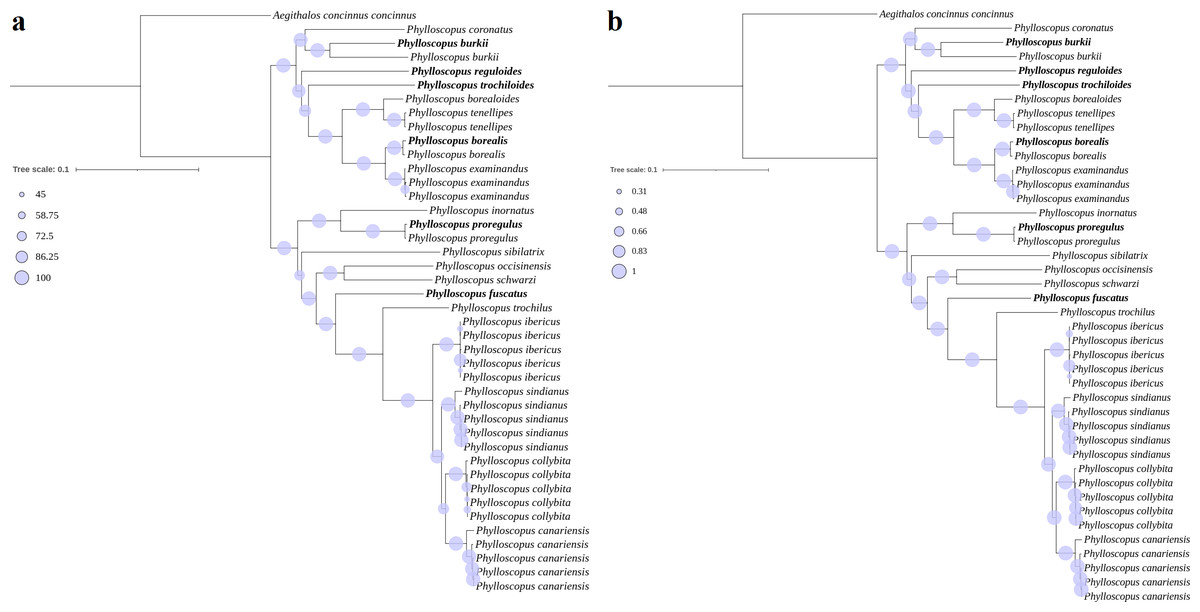
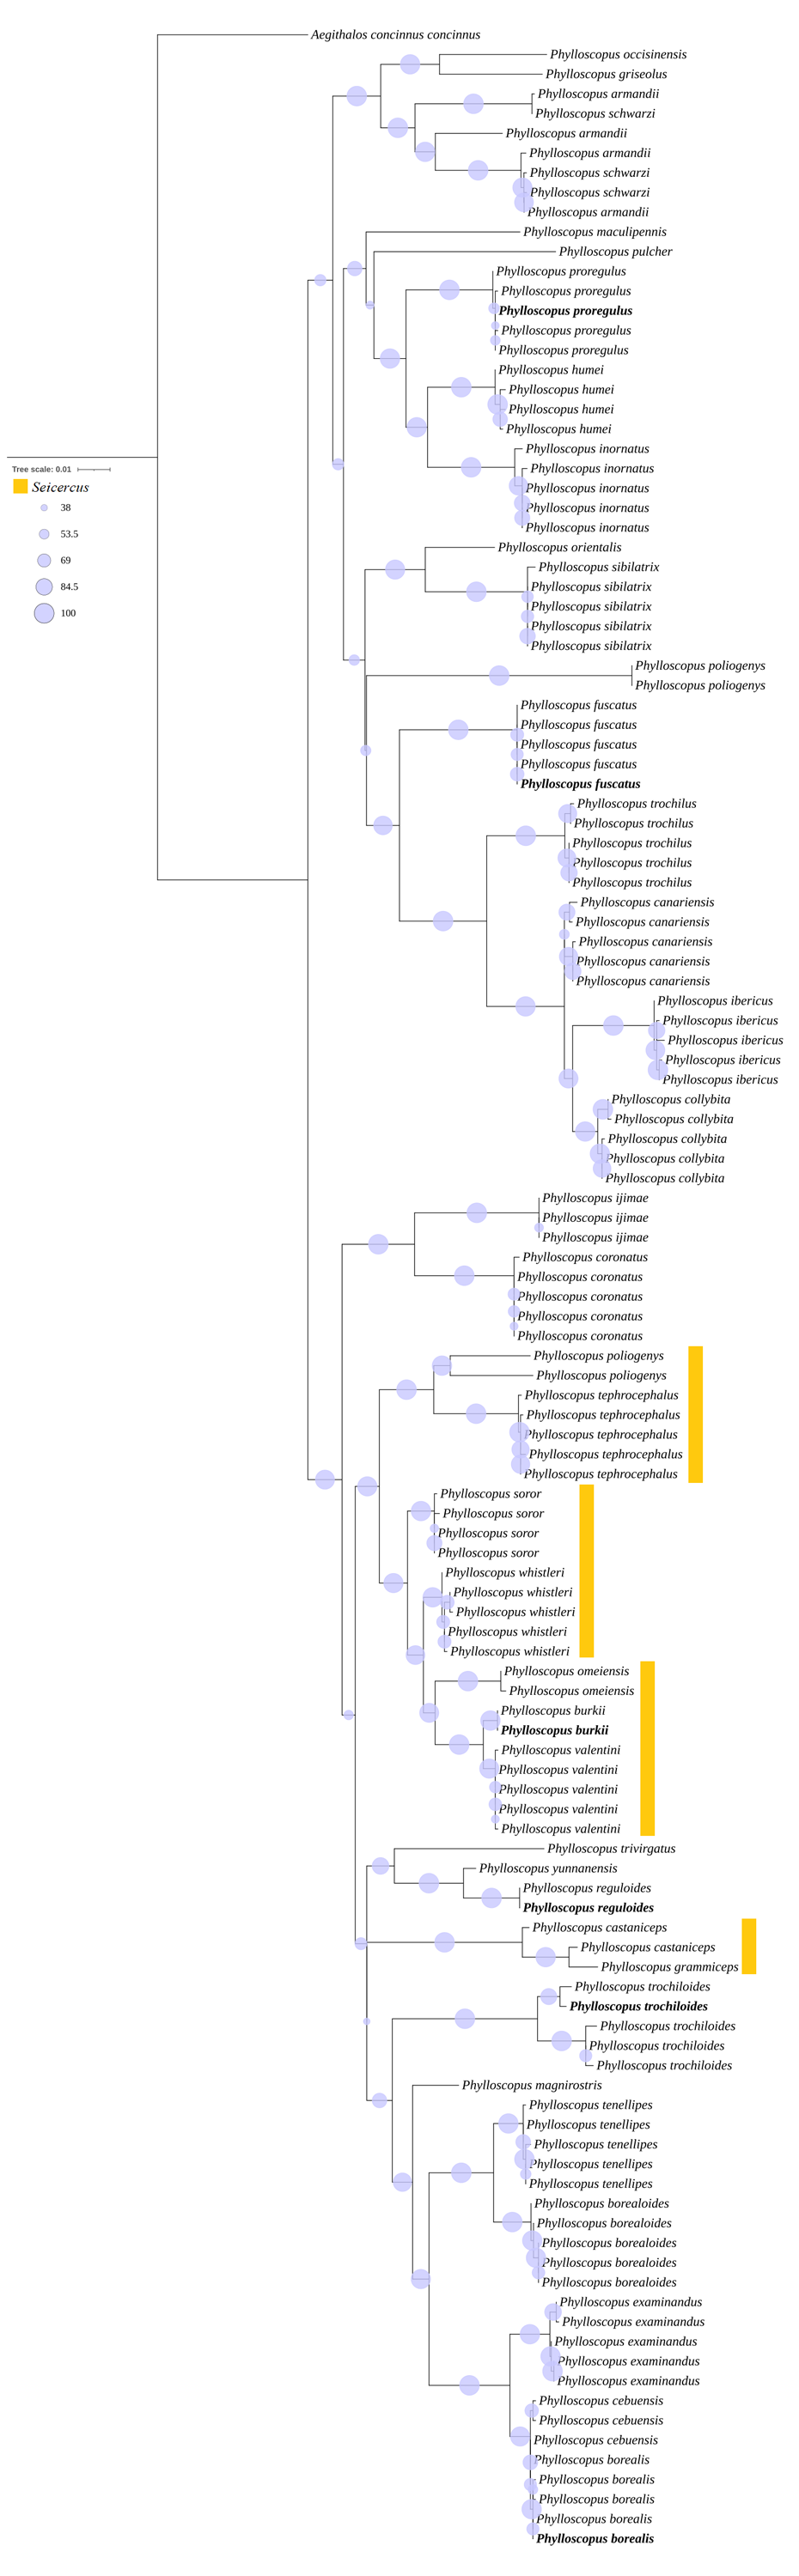
Figure 3: Phylogenetic trees reconstructed using PCG combining with RNA datasets.
(A) MI, (B) BI, the newly sequenced mitogenome sequences labelled with bold format.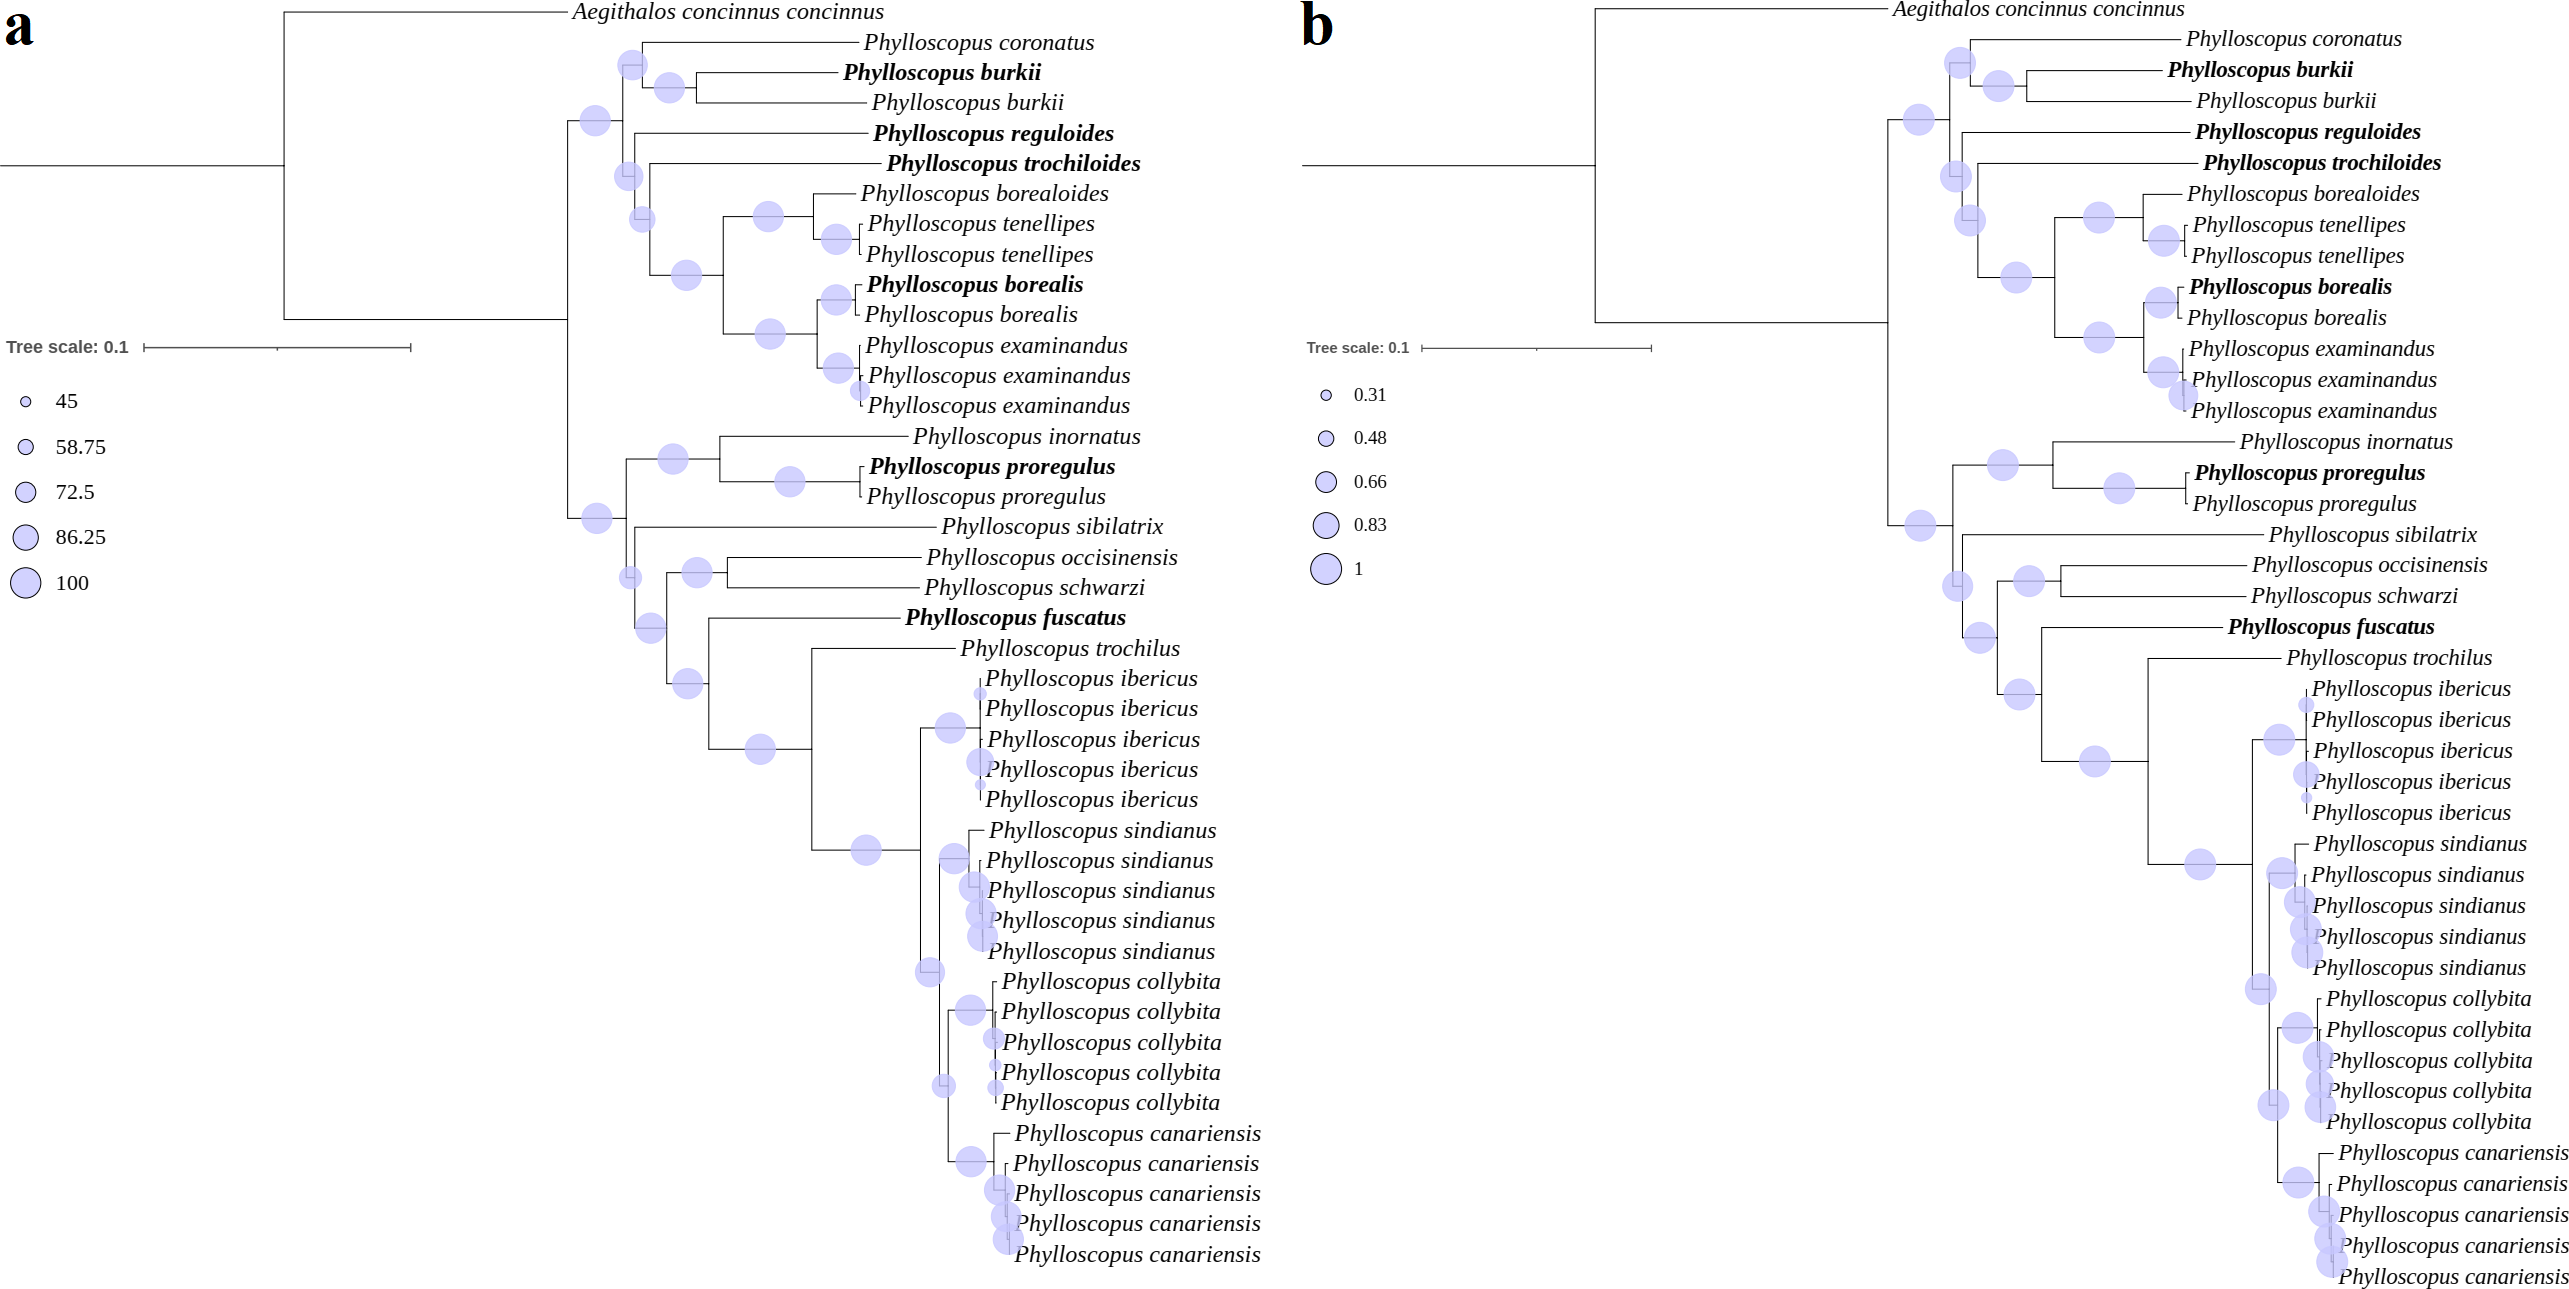
For clade I, P. borealis and P. examinandus, P. borealoides and P. tenellipes, and P. coronatus and P. burkii formed sister groups, with relatively higher BSs and PPs (Fig. 3). P. burkii traditionally belonged to the genus Seicercus; this species formed a strongly supported sister group with P. coronatus (BS = 98; PP = 1.0), which indicated that P. burkii was nested within Phylloscopus. The clade of P. coronatus/P. burkii was located at the basal position of clade I (BS = 100 and PP = 1.00). For clade II, P. collybita and P. canariensis, P. occisinensis and P. schwarzi, and P. inornatus and P. proregulus formed sister groups; these also contained higher BSs and PPs in the phylogenetic trees. The clade of P. inornatus/P. proregulus was at the basal position of clade II (BS = 100 and PP = 1.00).
A further phylogenetic tree based on the cox1 gene also showed that two major cldaes contained in Phylloscopus, and the species traditionally classified within genus Seicercus was nested within that of Phylloscopus (Fig. S8). The clade containing Phylloscopus castaniceps and Phylloscopus grammiceps, which used to belong to the Seicercus genus, was grouped with the Phylloscopus species (BS = 100).
The lowest p-distance value based on the PCG dataset was found between P. borealis and P. examinandus (0.0338), while the highest value was identified between P. trochiloides and P. collybita (0.1483) (Table S3). The relatively lower genetic distance between P. borealis and P. examinandus, and between P. tenellipes and P. borealoides (0.0353) showed closely phylogenetic relationship (Table S3), which consistent with the result of phylogenetic tree based on the PCG+RNA dataset with sister groups, respectively (Fig. 3). In addition, the lowest p-distance value based on cox1 gene was identified between Phylloscopus cebuensis and P. borealis (0.00360), while the highest value was found between P. ibericus and Phylloscopus ijimae (0.16109) (Table S4). The relatively lower genetic distance between P. cebuensis and P. borealis, and between Phylloscopus valentini and P. burkii (0.01583) showed closely phylogenetic relationship (Table S4), which consistent with the result of phylogenetic tree based on cox1 gene with sister groups, respectively (Fig. S8).
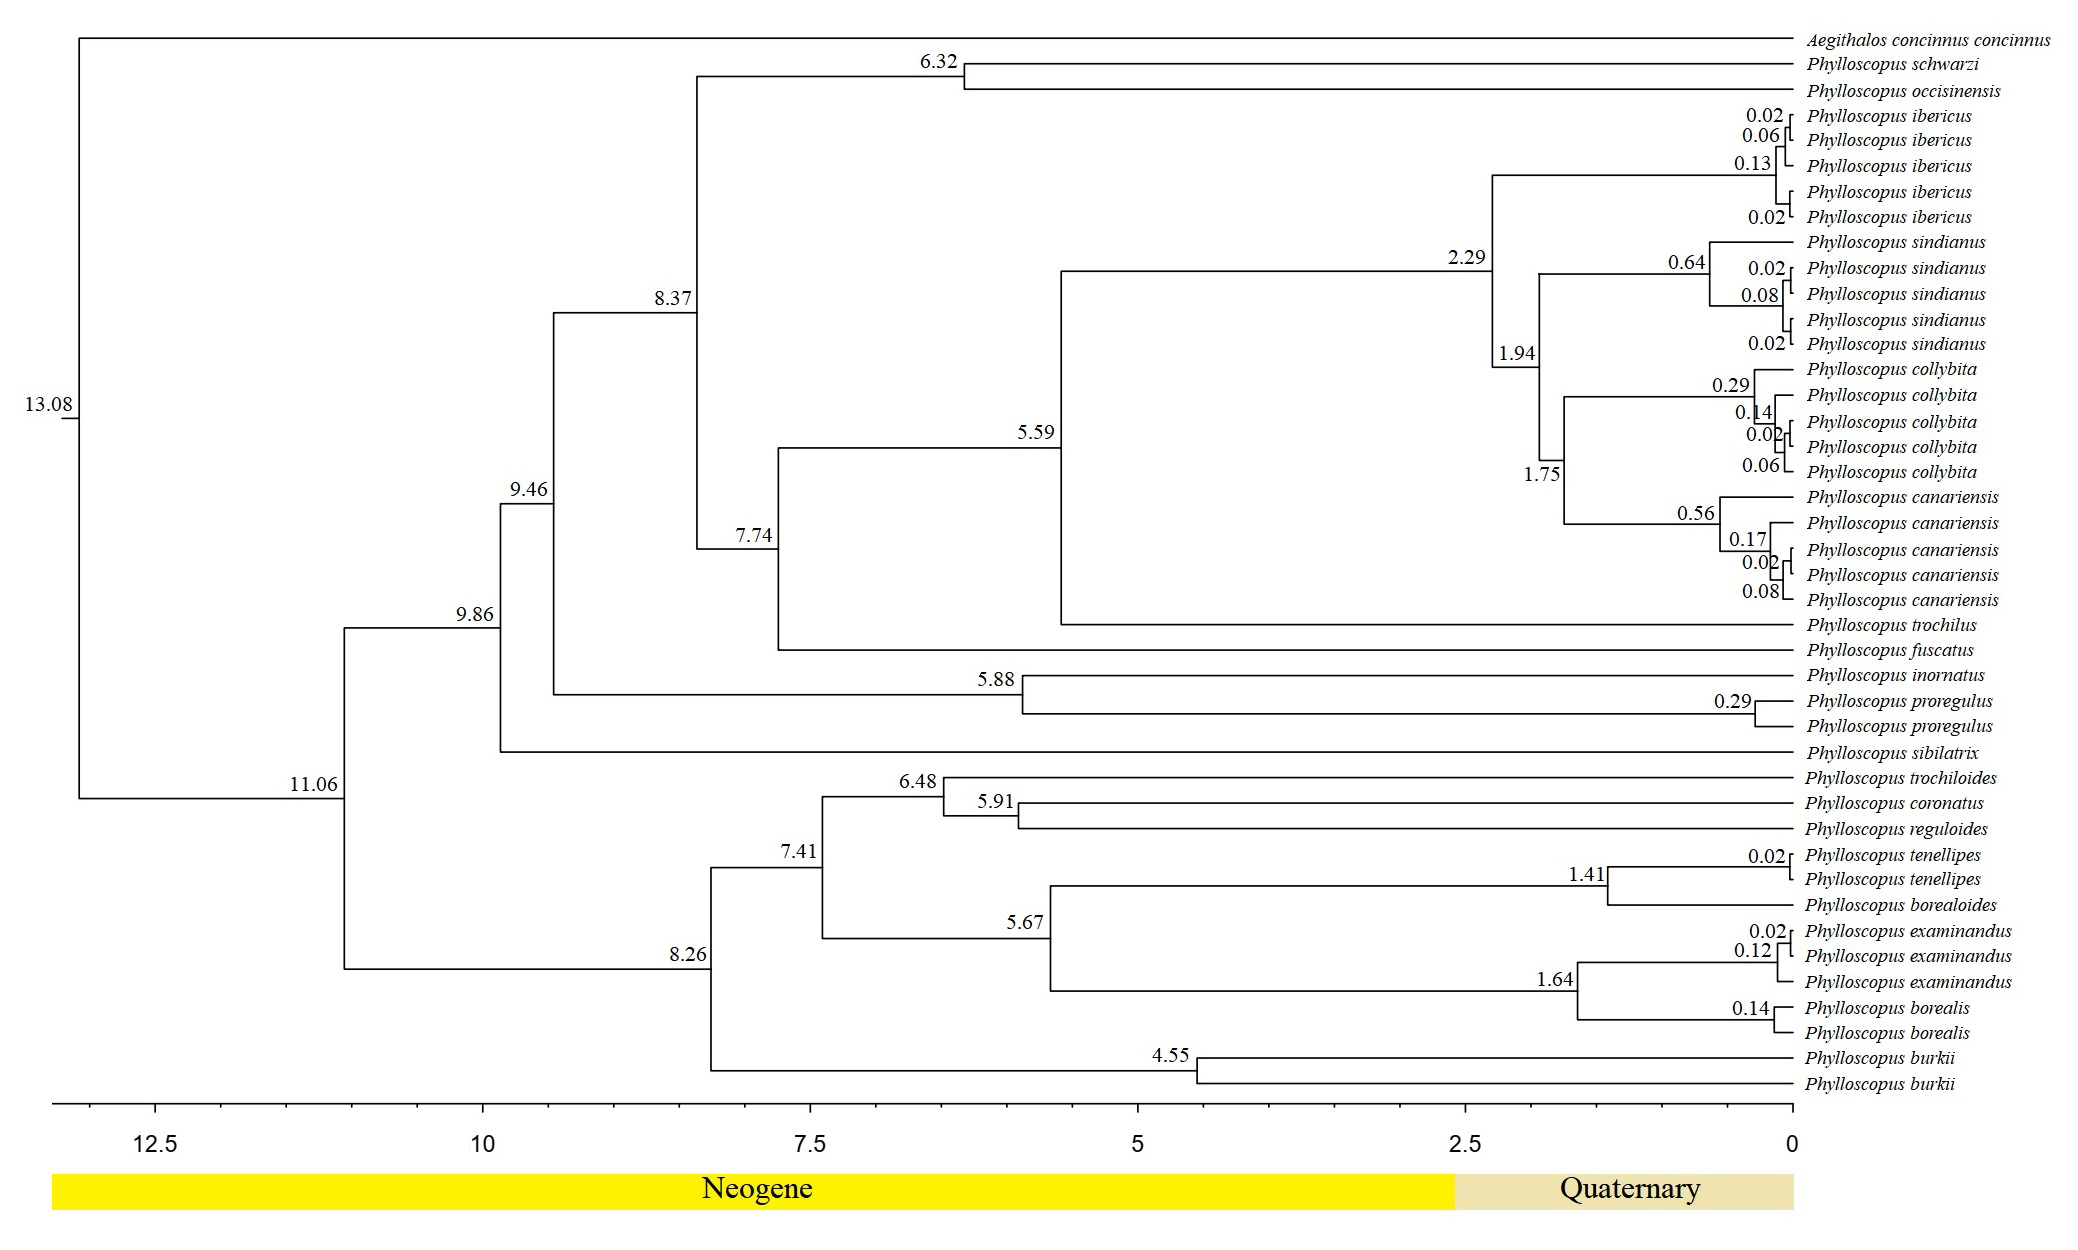
The divergence time results were similar to those in previous studies (Fig. S9) (Alström et al., 2018). The two clades split at 11.06 mya during the Tortonian stage of the Miocene, with a 95% HPD of 7.53–14.77 mya. This is similar to other results based on mitochondrial genes and nuclear segments (Päckert et al., 2012; Alström et al., 2018). The divergence times of the clade containing P. canariensis, P. collybita, P. sindianus, P. ibericus, and P. trochilus in clade II were analyzed. The divergence time between P. canariensis and P. collybita was 1.75 mya; between P. sindianus and P. canariensis/P. collybit it was 1.94 mya; between P. ibericus and P. canariensis/P. collybit/P. sindianus it was 2.29 mya; and between P. trochilus and P. canariensis/P. collybita/P. sindianus/P. ibericus it was 5.59 mya. These results are similar to those of Alström et al. (2018).
The divergence times between the sister species ranged from 1.41 mya to 5.91 mya. In clade I, P. borealis and P. examinandus split at 1.64 mya, P. borealoides and P. tenellipes split at 1.41 mya, and P. coronatus and P. reguloides split at 5.91. In clade II, P. collybita and P. canariensis split at 1.75 mya, P. occisinensis and P. schwarzi split at 6.32 mya, and P. inornatus and P. proregulus split at 5.88 mya (Fig. S9). Among them, the sister groups between P. borealis and P. examinandus, P. borealoides and P. tenellipes, and P. collybita and P. canariensis represented relatively young Phylloscopus pairs, whereas those between P. coronatus and P. reguloides, between P. occisinensis and P. schwarzi, and between P. inornatus and P. proregulus were the old sister pairs.
Discussion
Gene rearrangements
We observed that a gene rearrangement of cytb-trnT-CR1-trnP-nad6-trnE-remnant CR2-trnF-rrnS existed in the six Phylloscopus mitogenomes, which was different from the typical cytb-trnT-trnP-nad6-trnE-CR-trnF-rrnS of the avian gene order (Urantówka et al., 2018; Mackiewicz et al., 2019) (e.g., Gallus gallus). Such gene rearrangements of the Phylloscopus species have also been observed in other birds (Mackiewicz et al., 2019; Urantówka, Kroczak & Mackiewicz, 2020; Yang et al., 2021). Avian mitogenomic gene rearrangements, which include several gene orders, have been identified in previous studies (Bensch & Härlid, 2000; Zhou et al., 2014; Eberhard & Wright, 2016; Caparroz et al., 2018; Kang et al., 2018; Urantówka, Kroczak & Mackiewicz, 2020; Yang et al., 2021; Kundu et al., 2022), such as for Psittaciformes and Passeriformes (Urantówka, Kroczak & Mackiewicz, 2020). This could be explained by the tandem duplication–random loss (TDRL) model; the tandem duplication of cytb-trnT-trnP-nad6-trnE-CR was consistent with previous studies (Yang et al., 2021). Mitochondrial gene rearrangement provides useful information, such as elucidating the evolution of avian groups and their evolutionary relationships (Kundu et al., 2022).
Two major clades and hierarchical nested structure
In clade I, the closer relationship of the sister group between P. borealoides and P. tenellipes (BS = 100; PP = 1.00) was consistent with previous studies based on mitochondrial genes and nuclear segments (Johansson et al., 2007; Alström et al., 2018; Sun, Liu & Lu, 2020; Yu et al., 2022). The sister group between P. borealis and P. examinandus (BS = 100; PP = 1.00) agreed with previous studies (Alström et al., 2018). Within clade II, a closer relationship between P. inornatus and P. proregulus (BS = 100; PP = 1.00) was observed, consistent with previous analyses utilizing concatenated mitochondrial gene datasets (Jiao et al., 2018; Yu et al., 2022). Furthermore, the genus Seicercus was nested within Phylloscopus (Fig. S8), which was consistent with previous studies (Alström et al., 2018).
Divergence times
For Passeriformes birds, based on data for 4,060 nuclear loci and 137 families, Oliveros et al. (2019) observed that passerines originated on the Australian landmass (∼47 mya); the subsequent dispersal and diversification were affected by several climatological and geological events. For the Phylloscopus species, divergences have been analyzed in previous studies using a combination of mitochondrial genes and nuclear segments (Moyle & Marks, 2006; Price, 2010; Alström et al., 2018). According to previous studies, the diversification of leaf warblers took place ∼11–12 mya (Johansson et al., 2007). The main two clades (α and β) of Phylloscopus split approximately 11.7 mya (95% highest posterior density (HPD) = 9.8–13.7 mya) on the basis of the cytb gene. Phylloscopus emeiensis, Phylloscopus neglectus, and Phylloscopus tytleri are the oldest single-species lineages (7.3–8.3 mya) (Alström et al., 2018).
The divergence times between the sister species of Phylloscopus ranged from 0.5 mya to 6.1 mya, with the three youngest Phylloscopus pairs of sister species splitting at 0.5 mya, 0.8 mya, and 1.1 mya, respectively, and the three oldest strongly supported sister pairs splitting at 4.1 mya, 4.1 mya, and 6.1 mya, respectively (Alström et al., 2018). The differences may have been due to the sampling strategies and the lack of available whole mitogenome sequences of several Phylloscopus species, which resulted in a greater number of Phylloscopus mitogenomes being required to infer their separation events.
Conclusions
We revisited the mitogenome features of six Phylloscopus species (P. burkii, P. reguloides, P. borealis, P. proregulus, P. trochiloides, and P. fuscatus), and investigated the evolutionary characteristics of the gene order with a gene rearrangement of cytb-trnT-CR1-trnP-nad6-trnE-remnant CR2-trnF-rrnS. As well as the phylogeny in combination with other available Phylloscopus mitogenomes to analyze the evolution of Phylloscopus, the result indicated that the Phylloscopus species was divided into two larger clades, with a splitting time approximately 11.06 million years ago (mya). The phylogenetic result of the cox1 gene showed that Seicercus was nested within Phylloscopus. Divergence times analyses investigated the differences of infer their separation events between young and old Phylloscopus sister pairs may have been due to the sampling strategies and the lack of available whole mitogenome sequences of several Phylloscopus species.
Supplemental Information
The photo of four sampled Phylloscopus species
Note: (A): P. borealis, (B): P. trochiloides, (C): P. proregulus, (D): P. fuscatus. Photos of P. burki and P. reguloides were not obtained.
The base composition of three positions of PCGs in six Phylloscopus species
Note: (A): the first codons, (B): the second codons, (C): the third codons.
The initiation and termination codons of PCGs in six Phylloscopus species
Note: (A): initiation codon, (B): termination codon.
The conserved sites percentage of tRNA stems in six Phylloscopus species
The nucleotide composition and base skew of CR1 and CR2 in six Phylloscopus species
Note: (A), (C): CR1, (B), (D): remnant CR2.
Phylogenetic trees based on the cox1 gene
Note: the newly sequenced mitochondrial sequences labelled with bold format.
The sampled Phylloscopus species used for phylogenetic tree reconstruction
Note: (A): mitogenome sequences, (B): cox1 gene.