
Brain-derived neurotrophic factor increases cell number of neural progenitor cells derived from human induced pluripotent stem cells
- Published
- Accepted
- Received
- Academic Editor
- Afsaneh Gaillard
- Subject Areas
- Cell Biology, Molecular Biology, Neuroscience
- Keywords
- Brain-derived neurotrophic factor, Neural progenitor cells, Induced pluripotent stem cells, Proliferation, Alzheimer’s disease
- Copyright
- © 2021 Pansri et al.
- Licence
- This is an open access article distributed under the terms of the Creative Commons Attribution License, which permits using, remixing, and building upon the work non-commercially, as long as it is properly attributed. For attribution, the original author(s), title, publication source (PeerJ) and either DOI or URL of the article must be cited.
- Cite this article
- 2021. Brain-derived neurotrophic factor increases cell number of neural progenitor cells derived from human induced pluripotent stem cells. PeerJ 9:e11388 https://doi.org/10.7717/peerj.11388
Abstract
Background
Several pieces of evidence from in vitro studies showed that brain-derived neurotrophic factor (BDNF) promotes proliferation and differentiation of neural stem/progenitor cells (NSCs) into neurons. Moreover, the JAK2 pathway was proposed to be associated with mouse NSC proliferation. BDNF could activate the STAT-3 pathway and induce proliferation in mouse NSCs. However, its effects on proliferation are not fully understood and JAK/STAT pathway was proposed to play a role in this activity.
Methods
In the present study, the effects of BDNF on cell proliferation and neurite outgrowth of Alzheimer’s disease (AD) induced pluripotent stem cells (iPSCs)-derived human neural progenitor cells (hNPCs) were examined. Moreover, a specific signal transduction pathway important in cell proliferation was investigated using a JAK2 inhibitor (AG490) to clarify the role of that pathway.
Results
The proliferative effect of BDNF was remarkably observed as an increase in Ki-67 positive cells. The cell number of hNPCs was significantly increased after BDNF treatment represented by cellular metabolic activity of the cells measured by MTT assay. This noticeable effect was statistically shown at 20 ng/ml of BDNF treatment. BDNF, however, did not promote neurite outgrowth but increased neuronal cell number. It was found that AG490 suppressed hNPCs proliferation. However, this inhibitor partially decreased BDNF-induced hNPCs proliferation. These results demonstrated the potential role of BDNF for the amelioration of AD through the increase of AD-derived hNPCs number.
Introduction
Human neural progenitor cells (hNPCs) can proliferate and further differentiate into different neuronal cell types and glial cells of the central nervous system. The hNPCs are suitable for studying neural development, neurodegenerative disorders, disease modeling, or using it as a promising source in cell therapy for several neurodegenerative diseases, however, they are difficult to obtain (Akesson & Sundstrom, 2016; Walker, Huang & Young, 2016). Currently, the induced pluripotent stem cells (iPSCs) technology provides a new unlimited source of hNPCs from healthy or from neurogenerative conditions, such as Alzheimer’s or Parkinson’s diseases (Ross & Akimov, 2014; Yang et al., 2016) by in vitro differentiation of these cells. Moreover, neurons from neurodegenerative-disease patient-derived iPSCs have a vast potential for high-throughput screening and drug discovery (Heilker et al., 2014; Mohamet, Miazga & Ward, 2014).
BDNF is a member of the neurotrophin family of trophic factors that play a role in neuronal survival, proliferation, migration, differentiation, and synaptic plasticity (Allen et al., 2013; Bartkowska, Turlejski & Djavadian, 2010). BDNF exposure could enhance the proliferation of mouse fetal NSCs through the truncated Trk-B receptor, MAPK, AKT, and STAT-3 signaling pathways (Islam, Loo & Heese, 2009). In addition, JAK2 inhibition considerably reduced proliferation on mouse NPCs (Kim et al., 2010). From these studies, JAK/STAT pathway may involve with BDNF. Therefore, the JAK2 inhibitor was purposed to block the activity of both proteins in order to study the proliferative effect of BDNF. In human fetal neural stem/progenitor cells, BDNF increased epidermal growth factor (EGF)-induced proliferation and migration through the PI3K/Akt pathway (Zhang et al., 2011). BDNF affected rat neonatal basal forebrain oligodendrocytes proliferation and differentiation through Trk-B and the MAPK pathway (Du et al., 2006; Van’t Veer et al., 2009). On the other hand, BDNF does not affect the proliferation and differentiation of rat fetal telencephalon-derived NSC (Oliveira et al., 2013). BDNF and platelet-derived growth factor AA (PDGF-AA) did not stimulate mouse postnatal NPC proliferation but stimulated differentiation into the neuronal and oligodendrocyte lineage in a time-dependent manner (Soltys et al., 2011). The previous study has been reported that BDNF alone did not promote mouse fetal NSCs proliferation (Chen et al., 2014). Therefore, the effect of BDNF on proliferation especially in the neurodegenerative disease model is required to clarify.
Moreover, some studies have shown the effect of BDNF on neurite outgrowth. Labelle and Leclerc reported that BDNF increased neurite outgrowth of undifferentiated neurites and axonal processes of mouse fetal hippocampal pyramidal neurons (Labelle & Leclerc, 2000). Knockdown of STAT3 expression led to decreased BDNF-induced neurite growth in primary rat embryonic hippocampal neurons (Ng, Cheung & Ip, 2006). In vivo study reported the engrafted BDNF-overexpressing mouse postnatal NSCs to differentiate into neurons with a higher neurite complexity in AD mice (Wu et al., 2016). Additionally, BDNF overexpression of mouse granule cells in the hippocampal dentate gyrus increased dendrite complexity (Tolwani et al., 2002).
Based on the multiple effects of BDNF in neuronal activities as shown in previous studies, a human cellular model for neurodegenerative disease such as AD would be valuable to test the potential beneficial effects of BDNF. Unique and specific mutations in AD patients may result in different responses on BDNF thus the proliferation and neurite outgrowth of AD-NPCs might help to evaluate the therapeutic potential of this compound. Familial Alzheimer’s disease (FAD) is a rare form of AD and hereditary associated with mutations of the amyloid precursor protein (APP), presenilin 1 (PSEN1), and presenilin 2 (PSEN2) genes (Zhang et al., 2010). PSEN1 has been shown as an essential regulator of neurite outgrowth. The N2a mouse neuroblastoma cell line overexpressing the wild-type PSEN1 showed a marked increase in the number and the length of neurite outgrowth, while neurite outgrowth was inhibited in cells expressing PSEN1 mutation (P117L) (Dowjat et al., 1999). Thus, in this work, we sought to verify whether BDNF was able to promote proliferation and neurite outgrowth on human iPSC-derived NPCs from healthy and familial Alzheimer’s disease (FAD). Moreover, we used AG490, JAK2 inhibitor to further analyze the mechanism underlying BDNF-induced proliferation.
Materials & Methods
Ethics approval and consent
Written informed consent had been obtained from the subjects who provided their samples for iPSC derivation. Ethical approvals were obtained from the Medical Research Council (in Hungarian: Egészségügyi Tudományos Tanács (ETT) ETT-TUKEB 834/PI/09, 8-333/2009-1018EKU) to establish and maintain hiPSC lines.
Chemicals
All cell culture reagents were purchased from Thermo Fisher Scientific (Waltham, MA, USA). The chemicals were purchased from Sigma-Aldrich (St. Louis, MO, USA) unless otherwise specified.
Cell culture and differentiation
Two human iPSC lines were used in this study: a wild-type control iPSC line, named Ctrl1 (derived from a healthy mid-age female donor) and a PSEN1 familial Alzheimer’s disease iPSC line (BIOTi001-A), named as fAD1 (derived from 55-year-old PSEN1 mutation (C.265G>C, p.V89L) carrying female donor). Ctrl1 and fAD1 were generated and characterized as published previously (Nagy et al., 2017; Nemes et al., 2016). The iPSCs were differentiated to NPCs by the dual SMAD inhibition procedure, as described previously (Nagy et al., 2017). The forming neuronal rosette-like structures were picked under a sterile microscope (Olympus SZX2; Olympus Corporation, Shinjuku, Japan) and re-plated onto poly-L-ornithine (P4597, Sigma, 0.02%) and laminin (L2020, Sigma, 1 µg/cm2)-coated plates. NPCs were amplified in neural maintenance medium [NMM; 1:1 mixture of DMEM/F12 (31331, Life Technologies) and Neurobasal medium, (21103, Life Technologies) supplemented with 1xN2 (17502, Life Technologies), 2xB27 (17504, Life Technologies), 2mM L-glutamine (25030, Gibco), and 1xNEAA (M7145)] supplemented with 10 ng/ml bFGF (PHG0263, Life Technologies), 10 ng/ml EGF (PHG0311, Life Technologies). NPCs were cultured at 37 ° C in a humidified atmosphere of 5% CO2. Media were changed every 2–3 days. NPCs were amplified and passaged by using Trypsin-EDTA (15400, Life Technologies, 0.025%) when reached 90–100% confluency. For terminal differentiation, NPCs were harvested and seeded on poly-L-ornithine and laminin-coated plates at a density of 40,000 cells/cm2 in NMM medium. The medium was changed every 3–4 days. All data showed in this study used the NPC thawed from passage 6 and expanded no more than passage 12. The cells were divided into three groups: control, 5, and 20 ng/ml BDNF (10980, Life Technologies) treatments.
Proliferation assay
One day after plating, cells were treated with different concentrations of BDNF (non-treated, 5, and 20 ng/ml) for 4 and 6 days. For the experiment utilizing inhibitor, cells were preincubated for 30 min with AG490 (JAK2 inhibitor, T3434, Sigma) at concentrations of 1 or 2 µM. DMSO (D4540, Sigma) was used as vehicle controls. The cells were then further incubated with BDNF (5 and 20 ng/ml) in NMM medium for 6 days. Media supplemented with BDNF was changed every 3 days.
MTT assay
Cell Proliferation Kit I (MTT, C755A40 Roche) was used to analyze cellular metabolic activity unless otherwise specified. At the end of the treatment, cells were incubated with MTT (0.5 mg/ml) at 37 °C for 4 h. The purple formazan crystals were dissolved in DMSO. The optical density of each well was measured using Varioskan Flash microplate reader (Thermo Fisher Scientific) at the wavelength of 560 nm and 690 nm (reference wavelength).
Immunofluorescence staining
Cells were fixed for 15 min at RT with 4% paraformaldehyde (P6148, Sigma) in PBS (18912-014, Life Technologies), permeabilized with 0.2% Triton X-100 (T8787, Sigma) in PBS for 20 min at RT, and blocked with 3% BSA (A9647, Sigma)/0.2% Triton X-100 in PBS (blocking buffer) for 30 min at RT. Primary antibodies were incubated overnight at 4 °C in blocking buffer. The following primary antibodies were used: Mouse anti-Nestin (1:200, ab6142, Abcam Inc., Cambridge, MA, RRID:AB_305313), Rabbit anti-Pax-6 (1:250, PRB-278P, Covance, Princeton, New Jersey, USA, RRID:AB_291612), Rabbit anti- βIII tubulin (TUBB3) (1:2000, PRB-435P-100, Covance, Princeton, New Jersey, USA, RRID:AB_291637), Mouse anti-Ki-67 (1:800; #9449, Cell Signaling Technology, Beverly, MA, RRID:AB_2797703). After three washes in PBS, each sample was incubated for 1hr with matching secondary antibodies: Alexa Fluor 488 donkey anti-rabbit IgG (H+L) (1:2000, A21206, Thermo Fisher Scientific, RRID:AB_2535792), Alexa Fluor 594 donkey anti-mouse IgG (H+L) (1:2000, A21207, Thermo Fisher Scientific, RRID:AB_141637). After washing, the coverslips were mounted onto glass slides using VECTASHIELD antifade mounting medium with DAPI (CA94010, Vectashield) and analyzed with a fluorescence microscope (AxioImager system with ApoTome, Carl Zeiss Micro-Imaging GmbH, and Jena, Germany) controlled by AxioVision 4.8.1 Microscope software (Carl Zeiss MicroImaging GmbH, Jena, Germany). The number of proliferative cells (Ki-67 positive cells) was quantified. Eighteen pictures per coverslip were randomly acquired from three independent cultures (10x magnification).
Measurement of neurite outgrowth
The measurement of neurite outgrowth was analyzed as previously described (Pool et al., 2008). Briefly, cells were fixed and stained with TUBB3 and DAPI. Cells were observed using the 10x objective lens and were photographed under a fluorescent microscope. Eighteen fields were randomly selected in each coverslip. The image analysis of neurite outgrowth was performed by using the neurite tracer plugin in ImageJ (NIH, USA). The total neurite length (µm) were measured based on TUBB3 positive area whereas neuronal cell numbers were counted based on the double-positive signal of TUBB3 and DAPI, and total neurite length per cell was calculated as the average of the total neurite length divided by the average of the total number of neuronal cells (n = 3/group).
Statistical analyses
All results were analyzed using Prism 5 (GraphPad Software, La Jolla, CA, USA). Analysis of data is presented as the mean ± SD or the mean ± SEM. A one-way ANOVA with Tukey post-test was used for multiple range tests. P < 0.05 was considered statistically significant.
Results
BDNF treatment promoted hNPCs proliferation
Before testing the effect of BDNF, iPSC-derived hNPCs were characterized by the expression of NPC markers NESTIN and PAX6. The results showed that both Ctrl1 and fAD1 cell lines were positively stained for NESTIN and PAX6 (Figs. 1A and 1B). Moreover, the proportion of NESTIN and PAX6 positive cells was determined before freezing the hNPCs at passage 5-8. NESTIN and PAX6 were expressed in more than 95% and 80% of the cells, respectively in both cell lines tested (supplementary info, Fig. S1). To investigate the influence of BDNF on hNPC proliferation, two distinct methods, counting of proliferating cells (Ki-67 positive cells) and MTT cellular metabolic assay, were performed. In the presence of 5 and 20 ng/ml BDNF, the percentage of Ki-67 positive cells significantly increased on days 4 and 6 in a dose-dependent manner observed in both cell lines (Table 1) which the highest level of proliferation was found at 20 ng/ml BDNF. Moreover, there was a significant difference in the Ki-67 positive cells between 5 and 20 ng/ml BDNF on day 6 in both cell lines. These results indicated that BDNF considerably increases the proliferation of Ctrl1 and fAD1 compared with untreated cells. The effect of BDNF on cellular metabolic activity was confirmed by MTT assay. The cellular metabolic activities of Ctrl1 and fAD1 cells significantly increased on day 6 after treated with BDNF in a dose-dependent manner (Fig. 2A). Consistency with Ki-67 staining, the highest cellular metabolic activity was found at 20 ng/ml BDNF in both cell lines. Nevertheless, there was no significant difference in cellular metabolic activity between 5 and 20 ng/ml BDNF in both Ctrl1 and fAD1 groups as determined by MTT assay (Fig. 2A). Taken together, these results demonstrate that BDNF substantially stimulates hNPCs proliferation as well as cellular metabolic activity at 20 ng/ml BDNF, Day 6.
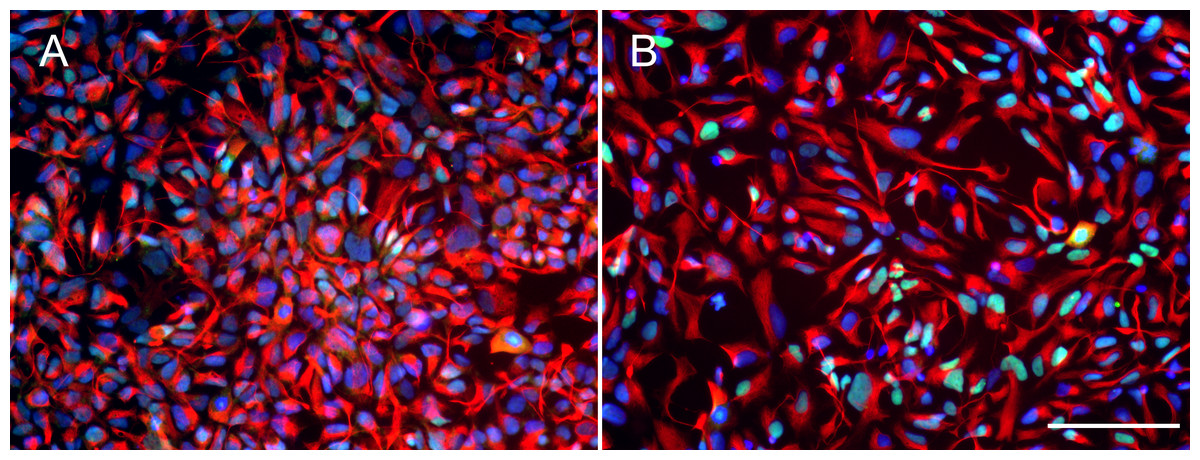
Figure 1: Expression of neural progenitor markers in NPCs.
(A and B) Both wild type control hNPCs (Ctrl1) and PSEN1 hNPCs (fAD1), respectively, showed positive staining of neural progenitor markers NESTIN (red) and PAX6 (green). Nuclei were counterstained with DAPI (blue). Scale bar = 100 µm.

Figure 2: Different effect of BDNF, AG490 and DMSO on hNPCs metabolic activity.
Quantitative cellular metabolic activity of hNPCs was investigated by MTT assay on day 6 after treatments. (A) BDNF increased MTT values in a dose-dependent manner in Ctrl1 and fAD1. (B) MTT values significantly decreased by 2 µM AG490 in Ctrl1 and fAD1. MTT values were not affected in any of the two cell lines after incubation with DMSO (data not shown). Data are represented as mean ± SEM of three independent experiments. *p ≤ 0.05, and **p ≤ 0.01 vs. values obtained in the control (0 ng/ml BDNF, Fig. 2A) or vehicle (DMSO, Fig. 2B) by one-way ANOVA followed by Tukey’s test.
| Group | Percentage (%) of Ki-67 positive cells in Ctrl1 | Percentage (%) of Ki-67 positive cells in fAD1 | ||
|---|---|---|---|---|
| Day 4 | Day 6 | Day 4 | Day 6 | |
| Control | 28.8 ± 3.7% | 33.0 ± 1.9% | 37.1 ± 5.0% | 36.0 ± 5.8% |
| 5 ng/ml BDNF | 44.1 ± 1.8%* | 43.2 ± 2.0%** | 51.9 ± 3.1%** | 52.1 ± 1.4%** |
| 20 ng/ml BDNF | 54.0 ± 11.5%** | 51.7 ± 2.0%**@@ | 58.5 ± 3.3%** | 63.8 ± 4.6%**@ |
JAK2 inhibitor decreased hNPCs proliferation
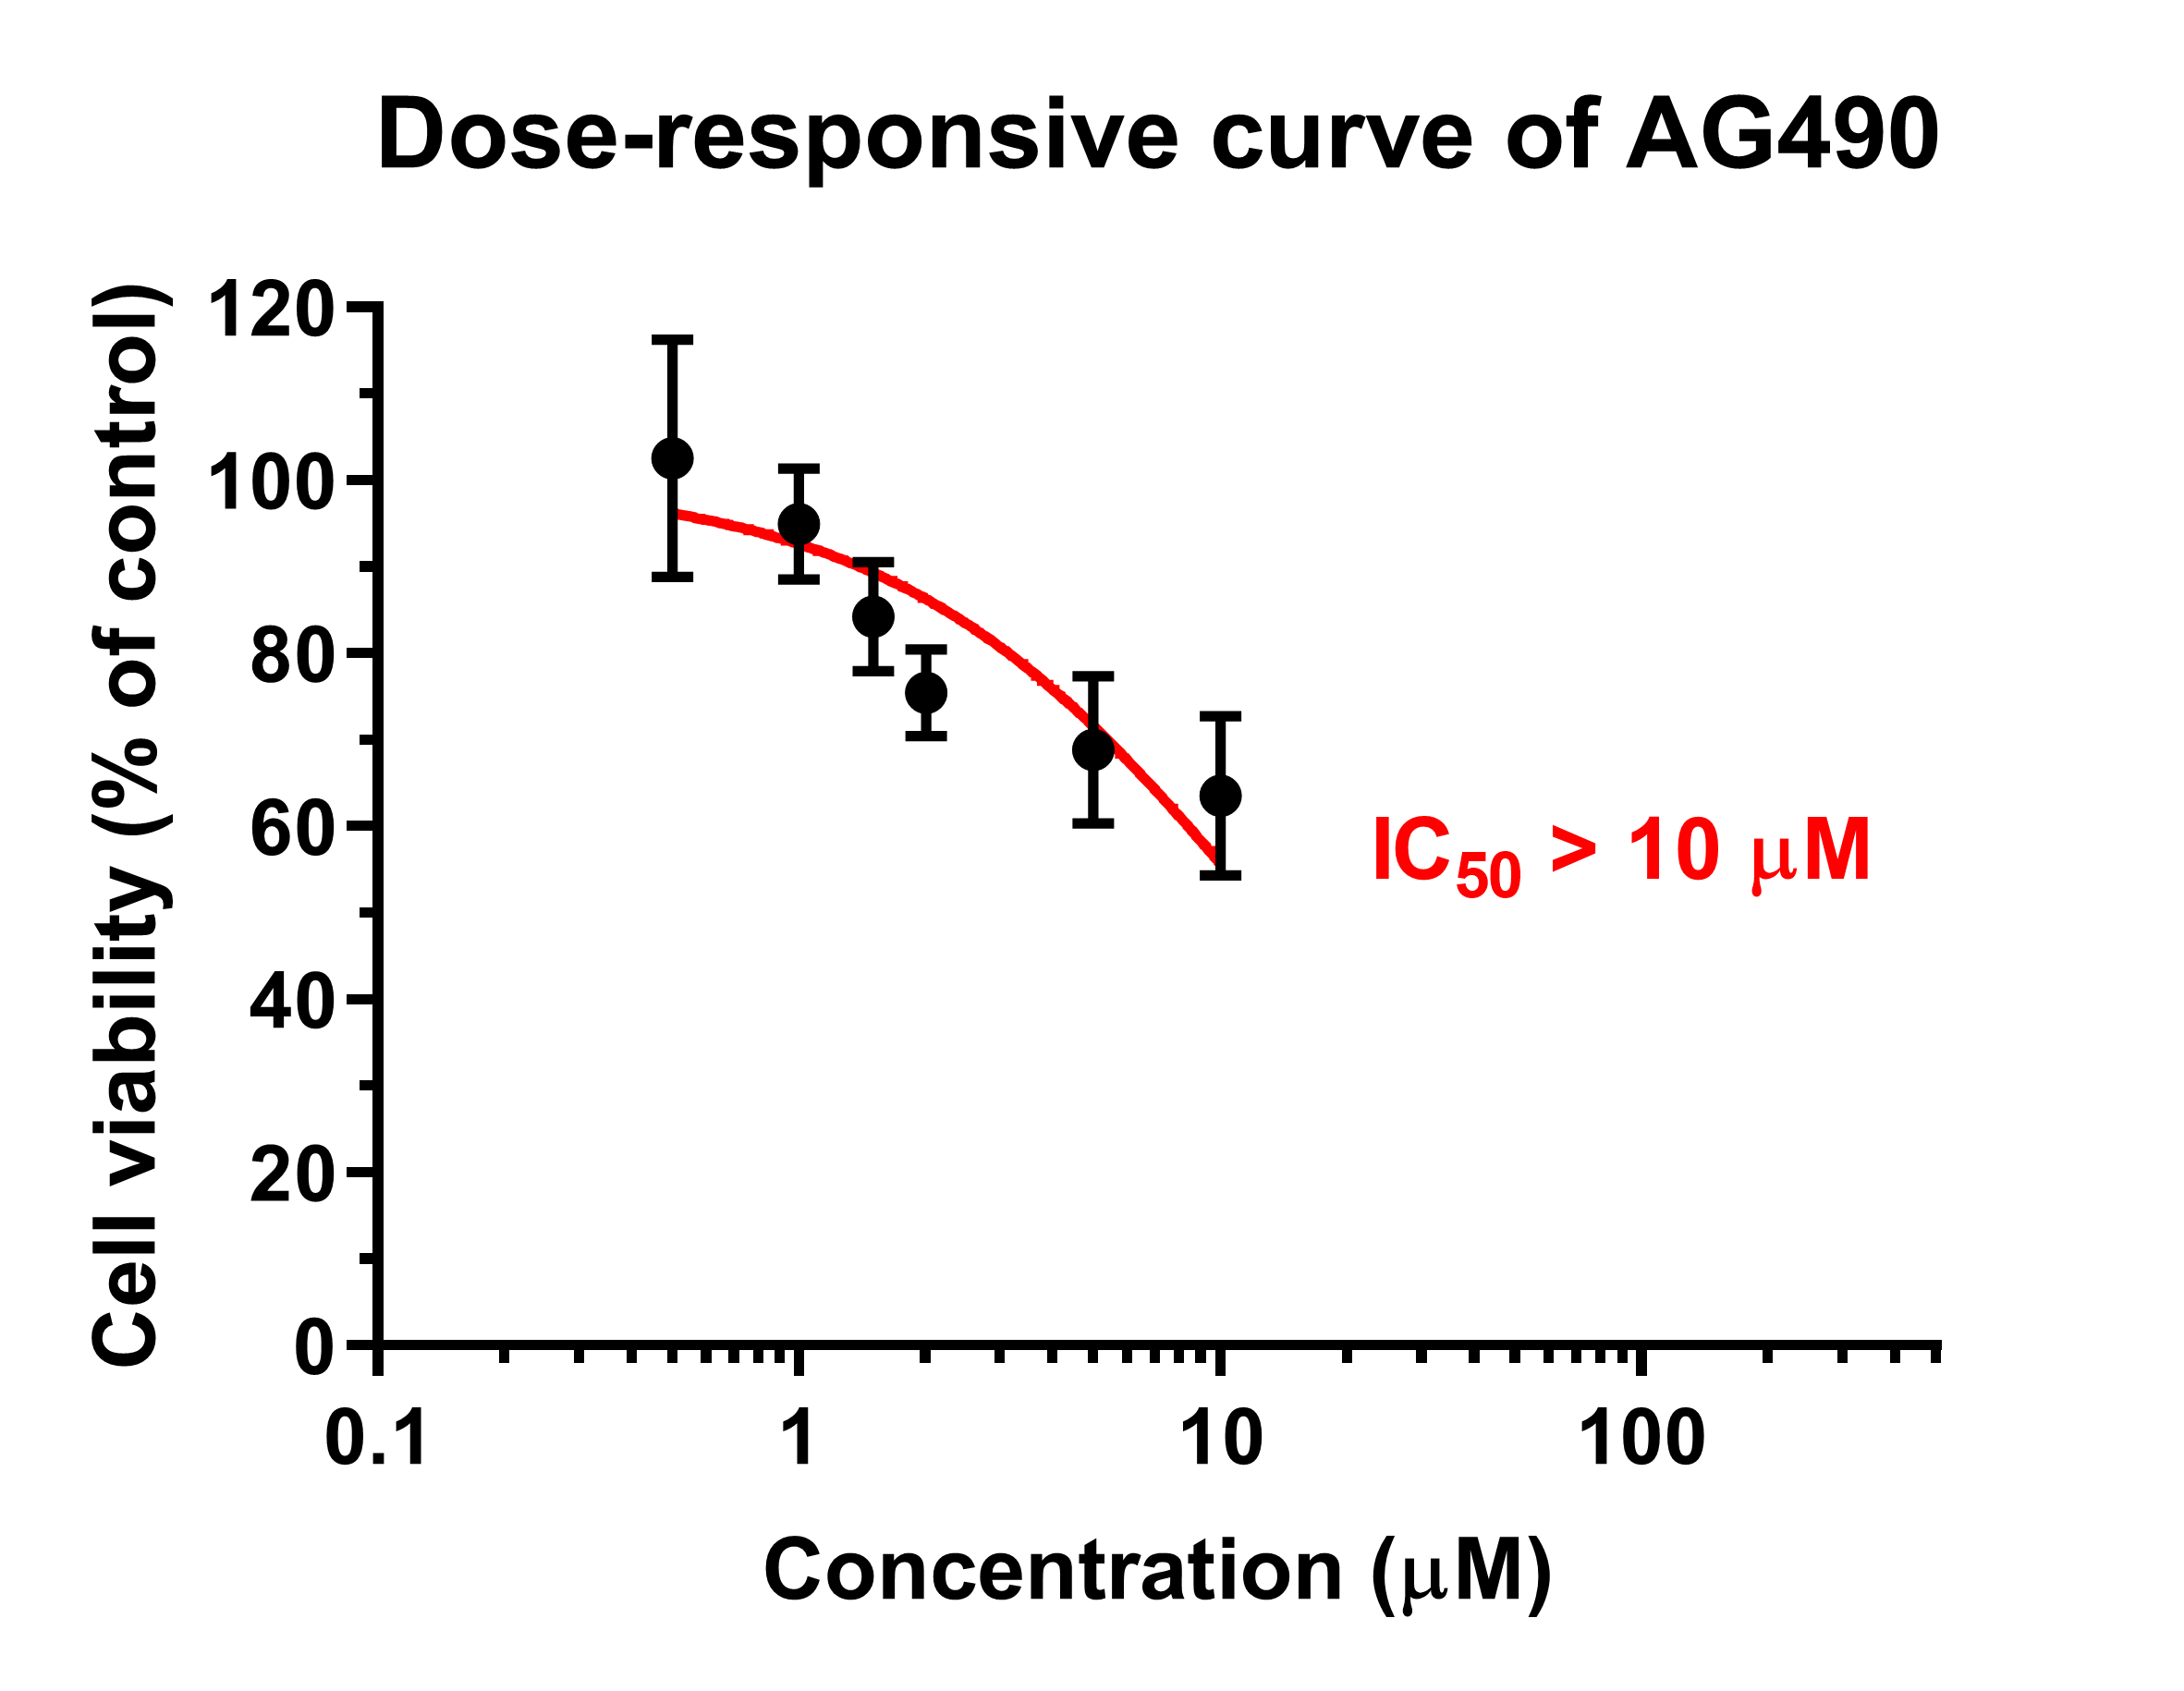
It was previously shown that the potent JAK2 inhibitor (AG490) significantly reduced neural precursor cell proliferation (Kim et al., 2010). Here, we utilized MTT and Ki-67 assays to determine the influence of AG490 on cellular activity and proliferation, respectively. Although the MTT was directly measured cellular metabolic activity, this system can be used to directly refer cell viability and indirectly represent toxicity because live cells are dependently proportional to their metabolic activity. Therefore, the measurement of cell viability by MTT is the converted value of cell toxicity. The cell toxicity of AG490 was primarily evaluated by treatment at various concentrations of AG490 (0, 0.5, 1, 1.5, 2, 5, and 10 µM) with Ctrl1 cell line for 6 days by MTT assay. The results showed that the 50% of inhibitory concentration (IC50) was more than 10 µM (Fig. S2). Moreover, the concentrations of 1 and 3 µM AG490 have been reported to decrease the number of Ki67-positive mNPCs after 6 days of treatment (Kim et al., 2010). Therefore, we decided to lower the concentration to test only 1 and 2 µM of AG490 in the further proliferation assay. In the presence of 2 µM AG490 for 6 days, the proliferation of Ctrl1 (Fig. 3C) and fAD1 (Fig. 3H) groups significantly decreased as shown by the percentage of Ki-67 positive cells (Figs. 3E and 3J). The cellular metabolic activity was also statistically different in the addition of 2 µM AG490. However, there is no detectable effect of 1 µM AG490 and vehicle control (DMSO) when determined by MTT assay. (Fig. 2B). Therefore, the JAK2 inhibitor AG490 effectively reduced the proliferation of hNPCs at 2 µM, and this concentration was used for further experiments.
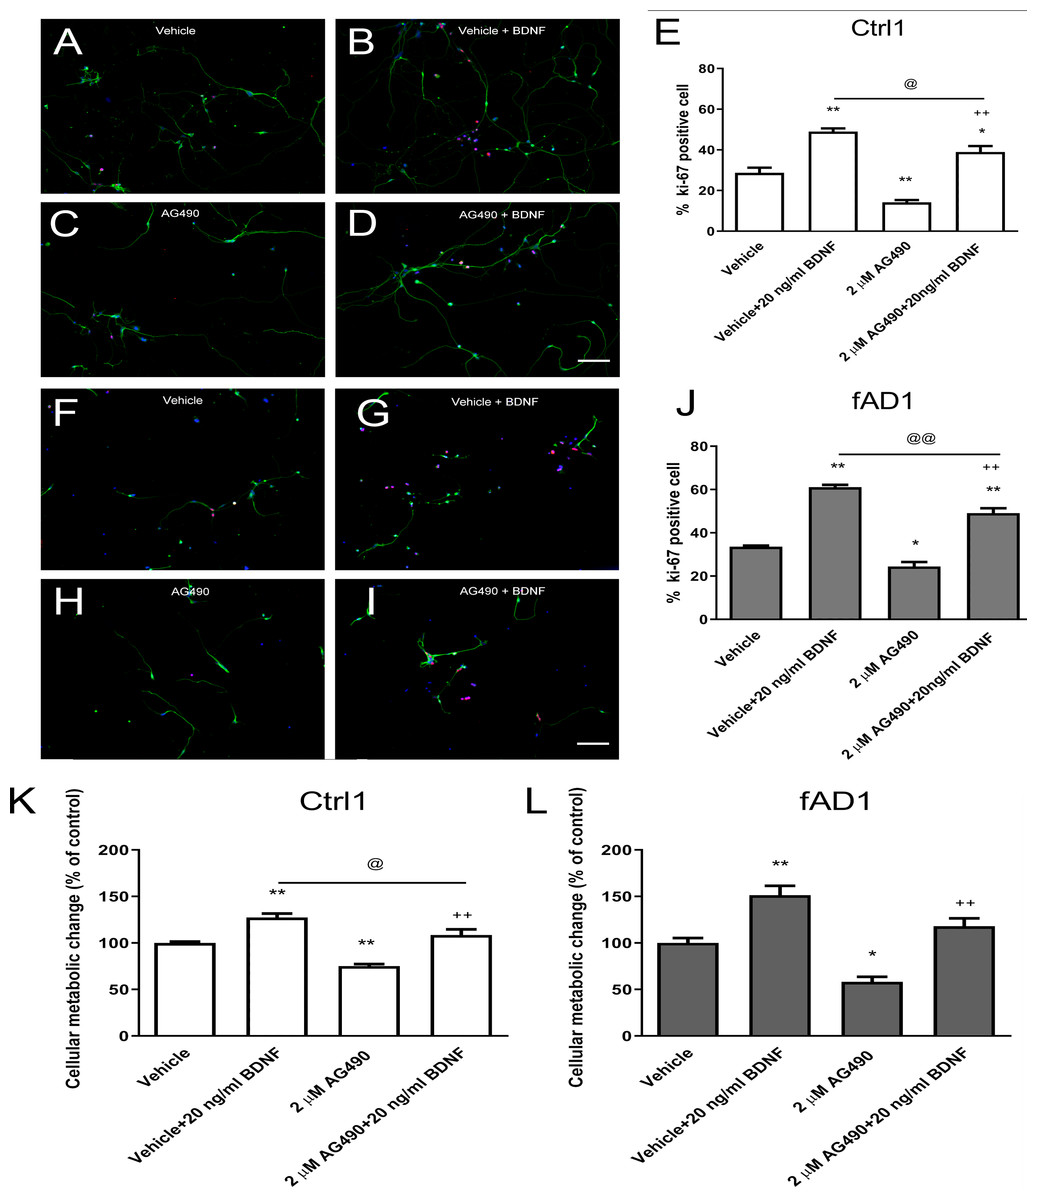
Figure 3: JAK2 inhibitor partially inhibits cell proliferation in the presence of BDNF.
After the cells were pretreated with vehicle or 2 µM AG490 and further treated with or without BDNF (20 ng/ml) for 6 days, hNPCs were stained against Ki-67, counted, and statistically analyzed. (A–J) The ability of BDNF to increase the percentage of Ki67-positive cells was not completely suppressed by cotreatment with AG490 in Ctrl1 and fAD1. (K) AG490 statistically decreased MTT value when co-treated with BDNF in Ctrl1. (L) AG490 did not decrease MTT value when co-treated with BDNF in fAD1. Data are represented as mean ± SEM of three independent experiments. *p ≤ 0.05, and **p ≤ 0.01 vs. vehicle (DMSO); ++p ≤ 0.01 vs. AG490; @p ≤ 0.05 and @@p ≤ 0.01 vs. vehicle+BDNF, by one-way ANOVA followed by Tukey’s test. For immunostaining in A–D and F–I, Ki67 (red), βIII tubulin (green), and nuclei (blue) are shown. Scale bar = 100 µm.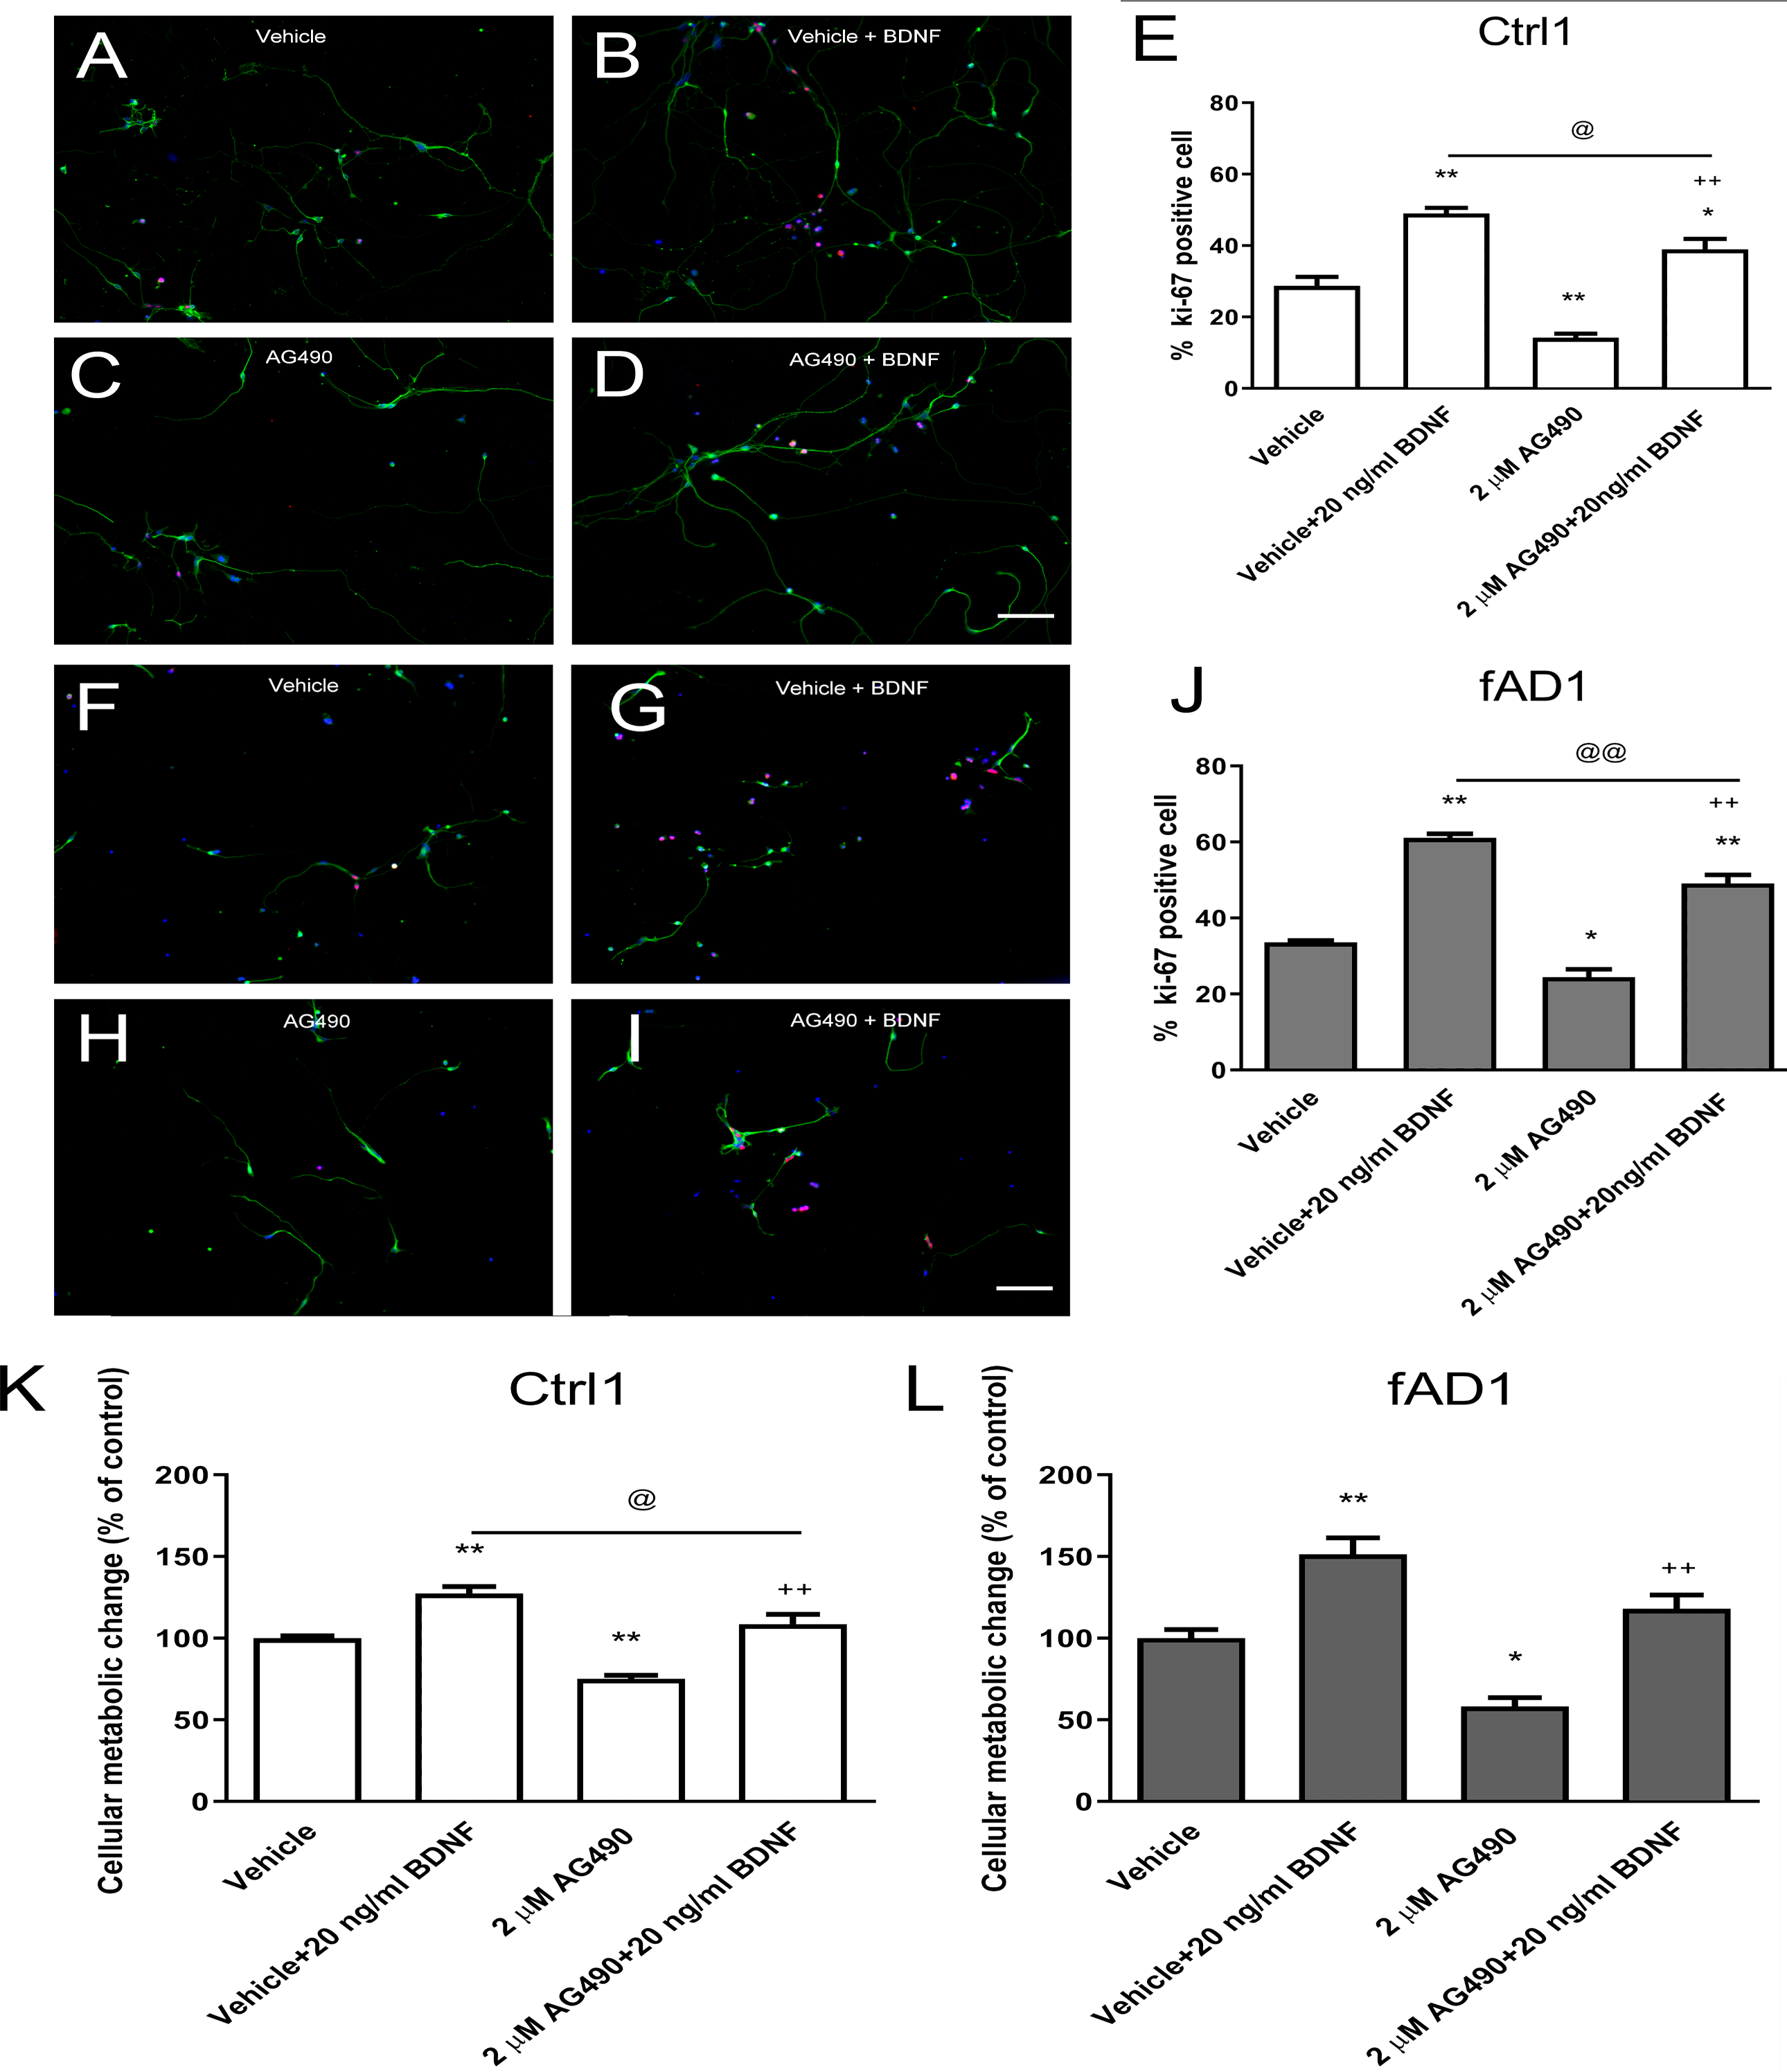
JAK2 inhibition partially decreased the effect of BDNF-induced hNPCs proliferation
We next investigated whether the JAK2 inhibitor has any effect on BDNF-induced hNPCs proliferation. Cells were pretreated with vehicle or 2 µM AG490 for 30 min and further incubated with or without BDNF (20 ng/ml) for 6 days. Although the percentage of Ki67-positive cells and proliferation change were decreased in the presence of AG490, co-treatment with AG490 and BDNF significantly increased the cell proliferation in Ctrl1 (Figs. 3C–3E) and fAD1 (Figs. 3H–3J) compared with AG490 treatment alone. These results suggested that AG490 is unable to completely inhibit the BDNF-induced hNPC proliferation and BDNF acts largely independently of JAK2 inhibitor on cell proliferation in both Ctrl1 and fAD1 cell lines.
Effect of BDNF on neurite outgrowth
To further assess the effect of BDNF on neurite outgrowth, hNPCs were treated with 5 and 20 ng/ml BDNF for 10 days. As shown in Fig. 4A, the total neurite length of Ctrl1 and fAD1 dramatically increased when treated with 5 or 20 ng/ml BDNF compared with untreated BDNF. Furthermore, the total neurite length, as well as total neurite length per cell, of fAD1 was significantly less than Ctrl1 in the untreated group (Figs. 4A–4B). Interestingly, we also found that 5 and 20 ng/ml BDNF significantly decreased total neurite length per cell in Ctrl1, while BDNF treatment has no effect on total neurite length per cell in fAD1 (Fig. 4B). Additionally, we examined the effect of BDNF on the number of neuronal cells by counting nuclear staining DAPI positive cells. Both Ctrl1 and fAD1 showed a significantly increasing number of neuronal cells after BDNF treatment (Figs. 4C–4D). Results from these experiments indicate that BDNF treatment promotes total neurite outgrowth in both normal and disease cell lines, by increasing cell proliferation in hNPCs-derived early immature neurons as shown in the supplementary Fig. S3.

Figure 4: Neurite outgrowth and the number of neuronal cells from hNPCs-derived neurons response to BDNF treatment.
(A) The total neurite length of both cell lines significantly increased when incubated with BDNF (5 and 20 ng/ml). (B) Total neurite length per cell of Ctrl1 significantly decreased following BDNF treatment (5 and 20 ng/ml), while there was no significant difference in total neurite length per cell in fAD1 after treated with BDNF (5 and 20 ng/ml). (C) Number of neuronal cells of Ctrl1 significantly increased when incubated with BDNF (5 and 20 ng/ml). (D) Number of neuronal cells of fAD1 significantly increased when incubated with BDNF (5 and 20 ng/ml). Data are represented as mean ± SEM of three independent experiments. *p ≤ 0.05 and **p ≤ 0.01 vs. values obtained in the control group (0 ng/ml BDNF); ##p ≤ 0.01 vs. fAD1, by one-way ANOVA followed by Tukey’s test.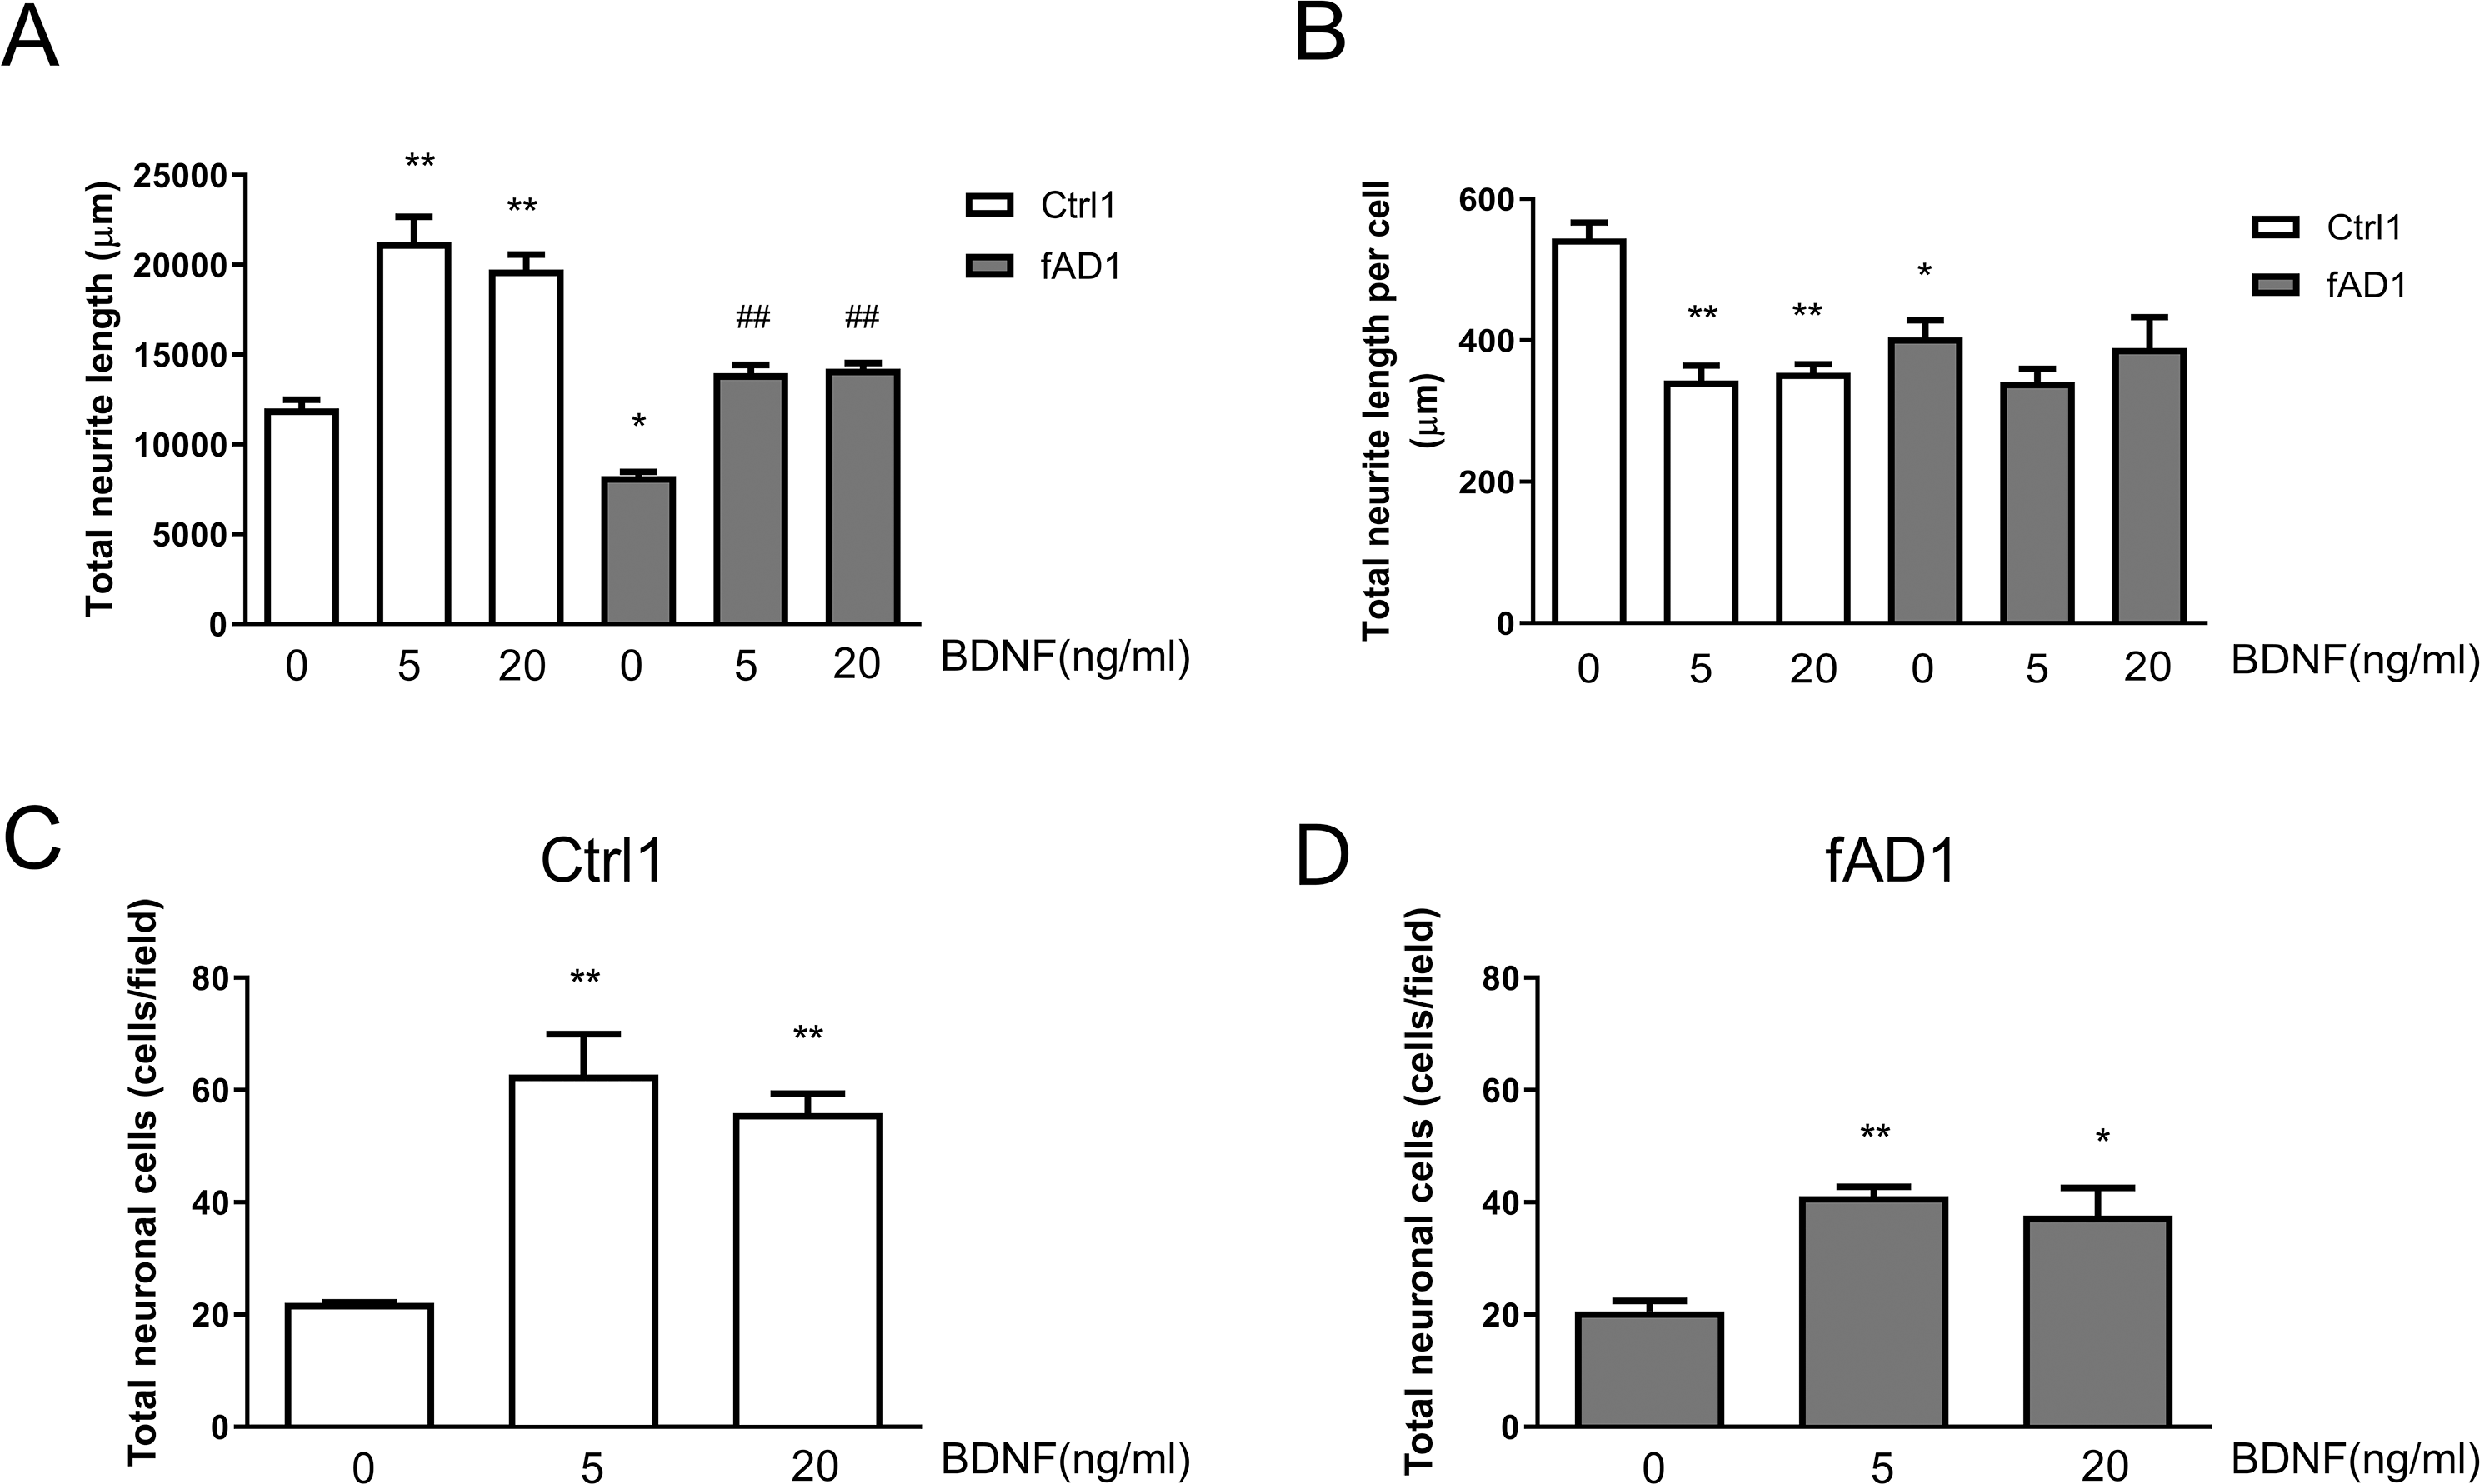
Discussion
Deciphering the only partially understood neural stem and progenitor cell (NSC/NPC) proliferation processes is the focus of intense international research activities. BDNF, the most widely distributed neurotrophin in the central nervous system, has been widely used in vitro to generate neuronal cells from embryonic stem cells and iPSCs (Engel et al., 2016). However, earlier studies have shown the controversial results of BDNF on rat and mouse NSCs/NPCs proliferation as described elsewhere (Chen et al., 2014; Islam, Loo & Heese, 2009; Oliveira et al., 2013; Soltys et al., 2011; Zhang et al., 2011). Our work is the first study investigating the effect of BDNF on cell proliferation in normal and PSEN1 familial AD iPSC-derived hNPCs. Our results showed that BDNF promoted hNPCs proliferation to a similar degree in both cell lines, consistent with previous studies showing that BDNF treatment enhanced the proliferation of mouse NSCs (Islam, Loo & Heese, 2009). These results revealed that BDNF involved in the proliferation process of hNPCs based on the percentage of Ki-67, a proliferation-specific protein, positive cells. Cell proliferation can be directly and indirectly assessed by measuring DNA levels or synthesis, cellular metabolism, or proliferation-specific proteins. MTT assay is used to measure cellular metabolic activity which only indirectly quantifies proliferating or respiring cells. On the other hand, Ki-67 is a specific protein that is expressed in proliferating cells, across all cell cycle phases (G1, S, G2 and M) except G0 (Scholzen & Gerdes, 2000). Indeed, when we investigated in parallel using both methods, MTT assays shown no significant difference between 5 ng/ml and 20 ng/ml BDNF treatment, whereas there was a significant difference between these groups when analyzed by Ki-67 staining. The effect of AG490 seems to be stronger on proliferation when assayed with Ki-67 staining than with MTT assay because the Ki-67 directly represents the proliferative cells whereas MTT assay may have the interfering effects of non-proliferative live cells having some metabolism. Overall, both proliferation and cellular metabolism assays showed that at 20 ng/ml BDNF treatment had the highest proliferative effect in both cell lines on day 6.
The JAK/STAT pathway is one of the most important signaling pathways, by its strong links to cell proliferation, differentiation, survival, and inflammation. The proliferation of adult NSCs of the subventricular zone is regulated by the JAK/STAT pathway (Nicolas et al., 2013). In our study, we detected that blocking the JAK2 with AG490 significantly reduced cell proliferation of hNPCs in both cell lines. These data are consistent with the results of a previous study showing that AG490 and siRNA targeting JAK2 profoundly decreased mouse NPC proliferation (Kim et al., 2010). Taken together, these results suggested that somehow JAK2 might be involved in hNPC proliferation both in healthy and AD patients.
It has been proposed that BDNF stimulated the proliferation of mouse NSCs through the truncated TRK-B receptor, MAPK, AKT, and STAT3 signaling pathways (Islam, Loo & Heese, 2009). In the present study, we found that in the presence of BDNF, the hNPCs proliferation and cellular metabolic activity were partially inhibited by the JAK2 inhibitor. These results indicated that the JAK2/STAT3 pathway is not the only pathway in the BDNF-induced proliferation of hNPCs in both Crtl1 and fAD1, which provides some insight into the regulatory mechanisms underlying the role of BDNF in hNPCs proliferation. Interestingly, the BDNF promoted the proliferation in PSEN1-mutated fAD hNPCs which hints for the promising therapeutic effects of BDNF in AD patients.
Recently, several groups, including ours generated human iPSC-derived neurons from individuals with familial (fAD) and sporadic AD (sAD). Previously, we reported an increased amyloid secretion with an increased Aβ42/Aβ40 ratio of AD lines compared to neurons differentiated from healthy individuals. Moreover, we tested the effect of a calcilytic compound, the NPS 2143, on PSEN1 mutant fAD neurons which were able to reduce the levels of Aβ40 and Aβ42, and at the same time, lower levels of sAβPPα were detected, while amyloid and sAβPPα levels were not affected in control cell lines. The calcilytic treatment significantly reduced the expression of CaSR and PSEN1 at the cell surface of fAD neurons, while the intracellular levels of these proteins were not significantly modified (Lo Giudice et al., 2019). These experiments showed that iPSC-based systems could provide suitable in vitro platforms for the validation of candidate drugs and the identification of novel therapeutic targets.
One of the key processes during neuronal migration and differentiation is neurite outgrowth. Based on previous studies, BDNF promoted neurite outgrowth in rat hippocampal pyramidal neurons (Labelle & Leclerc, 2000), primary hippocampal neurons (Ng, Cheung & Ip, 2006), and neurite complexity in mouse NSCs differentiation (Wu et al., 2016) and granule cells in the hippocampal dentate gyrus (Tolwani et al., 2002). Contrastingly, our results demonstrated that 5 and 20 ng/ml BDNF treatment did not increase neurite outgrowth per cells, but significantly increased the number of neuronal cells in both normal and disease cell lines confirming the proliferative effect of BDNF in hNPCs-derived neurons. The different outcomes in our study may be due to different species, cell types, concentration, duration of treatment, number of cells, or method of quantifying the neurite outgrowth.
Interestingly, when compare PSEN1 mutation to wild-type control, the total neurite length per cell of PSEN1 disease cell line was significantly less than that of the control. This result was consistent with previous reports. Dowjat et al. (1999) demonstrated that PSEN1 mutation inhibited neurite outgrowth in N2a cells. Furukawa et al. (1998) also showed that PSEN1 mutation inhibited neurite outgrowth of PC12 rat pheochromocytoma of adrenal medulla cells in the untreated control group and nerve growth factor-induced neurite outgrowth groups. These data indicate that PSEN1 plays a role in the regulation of early neurite outgrowth. The current study focused only on neurite outgrowth and proliferation of in vitro differentiation of hNPCs derived from AD patients compared with healthy cells, yet allowed to clearly demonstrate the important effect of BDNF in this system.
Conclusions
In conclusion, we provide evidence that BDNF increases cell number of hNPCs derived from normal and PSEN1 familial AD iPSCs as well as neuronal cells. Application of JAK2 inhibitor reduced cell number and proliferative marker, Ki-67, of both cell lines, however, did not completely abolish these effects of BDNF. This indicates for the first time that BDNF significantly increases cell number of hNPCs which may involve with proliferation process not only via the JAK2/STAT3 pathway, as previously reported in other cellular models.
Supplemental Information
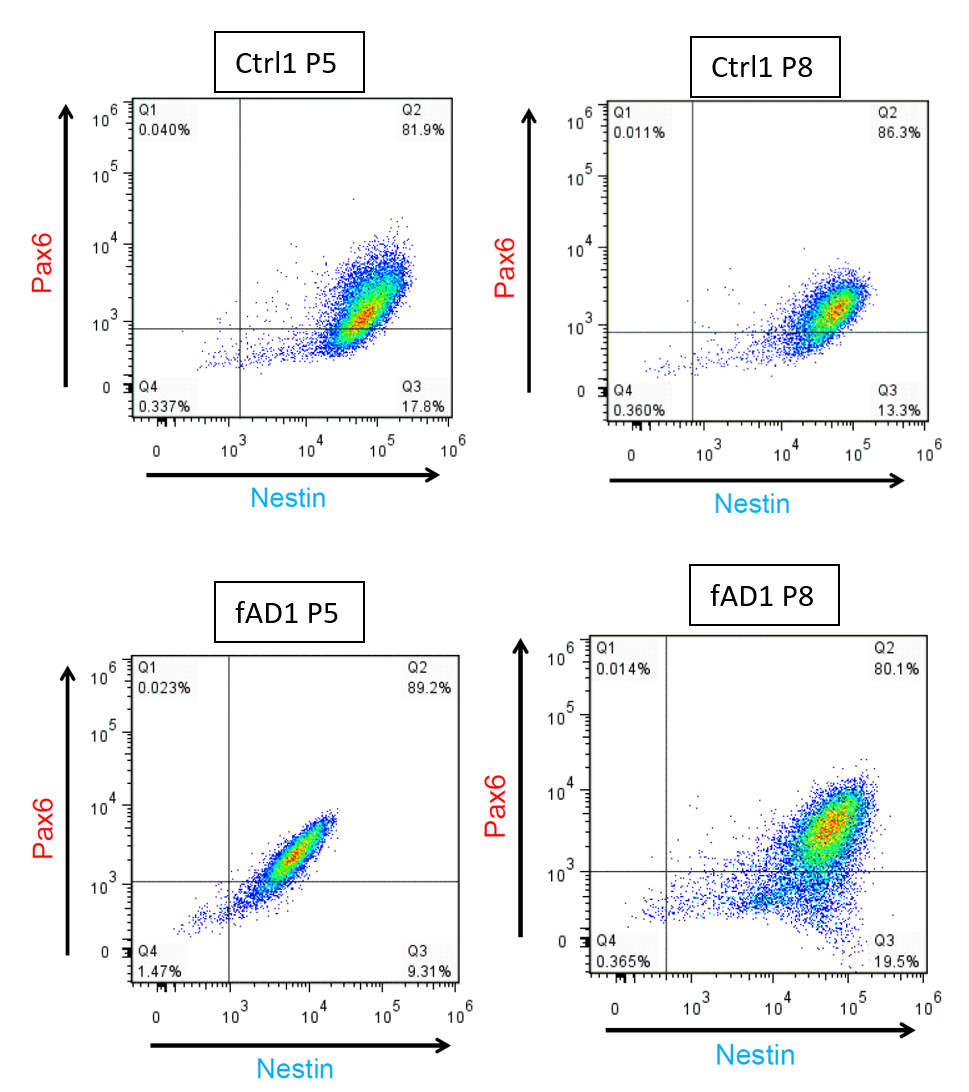
Flow cytometry analysis of hNPCs with PAX6 and NESTIN
The proportion of NESTIN and PAX6 positive cells were determined by flow cytometry with the same batch of the frozen cell stock at different passage number. From the dot plot Q1, PAX6 + cells; Q2, PAX6 + and NESTIN + cells; Q3, NESTIN + cells; Q4, PAX6 − and NESTIN − cells.
Dose-responsive curve of AG490.
The cell toxicity of AG490 on Ctrl1 hNPCs was analyzed at 0, 0.5, 1, 1.5, 2, 5, and 10 µM with MTT assay at day 6. The results showed IC50 (50% Inhibitory Concentration) of AG490 was more than 10 µM.
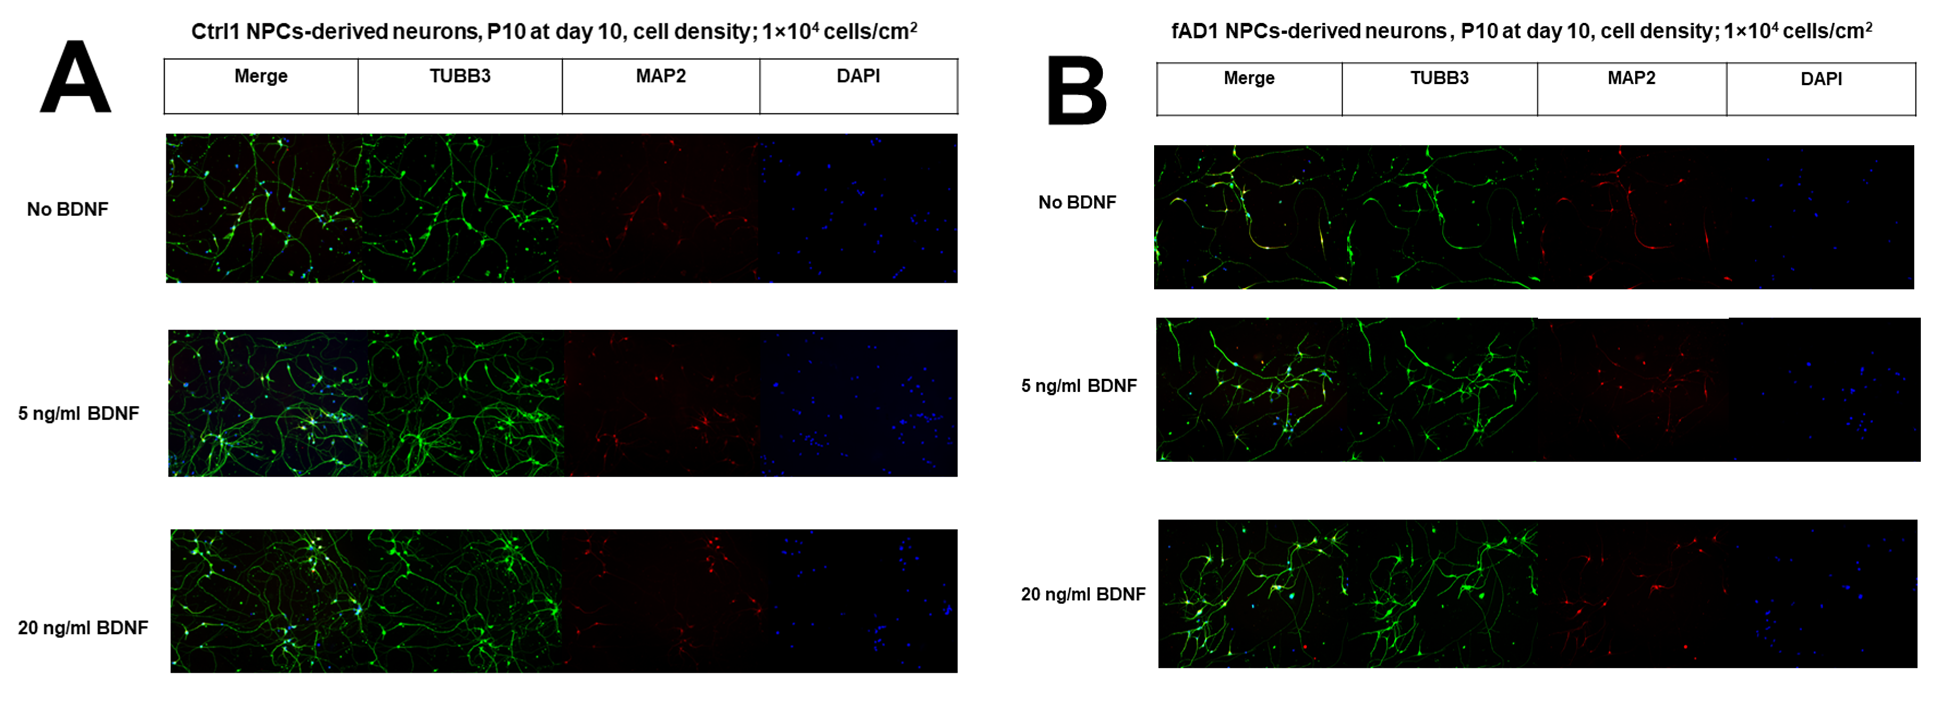
Expression of neuronal markers (TUBB3, MAP2) in hNPCs-derived neurons
On day 10 after plating, TUBB3 (green) and MAP2 (red) were stained. Only some neurons showed positive staining of MAP2 (mature neuronal marker) indicating that most neurons were still immature. All images were recorded at 10X.