
Genome-wide miRNA expression profiling in potato (Solanum tuberosum L.) reveals TOR-dependent post-transcriptional gene regulatory networks in diverse metabolic pathway
- Published
- Accepted
- Received
- Academic Editor
- Yuriy Orlov
- Subject Areas
- Agricultural Science, Biotechnology, Molecular Biology, Plant Science
- Keywords
- Target of rapamycin, microRNA, Integrated miRNA-mRNA analysis, Metabolism, Solanum tuberosum L.
- Copyright
- © 2021 Deng et al.
- Licence
- This is an open access article distributed under the terms of the Creative Commons Attribution License, which permits unrestricted use, distribution, reproduction and adaptation in any medium and for any purpose provided that it is properly attributed. For attribution, the original author(s), title, publication source (PeerJ) and either DOI or URL of the article must be cited.
- Cite this article
- 2021. Genome-wide miRNA expression profiling in potato (Solanum tuberosum L.) reveals TOR-dependent post-transcriptional gene regulatory networks in diverse metabolic pathway. PeerJ 9:e10704 https://doi.org/10.7717/peerj.10704
Abstract
Target of rapamycin (TOR) operates as a hub of the signal transduction that integrates nutrient and energy signaling to promote cell proliferation and growth through mediating the transcriptional and post- transcriptional regulator networks in all eukaryotic species. MicroRNAs (miRNAs) are widespread classes of small, single-stranded, non-coding endogenous RNAs and are widely found in eukaryotes, which play a vital role in regulating gene expression by degrading targeted mRNAs or translational repression at post-transcriptional level. Recent studies found that there were necessarily close connections between miRNA and TOR pathways in mammals. However, there is little information about the interplay between the miRNA and TOR in plants. Thus, the aim of this study was to identify potential TOR-miRNA-mRNA regulatory networks in TOR signaling through global mRNA and microRNA expression profiling in potato. Based on the previous high-throughput transcriptome sequencing and filtering, a total of 2,899 genes were significantly differentially expressed in potato under TOR inhibitors treatment. Pathway analysis revealed that these genes were significantly enriched in multiple metabolic processes. Similarly, in the present study, suppression of TOR resulted in 41 miRNAs up-regulated and 45 down-regulated, revealing that TOR plays a crucial role in the regulation of miRNA regulatory network. Furthermore, integrated mRNA and miRNA expression profiling uncovered that these miRNAs participated in large-scale metabolic process in the TOR signal pathway in potato, such as regulation of autophagy and ubiquitination, and biosynthesis of secondary metabolites. Overall, the results shed new insight into TOR related post-transcriptional gene regulatory networks in potato and suggesting TOR-miRNA-targeting genes relevant networks as a potential genetic resource for potato improvement.
Introduction
MicroRNAs (miRNAs) represent an extensive class of small (usually 21–24 nucleotides length), non-coding, single-stranded, endogenous RNAs which are abundant in all eukaryotes. Since the direct cloning of first plant miRNA from Arabidopsis (Arabidopsis thaliana L.) (Park et al., 2002; Llave et al., 2002; Reinhart et al., 2002), more and more miRNAs and their putative targets were identified in different plant species, such as maize (Zea mays L.) (Zhang et al., 2009a), rice (Oryza sativa L.) (Zhang et al., 2017b; Peng et al., 2011), barley (Hordeum vulgare L.) (Curaba et al., 2012), switchgrass (Panicum virgatum L.) (Xie et al., 2014), wheat (Triticum aestivum L.) (Han et al., 2014), sweet potato (Ipomoea babatas L.) (Bian et al., 2016), rapeseed (Brassica napus L.) (Jian et al., 2018), sesame (Sesamum indicu L.) (Marakli, 2018) and radish (Raphanus sativus L.) (Liu et al., 2018), and so on. In plants, the stem-loop secondary structure of RNA Polymerase II transcript (pri-miRNA) was cleaved by Dicer-like 1 (DCL1) protein to produce a hairpin RNA molecule (pre-miRNA), which further cleaved by DCL1 to result in a double stranded intermediate RNA (Jones-Rhoades, Bartel & Bartel, 2006 Zhu et al., 2013). The matured miRNA, which could be incorporated into the effector complex (RISC-RNA Induced Silencing Complex) can target messenger RNA to direct RNA degradation or translational inhibition (Jones-Rhoades, Bartel & Bartel, 2006; Zhu et al., 2013; Iwakawa & Tomari, 2013). MiRNAs were demonstrated to play versatile roles in plant growth, development and responding to stresses, such as temperature, drought, salt, heavy metal stresses and nutrient starvation in plants (Chen, 2009; Sun, 2012Zhang, 2015). Based on their functions in development, growth, crop yield and stress responses, they are also considered as important genetic resources in crop improvement (Liu & Chen, 2010; Tang & Chu, 2017). As one of the world’s most important staple food, potato (Solanum tuberosum L.) is essential to food security and human health all over the world, especially in solving the poverty (Zhang et al., 2017a). In the last decade, a fast increasing number of potato miRNAs were identified using comprehensive bioinformatic analysis of EST data, comparative genome strategy, computational prediction, and high-throughput sequencing (Zhang et al., 2013; Zhang et al., 2009b; Yang et al., 2016; Yang et al., 2010). Nevertheless, the number of the potato miRNAs (219) deposited in miRBase (http://www.mirbase.org/) was still less than that of rice (1519), Arabidopsis (664), cotton (Gossypium spp L.) (539) and maize (404). The function of some potato miRNAs were also confirmed, for example, miR172 could induce the potato tuberization (Martin et al., 2009), miR396, miR156a, miR157a and four miR169s were drought-induced (Yang et al., 2016; Hwang, Shin & Kwon, 2011), miR156 could modulate potato architecture and tuberization (Bhogale et al., 2014), miR166 and miR159 were responding to salinity (Kitazumia et al., 2015), miR482e could enhance plant sensitivity to Verticillium dahliae infection (Yang et al., 2015), miR397-5P was involved in the PVA infection (Li et al., 2017), miR164 could mediate the lateral root development (Zhang et al., 2018), and miR160 was associated with local defense and systemic acquired resistance against Phytophthora infestans (Natarajan et al., 2018). Herein, a large number of miRNAs have yet to be discovered, and the functions of most miRNAs remain to be investigated in potato.
Target of rapamycin (TOR) was regarded as a central regulator in the signal transduction network through integrating nutrient, energy and stress related cues to coordinate cell proliferation and growth in all eukaryotic species (Xiong & Sheen, 2014; Laplante & Sabatini, 2012Loewith & Hall, 2011). Many important downstream targets of TOR kinase have been identified in different species, such as AKT, S6K, ATG13, 4EBP1, etc (). TOR can influence gene transcription, protein translation, lipid synthesis, lysosome synthesis, autophagy and energy metabolism through these substrates (Xiong & Sheen, 2012; Laplante & Sabatini, 2012; Van Leene et al., 2019). Recent studies revealed interplays between the TOR signaling pathway and miRNAs during the occurrence and treatments of diseases in mammals (Zhang et al., 2017b). Some miRNAs (miR-7, miR-99 family, miR-101, miR-122, miR-126, etc.) could suppress the upstream signaling pathway of mTOR, while some miRNAs (miR-21, miR-93, miR-96, miR-125b, etc.) could activate the TOR pathway (see review; Zhang et al., 2017c). In addition, global miRNA expression profiling suggested mTOR controls many miRNAs expression in chronic rapamycin (RAP, a specific TOR inhibitor produced by Streptomyces hygroscopicus) treatment of cancer cells and the mouse and human cells with inactivation of TSC complex (an essential repressor of mTOR activation) (Ye et al., 2015; Totary-Jain et al., 2013; Jewell, Flores & Guan, 2015). In mammals, the miRNA biogenesis was regulated by mTORC1-Mdm2-Drosha axis in response to amino acid- and glucose- deprivation (Ye et al., 2015). Moreover, several individual miRNAs (miR-1 (Sun et al., 2010), miR-21 (Bornachea et al., 2012), miR-143 (Fang et al., 2012) and miR-125b (Ge, sun & Chen, 2011)) have been confirmed to be regulated by mTOR signaling, which are known to participate in some physiological functions, including cancer.
Rapamycin (RAP) was the first generation of TOR inhibitor, which could inhibit the activity of TOR only in the presence of 12-kDa FK506 binding protein (FKBP12) through forming a ternary compound RAP-FKBP12-TOR in yeast and animals (Benjamin et al., 2011). Due to the resistance of terrestrial plants to RAP, FKBP12 gene from Homo sapiens L., Saccharomyces cerevisiae L. or Arabidopsis thaliana L. was introduced into plants to generate RAP sensitive plants in the previous study (Deng et al., 2016; Sormani et al., 2007; Ren et al., 2012; Deng et al., 2017; Xiong & Sheen, 2012). In addition to RAP, the second generation of TOR inhibitors (asTORis: AZD8055, Torin1, KU63794 (KU) et al.), which could selectively and efficiently suppress TOR by specifically targeting the ATP-binding pocket of the TOR kinase domain, were also used in revealing the function of TOR in plants (Xiong et al., 2017). In our previous study, a yeast FKBP12 gene was introduced into potato to generate RAP sensitive potato (BP12-OE line), and we found that RAP and asTORis showed synergistic effects on inhibiting potato growth and a great deal of differentially expressed genes (DEGs) were observed in potato under TOR suppression (Deng et al., 2017). MiRNA plays an important role in post-transcriptional gene regulation in plants. Whether TOR is involved in post-transcriptional gene regulation through miRNA remains unclear in potato. Herein, we chose RAP + KU and its control DMSO to construct the potato sRNA libraries for identifying the miRNAs regulated by TOR. The integrative miRNAs and mRNA analysis was done to explicate the biological functions of TOR-miRNA-mRNA regulatory networks in potato metabolism.
Materials and Methods
Plant material and growth condition
In this study, the potato seedling of BP12-OE line was used for the sRNA sequencing (Deng et al., 2017). All plants were grown in Murashige & Skoog (MS) medium under 16 h light/8 h dark in growth chambers at 22 °C. Four-week-old potato seedlings growing on the MS media for 48 h with TOR inhibitors (RAP + KU) and DMSO were collected for the sRNA sequencing.
RNA extraction, library preparation and sequencing
The extraction method and quality control of total RNA were according to Deng et al. (2017). The total amount of 3 ug RNA for each sample was used for small RNA library construction. The NEBNext Multiplex Small RNA Library Prep Set for Illumina (NEB, USA) was used to generate the sequencing libraries and the Agilent Bioanalyzer 2100 system using DNA High Sensitivity Chips was used to assess the library quality. The cBot Cluster Generation System using TruSeq SR Cluster kit v3-cBot-HS (Illumina) was used to cluster the index-coded samples. And then, the libraries were sequenced on an Illumina Hiseq 2500/2000 platform. At last, total of 50 bp single-end reads were generated.
Data analysis
Quality control and mapping
Raw reads of fastq format were processed through python scripts and custom perl to remove the low quality reads. The GC content, Q20 and Q30 of the raw reads were calculated. All downstream analyses were according to a range of length of clean reads, such as 18–30 nt for plant. The small RNA tags were mapped to the reference potato genome sequence (http://plants.ensembl.org/Solanum_tuberosum/Search/New?db=core) by Bowtie without mismatch to analyze their distribution and expression on the reference (Xu et al., 2011; Langmead et al., 2009).
Bioinformatic identification of known and novel miRNAs, and their differential expression under TOR inhibitors treatment
The mapped small RNA tags were aligned to the miRNA precursor/mature miRNA of plants and animals in the miRBase20.0 database for looking for known miRNA. The potential miRNAs and their secondary structures were obtained using modified software mirdeep2 (Friedlander et al., 2012) and srna-tools-cli (http://srna-tools.cmp.uea.ac.uk/). The Custom scripts were used to analyze the known miRNA counts and their base bias either on each position or on the first position with certain length.
The rRNA, tRNA, snRNA, snoRNA, repeat and protein-coding genes were deleted from the small RNA libraries based on RepeatMasker and Rfam database. And then the remaining sequences were used for predicting the novel miRNAs with the software miREvo (Wen et al., 2012) and mirdeep2 (Friedlander et al., 2012) through exploring the secondary structure, the minimum free energy and the Dicer cleavage site. The analysis of novel miRNA counts and their base bias was the same as that of known miRNA.
All miRNA abundances were evaluated and normalized using the tags per million reads (TPM) method through the following criteria (Zhou et al., 2010): TPM = number of mapped miRNA reads ×106/ number of clean sample reads. Differential expression analysis between the treatment and control was performed using the DESeq R package (1.8.3). The P-values were adjusted using q-value (Storey, 2003). /log2fold-change/ >1 and the corrected P-value (q-value) <0.01 were set as the threshold for significantly differential expression by default.
Prediction and annotation of target genes of miRNAs
The putative target genes of miRNAs were predicted by psRobot-tar in psRobot (Wu et al., 2012) for plants. All the target genes were annotated in the NCBI nr database and potato genome database (http://plants.ensembl.org/Solanum_tuberosum/Search/New?db=core). For further annotating the target gene candidates of differentially expressed miRNAs, Gene Ontology (GO) enrichment and the statistical enrichment of KEGG pathways were implemented using GOseq based Wallenius non-central hyper-geometric distribution and KOBAS, respectively (Mao et al., 2005; Young et al., 2010).
M RNA and miRNA validation by qRT-PCR
Four-week-old potato seedlings growing on the MS media were treated with TOR inhibitors (RAP + KU) and DMSO for 48 h and were collected for qRT-PCR. The mRNA validation was according to Deng et al. (2017). The primers for qRT-PCR designed by Primer premier 5 software were listed in Table S1. To validate the expression of miRNA, 1 µg of total RNA was reverse transcribed using Mir-X™ miRNA qRT-PCR TB Green™ Kit (Takara). The RT-qPCR analysis was performed according to the manufacturer’s protocol (Mir-X™ miRNA qRT-PCR TB Green™ Kit). The miRNA-specific primers were listed in Table S1 and reverse primers was provided by kit. Potato actin gene was used as constitutive references (Nicot et al., 2005; Payyavula, Singh & Navarre, 2013; Liu et al., 2015). All reactions were conducted with 3 biological replicates, and the relative expression of genes was conducted using the 2−ΔΔc(t) method.
Results
sRNA sequencing
The basic information of sRNA sequencing data from potato (BP12-OE line) with or without TOR inhibitor (RAP + KU) was shown in Fig. 1 and Table S2. The values of Q30 (bases correct recognition rate >99.9%) of the raw data were more than 97%. After removal of adapter contaminants, low quality reads, small reads and polyN, about 92.53% and 95.76% reads in total raw reads were clean reads in two groups, respectively (Fig. 1A). Finally, about 79.18% and 80.61% of the total clean reads with 18–30 nt read length could be mapped and matched to the potato genome sequence with bowtie, respectively (Langmead et al., 2009). For avoiding some sRNAs mapped to more than one annotation, the mapped clean total sRNAs were annotated according to the following priority rule: known miRNA >rRNA >tRNA >snRNA >snoRNA >repeat >NAT-siRNA >gene >novel miRNA >ta-siRNA (Fig. 1B). Most clean sRNA reads ranged from 21 to 24 nt, with 24 nt being the most abundant group of small RNAs, representing the typical length of Dicer-like protein 3 (DCL3)-derived products (Fig. 1C). The dominance of the 24 nt read length sRNA in potato is consistent with previous studies of other species, such as rice (Morin et al., 2008), cucumber (Cucumis sativus L.) (Mao et al., 2012), tomato (Solanum lycopersicum L.) (Cao et al., 2014), tobacco (Nicotiana tabacum L.) (Yin et al., 2015) and radish (Liu et al., 2018). The second abundant group is 21-nt miRNAs, which have the canonical size derivedfrom DCL1 processing. Most of the first nucleotide from the 5′end of the known and novel miRNAs was uridine (U), which was a bias for AGO1 (Mi et al., 2008), suggesting the important character of miRNAs was not changed under the treatment of TOR specific inhibitors (Fig. S1). In addition, in all the libraries, the total rRNA proportion was less than 60% which was used as a marker as the plant samples quality control.

Figure 1: The summary of basic information for the sRNA data.
(A) Statistical analysis of sequencing reads. (B) The number and proportion of different kind of sRNAs, “exon: +”: exon sense strand, “exon”: exon antisense strand, “intron: +”: intron sense strand, “intro: -”: intron antisense strand, NAT: natural antisense transcripts, repeat: repeat sequence, snoRNA: small nucleolar RNA, snRNA: small nuclear RNA, TAS: ta-si RNA. (C) The length distribution of clean sRNA.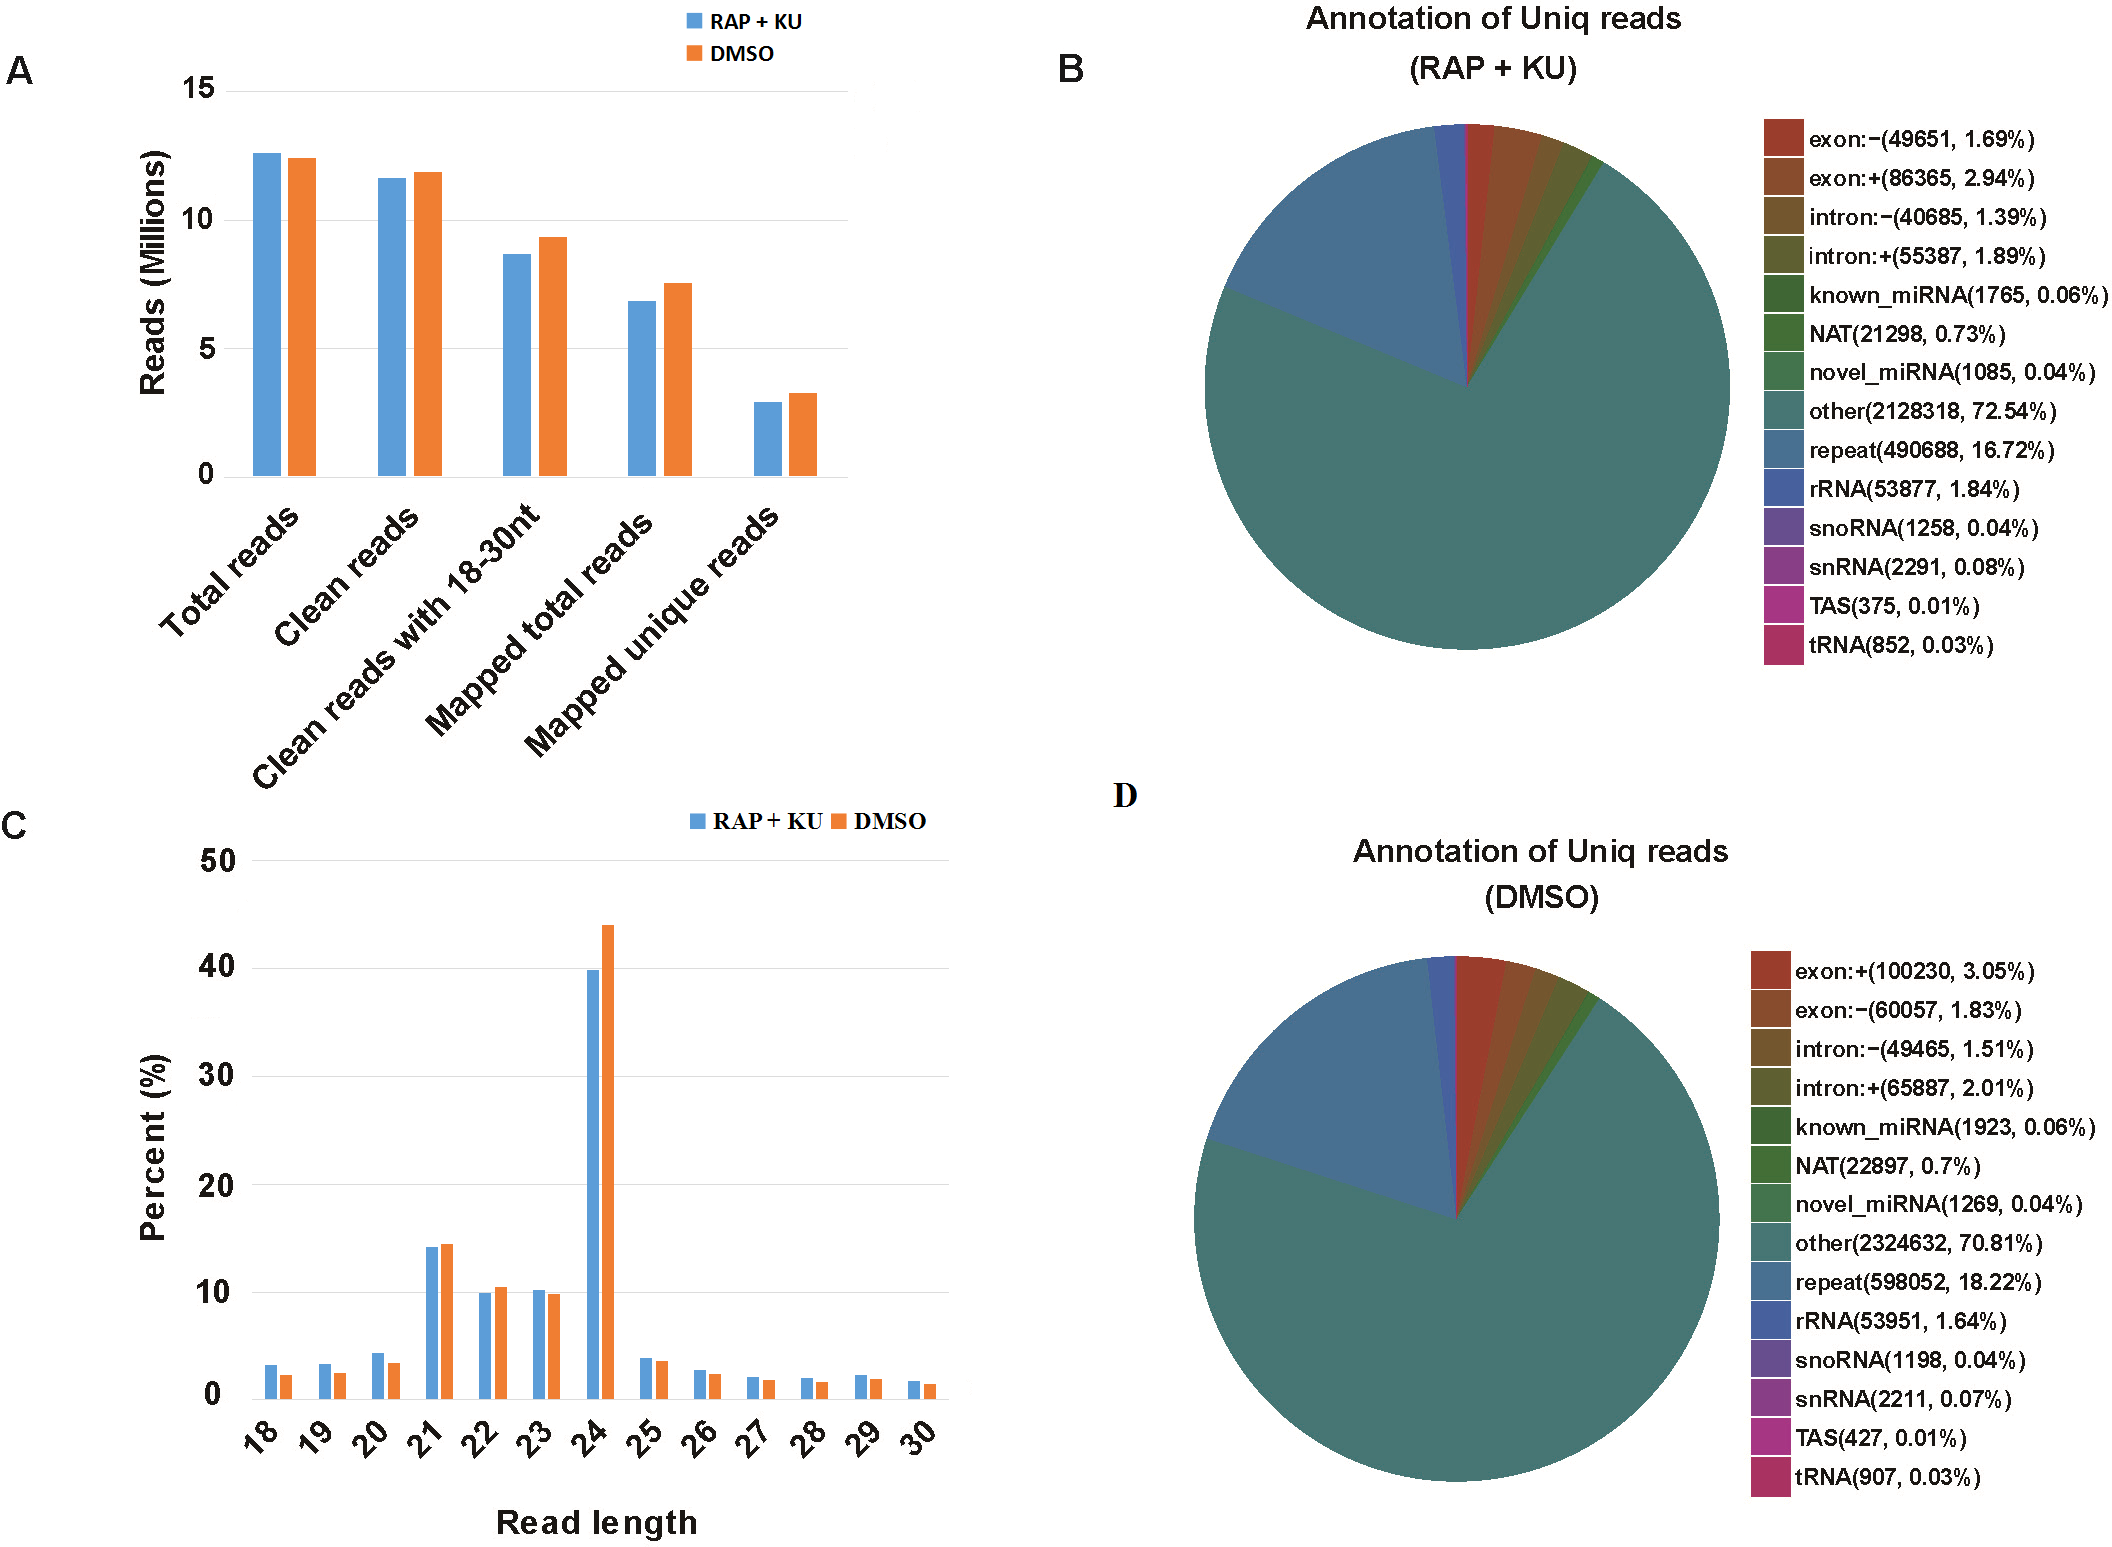
Identification of known and potential novel miRNAs in potato
In order for identifying the known miRNAs from sRNA libraries in potato, we compared the sRNA information with the known, up-dated and mature plant miRNAs deposited in the miRBase without any mismatching (Kozomara & Griffiths-Jones, 2014). Based on the blastn searches and further sequence analysis, the total of 193 known miRNA were observed and 174 known miRNA exist both in the RAP + KU and control libraries (Table S3). The read counts of the known miRNAs ranged from 0 to 24,000 in the RAP + KU and control libraries, which showed high diversity. About 17 and 22 known miRNAs were found to have more than 10,000 redundancies in the above groups, respectively (Table 1). Among these miRNAs, the miR166a-3p and miR319a-3p had the most reads.
| MiRNA | RAP+KU | DMSO | MiRNA | RAP+KU | DMSO |
|---|---|---|---|---|---|
| stu-miR319a-3p | 24000 | 13181 | novel_188 | 6057 | 11099 |
| stu-miR166a-3p | 14823 | 15988 | novel_1 | 5395 | 9175 |
| stu-miR166b | 10331 | 11160 | novel_16 | 2209 | 4329 |
| stu-miR398a-3p | 3832 | 11553 | novel_17 | 2169 | 2028 |
| stu-miR162a-3p | 4850 | 10908 | novel_18 | 839 | 1656 |
| stu-miR396-5p | 5382 | 5157 | novel_40 | 665 | 1026 |
| stu-miR482a-3p | 2292 | 4388 | novel_15 | 487 | 940 |
| stu-miR6022 | 4287 | 4798 | novel_30 | 733 | 764 |
| stu-miR319b | 3656 | 1197 | novel_34 | 604 | 711 |
| stu-miR482c | 1303 | 2880 | novel_56 | 280 | 439 |
| stu-miR4.2e−3p | 1344 | 2470 | novel_36 | 574 | 385 |
| stu-miR1919-5p | 1679 | 1703 | novel_38 | 256 | 322 |
| stu-miR156a | 1446 | 1972 | novel_59 | 162 | 298 |
| stu-miR156d-3p | 1357 | 2244 | novel_67 | 119 | 216 |
| stu-miR6149-5p | 1062 | 1807 | novel_60 | 138 | 195 |
| stu-miR395a | 1109 | 1526 | novel_62 | 128 | 188 |
| stu-miR482d-3p | 1325 | novel_137 | 137 | ||
| stu-miR6027 | 1839 | novel_84 | 118 | ||
| stu-miR482b-3p | 1609 | novel_68 | 106 | ||
| stu-miR384-5p | 1209 | novel_58 | 115 | ||
| stu-miR8036-3p | 1137 | ||||
| stu-miR6024-3p | 1060 |
The available softwares miREvo (Wen et al., 2012) and mirdeep2 (Friedlander et al., 2012) were integrated to predict potential novel miRNAs. Only those with stable hairpin structures were considered, because this was an essential characteristic for identification of novel miRNAs. Additionally, the binding locations of Dicer enzymes and free energies were used to evaluate these candidate miRNAs. Ultimately, 79 novel miRNAs were discovered from two potato libraries (Table S3). The novel miRNAs displayed lower expression levels, ranging from 0 to 11,652, when compared with known miRNAs. In the RAP + KU and control group, only 17 and 19 novel miRNAs were found to have more than 100 redundancies, respectively (Table 1). In general, many novel miRNAs discoveries in potato enriched the plant miRNA dataset.
TOR regulates potato miRNA expression
After obtaining the readcounts of all the miRNAs, the quantification and normalization of them were conducted by TPM (transcript per million) (Zhou et al., 2010) (Table S4). The two treatments have the similar distributions of the expression levels of all the miRNAs, and the high correlation (R2 = 0.873) of miRNA expression level showed the experimental reliability and reasonable sample selection (Figs. 2A–2B). MiRNAs with TPMs over 60 were regarded as expressing at a very high level and miRNAs with TPMs in the interval 0–1 were deemed not to be expressed at very low levels. About 86% of the total miRNAs (272) were expressed (TPM ≥ 1) and more than 146 miRNAs were highly expressed (TPM > 60) in the two treatments. Among them, one novel and 19 known miRNA were only observed in the sRNA libraries from TOR inhibition (RAP + KU), while 2 novel and 19 known miRNA were only detected in the control DMSO library, indicating TOR may completely inhibit or induce these miRNAs expression in potato.

Figure 2: The differentially expressed miRNAs between the treatment group (RAP + KU) and control (DMSO).
(A) Boxplot of the log transformed TPM expression values. (B) The correlation of miRNAs expression level between the treatment group (RAP + KU) and control (DMSO). (C) The number of differentially expressed miRNAs. (D) Hierarchical clustering of the differentially expressed miRNAs.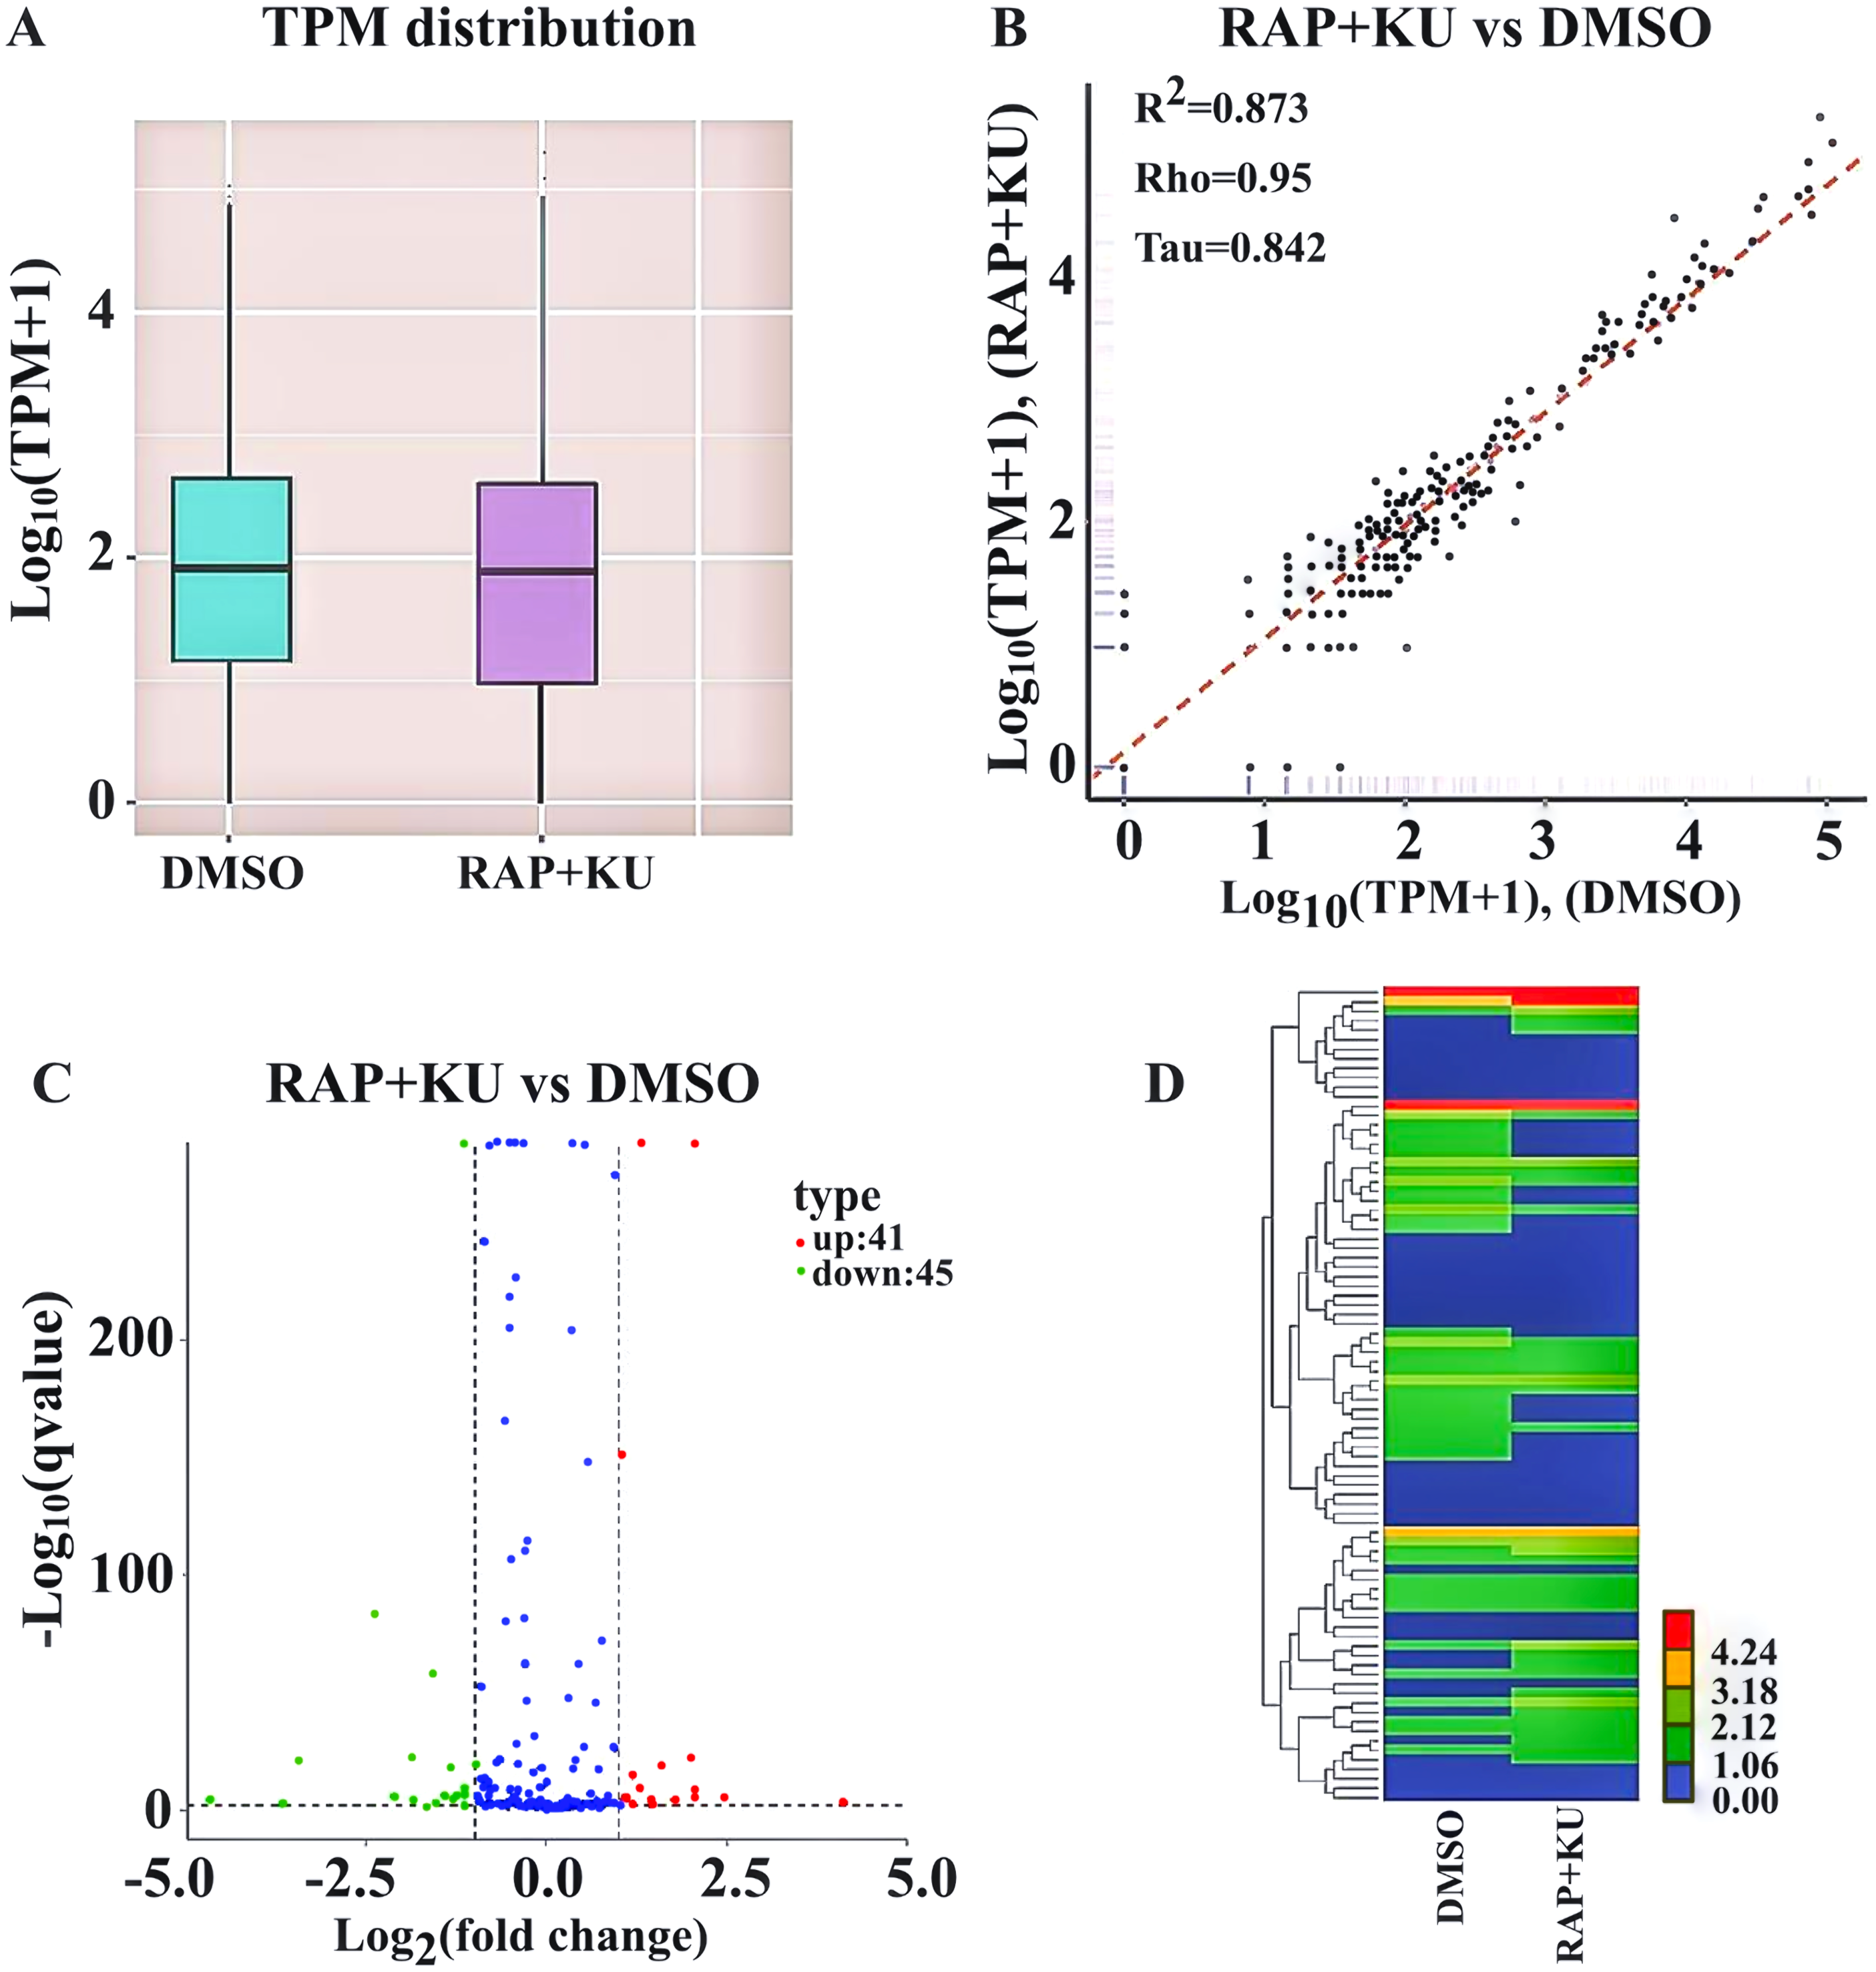
In order to identify the differentially expressed miRNAs, we compared the expression of the known and novel miRNAs between the TOR inhibitors and control treatment samples using the DEGseq (2010) R package. Total of 86 differentially expressed miRNAs were detected in the RAP + KU vs DMSO group, including 41 up-regulated and 45 down-regulated miRNAs (Fig. 2C). To obtain the miRNA expression patterns, we performed the hierarchical clustering of all the differentially expressed miRNAs based on the log10 (TPMs + 1) for the two sRNA libraries (Fig. 2D). The expression levels of all the differentially expressed miRNAs were listed in Table 2 and these miRNAs (stu-miR5303c, stu-miR8010, stu-miR8024a-3p and stu-miR8028-5p) had remarkable up-regulated differences, while these miRNAs (stu-miR3627-5p, stu-miR7985, stu-miR156f-3p and stu-miR8013) had remarkable down-regulated differences. The differential expression of about 1/3 of total miRNAs suggested that TOR may play a crucial role in the regulation of miRNAs expression in potato.
The prediction of miRNA target genes
In order to investigate the function of all the previously identified miRNAs in different biological processes, their potential target genes were predicted using psRobot_tar in psRobot for plants (Wu et al., 2012). Overall, 192 miRNAs got total 4,127 predicted target genes in 272 identified miRNAs (Table S5). Except the numbered EPlSTUG genes, all the rest (4081) numbered PGSC0003DMG genes were annotated in the website (http://plants.ensembl.org/Solanum_tuberosum/Search/New?db=core) and listed in Table S6. The number of potential targets in the potato is variable for each miRNA from 1 to 772, and most of them have multiple target genes, which are consistent with other reports (Curaba et al., 2012; Xie, Frazier & Zhang, 2011). The top three miRNAs are stu-miR7797a (772), stu-miR5303h (751) and stu-miR5303g (743). The results indicated the single miRNA might possess wide-ranging functions and involve in different kinds of signal pathways in potato. The products of the target genes include functional protein, transcriptional factors and enzyme, etc.
The putative function of differentially expressed miRNAs
Some differential expression miRNAs had been reported in other species, such as miR156 and miR169 etc., (Xiong et al., 2013, Jiao et al., 2010; Meng et al., 2011; Wu et al., 2009). In addition to these miRNAs, there are a large number of miRNA functions that have not been studied. In order to understand the regulatory functions of differentially expressed miRNAs, we carried out the miRNA target prediction analysis and annotated the target genes according to the website (http://plants.ensembl.org/Solanum_tuberosum/Search/New?db=core) (Table S7). The putative miRNA target genes participated in many biological processes such as cell wall modification, the cell cycle, photosynthesis, nutrient transport, carbon and nitrogen utilization, autophagy, ubiquitination, senescence, protein and lipid metabolism, chromatin structure, hormone metabolism, signaling and stress-related processes. This result was also consistent with differentially expressed genes related to the TOR-regulated pathways reported by previous transcriptome studies (Park et al., 2002; Payyavula, Singh & Navarre, 2013; Xiong & Sheen, 2014; Caldana et al., 2013). And then Numerous GO functional and KEGG pathway enrichment of differentially expressed miRNAs were detected, suggesting TOR regulated miRNAs participated in many biological metabolic processes in potato (Tables S8A–S8B). These results suggest that miRNA may play a vital role in the regulation of metabolic processes in TOR signaling.
| MiRNA | Log2 (RAP + KU)/ DMSO | Q valve | MiRNA | Log2 (RAP + KU)/ DMSO | Q valve |
|---|---|---|---|---|---|
| stu-miR3627-5p | −6.01 | 9.80E−10 | novel_36 | 1.03 | 1.08E−15 |
| stu-miR7985 | −4.69 | 6.26E−05 | novel_99 | 1.04 | 5.16E−05 |
| stu-miR156f-3p | −4.69 | 6.26E−05 | stu-miR8031 | 1.08 | 1.09E−06 |
| stu-miR8013 | −4.69 | 6.26E−05 | novel_115 | 1.11 | 4.12E−05 |
| novel_111 | −3.69 | 2.74E−03 | stu-miR4376-3p | 1.19 | 1.56E−15 |
| stu-miR169a-3p | −3.69 | 2.74E−03 | novel_53 | 1.19 | 1.34E−03 |
| stu-miR1886 h | −3.69 | 2.74E−03 | stu-miR172c-3p | 1.19 | 1.34E−03 |
| stu-miR1886i-3p | −3.69 | 2.74E−03 | stu-miR8032a-5p | 1.32 | 5.10E−10 |
| stu-miR477a-3p | −3.69 | 2.74E−03 | stu-miR319a-3p | 1.32 | 0.00E+00 |
| stu-miR7986 | −3.69 | 2.74E−03 | stu-miR8033-3p | 1.45 | 7.30E−03 |
| stu-miR7998 | −3.69 | 2.74E−03 | novel_117 | 1.45 | 1.01E−05 |
| stu-miR8015-3p | −3.69 | 2.74E−03 | stu-miR8020 | 1.45 | 8.78E−04 |
| stu-miR8034 | −3.69 | 2.74E−03 | stu-miR399a-3p | 1.60 | 1.48E−19 |
| stu-miR8041a-5p | −3.69 | 2.74E−03 | stu-miR8025-5p | 1.78 | 3.42E−05 |
| novel_154 | −3.69 | 2.74E−03 | stu-miR399j-3p | 1.98 | 1.74E−22 |
| stu-miR7987 | −3.69 | 2.74E−03 | stu-miR8030-5p | 2.04 | 8.87E−07 |
| stu-miR8023 | −3.69 | 2.74E−03 | novel_161 | 2.04 | 2.93E−09 |
| stu-miR8050-5p | −3.69 | 2.74E−03 | stu-miR319b | 2.06 | 0.00E+00 |
| stu-miR7979 | −3.69 | 2.74E−03 | stu-miR5304-5p | 2.45 | 4.44E−06 |
| stu-miR8004 | −3.69 | 2.74E−03 | stu-miR8008b | 2.45 | 4.44E−06 |
| stu-miR8045 | −3.69 | 2.74E−03 | stu-miR7995 | 2.45 | 4.44E−06 |
| stu-miR7122-5p | −3.45 | 1.86E−21 | stu-miR399g-3p | 4.14 | 1.21E−03 |
| novel_103 | −2.40 | 8.42E−84 | stu-miR8001b-3p | 4.14 | 1.21E−03 |
| stu-miR5303j | −2.13 | 9.01E−07 | stu-miR8014-3p | 4.14 | 1.21E−03 |
| stu-miR7984c-3p | −2.13 | 9.01E−07 | stu-miR8024a-5p | 4.14 | 1.21E−03 |
| stu-miR171d-5p | −1.87 | 2.36E−05 | stu-miR7990b | 4.14 | 1.21E−03 |
| novel_120 | −1.87 | 5.85E−23 | stu-miR167a-3p | 4.14 | 1.21E−03 |
| stu-miR169f-3p | −1.87 | 2.36E−05 | stu-miR7983-5p | 4.14 | 1.21E−03 |
| stu-miR8032b-3p | −1.87 | 2.36E−05 | stu-miR166c-5p | 4.14 | 1.21E−03 |
| stu-miR397-3p | −1.59 | 6.32E−59 | stu-miR8048-3p | 4.14 | 1.21E−03 |
| stu-miR164-5p | −1.55 | 4.66E−04 | stu-miR8012 | 4.14 | 1.21E−03 |
| stu-miR7991a | −1.55 | 4.66E−04 | stu-miR5304-3p | 4.14 | 1.21E−03 |
| stu-miR8007a-3p | −1.55 | 4.66E−04 | stu-miR8018 | 4.14 | 1.21E−03 |
| stu-miR8038a-5p | −1.42 | 2.91E−07 | stu-miR3627-3p | 4.14 | 1.21E−03 |
| novel_93 | −1.33 | 3.38E−19 | stu-miR6023 | 4.14 | 1.21E−03 |
| novel_162 | −1.28 | 3.82E−06 | novel_182 | 4.14 | 1.21E−03 |
| stu-miR7997a | −1.28 | 3.82E−06 | stu-miR8011a-3p | 4.14 | 1.21E−03 |
| stu-miR172d-5p | −1.25 | 3.20E−07 | stu-miR5303c | 5.14 | 1.01E−05 |
| stu-miR398a-3p | −1.14 | 0.00E+00 | stu-miR8028-5p | 5.14 | 1.01E−05 |
| novel_193 | −1.13 | 2.95E−07 | stu-miR8024a-3p | 5.73 | 9.15E−08 |
| stu-miR399a-5p | −1.13 | 5.49E−03 | stu-miR8010 | 5.73 | 9.15E−08 |
| novel_116 | −1.13 | 1.58E−10 | |||
| stu-miR5303 h | −1.13 | 2.39E−08 | |||
| stu-miR7980b-5p | −1.13 | 5.49E−03 | |||
| novel_108 | −1.01 | 7.44E−20 |
Integrative miRNA-mRNA expression and function analysis
In our previous study, our focus is on the relationship between auxin, TOR and adventitious root formation (Deng et al., 2017). Our transcriptome data showed that a large number of genes associated with root development were differentially expressed in potato seedling under TOR inhibitor treatment. Loss of auxin signaling after TOR suppression results in significant down-regulation of these genes (Morin et al., 2008; Deng et al., 2017). In addition, a large number of genes related to biosynthesis and metabolism are differentially expressed. How TOR affects the expression of these genes is still unclear. To further determine the regulatory function of TOR at post-transcriptional level, we performed miRNA-mRNA reverse correlation analysis to identify reliable miRNA and their targets. In present study, thirteen up-regulated miRNAs and 14 down-regulated miRNAs were corresponding to 47 down-regulated 82 up-regulated mRNAs, respectively (Tables S9A–S9D). GO functional (Table S10A–S10B) and KEGG pathway (Fig. 3) analysis showed that the negatively correlated miRNA/mRNA interaction pairs participate in some key metabolic processes such as lipid synthesis, amino acid metabolism, nitrogen metabolism, flavonoid biosynthesis and so on. To validate the results of high-throughput sRNA sequencing, the expression patterns of 8 miRNAs were analyzed by qRT-PCR. Meanwhile, to detect the expression patterns of the targets identified by transcriptome analysis, 6 target genes were selected for qRT-PCR analysis. The results showed that all the selected miRNAs and targets shared similar expression tendency with the original results (Fig. 4).
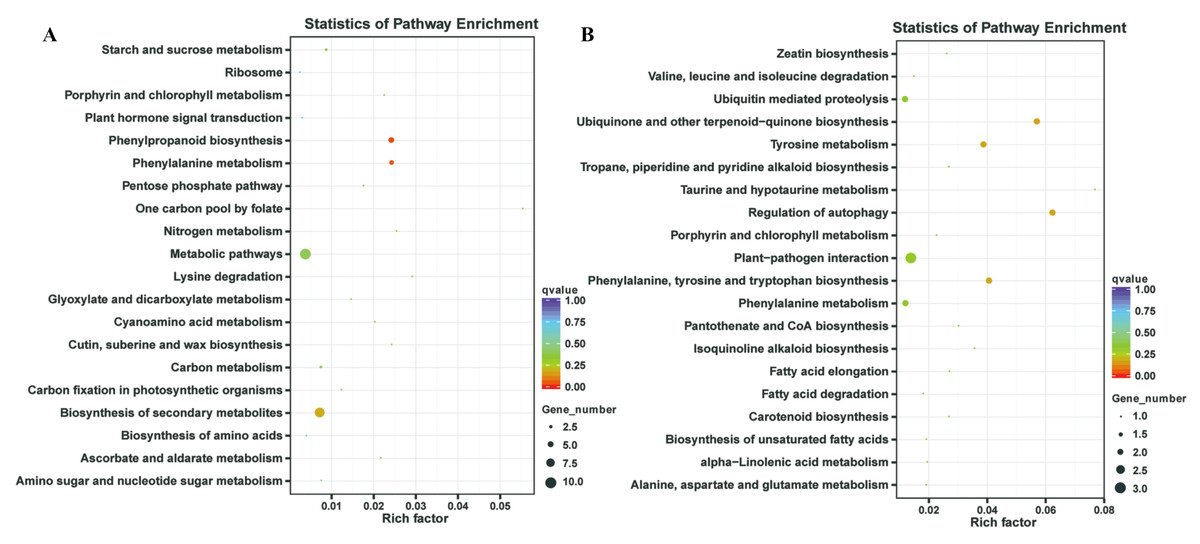
Figure 3: Kyoto Encyclopedia of Genes and Genomes (KEGG) enrichment analysis.
(A) KEGG enrichment based on down-regulated DEGs under the TOR inhibition. (B) KEGG enrichment based on up-regulated DEGs under the TOR inhibition.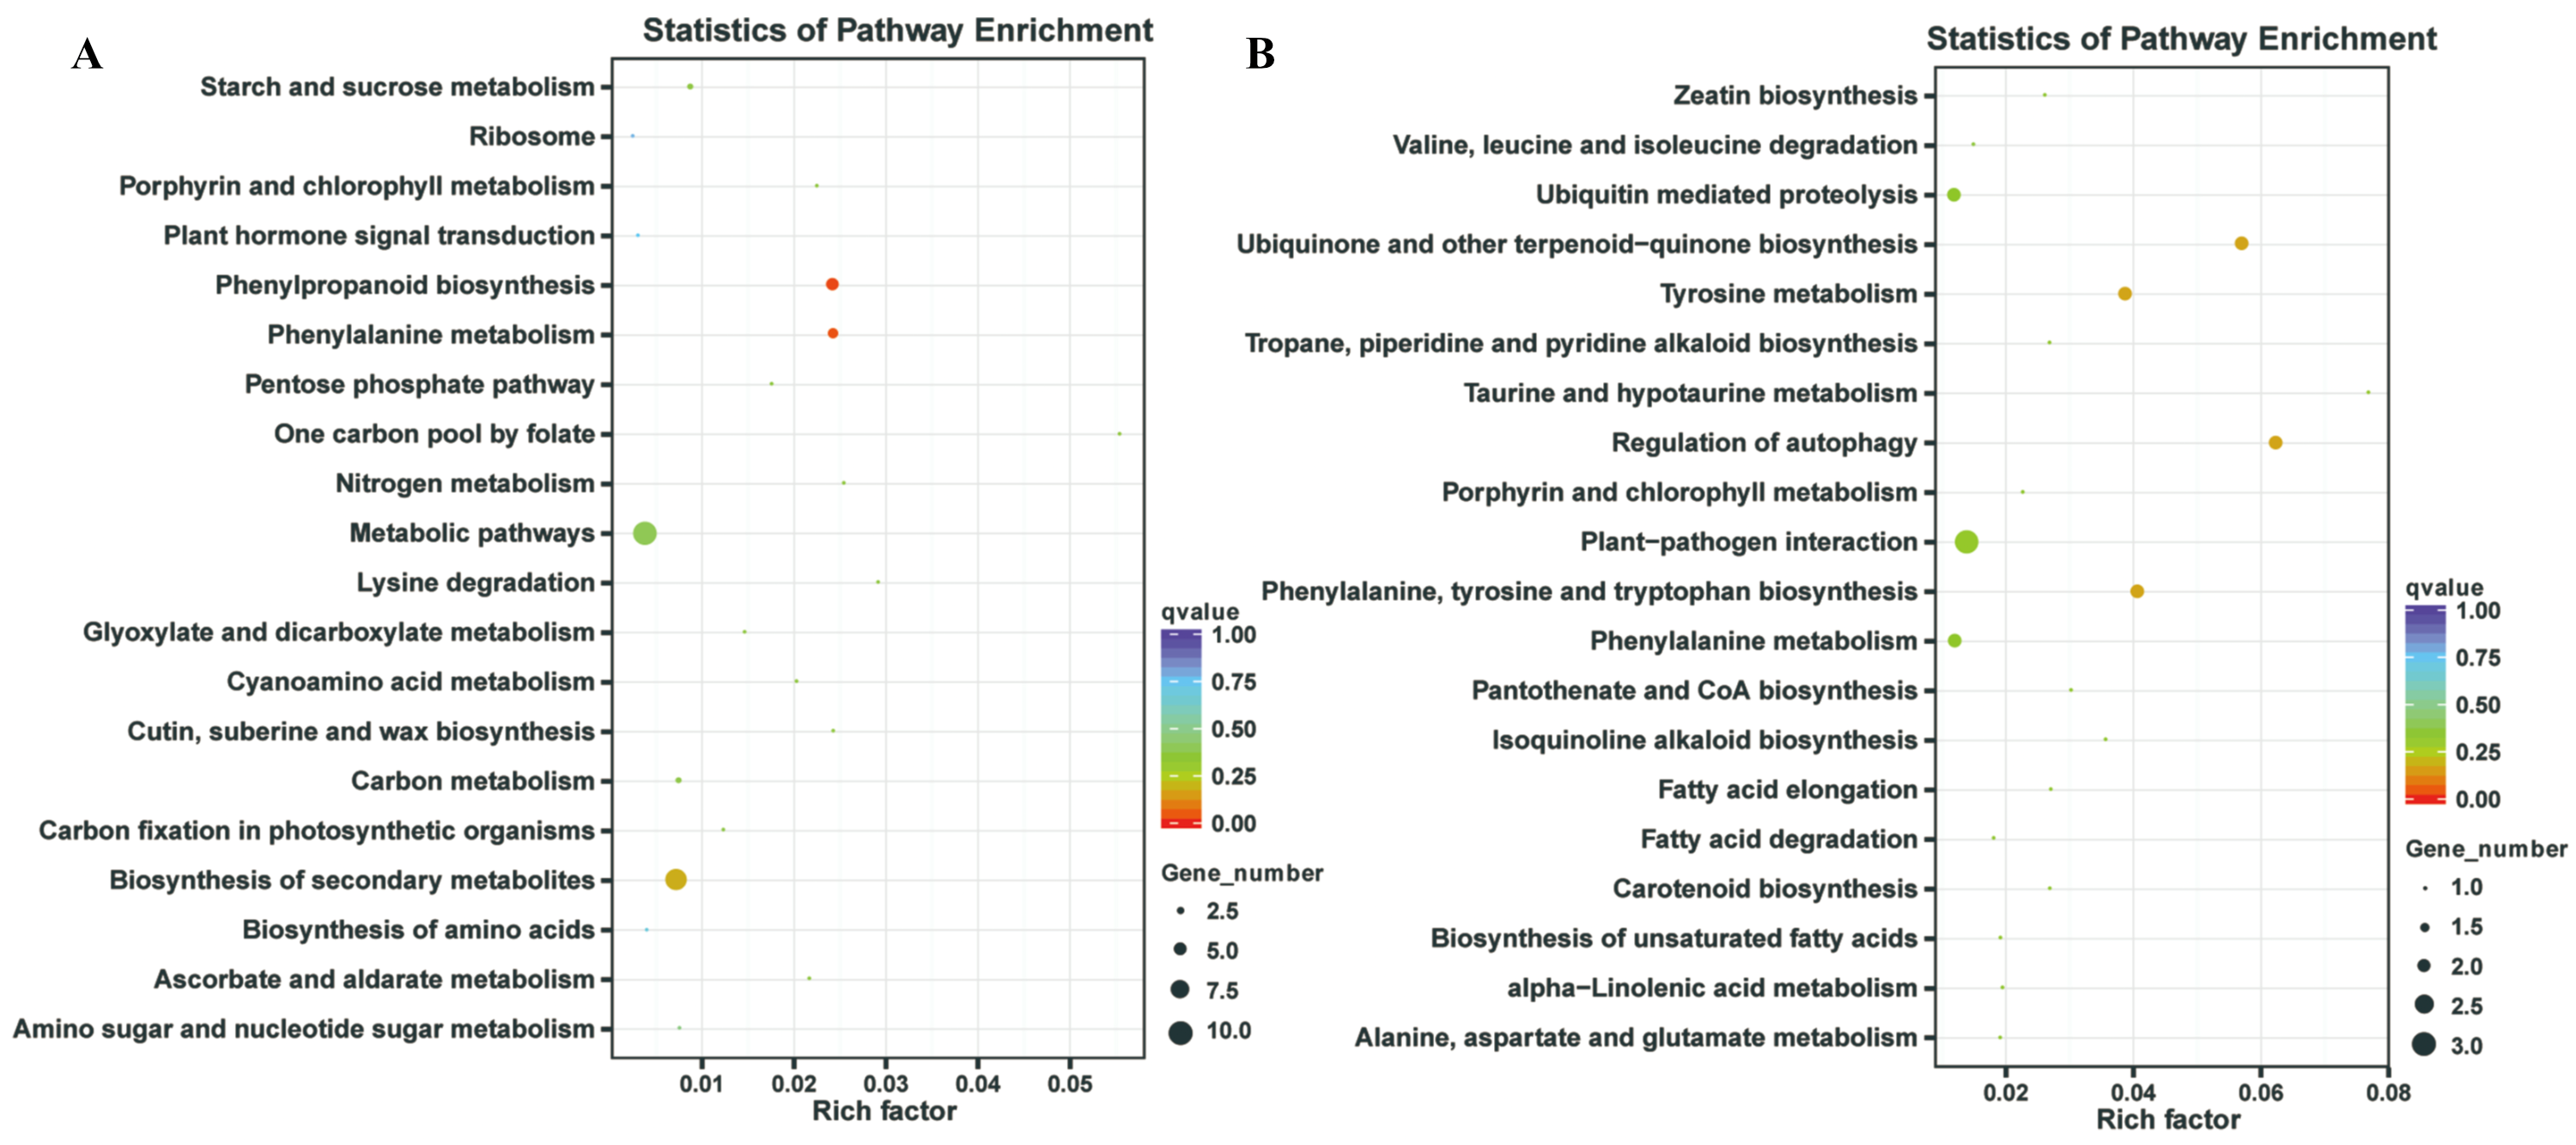
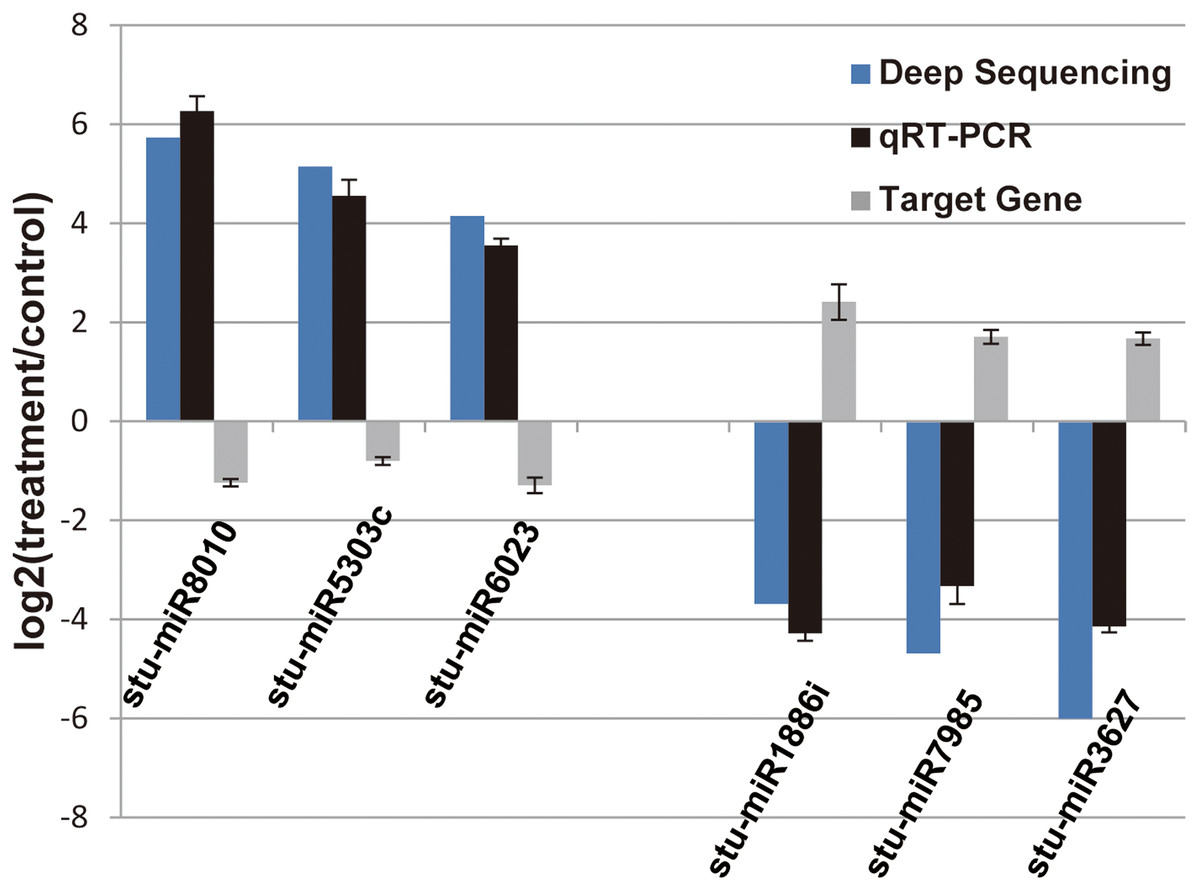
Figure 4: Verification of the selected miRNAs and their potential target genes by qRT-PCR.
Relative expression levels of the selected six miRNAs (stu-miR8010, stu-miR5303c, stu-miR6023, stu-miR1886i, stu-miR7985 and stu-miR3627) and their potential target genes (PGSC0003DMG400026112, PGSC0003DMG400028214, PGSC0003DMG400008584, PGSC0003DMG400023703, PGSC0003DMG402018257 and PGSC0003DMG401025397) were measured by RT-qPCR. U6 and actin were used as internal control for miRNAs and mRNA RT-qPCR, respectively.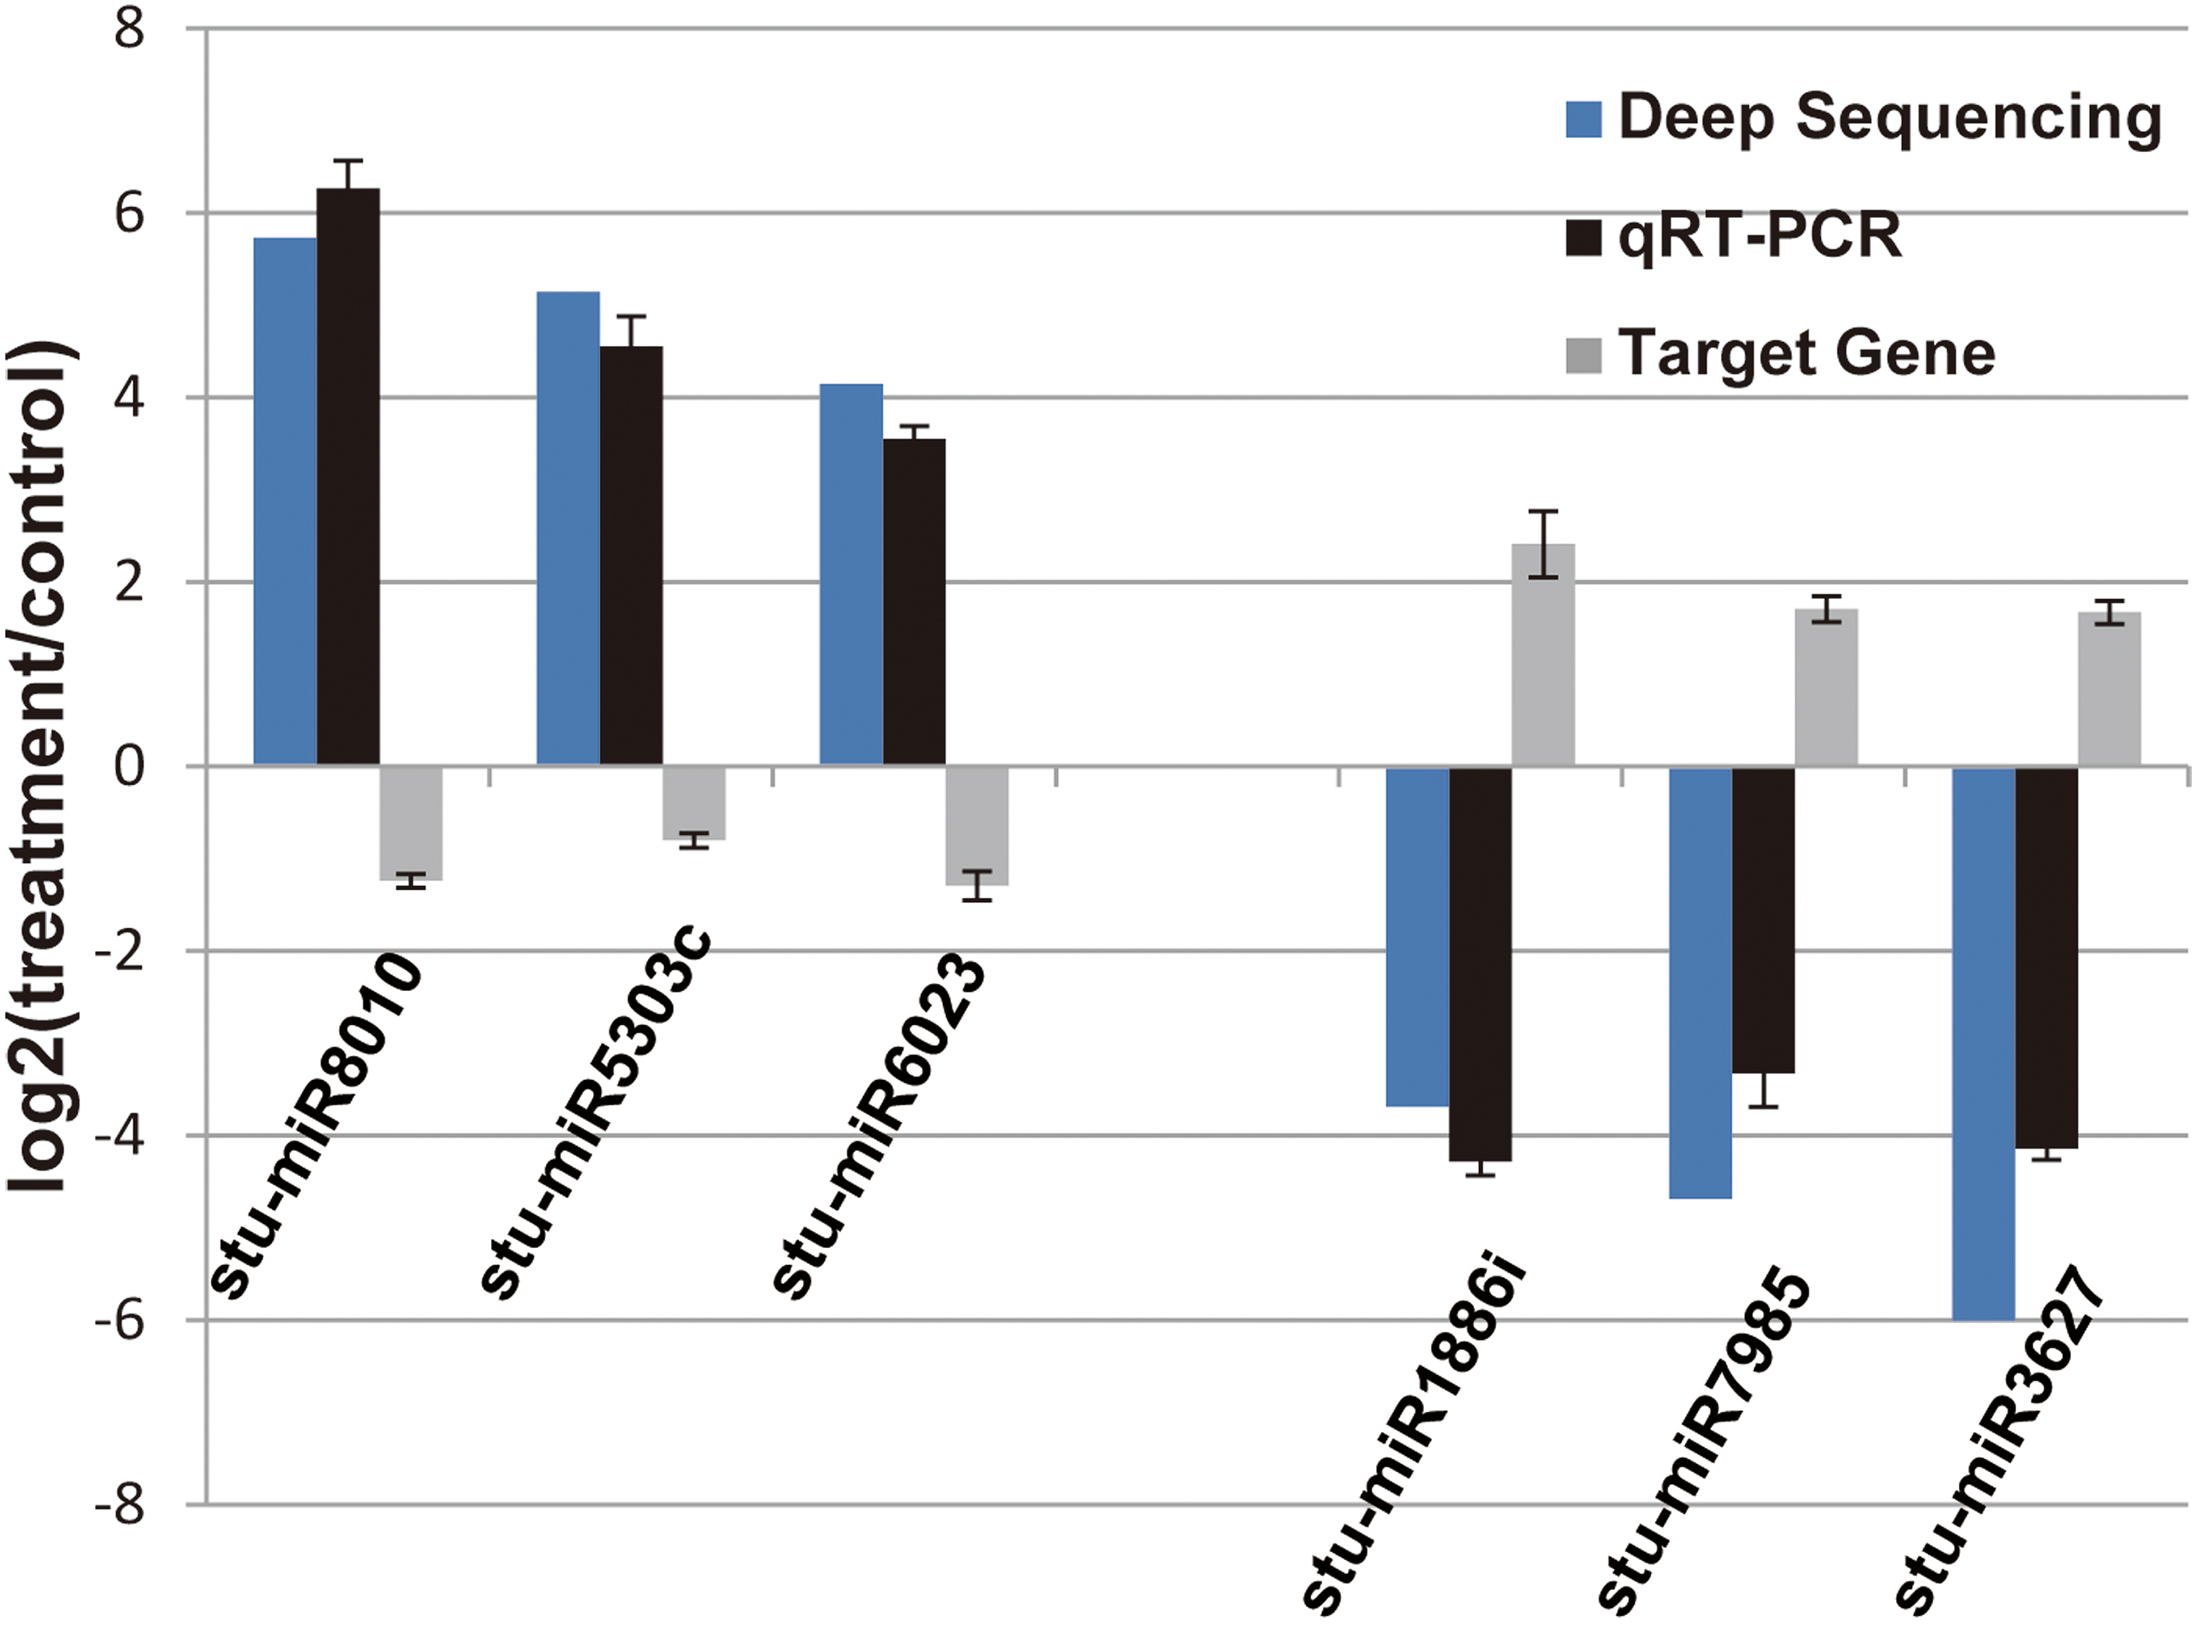
Differentially expressed miRNAs were involved in some anabolic and biosynthetic pathways
TOR, as a central regulator of anabolism, participates in many biosynthetic processes, such as ribosome biosynthesis, and protein translation and synthesis. In the integrative miRNA-mRNA data, DE miRNAs target genes also participate in many anabolism processes. As shown in Fig. 3 and Table 3, differentially expressed miRNAs were involved in phenylpropanoid biosynthesis, cutin, suberine and wax biosynthesis. On the other hand, TOR also negatively regulates the synthesis of some metabolites, such as glucosinolates and flavonoids. Suppression of TOR could up-regulated genes responsible glucosinolates and flavonoids synthesis (Caldana et al., 2013). It was found that the differentially expressed miRNAs target genes were also involved in the biosynthesis of flavonoids, suggesting that TOR may regulate the biosynthesis of flavonoids relying on miRNAs. Interestingly, TOR, as the core regulatory element of ribosomal biosynthesis, large number genes of ribosome was differentially expressed in transcriptomics. But only few differentially expressed miRNAs target genes were involved in ribosomal biosynthesis. These results indicated that miRNAs are only part of TOR regulation networks in transcription and post-transcriptional level.
| MiRNA | Target gene_id | Log2FoldChange | Pval | Gene description |
|---|---|---|---|---|
| Ribosome | ||||
| stu-miR8020 | PGSC0003DMG400030153 | −0.31601 | 1.55E−04 | Ribosomal protein L18a |
| Biosynthesis of amino acids | ||||
| stu-miR7983-5p | PGSC0003DMG400022088 | −0.40026 | 1.28E−07 | Transketolase, C-terminal |
| Cutin, suberine and wax biosynthesis | ||||
| stu-miR8011a-3p | PGSC0003DMG400004844 | −0.77456 | 4.95E−07 | Glucose-methanol-choline oxidoreductase, N-terminal |
| Phenylpropanoid biosynthesis | ||||
| stu-miR4376-3p | PGSC0003DMG400020795 | −2.9897 | 1.54E−06 | Haem peroxidase, plant/fungal/bacterial |
| stu-miR5303c | PGSC0003DMG400003013 | −0.60889 | 3.06E−04 | Glycoside hydrolase family 3 |
| stu-miR7983-5p | PGSC0003DMG400005872 | −2.6826 | 2.42E−19 | Plant peroxidase |
| stu-miR4376-3p | PGSC0003DMG400022541 | −0.73675 | 1.21E−03 | Haem peroxidase, plant/fungal/bacterial |
| stu-miR4376-3p | PGSC0003DMG400020801 | −3.3592 | 4.72E−10 | Peroxidases heam-ligand binding site |
| Ubiquinone and other terpenoid-quinone biosynthesis | ||||
| stu-miR7997a | PGSC0003DMG400021276 | 2.1196 | 3.17E−19 | Pyridoxal phosphate-dependent transferase, major region, subdomain 1 |
| stu-miR8045 | PGSC0003DMG400017707 | 0.52448 | 3.78E−08 | 4-hydroxyphenylpyruvate dioxygenase |
| Phenylalanine, tyrosine and tryptophan biosynthesis | ||||
| stu-miR5303 h,stu-miR5303j | PGSC0003DMG400011282 | 1.4353 | 4.63E−03 | Tryptophan synthase, beta chain, conserved site |
| stu-miR7997a | PGSC0003DMG400021276 | 2.1196 | 3.17E−19 | Pyridoxal phosphate-dependent transferase, major region, subdomain 1 |
| Isoquinoline alkaloid biosynthesis | ||||
| stu-miR7997a | PGSC0003DMG400021276 | 2.1196 | 3.17E−19 | Pyridoxal phosphate-dependent transferase, major region, subdomain 1 |
| Pantothenate and CoA biosynthesis | ||||
| stu-miR5303 h,stu-miR5303j,stu-miR7997a | PGSC0003DMG400013511 | 0.37163 | 1.54E−04 | ATCOAA—Type II pantothenate kinase |
| Tropane, piperidine and pyridine alkaloid biosynthesis | ||||
| stu-miR7997a | PGSC0003DMG400021276 | 2.1196 | 3.17E−19 | Pyridoxal phosphate-dependent transferase, major region, subdomain 1 |
| Fatty acid elongation | ||||
| stu-miR8004 | PGSC0003DMG400014549 | 0.73372 | 1.65E−04 | Thiolase-like |
| Carotenoid biosynthesis | ||||
| stu-miR5303 h,stu-miR5303j | PGSC0003DMG402018475 | 1.1371 | 1.49E−03 | Cytochrome P450 |
| Zeatin biosynthesis | ||||
| stu-miR5303 h,stu-miR5303j | PGSC0003DMG400023732 | 1.0493 | 3.57E−08 | UDP-glucuronosyl/UDP-glucosyltransferase |
| Biosynthesis of unsaturated fatty acids | ||||
| stu-miR8050-5p | PGSC0003DMG400020620 | 0.40349 | 8.59E−06 | ACX2—Acyl-CoA dehydrogenase/oxidase C-terminal |
| Lysine degradation | ||||
| stu-miR5303c | PGSC0003DMG400001557 | −0.33784 | 2.01E−03 | Histone H3-K9 methyltransferase, plant |
| Regulation of autophagy | ||||
| stu-miR5303 h,stu-miR5303j,stu-miR7997a | PGSC0003DMG402022314 | 0.28852 | 2.09E−03 | Ubiquitin-related domain |
| stu-miR7997a | PGSC0003DMG402012477 | 0.33886 | 3.04E−04 | Autophagy protein Atg8 ubiquitin-like |
| Ubiquitin mediated proteolysis | ||||
| stu-miR5303 h,stu-miR5303j,stu-miR7997a | PGSC0003DMG400003897 | 0.29401 | 1.31E−03 | Zinc finger, RING-type |
| stu-miR5303 h,stu-miR5303j,stu-miR7997a | PGSC0003DMG400019395 | 0.43331 | 9.66E−07 | Ubiquitin-conjugating enzyme/RWD-like |
| Fatty acid degradation | ||||
| stu-miR8050-5p | PGSC0003DMG400020620 | 0.40349 | 8.59E−06 | ACX2—Acyl-CoA dehydrogenase/oxidase C-terminal |
| Valine, leucine and isoleucine degradation | ||||
| stu-miR5303 h,stu-miR5303j | PGSC0003DMG400011330 | 0.7956 | 4.46E−15 | BCE2—Chloramphenicol acetyltransferase-like domain |
Differentially expressed miRNAs related to some catabolic processes
Catabolic pathways is another set of metabolism that breaks down large molecules (such as lipids, polysaccharides, proteins and nucleic acids) into smaller unites (such as fatty acids, monosaccharides, amino acids and nucleotides, respectively) which are either oxidized to release energy or used in other anabolic reactions. Autophagy is a natural regulated project of the cell that disassembles unnecessary or dysfunctional components for turnover and recycling of intracellular macro molecules and whole organelles. In the mammals, many miRNAs (such as miR-145, miR-181, miR-93-5p, miR-33 and miR-21) (Zhang et al., 2017b) as the upstream regulator of TOR signaling pathway were shown to modulate disease biogenesis through inhibiting autophagy. In this study, the KEGG pathway “regulation of autophagy” was affected under the TOR suppression, and a total of three down-regulated miRNAs as the downstream of the TOR signaling pathway were targeting the autophagy-related genes (Table 3). Ubiquitination is a key posttranslational modification carried out by a set of three enzymes: ubiquitin-activating enzyme (E1), ubiquitin-conjugating enzymes (E2), and ubiquitin-protein ligase (E3). The “ubiquitin mediated proteolysis” KEGG pathway was one of the most enriched pathways in the miRNA data. A total of four differentially expressed ubiquitination-related miRNAs were observed and three were significantly down-regulated (Table 3). These observations strongly support the previous results in which TOR negatively regulated the catabolic process (autophagy and ubiquitination) in yeast, mammals and plants (Xiong & Sheen, 2014; Dong et al., 2015). In previously studies, it has showed that suppression of TOR could lead to accumulation of sugars and lipids in Arabidopsis (Caldana et al., 2013; Dobrenel et al., 2013). In this study, we found that many miRNA targeted genes were involved in these metabolic processes. TOR may influence the metabolic processes of sugars and lipids by regulating corresponding miRNAs. Thus, our results showed that miRNAs may act as a bridge between TOR and catabolism.
Discussion
MiRNAs play an important role in plant growth, development and stress response. Through high-throughput sequencing technologies, many of the evolutionary conserved and novel miRNAs were detected in different species. A large number of miRNAs are still unidentified due to its low expression levels, tissue specificity or spatio-temporal expression specificity. In this study, total of 193 known miRNAs and 79 novel miRNAs were identified, largely increasing the number of miRNAs in potato. Furthermore, we found that the expression of a large number of miRNAs was affected by TOR in potato. About 86 miRNAs were differentially expressed between the libraries of TOR inhibition and the control, suggesting TOR play a crucial role in regulation the expression of miRNA. The expression levels of stu-miR5303c, stu-miR8010, stu-miR8024a-3p and stu-miR166c-5p had remarkable up-regulated differences, while that of stu-miR3627-5p, novel_111, stu-miR169a-3p and stu-miR1886h, etc., had remarkable down-regulated differences. These data suggested TOR plays a crucial role in regulation the expression of miRNA. The functions of these miRNAs have been reported in other species, such as miR156, miR164 and miR319 et al. The role of miR156 in controlling flower development is highly conserved in rice, tomato and maize (Hong & Jackson, 2015). MiR164 can target to NAC transcription factors to modulate root development and drought resistance in Z. mays and rice, respectively (Li et al., 2012; Fang, Xie & Xiong, 2014). Zhao et al. (2015) showed that miR319/TCP4 module played a crucial role in systemic defensive response in tomato. In addition, the role of these differentially expressed miRNAs was partially revealed in potato as well, such as miR156, miR172 and miR169. MiR156 and miR172 is involved in regulating developmental timing in Arabidopsis (Wu et al., 2009). Consistently, miR156 and miR172 affect not only flowering time, but also the timing of tuberization in potato. Similarly, miR169 is conserved related with salt stress in potato and other species (Yang et al., 2016; Zhao et al., 2009; Luan et al., 2015). Indeed, it has been reported that both TOR and miRNAs are involved in many different signaling pathways to regulate plant growth and development in previous studies (Jones-Rhoades, Bartel & Bartel, 2006; Shi, Wu & Sheen, 2018). Whether TOR can regulate plant growth and development through these known miRNAs identified in this study may be a field worthy of research. In addition, many differentially expressed miRNAs identified in this study are unknown function miRNAs. Integrated mRNA and miRNA expression profiling will be helpful to predict the function of these unknown miRNAs. In this study, through the combined analysis of miRNAomics and transcriptomics, the obtained RNA-miRNA regulatory networks partially reveal the function of TOR in post-transcriptional regulation. Our data revealed more than 120 miRNA-mRNA regulatory networks involved in TOR signaling and thus provided circumstantial evidence for miRNAs involving in the role of TOR in modulating gene expression at post-transcriptional level. These data will provide valuable information for further investigation of the molecular mechanisms of miRNA involved in the TOR signaling pathway.
TOR as a core regulator of cell growth can regulate the many biological process of the organism at different levels such as: gene transcription, protein translation and synthesis and metabolic processes. A number of transcriptome analyses have showed that TOR was involved in the regulation of genes expression at transcriptional level in plants (Dong et al., 2015; Caldana et al., 2013; Song et al., 2017; Xiong et al., 2013). It had found that some transcription factors are involved in TOR signaling pathway in mammals, such as SREBP1, HIF1α and YY1 (Laplante & Sabatini, 2012; Zoncu, Efeyan & Sabatini, 2011; Li et al., 2011; Porstmann et al., 2008; Cunningham et al., 2007). In addition, Xiong & Sheen (2014) and Xiong et al. (2013) had firstly found the transcription factors E2Fa and E2Fb which could directly activate by TOR kinase in Arabidopsis. However, compared with the thousands differential expression genes after TOR inhibition, transcription factors directly regulated by TOR signaling pathway are very limited. In previous studies, it has shown that miRNAs can target to signaling proteins, enzymes, transcription factors and other genes, and Cui et al. declare that miRNAs preferentially target the downstream components of the adaptors, which have potential to recruit more downstream components, such as TFs based on bioinformatics analysis (Cui et al., 2006). In this study, we found that many differentially expressed miRNAs can target to TFs, such as miR164, miR156, miR169, miR172 and so on (Jiao et al., 2010; Wu et al., 2009; Zhao et al., 2009; Guo et al., 2005). In addition, we also found that some function unknown miRNAs can target to TFs based on integrated mRNA and miRNA expression profiling, such as miR5303j- PGSC0003DMG400028381 (a WRKY transcription factor) module and miR8050- PGSC0003DMT400021748 (a GRAS transcription factor) module. Furthermore, Cui et al. showed that variation of expression of miRNA targets is significantly lower than that of other genes in different species (Cui et al., 2007), implying that TOR-miRNA-mRNA(TF) module may be an important complement to TOR- substrate and TOR-TFs pathway in TOR-related conserved functions in eukaryotes, such as ribosome biosynthesis and lipid synthesis (Shi, Wu & Sheen, 2018). On the other hand, our data showed that differentially expressed miRNAs only participates in part of the function of TOR, suggesting that the regulation of gene transcripts by TOR signaling may rely on transcription factors at transcriptional level and other long non-coding RNA at transcriptional or post-transcriptional level. As an important cash crop, potato tubers contain abundant sugar, protein and other nutrients. TOR is a core regulator of metabolism in eukaryotes. MiRNAs also play key roles in many biological processes in animals and plants (Vaucheret, 2006; Shabalina & Koonin, 2008). How to modify these signals to regulate potato metabolism and optimize the nutritional value of potato tuber (secondary metabolites, lipid content and fatty acid composition, starch content or amino acid content) is a future course. In our current study, we predicted multiple TOR-miRNA-RNA regulatory networks for its relevance in biological metabolism. However, their roles in potato growth and development and application values in crop improvement needs further study.
Conclusion
In conclusion, we identified 86 miRNAs that are regulated by TOR signaling in potato. Combined miRNAomics and transcriptomics analysis, more than 120 miRNA-mRNA regulatory networks were identified. These miRNAs may participate in TOR-related pathways including ribosome biosynthesis and lipid synthesis. Our results indicated a need for further experimental studies to reveal the role of TOR-related miRNAs in potato improvement.
Supplemental Information
The first nucleotide bias for both novel and known miRNAs under the treatment of RAP +KU and DMSO
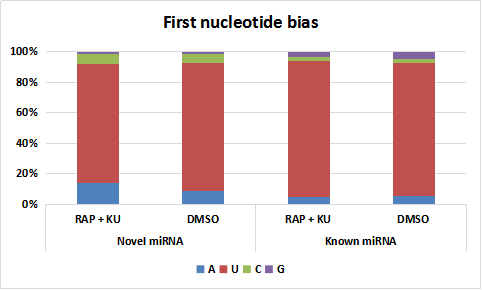
Primers used in this study for mRNA and miRNA validation by qRT-PCR
The known and novel miRNAs and their readcounts identified in this study
The predicted target genes of known and novel miRNA identified in potato in this study
The annotation of putative targets of differentially expressed miRNAs identified in this study
Functional analysis of differentially expressed miRNAs
(A) GO functional enrichments of differentially expressed miRNAs. (B) KEGG pathway enrichments of differentially expressed miRNAs.
The integrative miRNAs and mRNA analysis.
(A) Up-regulated miRNAs. (B) Down-regulated miRNAs. (C) Up-regulated mRNAs. (D) Down-regulated mRNAs.
Functional analysis of differentially expressed mRNAs which are reverse correlation with differentially expressed miRNAs
(A) The GO function analysis based on the down expressed mRNA/up expressed miRNA under the TOR inhibition with RAP + KU. (B) The GO function analysis based on the up expressed mRNA/down expressed miRNA under the TOR inhibition with RAP + KU.