

Dysregulated levels of glycogen synthase kinase-3β (GSK-3β) and miR-135 in peripheral blood samples of cases with nephrotic syndrome
- Published
- Accepted
- Received
- Academic Editor
- Gwyn Gould
- Subject Areas
- Cell Biology, Molecular Biology, Hematology, Nephrology, Medical Genetics
- Keywords
- Nephrotic syndrome, Proteinuria, Focal Segmental Glomerulosclerosis, Membranous glomerulonephritis, miR-135a-5p, GSK-3β
- Copyright
- © 2020 Ardalan et al.
- Licence
- This is an open access article distributed under the terms of the Creative Commons Attribution License, which permits using, remixing, and building upon the work non-commercially, as long as it is properly attributed. For attribution, the original author(s), title, publication source (PeerJ) and either DOI or URL of the article must be cited.
- Cite this article
- 2020. Dysregulated levels of glycogen synthase kinase-3β (GSK-3β) and miR-135 in peripheral blood samples of cases with nephrotic syndrome. PeerJ 8:e10377 https://doi.org/10.7717/peerj.10377
Abstract
Background
Glycogen synthase kinase-3 (GSK-3β) is a serine/threonine kinase with multifunctions in various physiological procedures. Aberrant level of GSK-3β in kidney cells has a harmful role in podocyte injury.
Methods
In this article, the expression levels of GSK-3β and one of its upstream regulators, miR-135a-5p, were measured in peripheral blood mononuclear cells (PBMCs) of cases with the most common types of nephrotic syndrome (NS); focal segmental glomerulosclerosis (FSGS) and membranous glomerulonephritis (MGN). In so doing, fifty-two cases along with twenty-four healthy controls were included based on the strict criteria.
Results
Levels of GSK-3β mRNA and miR-135 were measured with quantitative real-time PCR. There were statistically significant increases in GSK-3β expression level in NS (P = 0.001), MGN (P = 0.002), and FSGS (P = 0.015) groups compared to the control group. Dysregulated levels of miR-135a-5p in PBMCs was not significant between the studied groups. Moreover, a significant decrease was observed in the expression level of miR-135a-5p in the plasma of patients with NS (P = 0.020), MGN (P = 0.040), and FSGS (P = 0.046) compared to the control group. ROC curve analysis approved a diagnostic power of GSK-3β in discriminating patients from healthy controls (AUC: 0.72, P = 0.002) with high sensitivity and specificity.
Conclusions
Dysregulated levels of GSK-3β and its regulator miR-135a may participate in the pathogenesis of NS with different etiology. Therefore, more research is needed for understanding the relationship between them.
Introduction
Glycogen synthase kinase-3 (GSK-3) is a conserved multi-functional serine/threonine kinase that is expressed in all tissues. Its mechanism of phosphorylation regulates various physiological processes, including gene expression, cell signaling (Maurer et al., 2014), metabolism (glucose regulation) (Nikoulina et al., 2000), cellular transport, proliferation, apoptosis, and intracellular communication (Kuemmerle, 2005). It also regulates cellular motility (Sun, Rodriguez & Kim, 2009) and organization of cytoskeleton (Wu et al., 2011). Interest in GSK-3 has been significantly amplified with the understanding that it is also involved in embryogenesis, inflammation, and immunomodulation (Ali, Hoeflich & Woodgett, 2001; Beurel, Grieco & Jope, 2015; Xu et al., 2014). Abnormal GSK-3 has serious role in the pathophysiology of inflammatory diseases, cancer, diabetes, Alzheimer’s and bipolar disorder (Khan et al., 2017; Maurer et al., 2014). Two isoforms of GSK3 exist (α and β), differentially expressed in various tissues.
In the kidney, GSK-3β is mainly expressed in podocytes and tubular cells, and to a lesser extent, in the glomerular endothelial and mesangial cells (Li et al., 2016a; Zhou et al., 2016). Podocytes are specialized cells found on the outside of the glomerular basement membrane (GBM) and damage in these cells plays an essential function in initiation and progression of nephrotic syndrome (NS) (Hu et al., 2018). Increased glomerular permeability to large molecules is the underlying pathological process in NS of any etiology (3, 4). The most common causes of NS are membranous glomerulonephritis (MGN) and focal segmental glomerulosclerosis (FSGS). The involved mechanism in these diseases is podocyte injury that ends to end-stage renal disease (ESRD) (Rosenberg & Kopp, 2017). MGN is likely to be a heterogeneous disease, however, an important known cause is deposition of antibody against antigenic targets on podocytes in glomerulus (Ronco & Debiec, 2006) and pathological change in GBM (Wasserstein, 1997).
The aberrantly up-regulated expression of GSK-3β in tubular cells and glomeruli of kidney (Gong et al., 2008a) suggests a harmful role of GSK-3 in podocyte injury (Boini et al., 2009) and its over-activation is associated with a different kidney diseases ranging from proteinuric glomerulopathies to advanced chronic kidney disease (CKD) (Paeng et al., 2014). GSK-3β over-activity eases podocyte autonomous damage by several podocytopathic signaling pathways. By dictating the phosphorylation and activation of paxillin, GSK-3β increases the actin cytoskeleton disorganization and hypermotility of podocyte. Moreover, by activation of NF-κB, it directs inflammation in podocytes. These two mechanisms of GSK-3β action are involved in podocyte foot process effacement. Additionally, by activation of pore (Cyp-F), an element of mitochondria permeability transition (MPT), GSK-3β sensitizes podocyte death and results in podocytopenia (Gong et al., 2008b; Li et al., 2016a; Xu et al., 2014). Furthermore, under diabetic conditions, enhanced activity of GSK-3β facilitates podocyte apoptosis (Paeng et al., 2014). It is also reported that GSK-3β in exfoliated urine cells may function as a novel biomarker for predicting the progression of diabetic kidney disease (Liang et al., 2020). In constancy, pharmacological or genetic blockade of GSK-3β can defend against podocyte damage and reduce proteinuria in several nondiabetic glomerulopathies models (Zhou et al., 2016).
GSK-3β is a potential target gene of the miR-135 family. The miR-135 family is involved in different cellular pathways and consists of two members: miR-135a and miR-135b. These molecules are also presented in the podocytes and their aberrant expression are associated with some renal diseases. miR-135a is a major factor in podocyte damage and its upregulated expression is observed in glomeruli of patients with NS with FSGS histopathology (Yang et al., 2015). By GSK-3β inhibition, miR-135 family could stimulate the Wnt/β-catenin signaling in podocytes (Yang et al., 2015).
Therefore, a detailed understanding of the GSK-3β function and its expression in several pathological conditions will help the clinic manage different kidney diseases. Given the role of GSK-3β in the podocytes injury and its involvement in response to steroid therapy, and based on the fact that up until now no studies have performed on the expression of this enzyme in clinical samples to the best of our knowledge, we evaluate its expression in blood samples of patients with NS with different histopathology: FSGS and idiopathic MGN.
Materials & Methods
Study subjects
This cross-sectional study recruited fifty-two primary NS patients. Nephrotic proteinuria was defined by proteinuria (urinary protein excretion ≥ 3 g /24 h). The age range 20-60 years old and patients with primary NS were inclusion criteria. Any overlap syndrome, a history of cancer, inflammatory diseases, autoimmune disorder (diabetes), severe infection, organ failure and those with ESRD under dialysis were the exclusion criteria for cases. Cases with secondary NS causes (e.g., amyloidosis, viral infection, diabetes, drug-related NS and systemic lupus erythematosus) were also excluded. Healthy volunteers was also allocated as controls with no clinical history of kidney disease (n = 24). This study was approved by Tabriz University of Medical Sciences granted Ethical (Ethical Application Ref: IR.TBZMED.REC.1397.1021). We received written informed consent from participants and they agreed to participate in the study.
RNA extraction and evaluation in PBMCs
Total RNAs were extracted from the plasma and PBMCs as described previously (Hejazian et al., 2020a; Hejazian et al., 2020b).
Conversion of isolated microRNA and mRNA from PBMCs samples into cDNA was performed separately in 15 µL reaction volume; 1 µg RNA extracted from PBMCs, 0.8 µL RT enzyme, 3 µl RT buffer, 0.375 µL Ribolock, 1.5 µL dNTP, 3 µL primer and 1.325 µL DEPC. An equal volumes of customized stem loop primers of miR-135, Snord-47 and universal reverse along with GSK-3β and GAPDH were used. The sequences of GSK-3β forward and reverse primers were: 5′-CTGGTGCTGGACTATGTTCC-3′and reverse 5′-CGATGGCAGATTCCAAAGGA-3′. Sequence of miR-135 primers were 5′-GTCGTATCCAGTGCAGGGTCCGAGGTATTCGCACTGGATACGACTCACAT-3′ (stem-loop reverse transcription), 5′-GGCGTATGGCTTTTTATTCCTATGTGA-3′ (forward), and 5′-GTGCAGGGTCCGAGGT-3′ (reverse). Sequences of other primers and the program of real-time PCR for amplification of mRNA and microRNA were described previously (Hejazian et al., 2020a; Hejazian et al., 2020b). Snord-47 and GAPDH were applied as internal controls for normalization of microRNA and mRNA levels in PBMCs, respectively. Moreover, U6 was used as a control for normalizing the circulating miR-135 in plasma. Fold change was calculated via 2−ΔΔCt formulas for determination of each mir-135 and GSK-3β relative expression in clinical samples.
Statistical analysis
Statistical analyses were performed by the IBM SPSS 22.0 Software (SPSS, Inc.). Shapiro-Wilk test was used to test the normal distribution of the variables. Categorical variables were presented by numbers and percentages. For non-normally and normally distributed variables, median (Interquartile range) and Mean ± standard deviation (SD) were used, respectively. For comparisons of quantitative variables between two groups, Student’s t-test /Mann-Whitney U test was used, while for categorical variables, chi-squared test was used. For comparison of variables between more than two groups Kruskal–Wallis or ANOVA test was used. Spearman’s correlation was used for evaluation of correlations between variables. The ROC curve analysis was used for evaluating the potential of miR-135 and GSK-3β in discriminating cases from controls. P value <0.05 was considered statistically significant.
Results
In the present study, 52 patients were included, with mean age of 45.76 ± 13 years old. Despite histopathological differences, all patients had primary and drug-refractory NS. Based on the biopsy results and clinical data, the patients were divided into FSGS (N = 22) and MGN (N = 30) groups. The mean ages of FSGS and MGN groups were 42 ± 10 and 45 ± 11, respectively. A healthy age/ sex-matched control group (N = 24) was also included with a mean age of 38.4 ± 9.7 years old, considered as controls. No significant differences were observed in GFR (P = 0.324), serum creatinine (mg/dL), serum urea (mg/dL), uric acid (mg/dL), and 24-hour urine protein excretion between the MGN and FSGS groups (P > 0.05), Table 1.
| Characteristics | FSGS group (N = 22) | MGN (N = 30) | P-value |
|---|---|---|---|
| Age, mean ± SD (years) | 42.5 ± 10.8 | 45.6 ± 11.7 | 0.342 |
| Proteinuria (mg/24 h) | 1351 (101–15000) | 3000 (90–14800) | 0.21a |
| Serum creatinine (mg/dL) | 1.2 ± 0.5 | 2.11 ± 0.40 | 0.23 |
| Urea (mg/dL) | 40.2 ± 18 | 37.2 ± 15.01 | 0.10 |
| Uric acid (mg/dL) | 5.32 ± 1.1 | 6.21 ± 1.3 | 0.55 |
Notes:
The quantity data are expressed as mean ± SD.
There were statistically significant increases in GSK-3β expression level in NS (P = 0.001), MGN (P = 0.002), and FSGS (P = 0.015) groups when compared to controls, Figs. 1A–1C. GSK-3β level was also higher in FSGS group in comparison to MGN group (P = 0.803), Fig. 1D. In the peripheral blood cells, there was no statistically significant differences in expression levels of miR-135a-5p in NS (P = 0.660), MGN (P = 0.860) and FSGS (P = 0.190) groups in comparison to healthy group (Fig. 2A and 2B). A non-significant difference was found between the FSGS and MGN groups (P = 0.082) (Fig. 2B). The expression level of miR-135a-5p was also evaluated in plasma samples of the individuals. There was a significant decrease in miR-135a-5p expression level in NS group (P = 0.020) and MGN (P = 0.040) compared to control group in plasma samples (Fig. 2C and 2D). Moreover, a statistically significant decline was observed in circulating miR-135a-5p level (P = 0.046) in the FSGS group compared to the controls. There was no significant changes in miR-135a-5p expression level between FSGS and MGN groups in plasma samples (P = 0.501) (Fig. 2D). The median of expression levels are presented in Table 2.
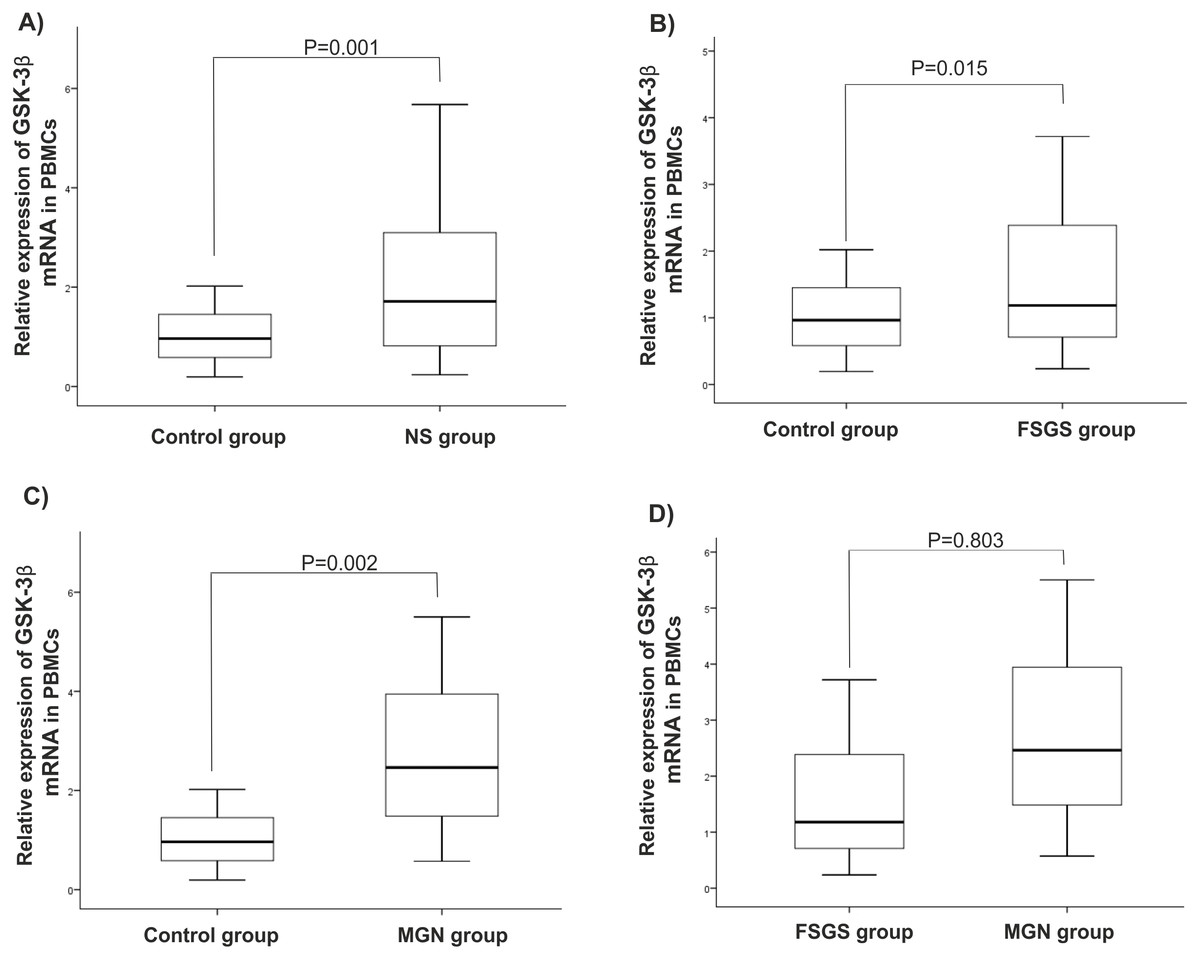
Figure 1: Relative gene expression of GSK-β3 in blood cell samples.
Comparison of gene expression between (A) control and NS (B) FSGS and controls, (C) MGN and control and (D) MGN and FSGS groups. NS: nephrotic syndrome, FSGS: focal segmental glomerulosclerosis and MGN: membranous glomerulonephritis.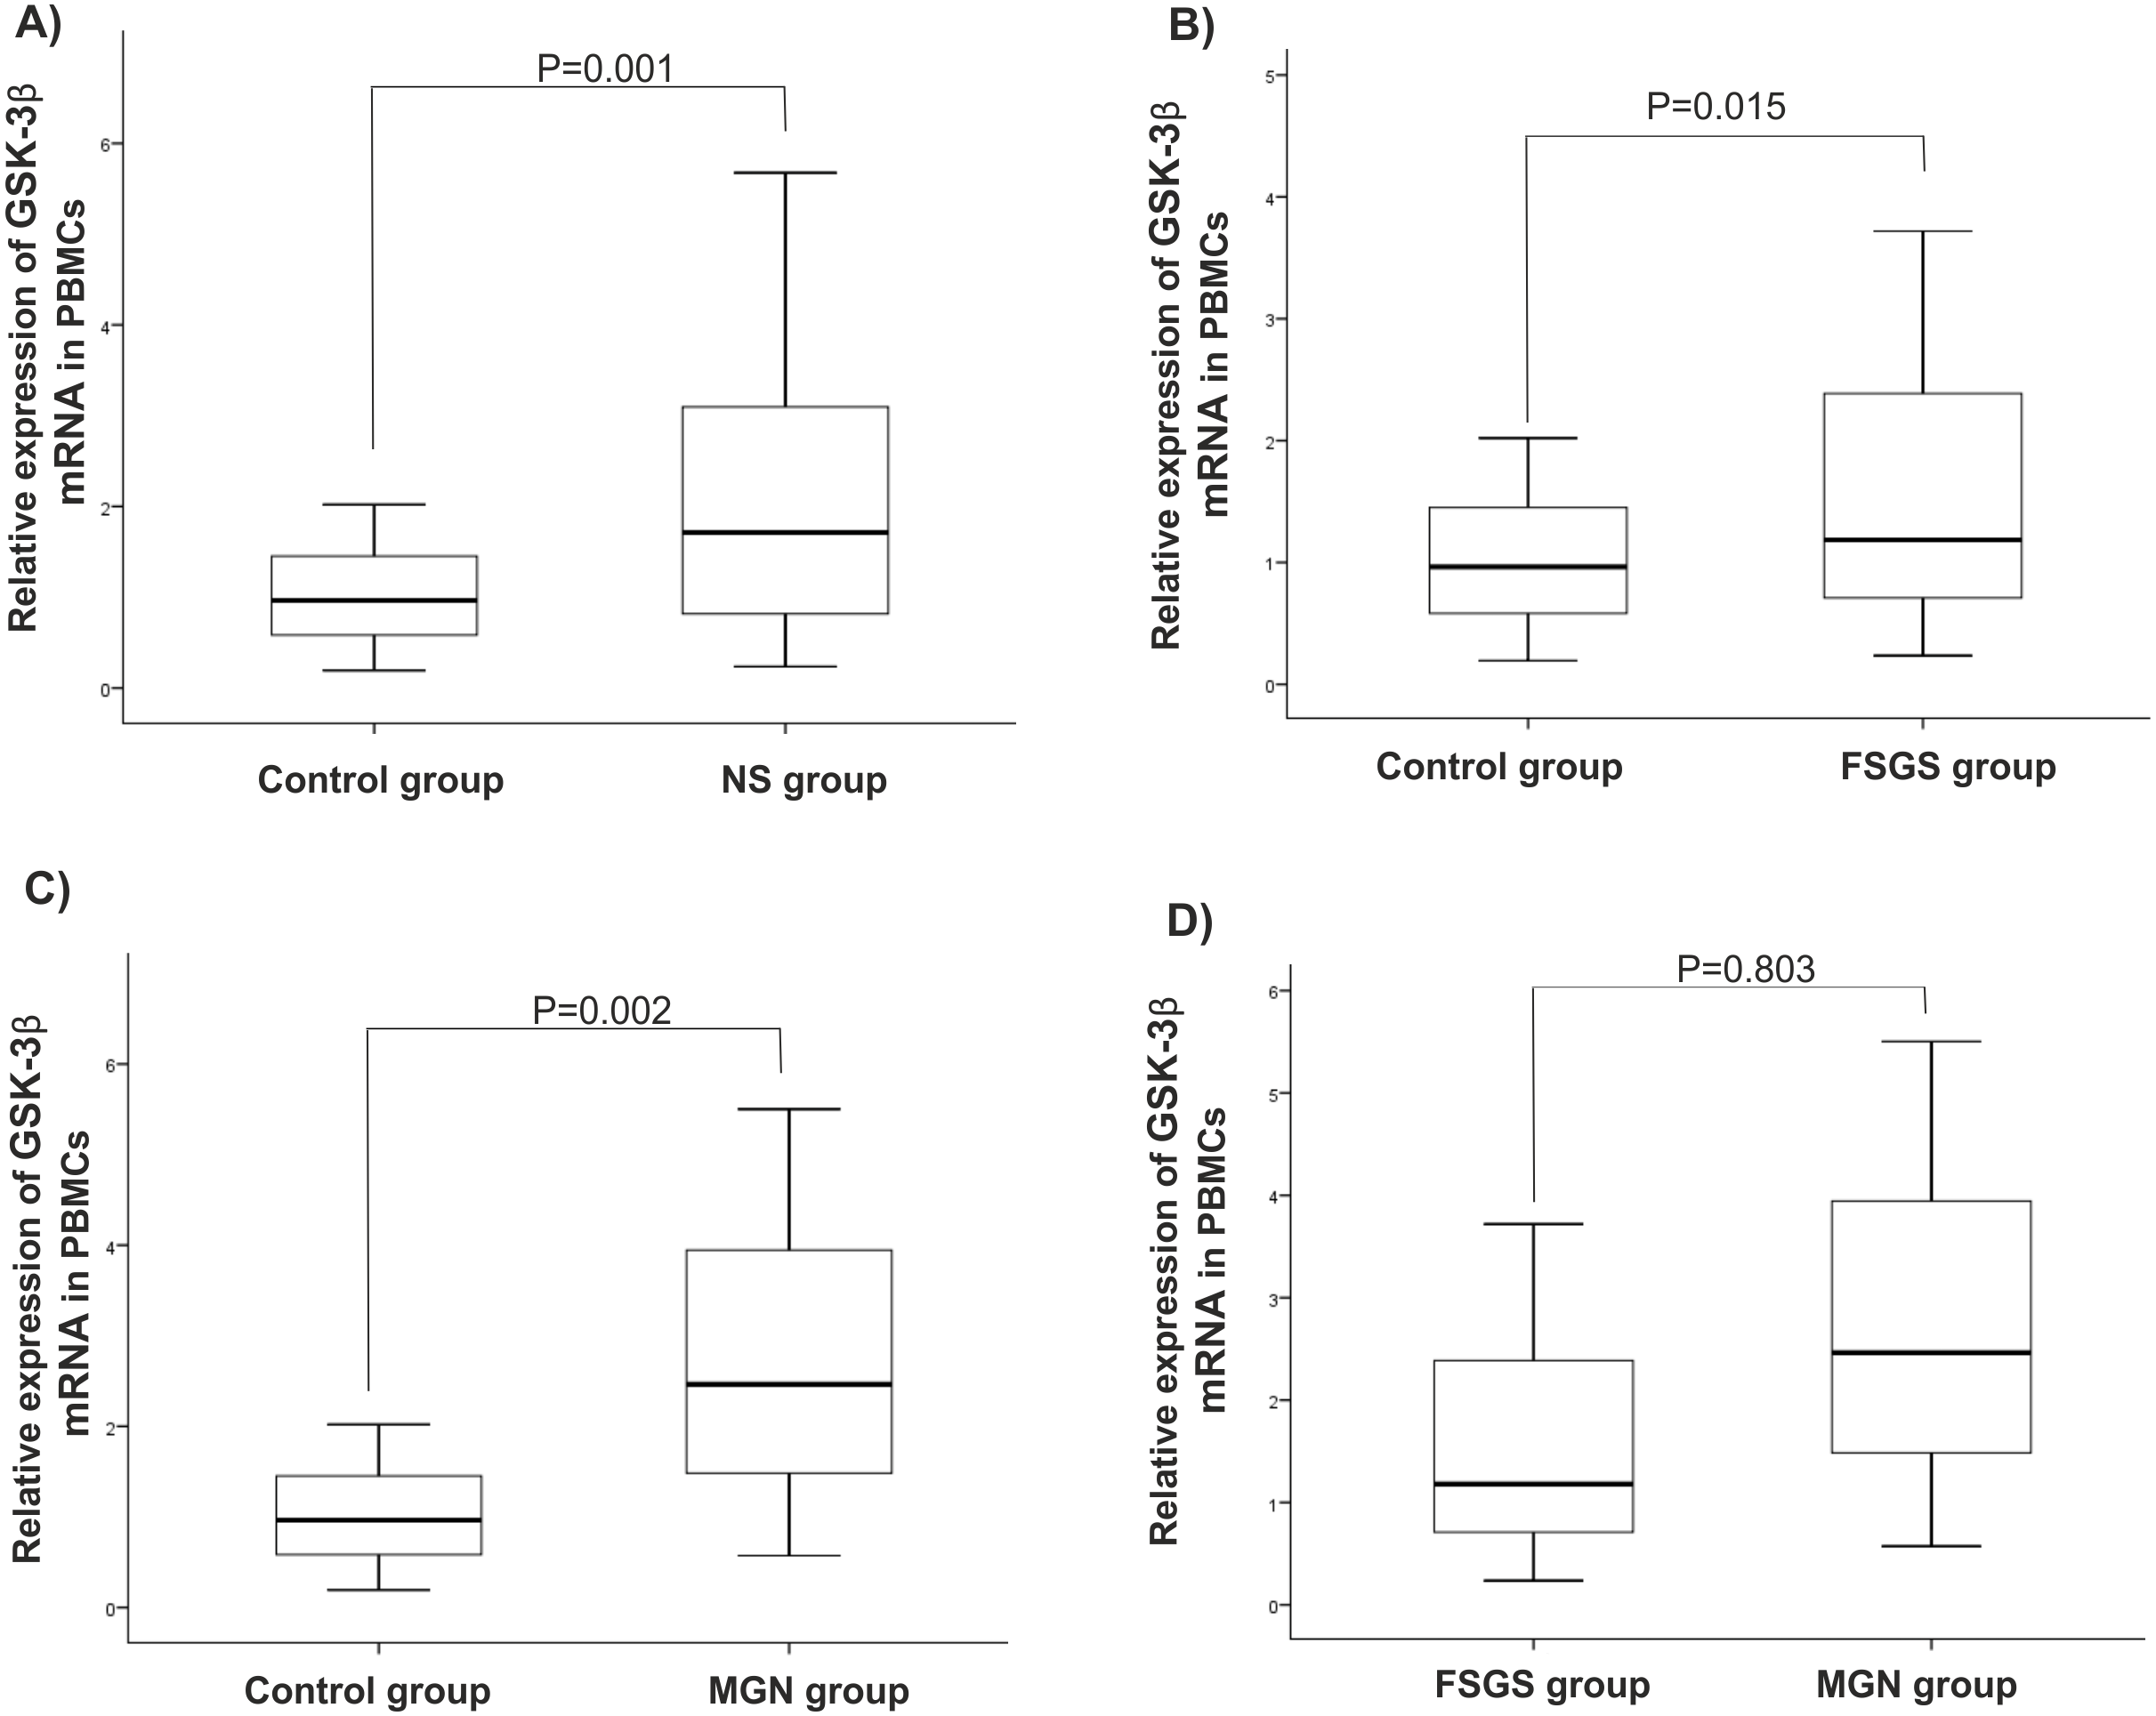
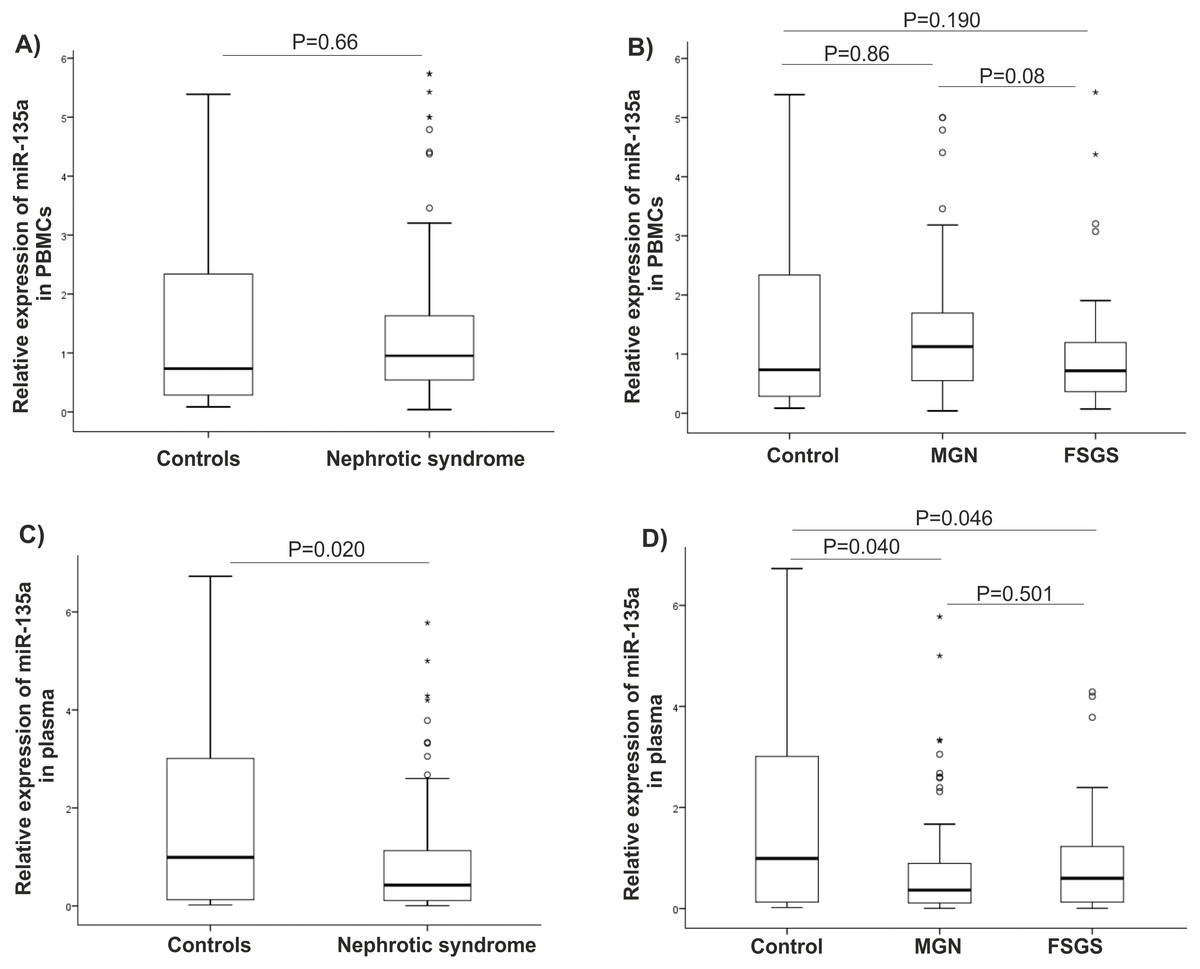
Figure 2: microRNA-135a-5p relative gene expression in clinical samples.
Comparison of miR-135 expression between the studied groups (A–B) in PBMCs and (C–D) plasma samples. NS, nephrotic syndrome, FSGS, focal segmental glomerulosclerosis, MGN, membranous glomerulonephritis and PBMC, peripheral blood mononuclear cells.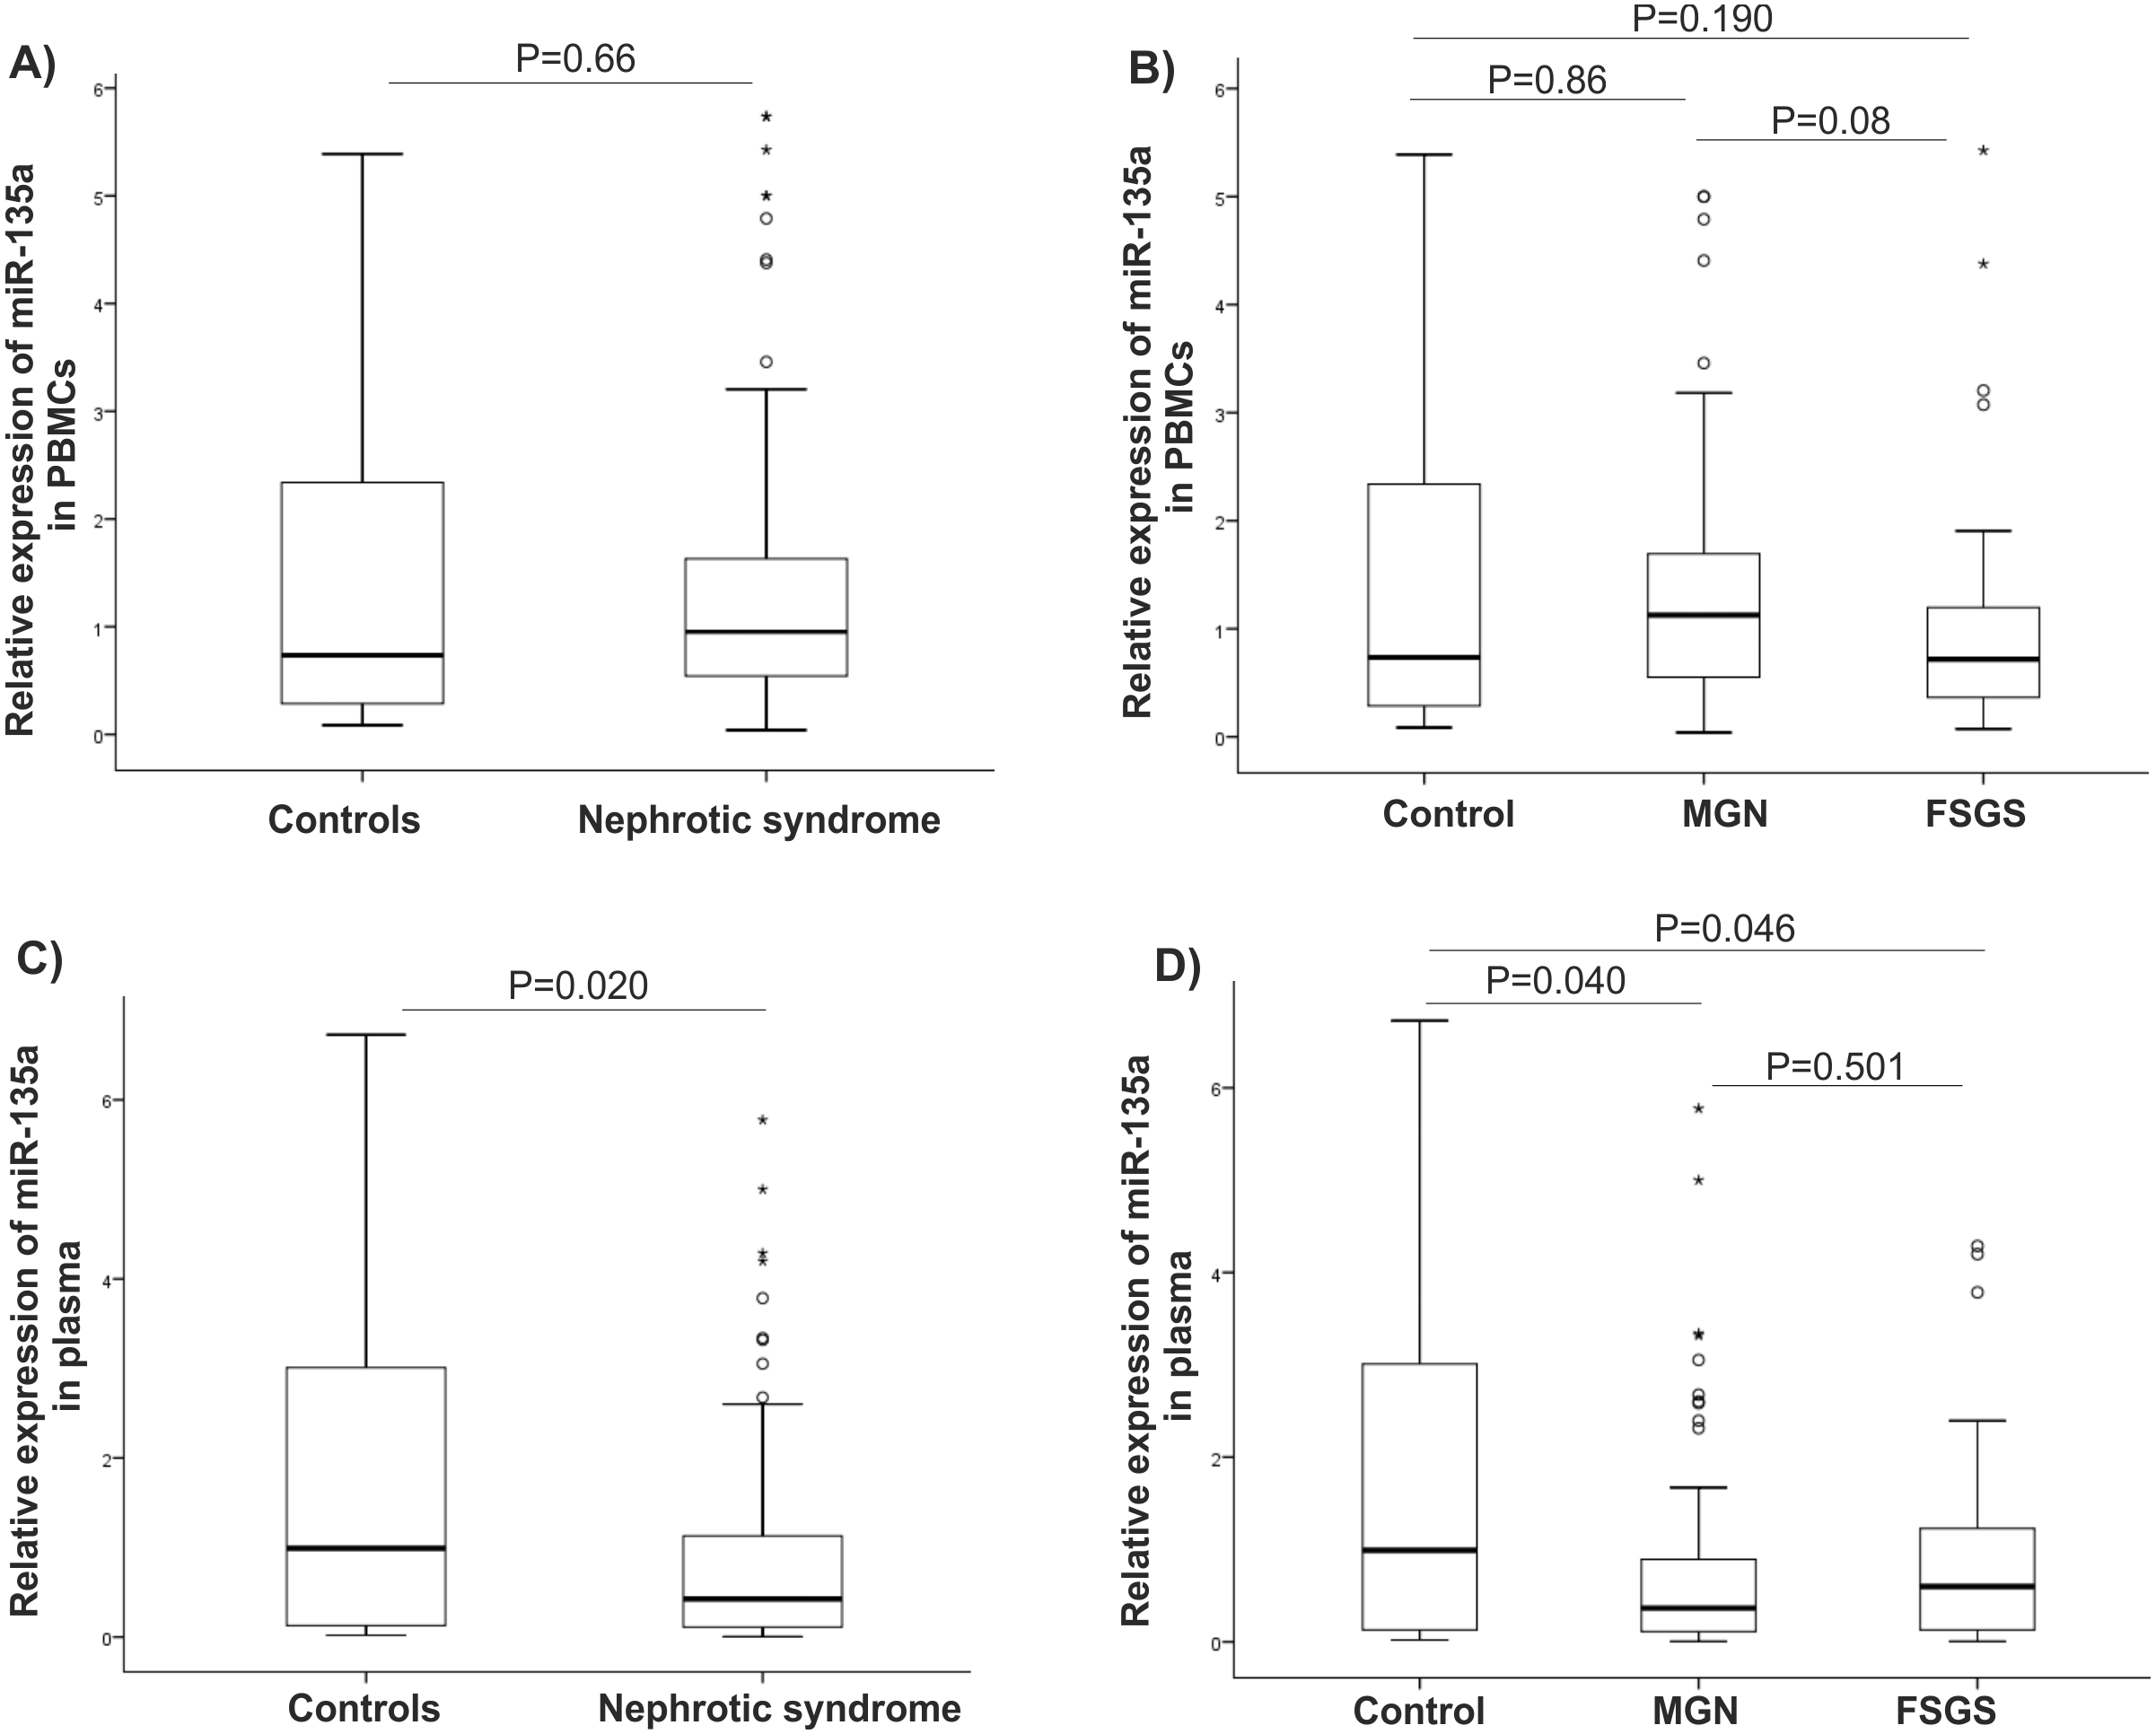
| Gene expression | Controls | NS | MGN | FSGS | P-valueb |
|---|---|---|---|---|---|
| ΔΔCt values | |||||
| Plasma miR-135 | −0.45 (4.73) | 0.92(3.82) aP = 0.022 |
1.36 (4.0) aP = 0.047 |
0.47(3.34) aP = 0.045 |
0.849 |
| PBMC miR-135 | −0.31(3.10) | 0.17(1.57) aP = 0.629 |
0.14(1.66) aP = 0.935 |
0.17 (1.47) aP = 0.279 |
0.097 |
| PBMC GSK-3β | −0.15(1.57) | −0.86(1.69) aP = 0.001 |
−0.91(1.69) aP = 0.001 |
−0.75(1.86) aP = 0.015 |
0.771 |
| Relative expression | |||||
| Plasma miR-135 | 1.368(3.7) | 0.53(1.80) | 0.39(1.9) | 0.72(1.39) | 0.826 |
| PBMC miR-135 | 1.24(2.8) | 0.89(1) | 0.91(1.02) | 0.88(1.04) | 0.082 |
| PBMC GSK-3β | 1.11(1.17) | 1.82(1.95) | 1.88 (1.95) | 1.67(2.47) | 0.503 |
It is reported that expression of GSK-3β is related to a response to glucocorticoids (GC). Since most of patients in FSGS group were unresponsive to GCs, they were named GC-resistant-FSGS and GC-responsive-FSGS. GC-resistant defined by sustained proteinuria after 8-12 weeks of GCs therapy. A significant elevated level of GSK-3β was observed in GC-resistant-FSGS (P < 0.001) compared to control group. A difference between FSGS groups was not statistically significant (P > 0.05), (Fig. 3A). There were statistically significant correlations between miR-135 and GSK-3 β in MGN and FSGS groups in PBMCs samples (Table 3).
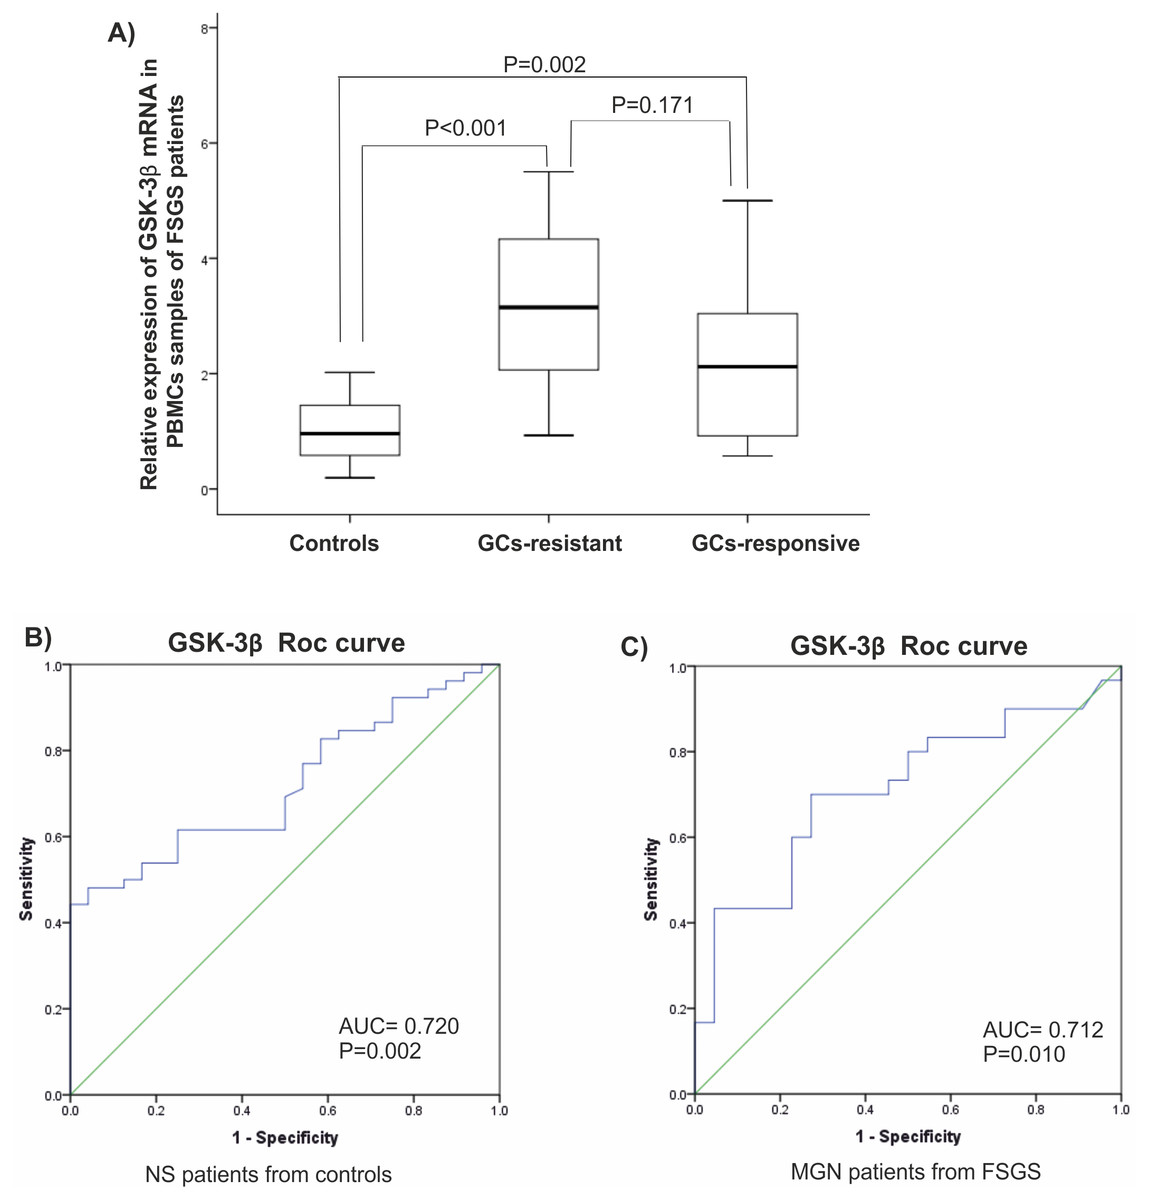
Figure 3: Clinical value of GSK-β3.
(A) Expression levels of GSK-β3 in GCs-resistant-FSGS compared to GCs-responsive-FSGS and healthy controls in PBMCs samples. (B, C) ROC curves analysis of GSK-β3 in PBMCs samples. (B) GSK-β3 could discriminate NS patients from controls. (C) GSK-β3 could discriminate FSGS from MGN patients. AUC, Area under the curve, FSGS, Focal segmental glomerulosclerosis, MGN, membranous glomerulonephritis, PBMC, peripheral blood mononuclear cells, ROC, Receiver operating characteristic.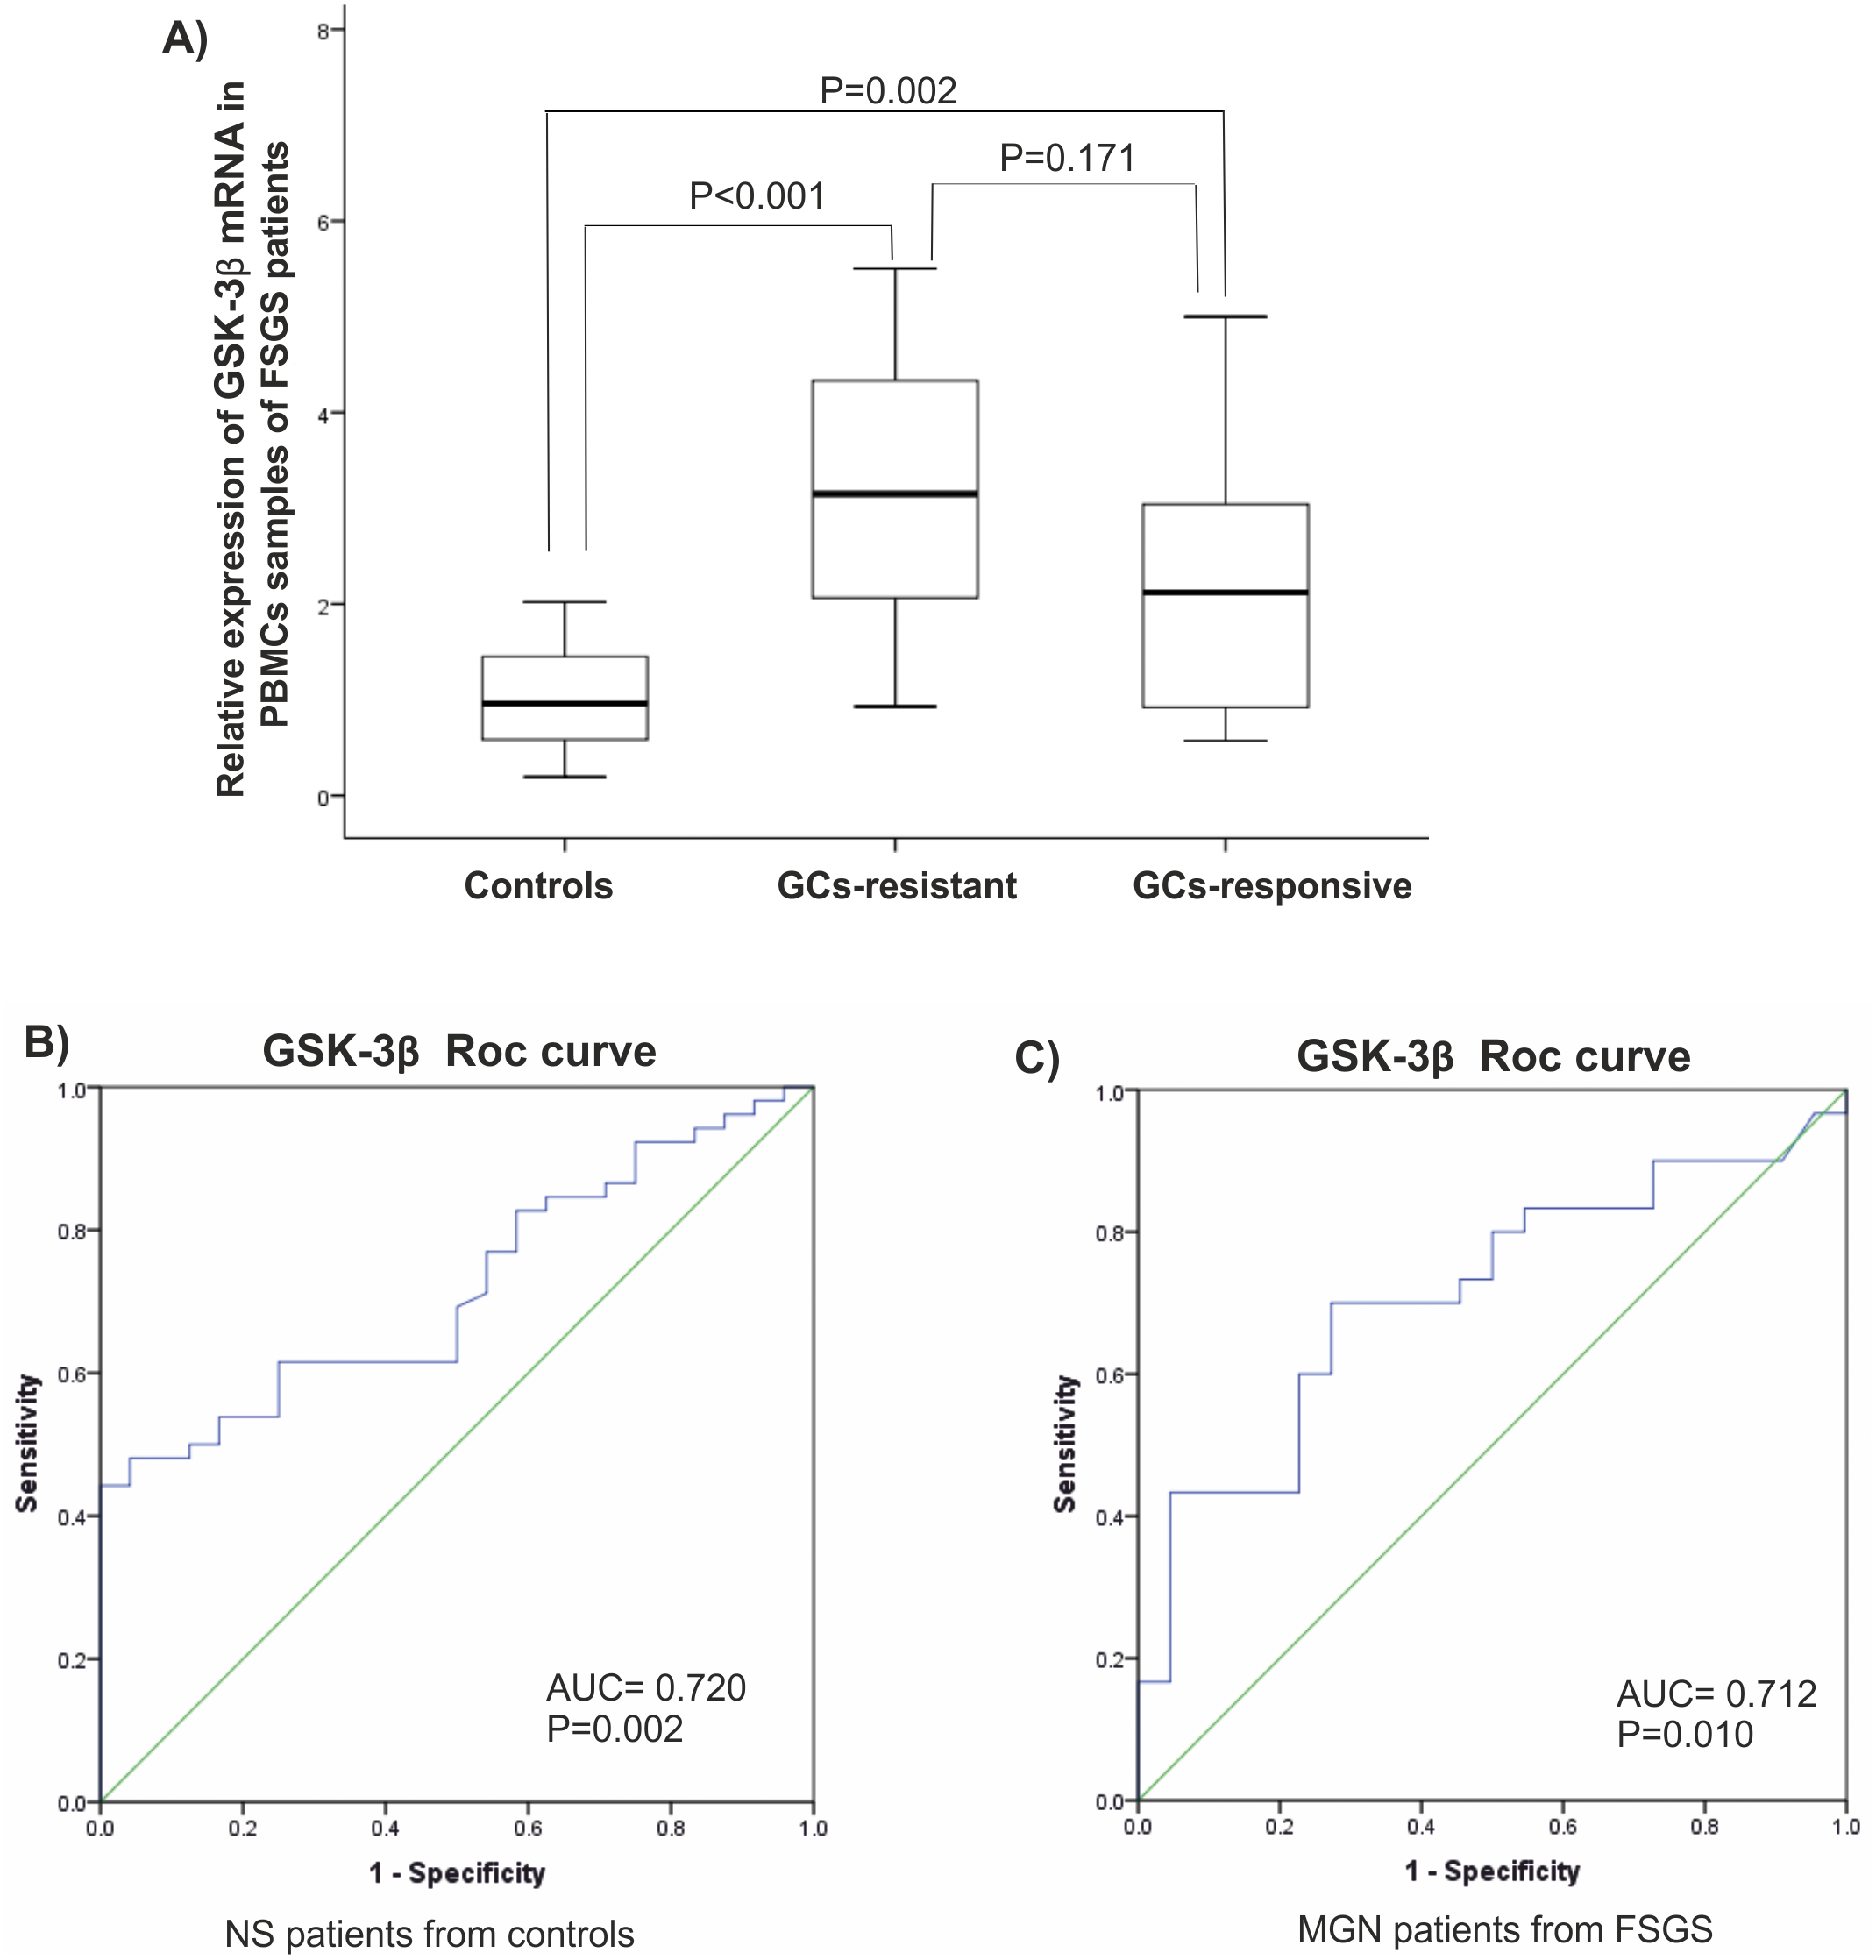
| MGN | Plasma miR-135 | PBMC miR-135 |
|---|---|---|
| PBMC miR-135 |
r = − 0.211 P > 0.05 |
1 |
| GSK-3β |
r = 0.198 P > 0.05 |
r = − 0.469 P = 0.001 |
| FSGS | ||
| PBMC miR-135 |
r = 0.136 P > 0.05 |
1 |
| GSK-3β |
r = 0.055 P > 0.05 |
r = − 0.465 P = 0.013 |
Notes:
r, Spearman’s rho correlation coefficient; FSGS, focal segmental glomerulosclerosis; MGN, membranous glomerulonephritis; PBMC, peripheral blood mononuclear cells.
Analysis of the ROC diagram showed that GSK-3β with AUC = 0.72 (P = 0.002) with reliable sensitivity and specificity in PBMCs had high diagnostic power in separating NS patients from healthy controls (Figs. 3B, 3C). However, miR-135a did not have reliable value in discriminating NS patients from controls, AUC = 0.605 in plasma samples and AUC = 0.510 in PBMCs (Fig. S1).
Discussion
In this study, elevated levels of GSK-3β were observed in peripheral blood cells of patients with NS with two different histopathology; FSGS and MGN. However, dysregulated levels of miR-135a-5p in PBMCs was not significant between the studied groups. Results showed a significant decrease in miR-135a-5p expression in patients with NS and MGN compared to controls in plasma samples.
Elevated expression of GSK-3β in tubules of kidney (Gong et al., 2008a) indicates a destructive role of GSK-3 (Boini et al., 2009). In the kidney, GSK-3β has been associated with (AKI) and repair (Wang et al., 2013) and in progressive chronic kidney disease, GSK-3β is a modulator of renal tubular and interstitial injury. Indeed, GSK-3β inhibitors could reduce cell motility in several cells (Peng et al., 2012) and improve nonsteroidal anti-inflammatory drugs-induced AKI by stimulation of the renal cortical COX-2 and MPT inhibition (Bao et al., 2012). Prevention of GSK-3β can also inhibit oxidative stress in kidney transplant rats after renal cold ischemia/reperfusion injury (IRI) (24) and attenuate renal IRI by activation of Nrf2/HO-1 pathway in diabetic rats (Shen et al., 2017). Likewise, a GSK-3β inhibitor could protect rat kidney transplants against IRI by inducing the expression of the TLR4/MyD88/NF-κB pathway. In our study, dysregulated levels of GSK-3β were observed in FSGS and MGN groups, indicating that GSK-3β may be involved in the pathophysiology of NS.
Standard and first line treatment in FSGS is a prolonged course of glucocorticoids (Han & Kim, 2016). However, about 60 percent of adult cases are resistant to this treatment (Beaudreuil et al., 2017). GCs-resistant cases are more likely to progress to ESRD (Hogg, Middleton & Vehaskari, 2007). It is reported that GSK-3 also regulates GCs signaling by phosphorylation of the GC receptor (Ser404). The GSK-3 signaling pathway utilizes a form of cellular resistance to GC therapy and GSK-3 activity determines how cells will eventually reply to glucocorticoids (Galliher-Beckley et al., 2008). In both bronchial epithelial cells and monocytes of patients with chronic obstructive pulmonary disease (COPD), inactivation of GSK-3β led to a reduced responsiveness of inflammatory mediators to GCs (Ngkelo et al., 2015). In the present study, an elevated levels of GSK-3β were observed in FSGS patients most of which were GC-resistant. Our result shows that GSK-3β may be also involved in responses to the treatment in FSGS patients.
Previous studies show that miR-135a ameliorates cell proliferation in kidney cancer and induces renal fibrosis in diabetic nephropathy (He et al., 2014; Yamada et al., 2013). Knockdown of miR-135a-5p could reduce kidney fibrosis via Smad3/TGF β1 pathway inactivation and targeting SIRT1 in diabetic nephropathy (Zhang et al., 2020). GSK-3 is a target of miR-135. Yong et al. showed overexpression of miR-135a in the podocyte of patients with FSGS and GSK-3β inhibition (Yang et al., 2015). Likewise, in an in vitro model of Parkinson’s disease, overexpression of miR-135 exerts neuroprotective role by reducing apoptosis, stimulating proliferation, and inhibiting inflammation through targeting GSK-3β (Zhang et al., 2017). It is also reported that miR-135b is involved in the radioresistance of human glioblastoma multiforme by targeting GSK3β directly (Xiao et al., 2014). Beyond miR-135, GSK-3β can be also regulated by some other miRNAs including, miR-769, miR-26a, and miR-709 (Jiang et al., 2015; Li et al., 2016b; Qiu et al., 2016).
Fong he et al. show that miR-135a upregulation in serum and renal tissue of patients suffering from diabetic nephropathy could induce renal fibrosis and enhance extracellular matrix protein synthesis by suppression of TRCP1 (Transient receptor potential canonical 1) and decreasing Ca2+ entry into the mesangial cells providing new insights into the roles of microRNA in the diabetic nephropathy (He et al., 2014) and podocyte injury (Yang et al., 2017).
In recent years, studies have been implied the relationship between microRNA-135 family and related genes in podocyte stability (He et al., 2014; Yang et al., 2015; Yang et al., 2017). Increased level of miR-135a were reported in the biopsy of patients with FSGS as well as mice with podocyte injury (Yang et al., 2017). It has been suggested that abnormal expression of microRNA-135 family members is involved in podocyte actin fiber and cytoskeleton stability by an unknown mechanism (Yang et al., 2017). TRPC1 and GSK-3β are the target genes of this microRNA and are affected during the disease. Previous studies reviewed in FSGS patients suggest that expression levels of microRNA-135a were increased in patients with NS. In our study, an increase miR-135-5p expression level in PBMCs and a decrease level were observed in plasma samples among patients with NS and its subtypes compared to healthy controls implying the role of miR-135 in the pathogenesis of NS.
ROC curve analysis also showed that GSK-3β has sufficient diagnostic power to distinguish nephrotic syndrome patients from controls in our study. In its place, the goals for the near future should be to understand the pathogenic role of GSK-3β in specific kidney disease processes. Analysis of renal disease-related RNA profile needs exact identification of specific types of RNAs with diagnostic and prognostic values.
The present study had some limitations including small sample size. Studying the expression of genes in biopsy samples could give more reliable results; however, since it’s an invasive method we preferred to choose available and non-invasive sources. It would be better to study these genes in different clinical samples and compare the results.
Conclusions
It can be concluded that alteration in GSK-3β and circulating and cellular miR-135a-5p expression may be involved in pathology of NS with different etiology and may be use as diagnostic biomarker in these patients. However, further research is needed to better understanding of the relationship between this microRNA and target genes in these patients. Finding the root cause of resistance to steroid can prevent additional treatment options and disease management.