
A retrospective study of 3D deep learning approach incorporating coordinate information to improve the segmentation of pre- and post-operative abdominal aortic aneurysm
- Published
- Accepted
- Received
- Academic Editor
- Huiyu Zhou
- Subject Areas
- Bioinformatics, Computational Biology, Artificial Intelligence, Computer Vision
- Keywords
- Abdominal aortic aneurysm, Computed tomography, 3D segmentation, Deep learning, Coordinate information, Transfer learning
- Copyright
- © 2022 Siriapisith et al.
- Licence
- This is an open access article distributed under the terms of the Creative Commons Attribution License, which permits using, remixing, and building upon the work non-commercially, as long as it is properly attributed. For attribution, the original author(s), title, publication source (PeerJ Computer Science) and either DOI or URL of the article must be cited.
- Cite this article
- 2022. A retrospective study of 3D deep learning approach incorporating coordinate information to improve the segmentation of pre- and post-operative abdominal aortic aneurysm. PeerJ Computer Science 8:e1033 https://doi.org/10.7717/peerj-cs.1033
Abstract
Abdominal aortic aneurysm (AAA) is one of the most common diseases worldwide. 3D segmentation of AAA provides useful information for surgical decisions and follow-up treatment. However, existing segmentation methods are time consuming and not practical in routine use. In this article, the segmentation task will be addressed automatically using a deep learning based approach which has been proved to successfully solve several medical imaging problems with excellent performances. This article therefore proposes a new solution of AAA segmentation using deep learning in a type of 3D convolutional neural network (CNN) architecture that also incorporates coordinate information. The tested CNNs are UNet, AG-DSV-UNet, VNet, ResNetMed and DenseVoxNet. The 3D-CNNs are trained with a dataset of high resolution (256 × 256) non-contrast and post-contrast CT images containing 64 slices from each of 200 patients. The dataset consists of contiguous CT slices without augmentation and no post-processing step. The experiments show that incorporation of coordinate information improves the segmentation results. The best accuracies on non-contrast and contrast-enhanced images have average dice scores of 97.13% and 96.74%, respectively. Transfer learning from a pre-trained network of a pre-operative dataset to post-operative endovascular aneurysm repair (EVAR) was also performed. The segmentation accuracy of post-operative EVAR using transfer learning on non-contrast and contrast-enhanced CT datasets achieved the best dice scores of 94.90% and 95.66%, respectively.
Introduction
Abdominal aortic aneurysm (AAA) is a common disease of the aorta, characterized by abnormal dilatation. In Western countries, the disease is common in males older than 65 with prevalence of about 4–7% (Gianfagna et al., 2016). Risk of rupture and associated risk of mortality increases with dilation size. In the United States, more than 10,000 people die from rupture each year (Upchurch & Schaub, 2006; Lilienfeld et al., 1987). In addition, for predicting the rupture risk, 3D geometry of AAA could provide useful information, which could also be used for a pre-operative evaluation of endovascular stenting approach. Therefore, it is necessary to obtain the 3D segmentation of the outer wall of AAA, in order to generate its 3D geometry. The outer wall of AAA is the structure that is the outer surface surrounding AAA. Segmenting the outer wall of AAA could be considered as a difficult segmentation task, since its pixels’ intensity values are very similar to surrounding organs in CT images.
Several previous approaches based on prior medical knowledge have been proposed for AAA segmentation, such as intensity-based and contour-based methods (Lareyre et al., 2019; Siriapisith, Kusakunniran & Haddawy, 2019; Shum et al., 2010; Shang et al., 2015; Kurugol et al., 2015; Freiman et al., 2010; Wang et al., 2017). Convolutional neural networks (CNN) have recently been used for analyzing medical images in CT, MRI and ultrasound (Cheng et al., 2016; Jackson et al., 2018; Litjens et al., 2017; Shen, Wu & Suk, 2017; Ronneberger, Fischer & Brox, 2015). However, there are yet only a few studies applying CNNs to AAA segmentation on computed tomographic angiography (CTA) (Zheng et al., 2018; Lu et al., 2019; López-Linares et al., 2019; Salvi, Finol & Menon, 2021; Dziubich et al., 2020). The previous studies addressed only segmentation for post-operative endovascular aneurysm repair (EVAR) of AAA (Freiman et al., 2010) with limited amounts of training data (Krizhevsky, Sutskever & Hinton, 2012; Long & Shelhamer, 2015).
The method proposed in this article incorporates coordinate or location information as well as spatial information into a 3D CNN-based approach to AAA segmentation on non-contrast and contrast-enhanced datasets. Recent work on use of CNNs for medical image segmentation has explored various network architectures to improve performance (Shen, Wu & Suk, 2017; Kim et al., 2019). With this line of work seeming to have reached a plateau, a promising approach to achieve further improvement is to incorporate additional data, such as coordinate information (Liu et al., 2018; Ren & Hao, 2020). Segmentation of AAA is a good candidate for this approach since the AAA is a tubular structure almost always oriented from head to toe. To examine the generality of using coordinate information, we use several kinds of CNN networks in the experiments including standard UNet (Ronneberger, Fischer & Brox, 2015), AG-DSV-UNet (Turečková et al., 2020), VNet (Milletari & Navab, 2016), ResNetMed (Chen, Ma & Zheng, 1904) and DenseVoxNet (Yu et al., 2017). The raw datasets are non-contrast and post-contrast enhanced CT datasets, which are different in low and high contrast resolution of AAA. We also directly compare the accuracy of segmentation with ground-truth and with an advanced graph-cut based segmentation technique. Furthermore, we experiment with transfer learning of segmentation from a pre-operative model to post-operative EVAR. EVAR is a procedure of stent-graft implantation inside AAA under endovascular intervention in order to decrease the size of the aortic lumen. Measurement of AAA volume after EVAR is one of the considerations of imaging surveillance for patient follow up (Geraedts et al., 2020). If AAA size continues to increase after EVAR, it indicates a complication called endoleak. Directly training a model to segment EVAR images would require a dataset for that problem, which would be highly labor intensive to produce. Thus, it is useful to explore whether transfer learning can be used to reduce the amount of effort required. The problem is challenging since the appearance of AAA after EVAR is changed, with the inner lumen replaced by a metal stent-graft (much smaller in size) and the presence of a further metal artifact in the image (Fig. 1).
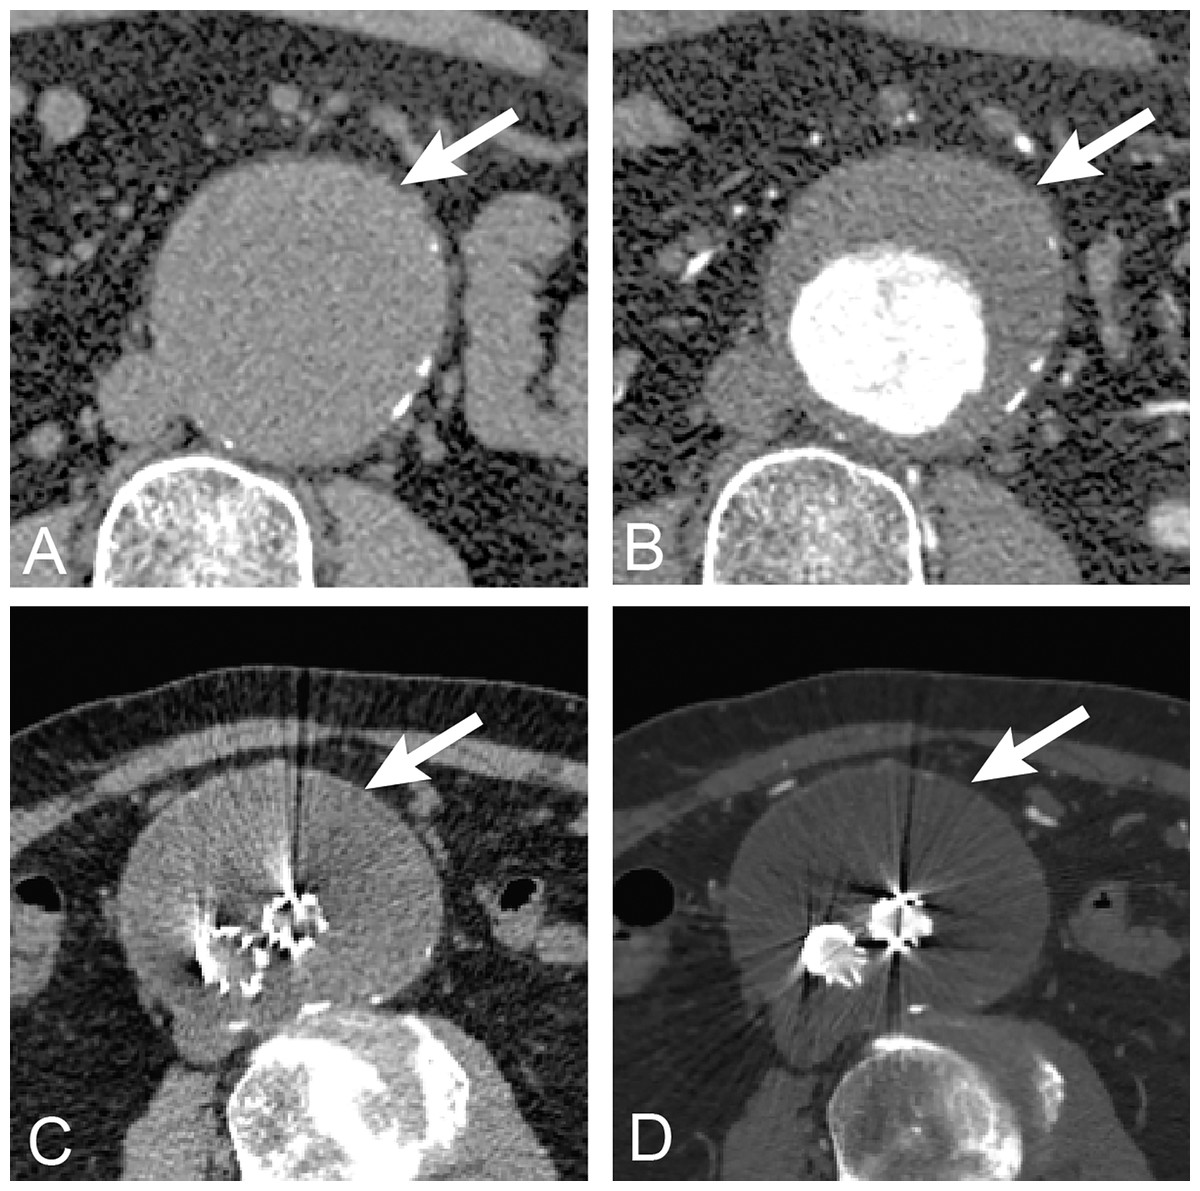
Figure 1: Anatomy of AAA.
The anatomy of abdominal aortic aneurysm in abdominal CT images. The upper row is untreated AAA (arrow) (A) before (non-contrast) and (B) after contrast (post-contrast) administration. The lower row is post-operative endovascular aneurysm repair of AAA (arrow) (A) before and (B) after contrast administration. The non-contrast images are lower in contrast resolution as compared with post-contrast images.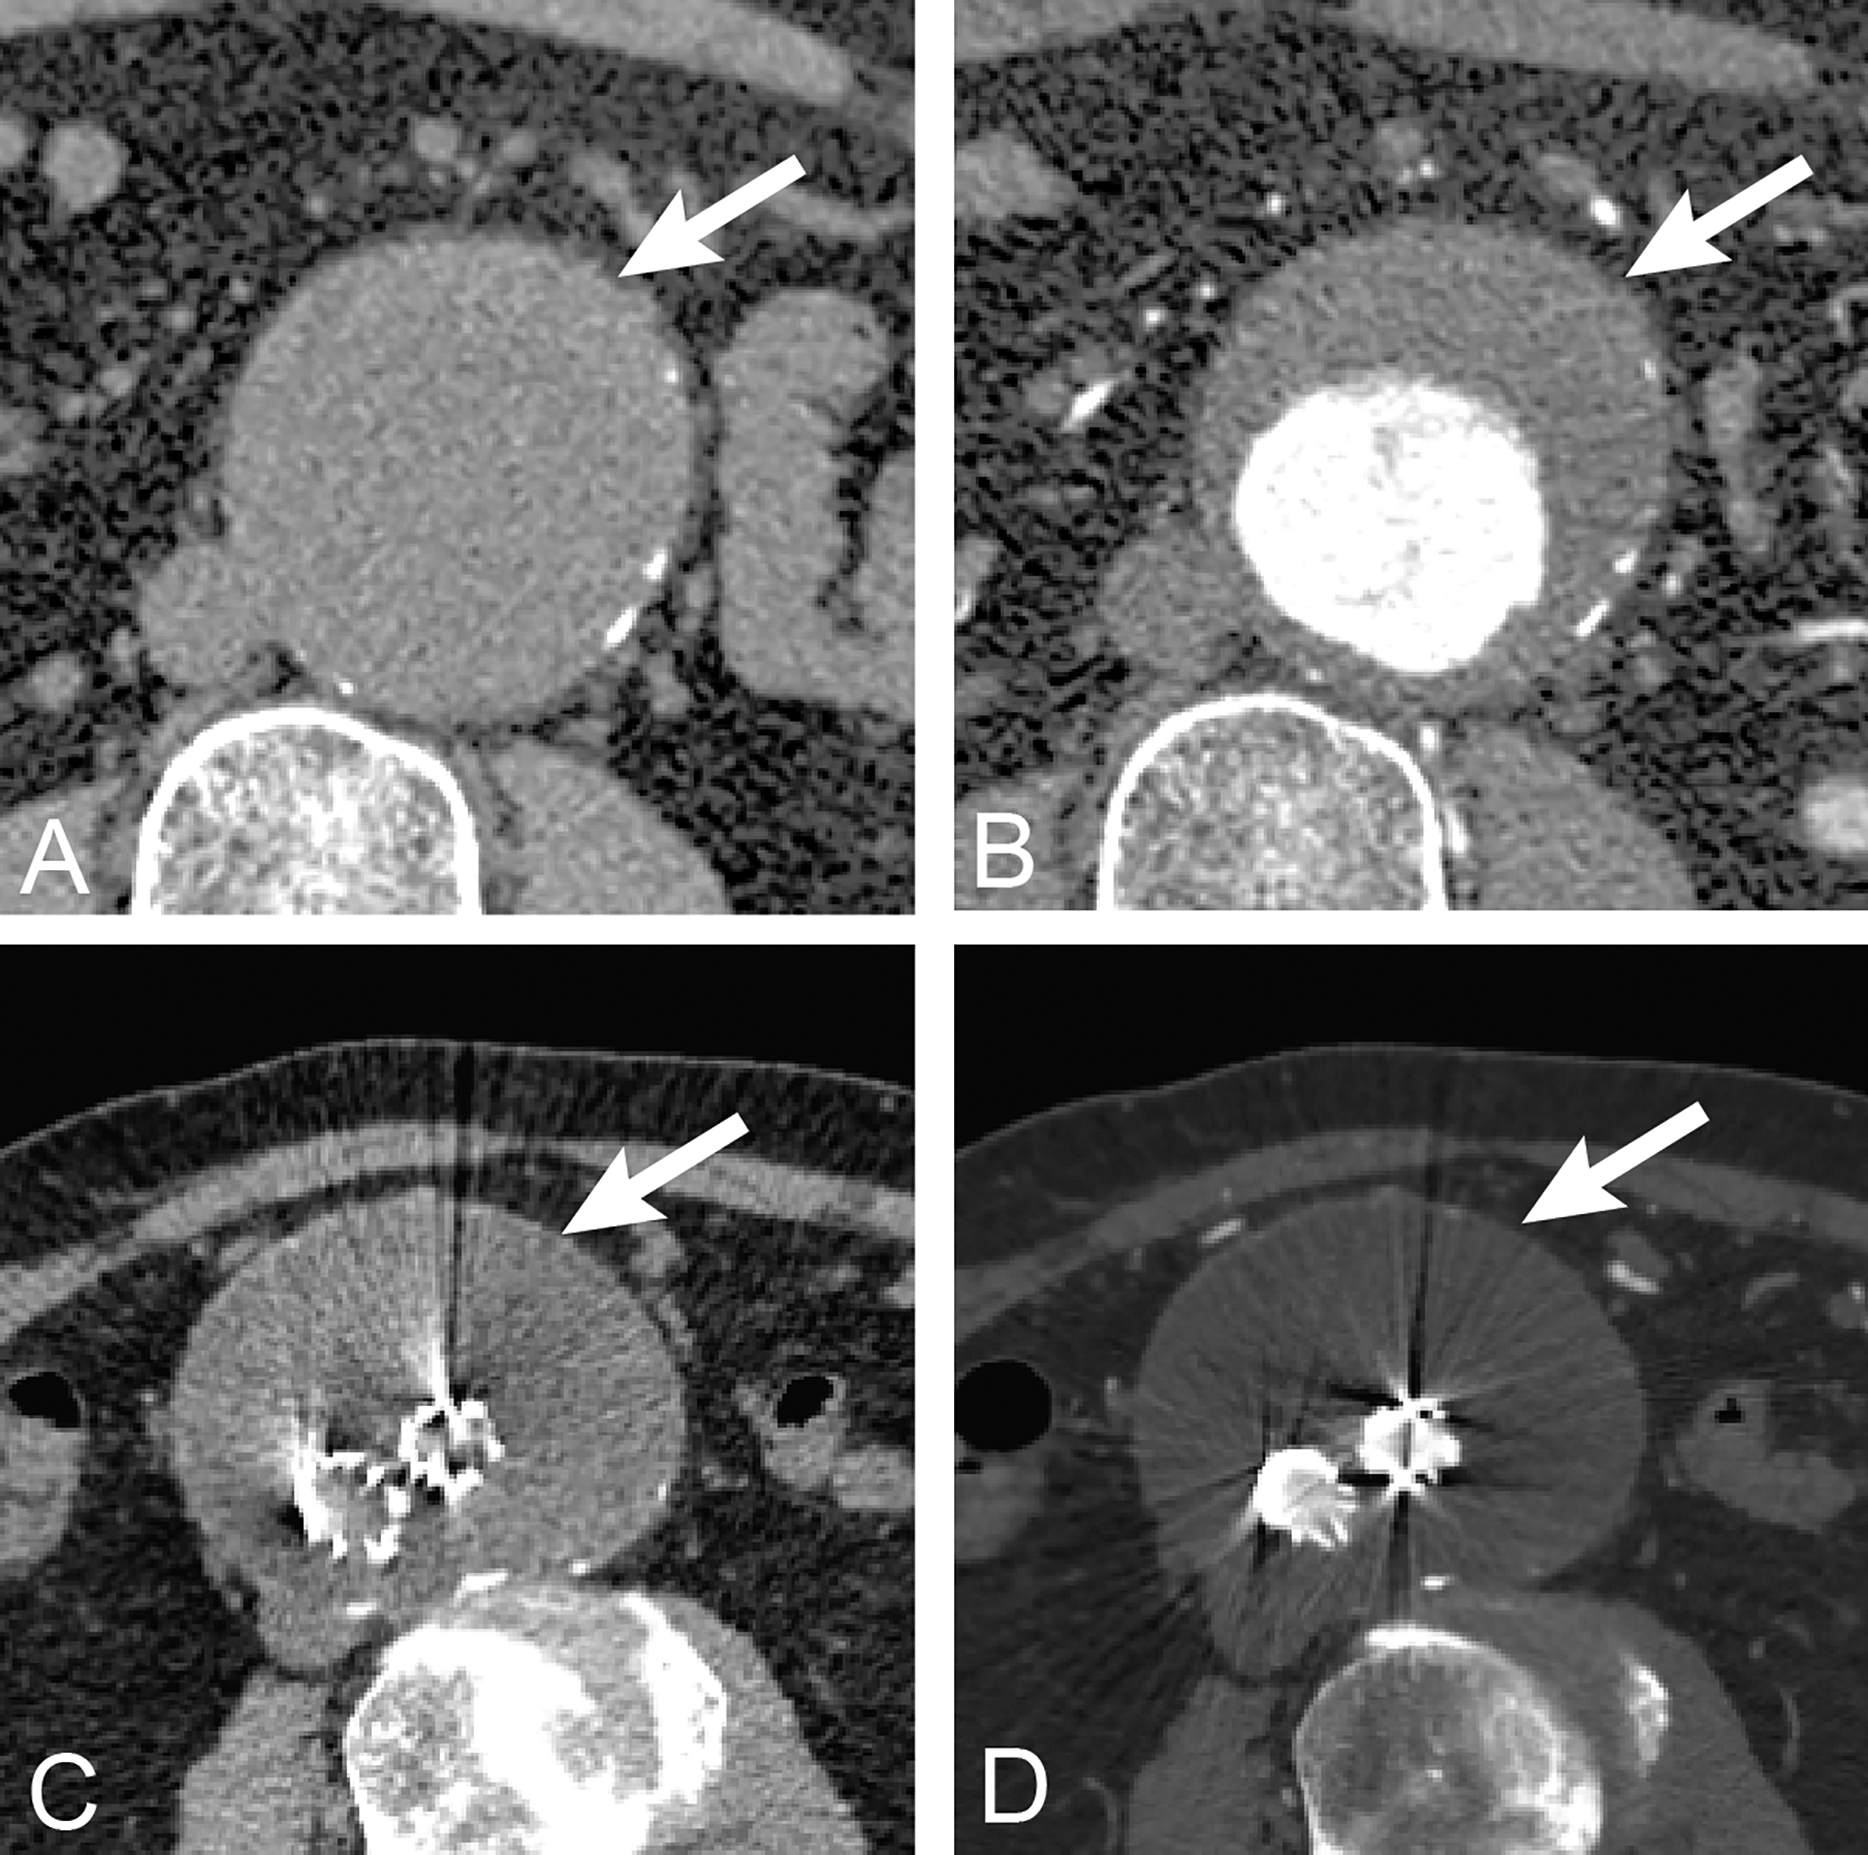
One of the key contributions of this article is to evaluate the performance gains from incorporation of coordinate/location based information into the CNN-based approach to AAA segmentation in different low and high contrast resolution datasets of non-contrast and contrast-enhanced CT images. The proposed method archives outstanding performance when compared with existing methods in the literature. The second main contribution is to adopt the transfer learning-based approach using a pre-trained model of pre-operative AAA to post-operative EVAR, with only a small amount of data for the re-training. This approach has benefits in clinical applications for both pre-operative and post-operative AAA segmentation.
Related work
Coordinate or positional encoding recently became a hot topic in computer science that was first implemented in the language processing domain (Vaswani et al., 2017; Gehring et al., 2017). In language processing, position encoding is used to assign the order of words in a sentence in a sequence in order to represent the position of the word. The positional encoding was implemented by a linear function (Gehring et al., 2017) and sinusoidal function (Vaswani et al., 2017). In the image processing domain, the coordinate information encoding was also proposed in recent literature (Liu et al., 2018; Ren & Hao, 2020) by adding extra channels in input images. Liu et al. (2018) proposed incorporating coordinate information in two extra channels for the x, y axes of 2D images using a continuous sequence of integers starting with zero in row and column. They demonstrated an improvement of CNNs in image classification, objection detection and generative models. Ren & Hao (2020) proposed a similar coordinate information embedding in the extra channels of images as the input of a downstream CNN. They demonstrated an improvement of object detection in traffic sign images.
Ronneberger, Fischer & Brox (2015) proposed a fully convolutional network and training strategy for biomedical images. They modified and extended a previous architecture (Long & Shelhamer, 2015) such that is could work with very few training images and archived better segmentation results. The upsampling module of this network architecture consists of many channels to extract features which would be propagated to their upper layers. The architecture is U-shaped because the expansive path is symmetric to the contracting path, and is thus called U-Net. U-Net applies elastic deformations for data augmentation on training images. This allows the network to compensate for the reduced amount of data, so that it can be applied to tasks with relatively little available training data. Jackson et al. (2018) proposed a CNN for segmentation of kidneys in non-contrast CT images using a 3D U-Net architecture. Non-contrast CT images contain less contrast difference and are thus more difficult to distinguish from adjacent structures as compared with post-contrast CT images. They reported mean dice scores of 91% and 86% for right and left kidney segmentation, respectively.
López-Linares et al. (2018) proposed a fully automatic approach to AAA segmentation in post-operative CTA images, based on deep convolutional neural networks (DCNN). The proposed method has two steps. In the first step, the DCNN (Long & Shelhamer, 2015) provides 2D region-of-interest candidates for the thrombus. The second step is fine thrombus segmentation with a holistically-nested edge detection (HED) network (Xie & Tu, 2015). The DCNN is used to detect the thrombus region in the region of interest followed by HED for subsequent fine thrombus segmentation. The HED reduces the need for large deconvolution filters and increases the output resolution. The networks are trained, validated, and tested on 13 post-operative AAA images, archiving 82% dice score. Lu et al. (2019) recently proposed CNN segmentation of pre-operative AAA. The proposed method modified the 3D U-Net combined with ellipse filling for detection and segmentation of AAA. The model was trained on 321 CT examinations (non-contrast 168, post contrast 153) with testing on 57 examinations (non-contrast 28, post-contrast 29). The AAA was present in 77% of the training dataset, yielding samples for non-contrast and post-contrast of about 129 and 117 examinations, respectively. The test was evaluated in terms of the maximum diameter of the aorta with an average dice score of 91.0%. Dziubich et al. (2020) proposed CNN-based AAA segmentation with an ensemble of 2D U-Net, ResNet and VBNet. The ensemble predictions from these frameworks were reported to have a dice score of 94.0%. In addition, Siriapisith, Kusakunniran & Haddawy (2019) proposed an advanced graph-cut segmentation method on post-contrast CT images of AAA. The on integration of intensity-based and contour-based properties was deployed in the graph-cut with probability density function (GCPDF) and graph-cut based active contour (GCBAC). The performance, reported based on 20 CT examinations, yielded an average dice score of 91.88%.
In this study, we explore the incorporation of pixel-level coordinate/location information into a variety of network architectures, including UNet, VNet, ResNet and DenseNet. The AG-DSV-UNet (Turečková et al., 2020) is the recent advanced integration of attention gate (AG) and deep supervision (DSV) modes into the standard UNet. The AG module generates an attention-awareness mechanism (Wang et al., 2017) in the images that improves the performance in difficult structures. The DSV module solves the problem of vanishing gradients in the deeper layers of the CNN (Turečková et al., 2020). The VNet (Milletari & Navab, 2016) is an extension of UNet by replacing the max-pooling and upsampling with convolutions. The VNet increases the number of hyperparameters of a trained CNN as compared with standard UNet. ResNetMed (Chen, Ma & Zheng, 1904) is a 3D modification and a representative of 2D ResNet to allow the network to train with 3D medical data (He et al., 2016). ResNet improves the performance of deep convolutional neural networks by increasing the number of network layers and slowly degrading the features at deeper layers (He et al., 2016). ResNet is a popular network that has been proven effective with image medical data (Tian et al., 2022; Park et al., 2022; Wang et al., 2022). It is widely used in classification and detection in various medical images such as thoracic, ophthalmology and abdominal studies (Wang et al., 2022). DenseVoxNet (Yu et al., 2017) is 3D modification and a representative of DenseNet, which preserves the concept of dense connectivity. The DenseVoxNet has direct connections from a layer to all its subsequent layers and makes the network much easier to train.
Materials and Methods
Network architecture
To examine the generality of the value of incorporating coordinate information in the segmentation process, we experiment with five CNN network architectures: standard UNet, AG-DSV-UNet, VNet, ResNetMed and DenseVoxNet. We describe each network architecture in turn. The 3D UNet (Ronneberger, Fischer & Brox, 2015) network architecture consists of contracting and expansive paths. The contracting path follows the classical convolutional network architecture. It consists of the repeated operation of 3 × 3 × 3 kernel size of two convolution layers, each of them followed by a rectified linear unit (ReLU) and then 2 × 2 × 2 kernel size of a max pooling operation. The detailed architecture of UNET was previous described in Ronneberger, Fischer & Brox (2015). In the downsampling step, the number of filtering kernels is double of the one in the previous layer. Whereas, in the corresponding upsampling step, the number of filtering kernels is halved back to the number before the downsampling step. The features from the contraction path are concatenated with the features from the corresponding upsampling step, in all pairs of downsampling-upsampling steps. Specifically, in the final layer, each 64-dimension feature vector must be projected to have the same dimension as the number of classes, using a convolution layer with 1 × 1 × 1 kernel size In total the network has 23 convolutional layers. Two classes (aorta and background) were applied at the output layers with threshold 0.5 to generate the binary classification of the aorta.
The 3D AG-DSV-UNet (Turečková et al., 2020; Kearney et al., 2019) is based on the standard UNet with the addition of AG and DSV modules. The AG module is added in the connection between pair of corresponding encoding and decoding modules. The features from the encoding path is combined with the input features, in which both of them are processed through a convolutional layer with 1 × 1 × 1 × kernel and a batch normalization, in order to compute the attention map. DSV (Turečková et al., 2020; Kearney et al., 2019; Turečková et al., 2019) is the module added at the final step of the network by combining multiple segmentation maps from different resolution levels with element-wise sum. The detail of architecture was previously described in Turečková et al. (2020). It was based on the combination of two maps before upsampling to the next level-up. The second segmentation map was constructed by applying a 1 × 1 × 1 convolution on each level of decoding paths.
The 3D VNet (Milletari & Navab, 2016) consists of encoder and decoder paths. The encoder path of the VNet is divided into many levels that operate at different resolutions. Each level comprises one to three convolutional layers with a 5 × 5 × 5 kernel. The data resolution is reduced with the convolution. The second operation extracts features by non-overlapping 2 × 2 × 2 volume patch, which reduces the size of the output feature map by half. The max-pooling operation in UNet is replaced with convolution in VNet. The decoder path of VNet expands the lower resolution maps in order to assemble the output volumetric segmentation. Each level of decoder path consists of deconvolution operation to increase the size of the inputs followed by one to three convolutional layers with 5 × 5 × 5 kernel.
The ResNetMed (Chen, Ma & Zheng, 1904) is composed of 34 plain convolution layers of encoders and decoders. The first two sets of encoder layers are composed of (1) a convolution layer with a 3 × 3 × 3 kernel size and 256 channels, and (2) a convolutional layer with a 3 × 3 × 3 kernel and 128 channels. Each convolution layer has a 3 × 3 × 3 kernel with the same output of the feature map. The remaining two groups of decoder layers are similar to the first two groups except doubling the number of channels per layer progressively. The final convolution layer is a Conv with a 1 × 1 × 1 kernel size to generate the final output.
The DenseVoxNet (Yu et al., 2017) has down-sampling and up-sampling components. The down-sampling component is divided into two densely-connected blocks called DenseBlocks and each DenseBlock is composed of 12 transformation layers with dense connections. Each transformation layer is sequentially composed of batch normalization (BN), ReLU and 3 × 3 × 3 Conv. The up-sampling component is composed of BN, ReLU, 1 × 1 × 1 Conv and two 2 × 2 × 2 deconvolution (Deconv) layers. The final layer is 1 × 1 × 1 Conv to generate the final label map.
Coordinate information
The coordinate matrices (CoMat) were constructed using three matrices , to embed the x, y, and x coordinate information of the input dataset , where H is the height, W is the width and D is depth of the input data. The initial value of CoMat is a sequence integer indices in each axis plane of the image in the ranges , as shown in Figs. 2 and 3. No additional object prediction is required to generate this coordinate information. The experiments create three types of coordinate information, CoMat1, CoMat2 and CoMat3. The CoMat1 is composed of x, y, z coordinates separately in three channel matrices. Because the aorta is tubular in shape along the z-axis, CoMat2 contains only the z coordinate information in one channel. The CoMat3 is a summation of x, y, z coordinate information into one channel using Eq. (1). The CoMat information is embedded into the original image data as the additional input channels of downstream CNN training. The original image data for medical images is one channel, so the input data for CNN will be two or four. It can be simply applied and does not change the core training network.
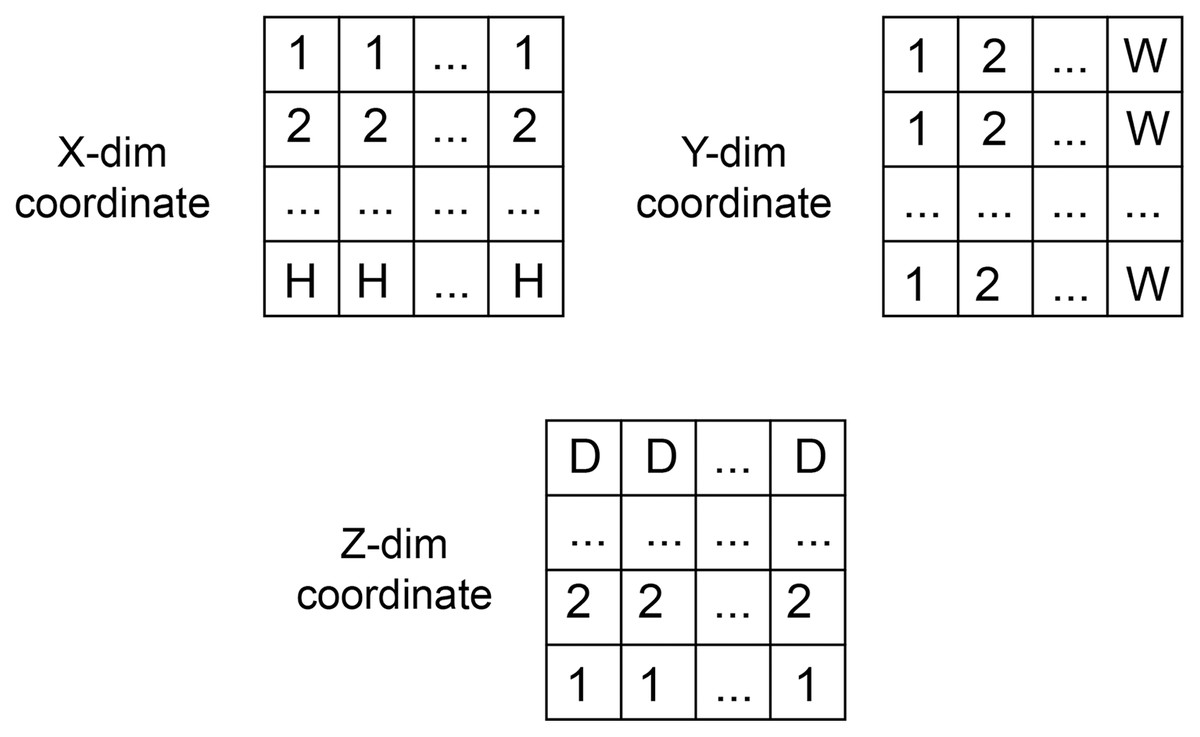
Figure 2: The coordination data.
The value initialization in x, y and z dimensions of coordinate information created in three axes.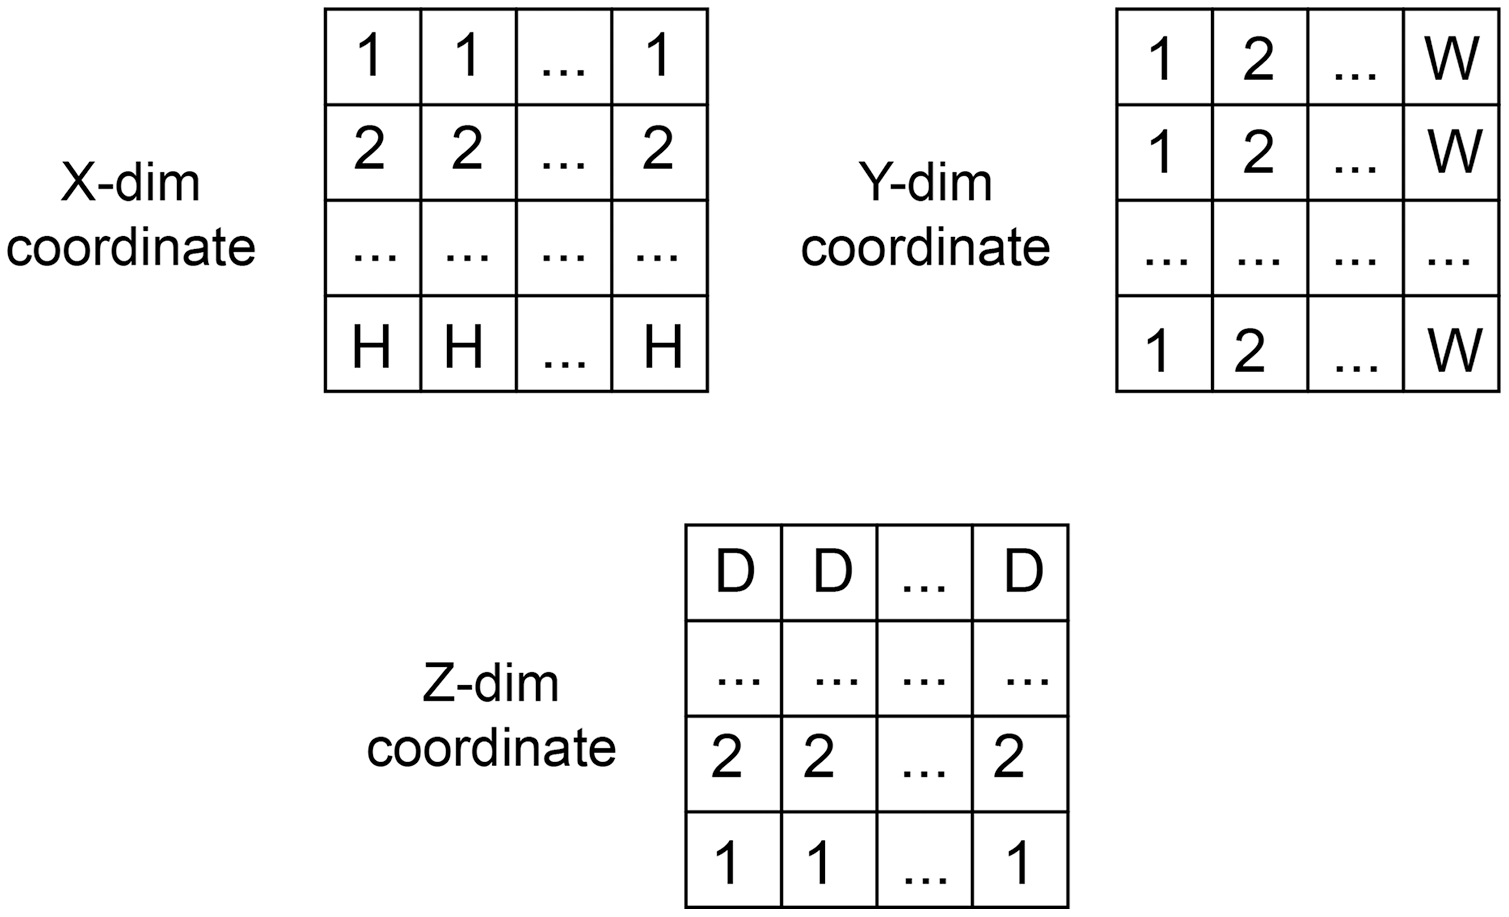
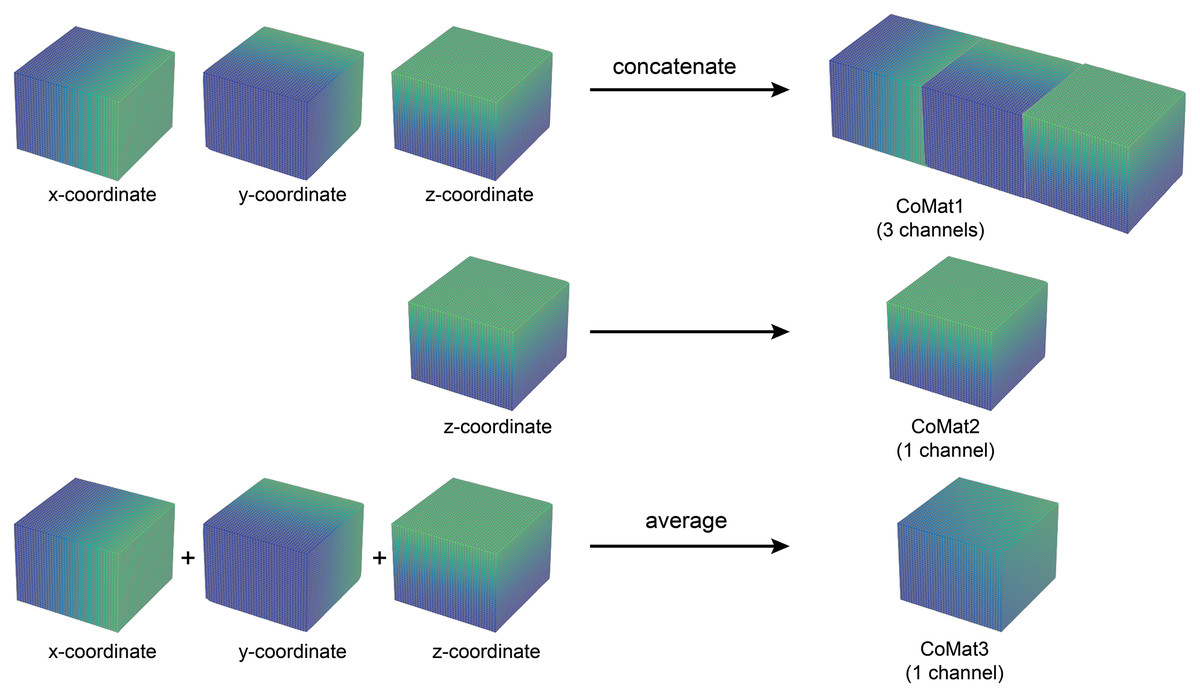
Figure 3: Three types of coordinate information.
An illustration of coordinate information data creation. The CoMat1 concatenates x, y, and z-coordinate matrices into three channels of data. The CoMat2 contains only the z-coordinate matrix (one channel). The CoMat3 is an average of x, y, and z-coordinate matrices into one channel data.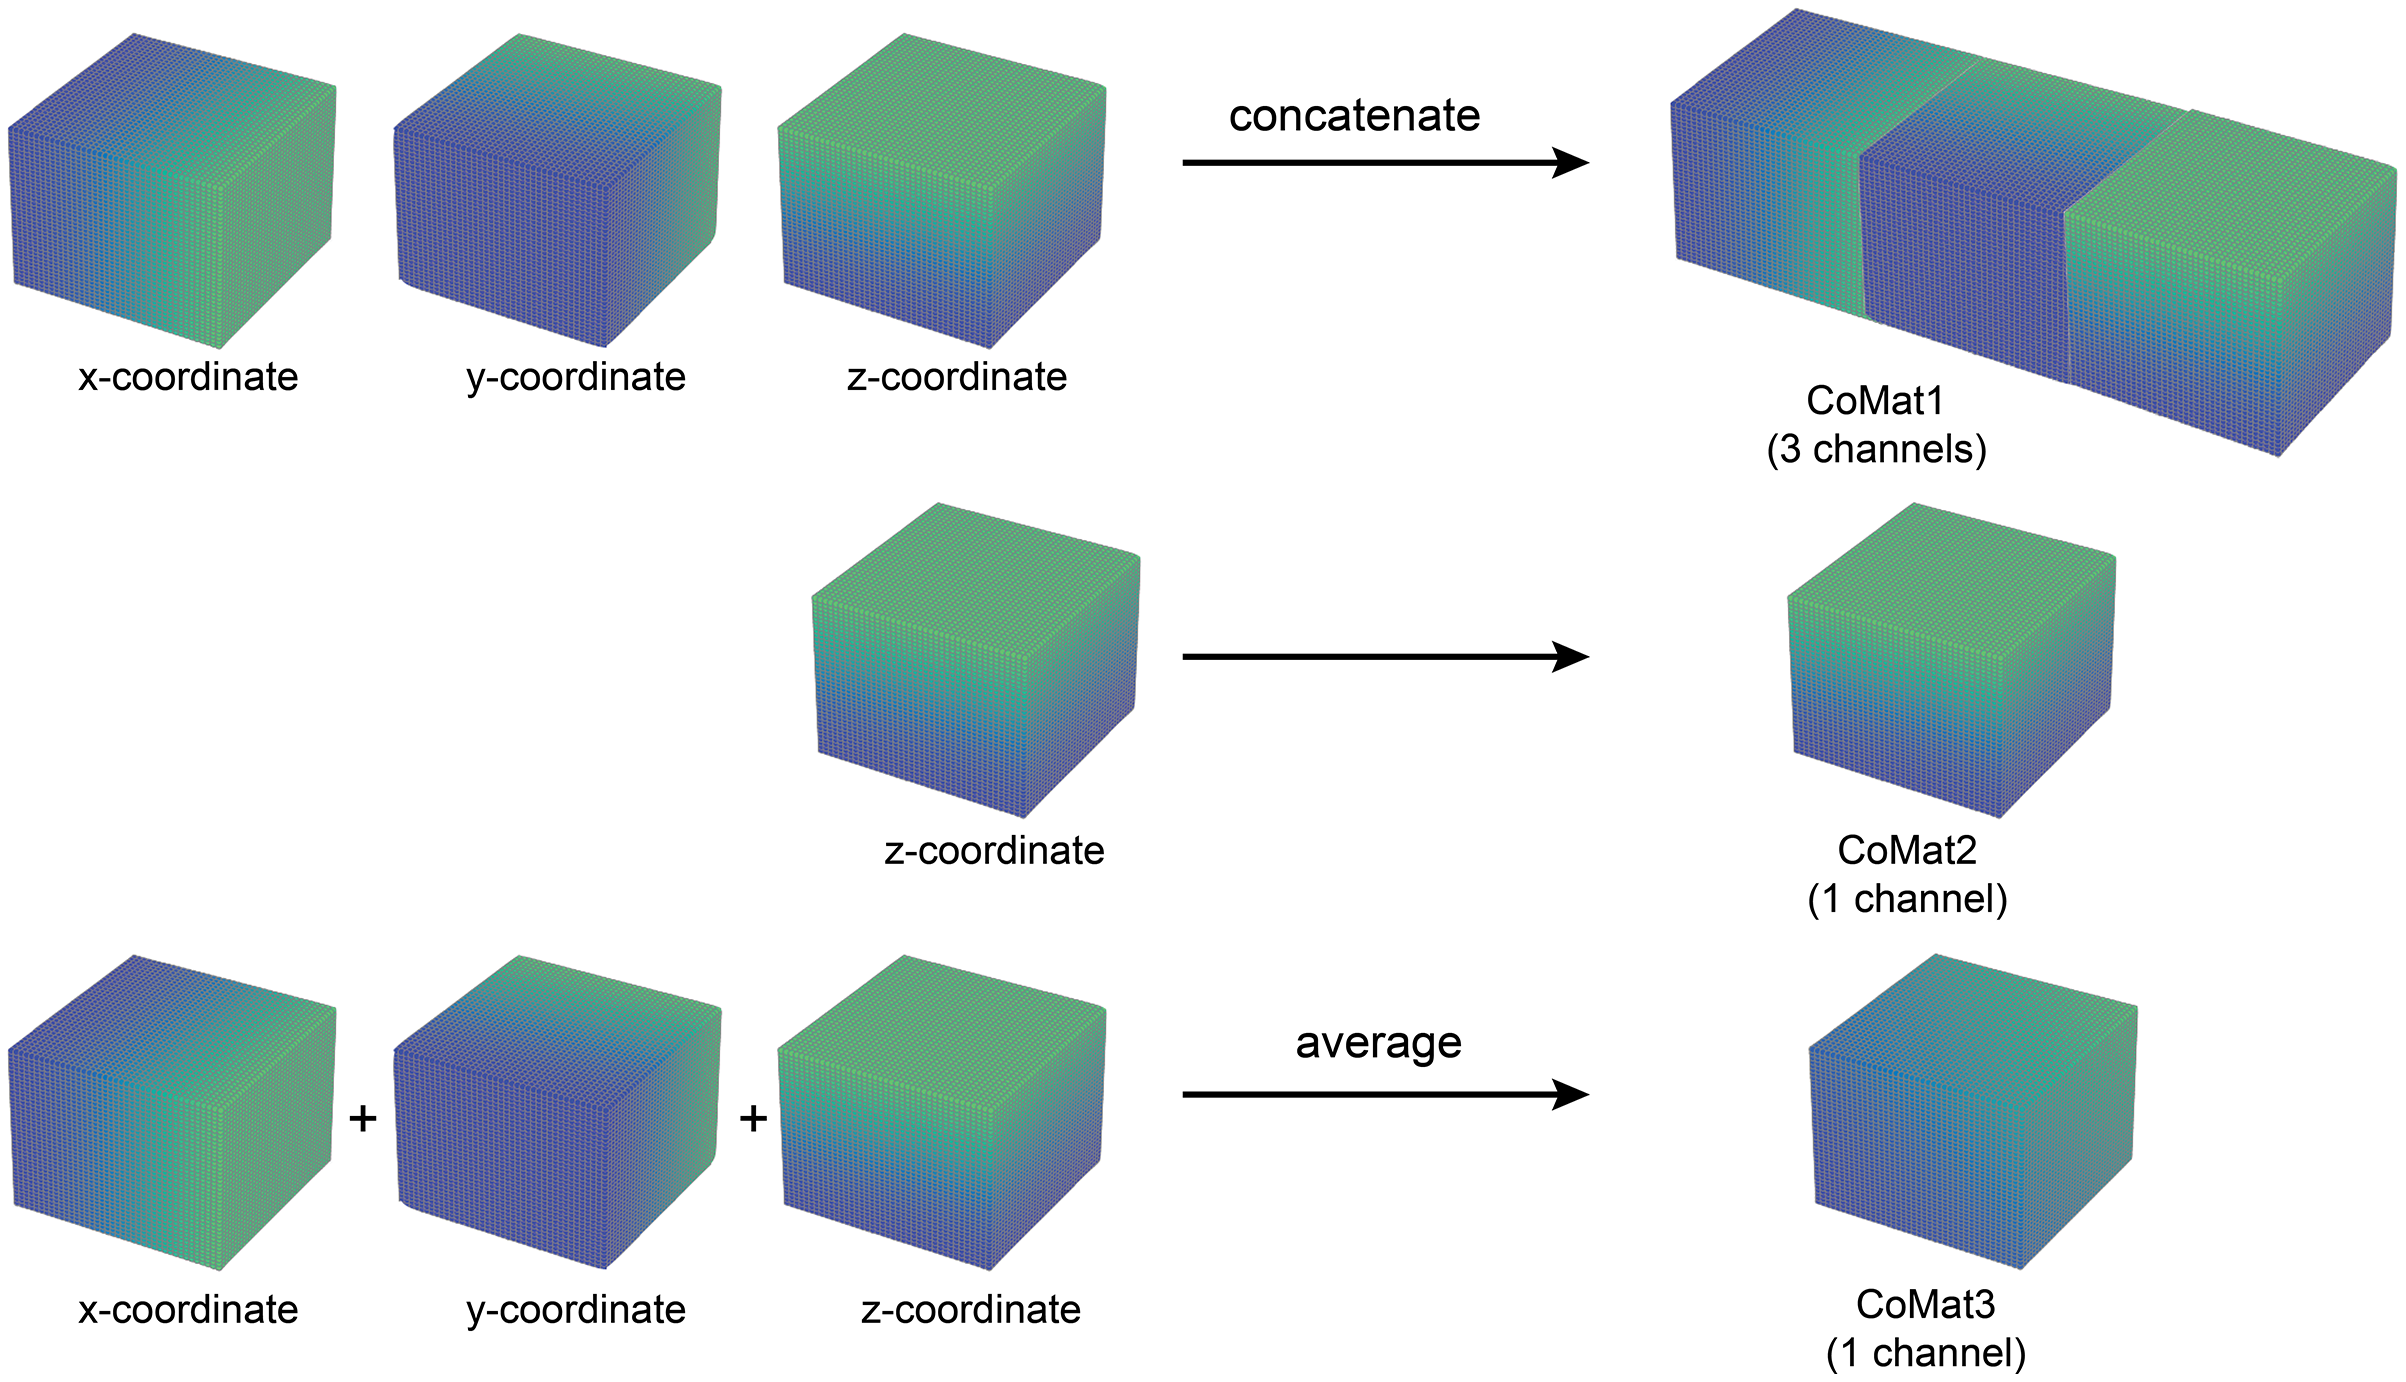
(1)
Dataset and experiment
The experiments in this article were conducted under the approval of the institutional review board of Siriraj Hospital, Mahidol University (certificate of approval number: Si 818/2019). The raw datasets of this experiment were collected from 220 patients with AAA on whom performing both before and after contrast administration of CTA acquisition. The exclusion criteria included any surgery and other diseases of abdominal aorta such as bleeding, infection, and dissection. All CTA study was acquired with the 256-slice multi-detector row CT scanner (Revolution CT; GE Medical Systems, Milwaukee, WI, USA) using a nonionic monomer iodinated compound. The initial source of CT images was in axial slices with 1.25 mm slice thickness covering the entire abdominal aorta. The 64 DICOM images of each CTA were selected at the region of aortic aneurysm and the data was incorporated into a single volume file. To preserve the original pixel intensity, the dataset was kept in 12 bits grayscale. The volume metric of each dataset was 512 × 512 × 64 pixels. No additional feature map or augmentation was performed in this study.
The pytorch (v1.8.0) deep learning library in Python (v3.6.9) was used in the implementation. The CNN input volume was a matrix with 256 × 256 × 64 voxel dimensions. The pre-processing step was only voxel rescaling from 512 × 512 pixels to 256 × 256 pixels in the x-y plane. Each voxel contained the raw 12 bits grayscale as input data. The number of CT slices was limited to 64 due to the limitation of GPU memory. The coordinate information array of the volume dataset in xyz-direction was concatenated to the dataset and then fed into the training process (Figs. 2, 3). The experiments used three types of coordinate information, CoMat1, CoMat2 and CoMat3, which have three, one and one channels, respectively. Figure 4 demonstrates the overview flow of the data training process. Our experiments were operated on a single GPU (Nvidia DGX-A100) with CUDA-enabled containing 40 GB RAM. The networks were learned with specific optimizer (i.e. RMSprop) and error loss (i.e. mean squared). The training parameters were set with learning rate of le-3, weight decay of le-8, and momentum of 0.9. The random seed was initially set to be zero. The dataset was split into training and validating sets with a respect ratio of 9:1. The training process was allowed to perform till a maximum of 300 epochs. The processing time required was 150–210 s for each epoch resulting in a total of 12.5–17.5 h for a one-time training process.
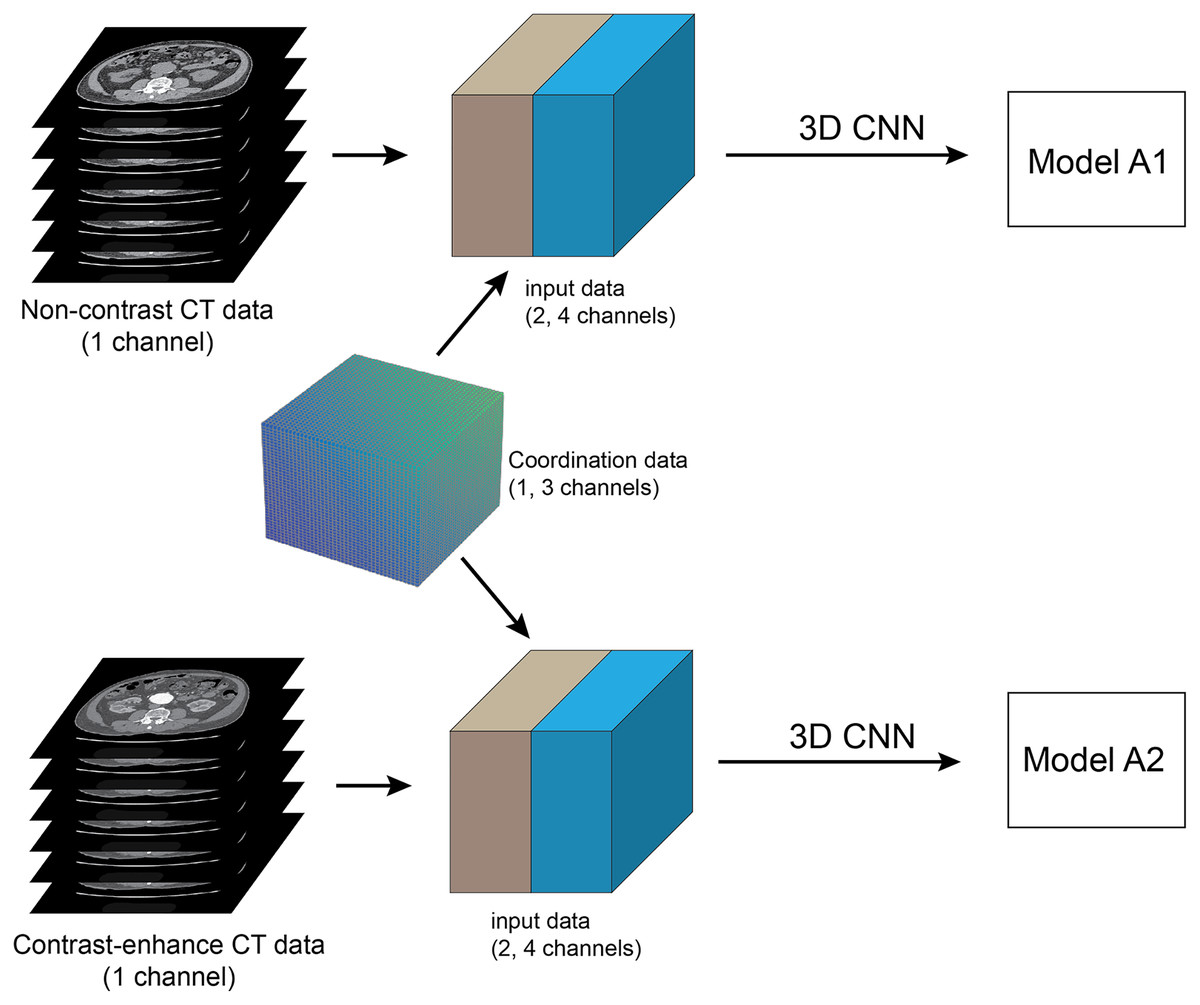
Figure 4: Method framework.
Framework of full training of pre-operative abdominal aortic aneurysm (AAA): The pre-processing step is to select 64 slices of contiguous CT images at infrarenal segments of abdominal aorta, which are then converted into a single 3D volume dataset. networks are trained using 3D CNN and set up in two separate experiments. The coordinate information is embedded into input data as the additional channels. The pre-contrast and contrast-enhanced CT datasets are used to train each network to create two models A1 and A2, respectively.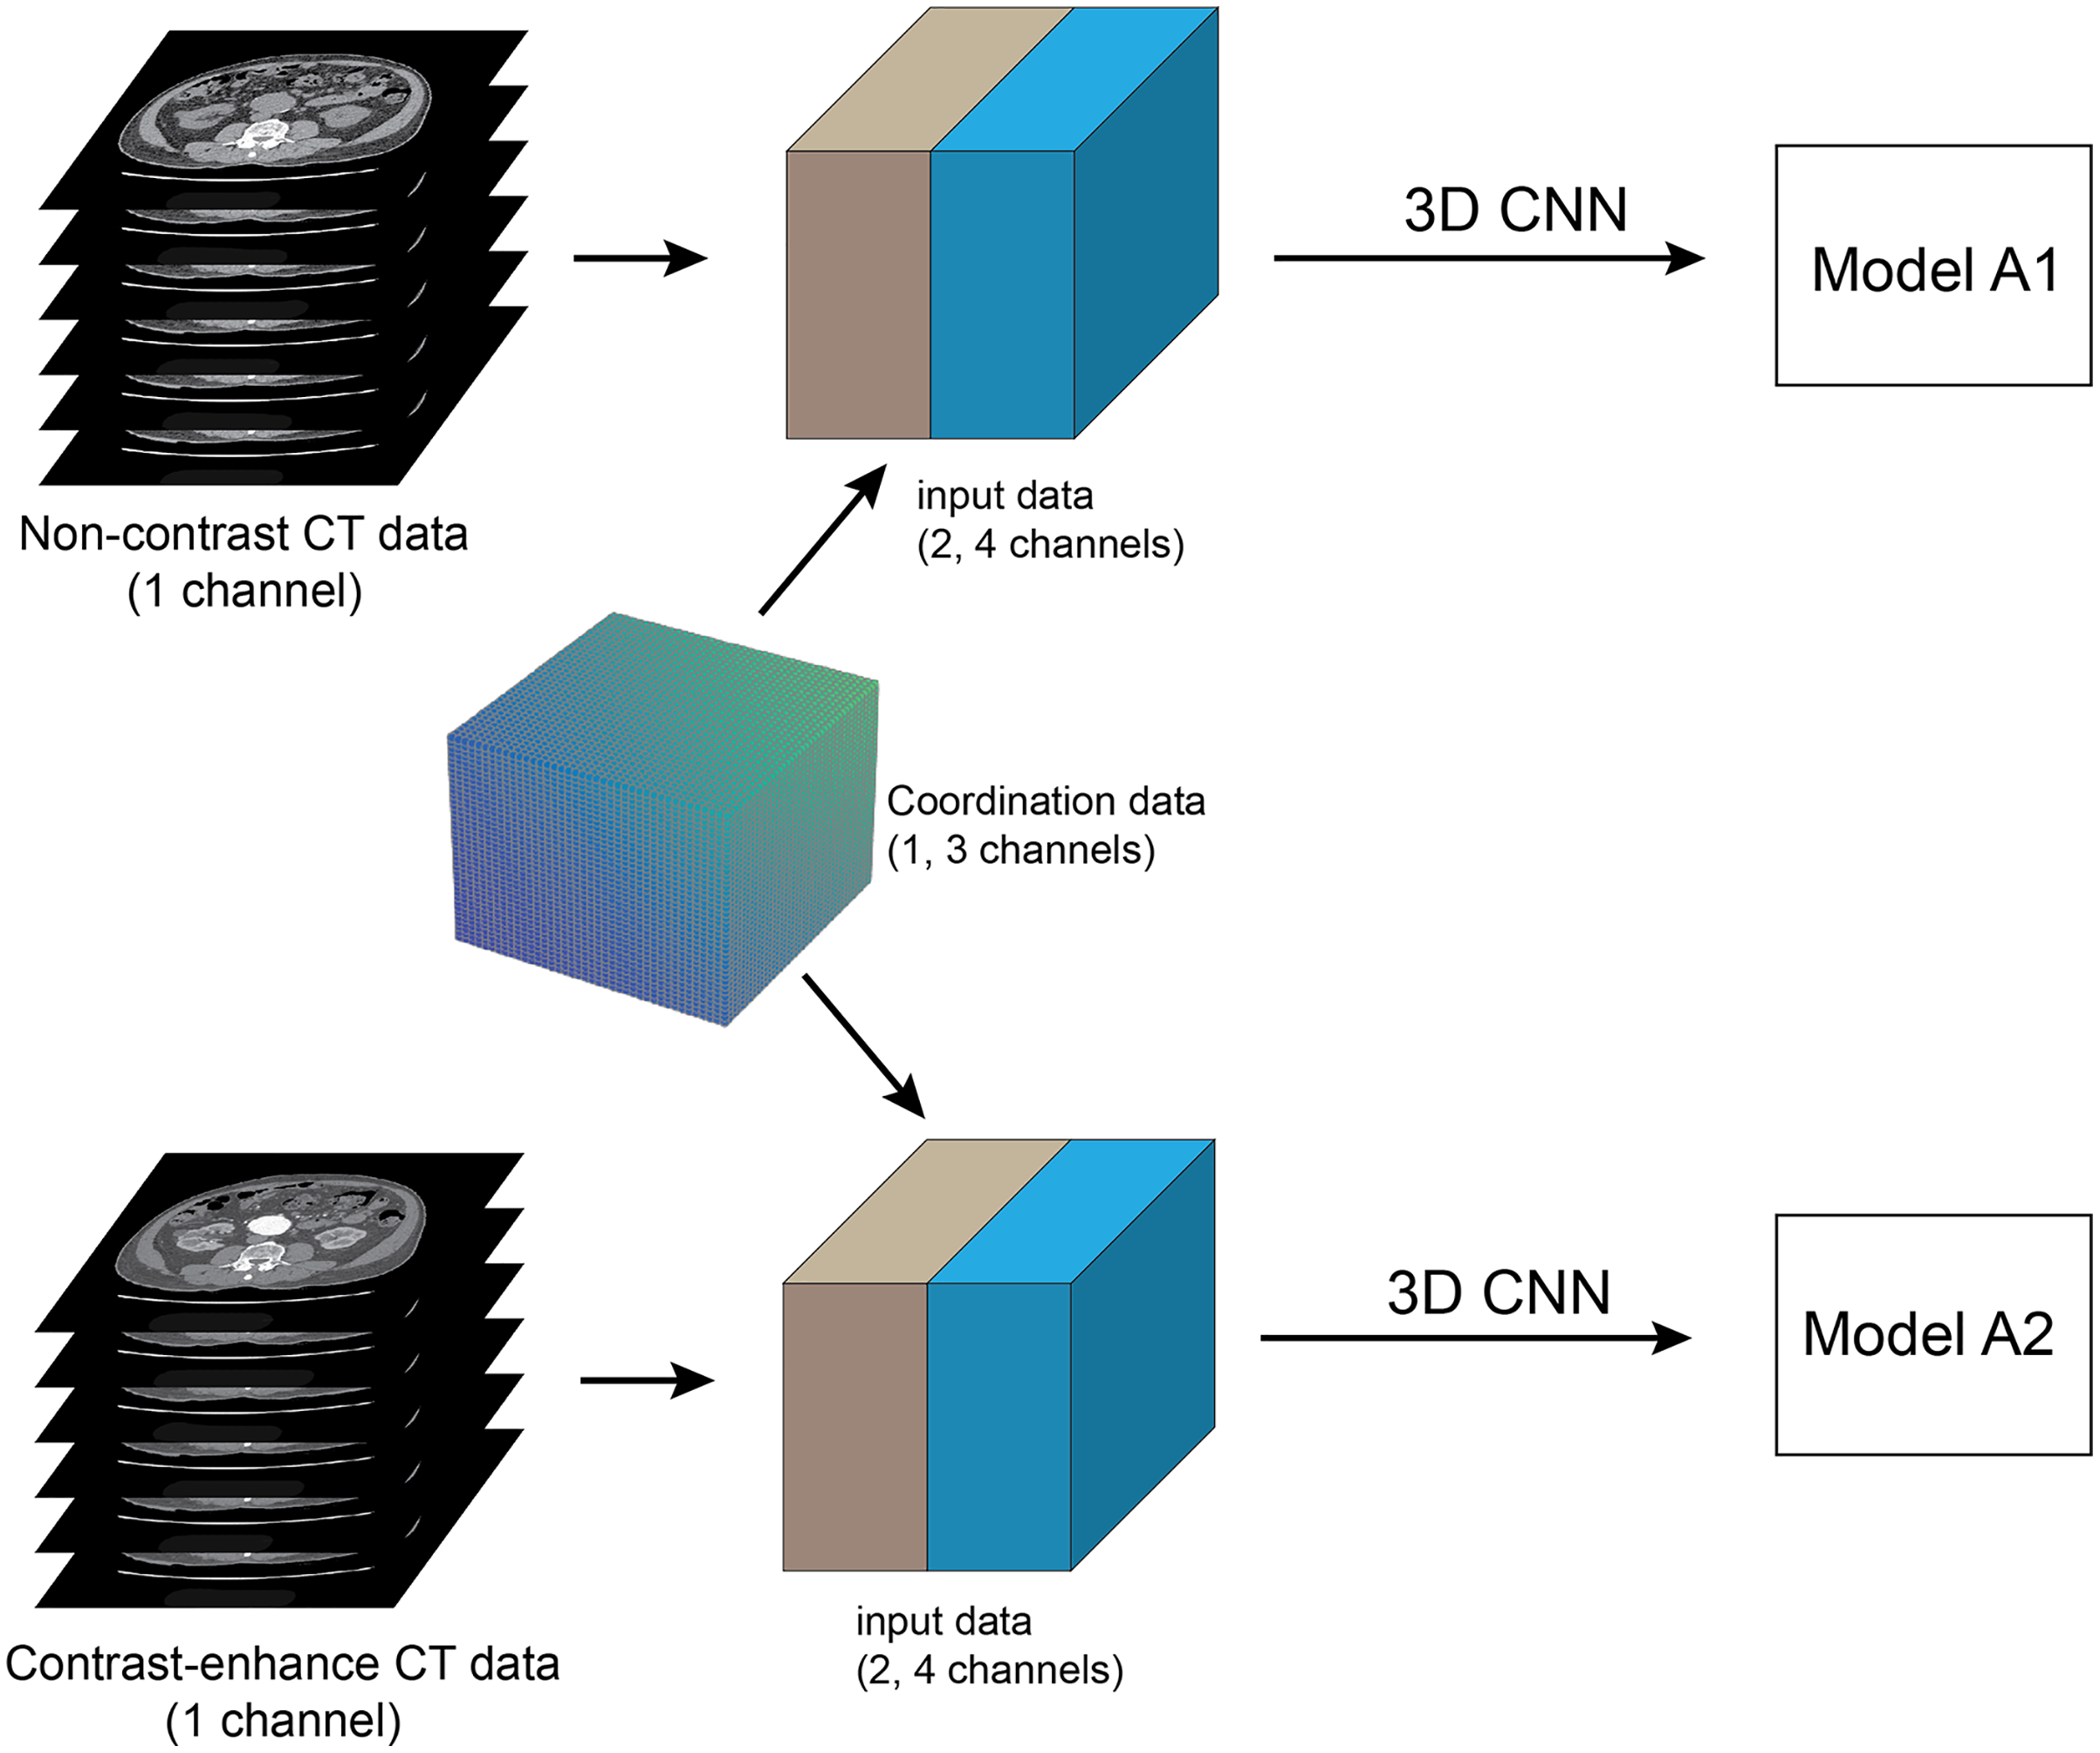
The non-contrast (NCCT) and contrast-enhanced (CECT) CT datasets were acquired from each patient in the same study. The network training was performed in two separate groups of experiments: NCCT and CECT datasets (Fig. 3). We call the trained models A1 and A2, respectively. The datasets for training with validation had 200 cases each. Each experiment randomly split the dataset into 90% for training and 10% for validation. The total number of images for training and validation was 12,800 for each experiment. The NCCT test dataset consisted of 1,280 images from 20 cases. The CECT test dataset also contained 1,280 images from 20 cases.
Transfer learning
The segmentation of post-operative EVAR was done with a network trained using transfer learning. The pre-training 3D CNN models (A1, A2) were trained on large pre-operative AAA datasets. The transfer learning fine-tuned the shallow layers (contracting path) of the 3D CNN (Amiri, Brooks & Rivaz, 2020) which represents low-level features. The training dataset was small, containing only 20 cases of NCCT and CECT datasets. These training datasets were not the same cases as the pre-trained AAA models. All of the data was used for training without validation (Fig. 4). The hyper-parameters were manually set to be the same values as used in the pre-trained model. The models are named E1 and E2, corresponding to the NCCT and CECT datasets, respectively. To evaluate the performance of the transfer learning, 20 cases with post-operative EVAR were also used for test datasets.
Performance evaluation
To validate the performance of our proposed CNN segmentation method, it is compared with the performance of the advanced graph-cut-based method that combines GCPDF with GCBAC (Siriapisith, Kusakunniran & Haddawy, 2019). The experiment was performed on only contrast-enhanced AAA without stent graft implantation in 20 datasets. The ground-truth of AAA segmentation in all axial slices was prepared by a cardiovascular radiologist with 18 years of experience using the 3D slicer software version 4.10.0 (Fedorov et al., 2012). The quantitative assessment was evaluated by pixel wise comparison with the ground-truth using the dice similarity coefficient (DSC), Jaccard similarity coefficient (JSC) and Hausdorff distance (HD) as shown in Eqs. (2)–(4), where the insight toolkit library of 3D slicer software (Fedorov et al., 2012) was used to calculate an average HD value. The significant differences in the comparison coefficient among the several groups of experiments (comparison between CNN alone and CNN+CoMat) were assessed using a paired Student’s t-test. A statistically significant difference could be identified when P values <0.05. The consistency of the ground-truth was accessed by pixel wise inter-rater correlation of DSC using two cardiovascular radiologists with 18 and 14 years of experience. The process of inter-rater correlation was performed by randomly selecting 40 CT images from the NCCT dataset (two slices for each case).
(2)
(3)
(4) where RA is the region of the segmentation result, and RR is the region of ground truth by manual segmentation.
Results
Table 1 demonstrates the patient demographics. The training dataset contains case with an average age of 73.69 years, maximum aortic diameter of 57.9 mm, and average volume of 155.7 ml. The testing data has a similar distribution, with average age 72.52 years, maximum aortic diameter 62.5 mm, and average volume 161.60 ml.
| Training dataset | Testing dataset | |
|---|---|---|
| No of patients | 200 | 20 |
| Average age (years) | 73.69 (51–93) | 72.52 (42–88) |
| Maximum aortic diameter (mm) | 57.9 (32.1–107) | 62.5 (50.9–85.9) |
| Average volume (ml) | 155.7 (39.2–549.0) | 161.60 (85.8–360.5) |
Most recent studies have used manual drawing to create the ground-truth for evaluating the AAA segmentation result. However, in this study, the ground-truth was created by manual drawing of the CT images slice by slice by one experienced cardiovascular radiologist. The quality of the ground-truth segmentations was validated by inter-observer correlation which was found to be 97.68 ± 0.82%. This could indicate excellent inter-observer agreement.
The experiments on the proposed 3D CNN-based methods of AAA segmentation demonstrate excellent results in most networks (i.e. UNet, AG-DSV UNet, VNet and ResNetMed). The training accuracy of all networks is demonstrated in graph (Fig. 5). Performances on the CECT dataset tend to be better than on the NCCT datasets. The best accuracy on NCCT and CECT datasets are AG-DSV-UNet+CoMat3 and standard UNet+CoMat1 with DSC values of 96.56 ± 2.18 and 96.69 ± 1.11, respectively. The coordinate information improved the segmentation results in all networks, particularly, CoMat1 and CoMat3. CoMat3 shows improvement of segmentation in most training networks on NCCT and CECT datasets, except UNet on CECT datasets and DenseVoxNet on both NCCT and CECT datasets, for which CoMat1 is best. The DenseVoxNet without coordinate information shows the worst accuracy on both NCCT and CECT datasets with DSC values of 35.85 ± 12.16 and 24.67 ± 12.75, respectively. However, the accuracy is significantly improved when coordinate information with CoMat1, CoMat2 and CoMat3 is added. The best improvements of DenseVoxNet occur with CoMat1 on both NCCT and CECT datasets with DSC values of 89.30 ± 5.70 and 87.48 ± 10.50, respectively.
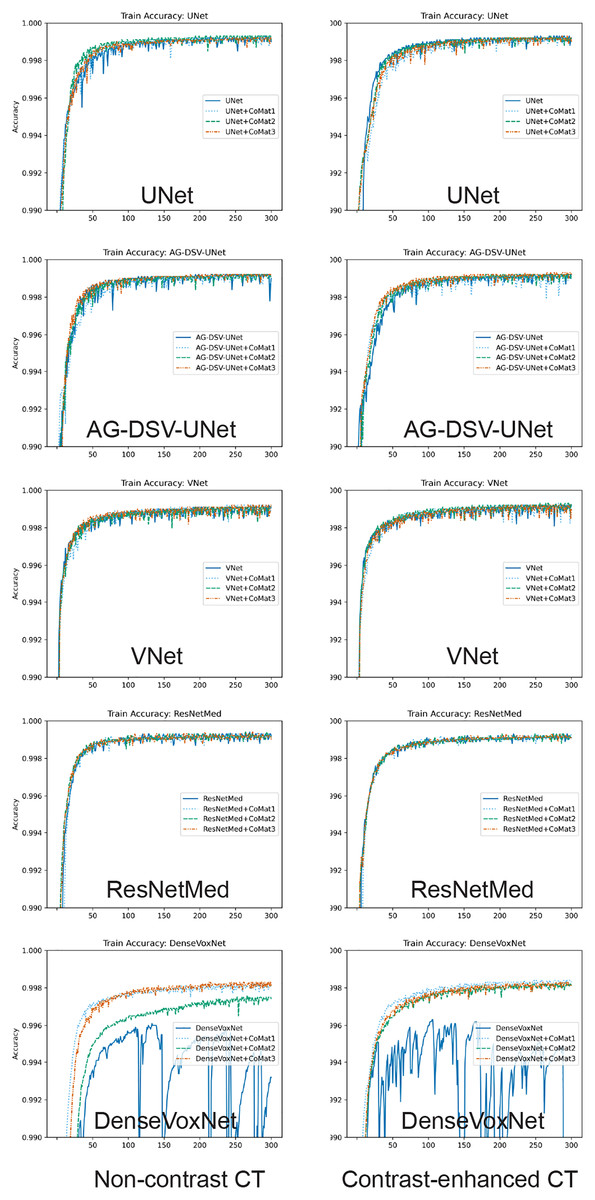
Figure 5: Training curve.
Model training accuracy of UNet, AG-DSV-UNet, VNet, ResNetMed, DenseVoxNet on non-contrast, contrast-enhanced datatsets of pre-operative abdominal aortic aneurysm datasets. The left column is the non-contrast and right column is the post-contrast CT dataset. The label color of non-coordinate, CoMat1, CoMat2, and CoMat3 are blue, light blue, green and orange, respectively.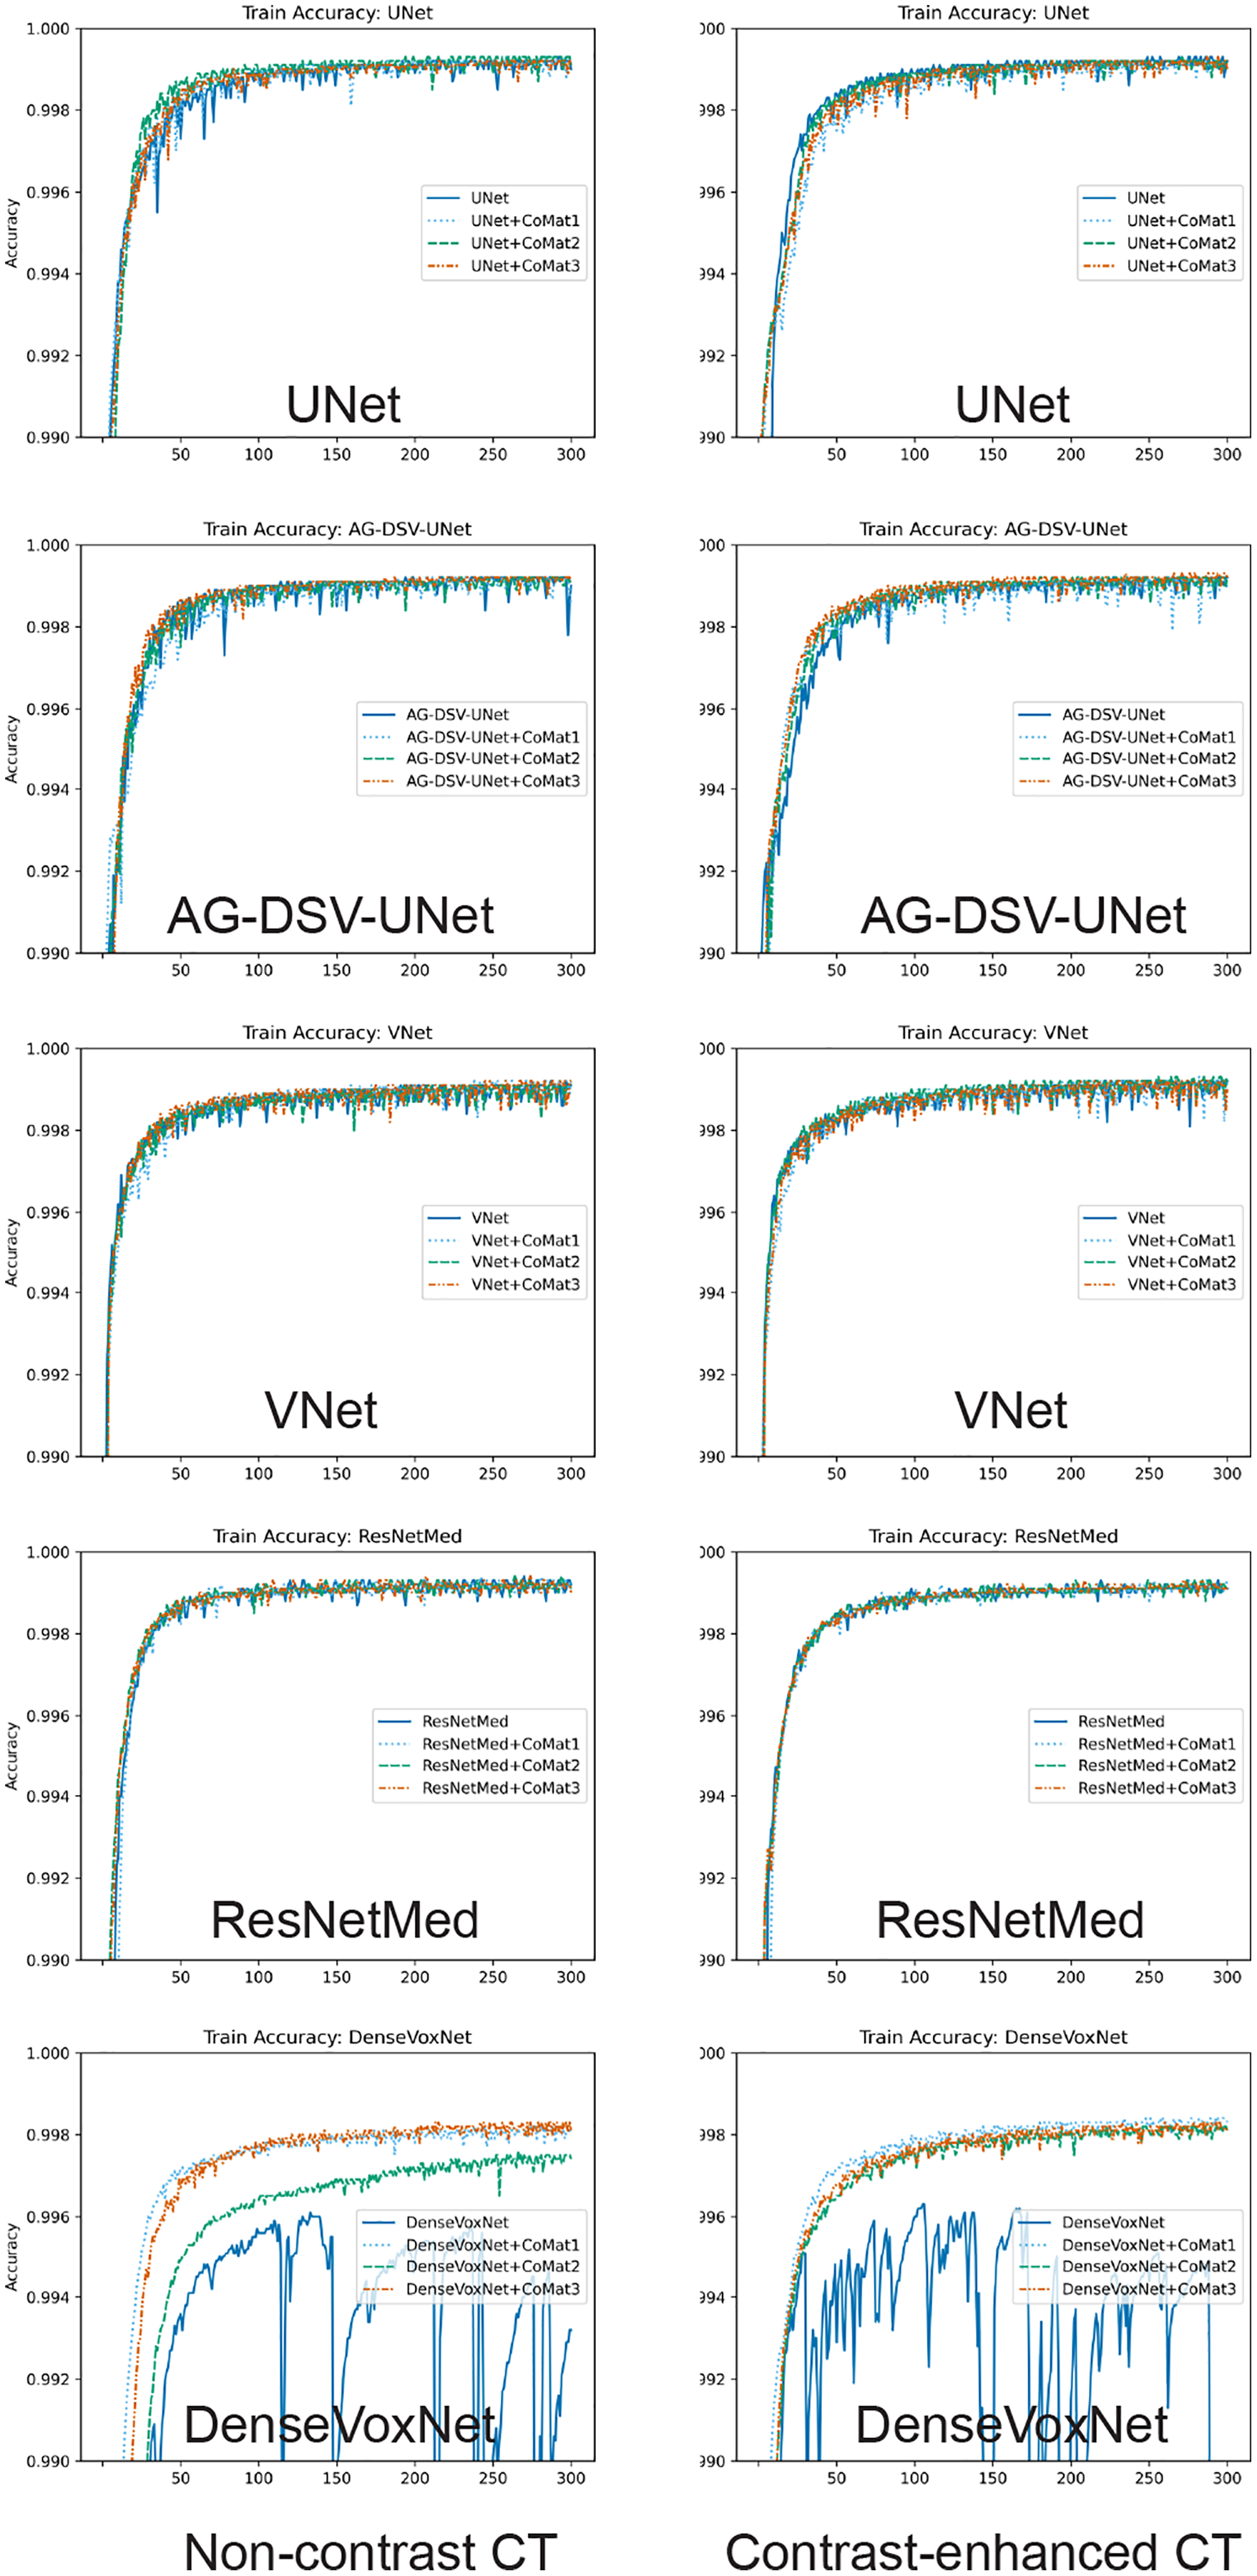
For the transfer learning approach to the post-operative EVAR, the coordinate information also improves the segmentation results on both NCCT and CECT datasets. The CECT dataset also tends to get better accuracy than the NCCT dataset. The best accuracy on NCCT and CECT datasets is achieved by UNet+CoMat2 and UNet+CoMat3 with DSC values of 94.90 ± 4.23 and 95.66 ± 2.70, respectively. The CoMat2 is the best coordinate information to improve the segmentation accuracy in all training networks of the NCCT dataset. In the NCCT dataset, the coordinate information can provide an improvement in all re-training networks except UNet+CoMat1. In the CECT dataset, coordinate information can make an improvement on only UNet, AG-DSV-UNet and DenseVoxNet. The DenseVoxNet shows also the best performance gain for all types of added coordinate information on both NCCT and CECT datasets (p = 0.00).
Discussion
CNNs have been applied to a number of medical image segmentation problems. Jackson et al. (2018) implemented a CNN for kidney segmentation in NCCT images. The NCCT is more difficult than CECT datasets because it has less contrast information in raw images. However, they reported good segmentation results with dice scores of 91% and 86% for right and left kidneys, respectively. The development of CNNs has tended to explore networks of increasing complexity, which in turn requires more data to train. Incorporation of coordinate information is an alternative approach that improves performance by providing more information for training. Recently, the incorporation of coordinate information has been proposed to improve object detection in 2D images (Liu et al., 2018; Ren & Hao, 2020). Incorporation of coordinate information has the advantage of being able to work with existing CNN models without modification to their architecture.
The coordinate information can provide more information to CNN training by adding more channels into the dataset. The coordinate or positional encoding is an interesting topic in the language processing domain that deals with order of words in the sentence. The positional encoding can be implemented by a fixed position (linear function) (Gehring et al., 2017) and relative position (sinusoidal function) (Vaswani et al., 2017). The sinusoidal function is used to deal with the problems of variable length sequences that map positions into a vector. The variable length of input data always occurs in language processing but not in image processing with fixed image size. However, the performance of these two approaches has nearly similar results (Vaswani et al., 2017). In the recent implementations of image processing, researchers still used a linear function to generate a simple index sequence of coordinate information (Liu et al., 2018; Ren & Hao, 2020). The coordinate information tends to be of more benefit on the NCCT dataset than the CECT dataset because the NCCT dataset has less contrast resolution. This additional coordinate information provides useful information for the segmentation on the NCCT dataset. The segmentation of AAA is a good problem to test the concept of incorporation of coordination information because the structure is tubular in shape and orientation is almost always along the z-axis. Because of the tubular shape of AAA and fixed size of the volume dataset, the best option of embedded coordinate information is as fixed coordinate information in a linear index sequence. Our proposed method achieves excellent results on NCCT and CECT datasets of AAA segmentation with dice scores of 96.75% and 96.69%, respectively. (Table 2, Fig. 6). The result on non-contrast AAA is slightly better than post-contrast but not statistically significant (p > 0.05). The best segmentation result on the NCCT dataset is AG-DSV-UNet+CoMat3. By integration of coordinate information (CoMat3) into the network, the accuracy almost significantly improved from AG-DSV-UNet alone (p = 0.06). On the other hand, on the CECT dataset, the best segmentation result is standard UNet with a dice score of 96.62%. The coordinate information (CoMat1) provides a little improvement on the result with a dice score of 96.69% (p = 0.38). The post-contrast AAA has an enhanced aortic lumen used to define the candidate region of AAA. However, in the case of no enhancement of aortic lumen in the non-contrast images of AAA, less information is available for training of the network.
| Network/ parameters |
Non-contrast dataset | Contrast-enhanced dataset | |||||
|---|---|---|---|---|---|---|---|
| Coordinate | DSC | JSC | HD (mm) | DSC | JSC | HD (mm) | |
| UNet | – | 95.62 ± 3.28 | 91.78 ± 5.81 | 0.26 | 96.62 ± 1.53 | 93.50 ± 2.83 | 0.07 |
| CoMat1 | 96.55 ± 2.09 | 93.40 ± 3.74 | 0.17 | 96.69 ± 1.11 | 93.62 ± 2.09 | 0.06 | |
| CoMat2 | 94.62 ± 4.87 | 90.16 ± 7.98 | 0.21 | 96.15 ± 1.98 | 92.65 ± 3.59 | 0.08 | |
| CoMat3 | 96.56 ± 2.18 | 93.44 ± 3.93 | 0.12 | 96.25 ± 2.19 | 92.86 ± 3.99 | 0.10 | |
| AG-DSV-UNet | – | 96.22 ± 2.77 | 92.85 ± 4.79 | 0.19 | 92.56 ± 6.25 | 86.72 ± 10.01 | 0.66 |
| CoMat1 | 95.66 ± 2.82 | 91.81 ± 5.04 | 0.18 | 92.11 ± 6.28 | 85.94 ± 9.82 | 0.20 | |
| CoMat2 | 96.30 ± 3.44 | 93.06 ± 5.85 | 0.33 | 93.93 ± 5.08 | 88.97 ± 8.51 | 0.23 | |
| CoMat3 | 96.75 ± 2.00 | 93.78 ± 3.61 | 0.07 | 95.83 ± 2.62 | 92.11 ± 4.70 | 0.16 | |
| VNet | – | 95.83 ± 1.73 | 92.04 ± 3.18 | 0.08 | 95.48 ± 3.99 | 91.60 ± 6.59 | 0.31 |
| CoMat1 | 95.88 ± 2.46 | 92.19 ± 4.29 | 0.09 | 95.92 ± 1.63 | 92.20 ± 2.97 | 0.08 | |
| CoMat2 | 95.46 ± 2.80 | 91.44 ± 4.87 | 0.10 | 94.53 ± 2.97 | 89.78 ± 5.21 | 0.15 | |
| CoMat3 | 95.92 ± 2.45 | 92.26 ± 4.33 | 0.12 | 96.20 ± 2.22 | 92.76 ± 3.97 | 0.17 | |
| ResNetMed | – | 93.50 ± 5.67 | 88.25 ± 8.69 | 0.32 | 92.06 ± 3.84 | 85.52 ± 6.45 | 0.27 |
| CoMat1 | 93.90 ± 4.30 | 88.79 ± 6.94 | 0.26 | 92.12 ± 3.59 | 85.59 ± 6.04 | 0.22 | |
| CoMat2 | 94.62 ± 4.87 | 90.16 ± 7.98 | 0.21 | 96.15 ± 1.98 | 92.65 ± 3.59 | 0.08 | |
| CoMat3 | 96.56 ± 2.18 | 93.44 ± 3.93 | 0.12 | 96.25 ± 2.19 | 92.86 ± 3.99 | 0.10 | |
| DenseVoxNet | – | 35.85 ± 12.16 | 22.52 ± 9.16 | 25.93 | 24.67 ± 12.75 | 14.68 ± 8.36 | 5.17 |
| CoMat1 | 89.30 ± 5.70 | 81.12 ± 8.82 | 0.71 | 87.48 ± 10.50 | 79.10 ± 14.54 | 0.45 | |
| CoMat2 | 88.48 ± 6.60 | 79.95 ± 10.25 | 1.78 | 84.49 ± 6.52 | 73.69 ± 9.58 | 5.38 | |
| CoMat3 | 85.85 ± 8.08 | 76.06 ± 12.05 | 1.55 | 78.39 ± 9.04 | 65.32 ± 11.64 | 1.04 | |
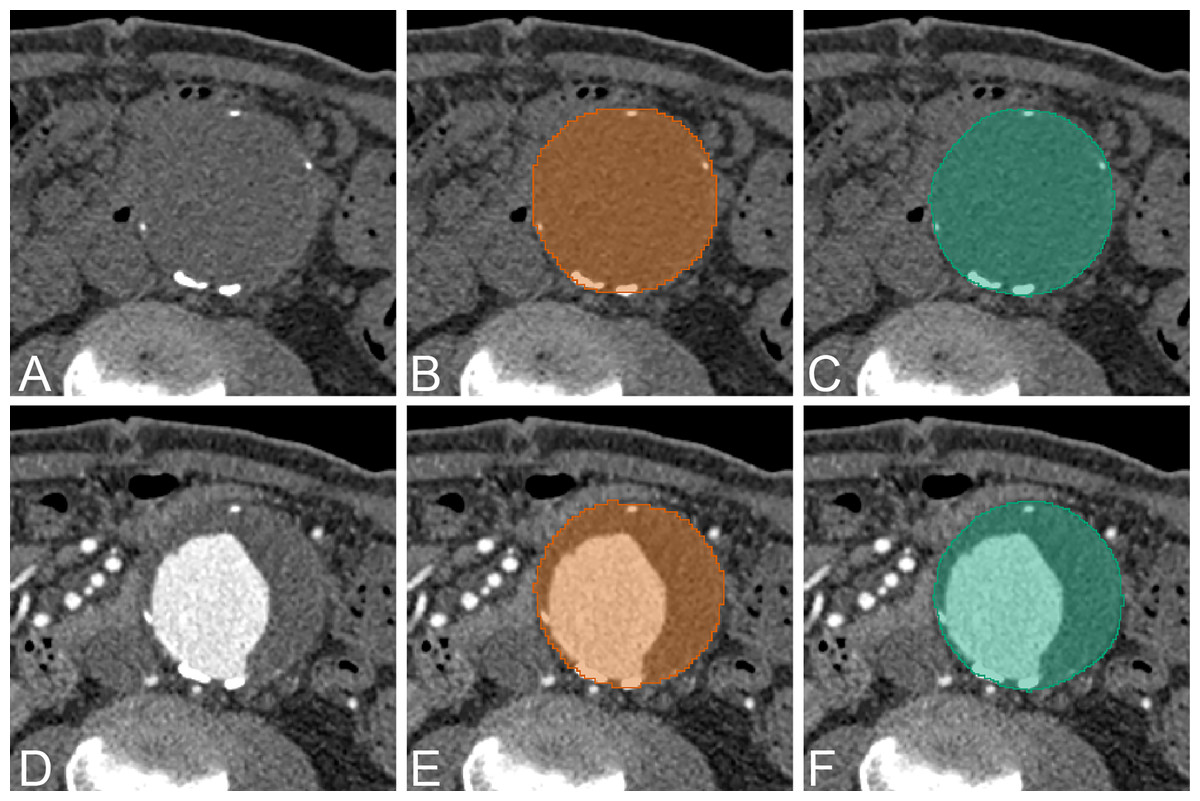
Figure 6: Example of AAA result.
An example of CNN segmentation of abdominal aortic aneurysm. The upper row is non-contrast CT images of source image (A) CNN segmentation (B) and ground-truth (C). The lower row is contrast-enhanced CT images of source image (D) CNN segmentation (E) and ground-truth (F).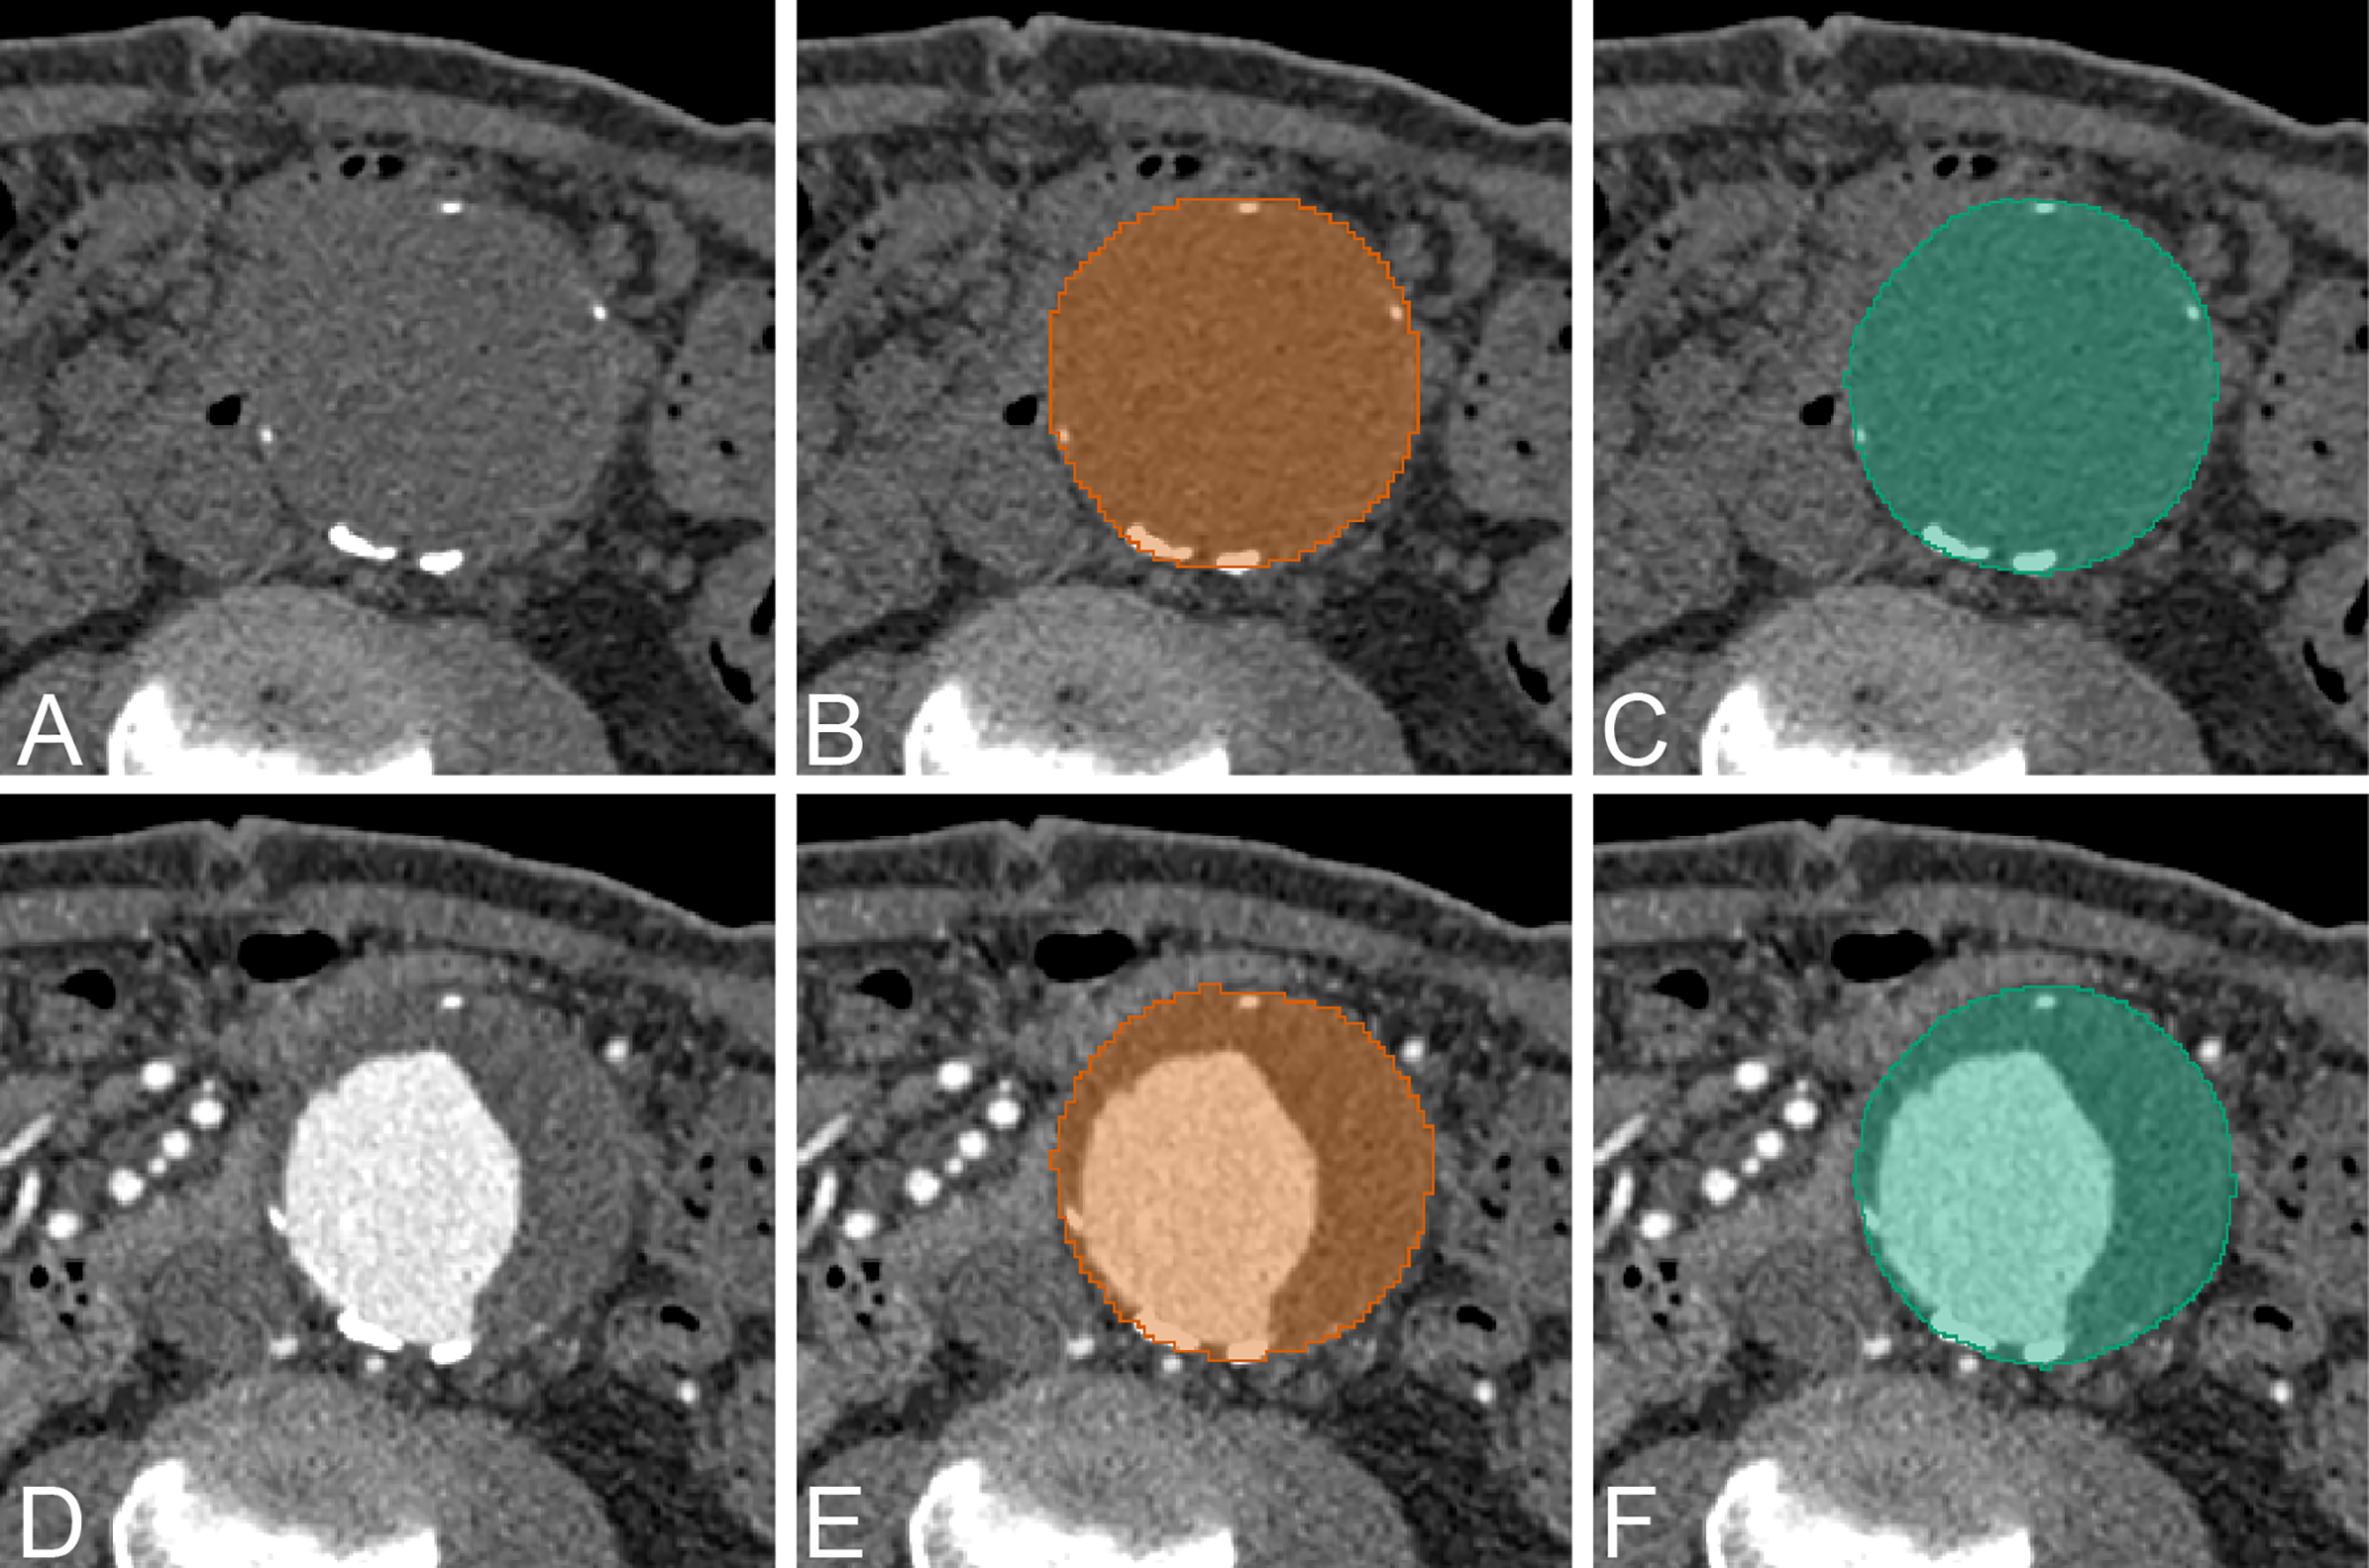
In our experiment, we demonstrate that incorporating coordinate information can generally improve the segmentation performance in a variety of network architectures such as UNet, VNet ResNet and DenseNet models. In the NCCT dataset, the segmentation performance is improved by incorporating CoMat1 and CoMat3, which have more coordinate information from all xyz-directions, whereas CoMat2 has only z-direction coordinate information. Most of the networks are best with CoMat3 but they are not significantly different from CoMat1. In the CECT dataset, most of the networks are also best with CoMat3 except UNet and DenseVoxNet. The DenseVoxNet alone provides poor performance because with only 2M parameters, it has less complexity than the other models. It could be noticed that DenseVoxNet has fewer feature maps by reducing the number of features in each layer. Incorporating coordinate information in this less complex model would be a challenging area for future research. However, the coordinate information gives maximum benefit on DenseVoxNet on all types of CoMat1 data which can give a significant improvement of performance (p = 0.00). Furthermore, the coordinate information can enhance the stability of the DenseVoxNet on both NCCT and CECT datasets during the network training, as seen by less fluctuation of training accuracy on the epoch stream (Fig. 5). The coordinate information does not only provide the benefit on a less complex model but also in an advanced model. The AG-DSV-UNet, which is an example of an advanced and complex model architecture with 104 million parameters, also gets the benefit of incorporating coordinate information on both NCCT and CECT datasets.
The coordinate information can help to eliminate false detection in low contrast resolution images (NCCT dataset). For example, in one case in the NCCT dataset (Fig. 7), the standard UNet model detects two AAAs. The left AAA is the real AAA, while the right one is a well-distended gallbladder. The distended gallbladder has a round well-defined shape similar to AAA. After applying coordinate information in the model (UNet+CoMat3) the false AAA is no longer detected.
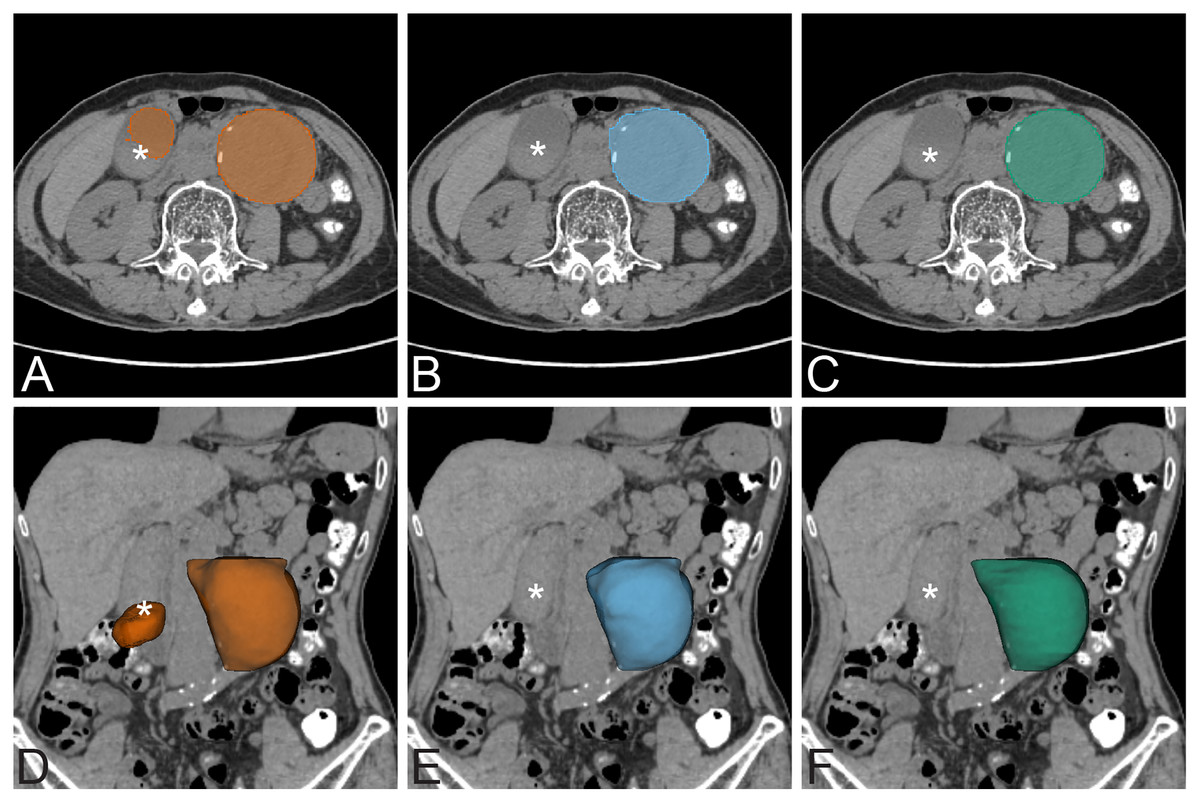
Figure 7: False positive exmaple.
False positive prediction of AAA. The left column is non-contrast AAA with standard UNet prediction on axial view (A) and 3D volume rendering on coronal view (D). There is false prediction of a second AAA on the right side of the abdomen (*) that is a well distended gallbladder. The middle column is non-contrast AAA with UNet+CoMat3 prediction on axial view (B) and 3D volume rendering (E) images on the same patient. The false prediction does not occur on UNet+CoMat3. The ground-truth is demonstrated on the right column on non-contrast axial view (C) and 3D volume rendering (F) CT images.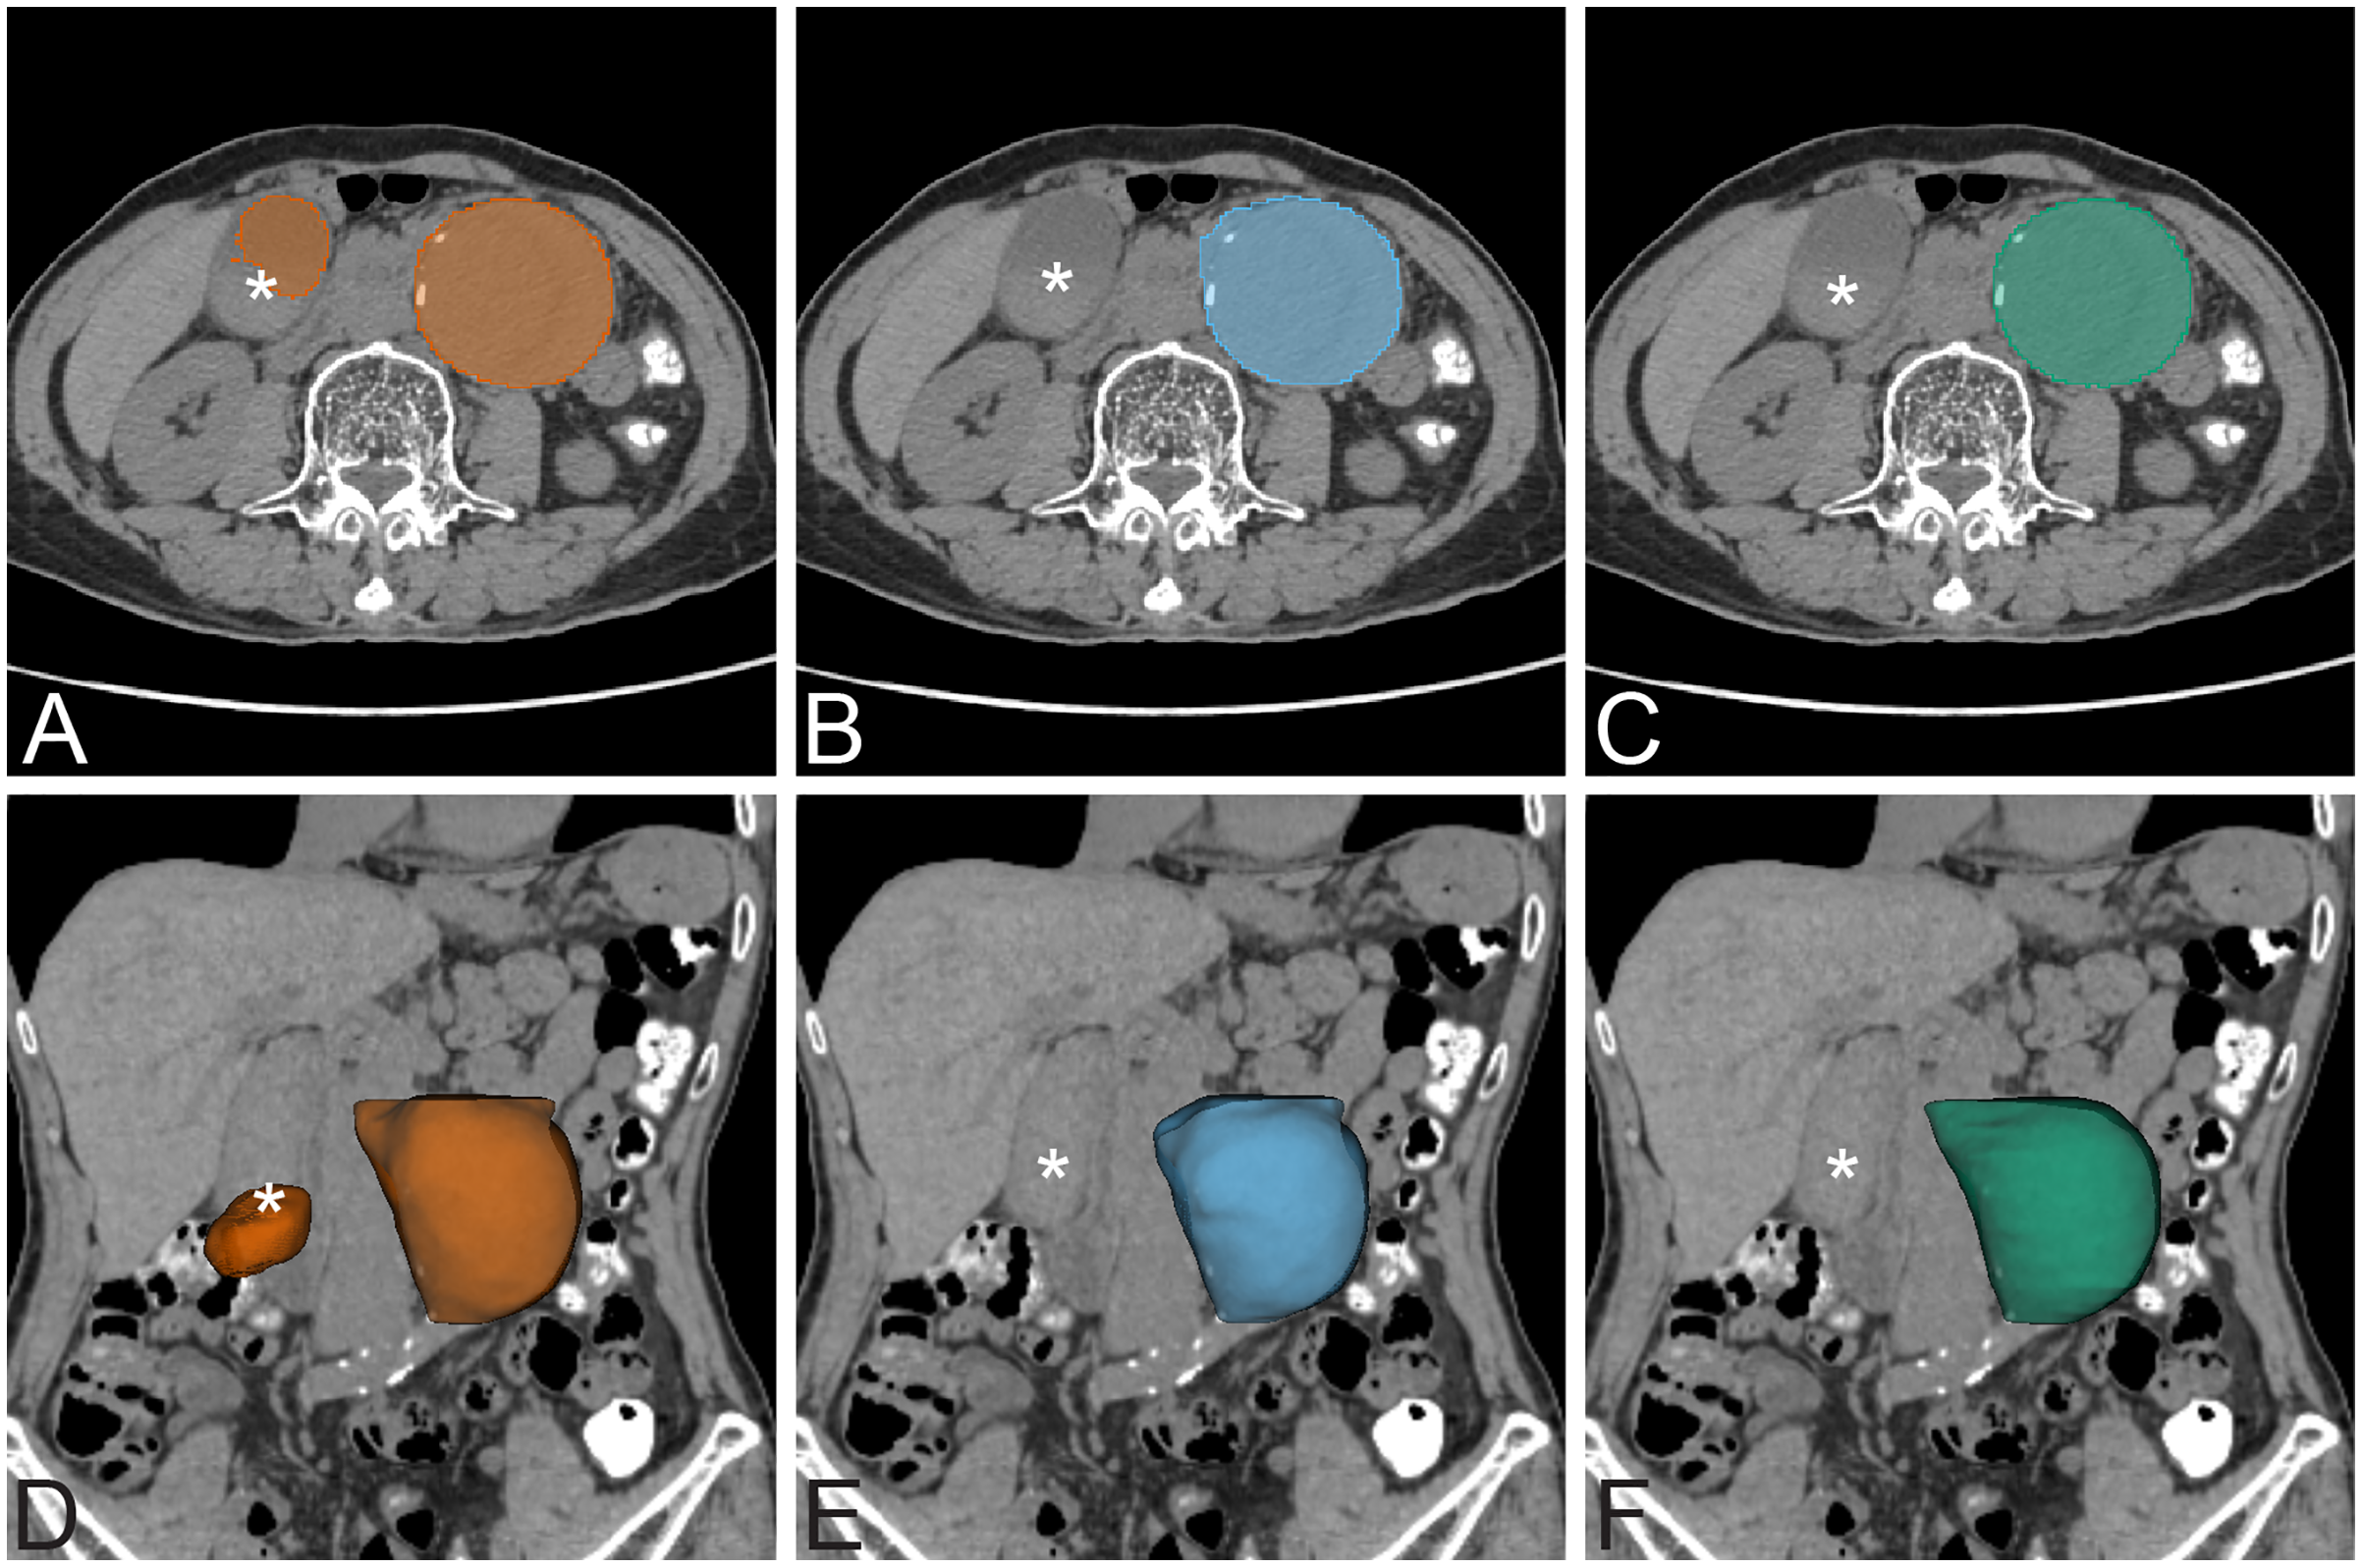
A number of previous studies have explored the use of CNNs for AAA segmentation. Lu et al. (2019) proposed a CNN for segmentation of pre-operative AAA. They modified 3D UNet combined with ellipse filling for detection and segmentation of AAA. The dataset was a mixture of non-contrast, contrast-enhanced, normal diameter aorta, and presence of AAA. The training dataset was 321 CT examinations (non-contrast 168 and contrast-enhanced 153; 247 with AAA and 74 without AAA). They used 5-fold cross-validation for CNN training, with 64 cases in each fold. The labeled ground-truth dataset was annotated by multiple annotators. The test was evaluated in terms of the maximum diameter of the aorta with an average dice score of 91%. In our experiment, we used a larger amount of training data in separate non-contrast and contrast-enhanced datasets with presence of AAA. Normal diameter of aorta less than 3.0 cm was excluded from our experiment. No additional augmentation or cross validation technique was used during the CNN training process. The cross validation technique is often used for model testing in the case of limited sample size (Krstajic et al., 2014). Dziubich et al. (2020) proposed a CNN-based approach to AAA segmentation using 3D UNet, ResNet and VBNet. The training set was 8,126 images from 16 scans. The experiment gave the best result of DSC 94%. In contrast, our model incorporating coordinate information achieves a dice score accuracy of over 96%.
Previous studies have also explored non-deep learning approaches to AAA segmentation. Wang et al. (2017) proposed registration-based geodesic active contour to segmentation of the outer wall of AAA in MRI images. The experimental result showed an average DSC of 89.79%. Of particular note is a graph-cut based method that achieves strong results by iteratively interleaving intensity-based (GCPDF) and contour-based (GCBAC) segmentation (Siriapisith, Kusakunniran & Haddawy, 2019). The algorithm is designed for contrast-enhanced CT images. The accuracies of that graph-cut approach and this proposed CNN based method have dice scores of 95.04% and 96.69%, respectively. The result of our 3D CNN based method is slightly higher than the graph-cut but not significantly so (p > 0.05). However, the 3D CNN based method has the limitation of matrix size of the dataset. In this experiment, the maximum allowed size of the dataset is 64 slices in the z-axis of the training dataset. The previous implementation of graph-cut has less limitation of dataset allowing 150–200 slices of dataset. In the CNN approach, the size of the dataset can be doubled or tripled by adding more slices of labeled ground-truth to use in the CNN training.
The AAA segmentation in post-operative stent graft images is challenging because of the existing metallic artifact of the device. López-Linares et al. (2018) proposed a fully automatic approach to AAA segmentation of post-operative CTA images based on DCNN. The proposed method has two steps. The first step uses the DCNN network to define the candidate region of the thrombus. The second step is fine-tuned segmentation of the thrombus. The models were tested with 13 post-operative AAA cases. The method achieved a dice score of 82%. The segmentation result on NCCT and CECT datasets of post-operative EVAR achieves excellent results with the dice scores of 94.90% and 95.66%, respectively (Table 3, Fig. 8). The best network for NCCT and CECT datasets of post-operative EVAR is standard UNet+CoMat2 and standard UNet+CoMat3, respectively.
| Network/ parameters |
Non-contrast EVAR | Contrast-enhanced EVAR | |||||
|---|---|---|---|---|---|---|---|
| Coordinate | DSC | JSC | HD (mm) | DSC | JSC | HD (mm) | |
| UNet | – | 94.29 ± 7.69 | 90.02 ± 11.38 | 0.23 | 95.65 ± 3.84 | 91.90 ± 6.53 | 0.23 |
| CoMat1 | 92.32 ± 12.14 | 87.49 ± 15.67 | 0.38 | 94.50 ± 4.69 | 89.92 ± 7.85 | 0.16 | |
| CoMat2 | 94.90 ± 4.23 | 90.59 ± 7.22 | 0.21 | 86.97 ± 14.08 | 79.20 ± 18.16 | 0.81 | |
| CoMat3 | 94.54 ± 8.26 | 90.55 ± 11.50 | 0.43 | 95.66 ± 2.70 | 91.81 ± 4.84 | 0.40 | |
| AG-DSV-UNet | – | 91.01 ± 13.31 | 85.57 ± 17.08 | 0.57 | 85.57 ± 10.54 | 76.14 ± 14.99 | 0.76 |
| CoMat1 | 93.14 ± 11.59 | 88.74 ± 14.66 | 0.57 | 93.73 ± 9.16 | 89.30 ± 12.78 | 0.33 | |
| CoMat2 | 93.52 ± 10.81 | 89.25 ± 14.03 | 0.43 | 95.34 ± 4.49 | 91.41 ± 7.46 | 0.14 | |
| CoMat3 | 92.29 ± 11.11 | 87.21 ± 14.92 | 0.41 | 94.09 ± 7.16 | 89.56 ± 10.77 | 0.73 | |
| VNet | – | 85.99 ± 23.58 | 80.55 ± 25.03 | 1.34 | 94.85 ± 4.50 | 90.52 ± 7.54 | 0.57 |
| CoMat1 | 91.38 ± 14.04 | 86.32 ± 17.03 | 0.91 | 94.64 ± 7.00 | 90.54 ± 10.62 | 0.77 | |
| CoMat2 | 94.06 ± 7.47 | 89.58 ± 11.28 | 0.33 | 92.90 ± 10.12 | 88.09 ± 14.30 | 1.24 | |
| CoMat3 | 93.23 ± 12.32 | 89.05 ± 15.08 | 1.34 | 92.82 ± 10.62 | 880.7 ± 14.85 | 1.82 | |
| ResNetMed | – | 81.80 ± 15.52 | 71.68 ± 19.09 | 2.41 | 88.13 ± 13.94 | 80.78 ± 16.30 | 0.98 |
| CoMat1 | 82.43 ± 15.55 | 72.68 ± 19.53 | 0.85 | 86.80 ± 9.51 | 77.81 ± 13.57 | 0.56 | |
| CoMat2 | 88.29 ± 11.14 | 80.52 ± 14.98 | 0.58 | 87.50 ± 12.15 | 79.40 ± 15.23 | 1.69 | |
| CoMat3 | 83.18 ± 18.54 | 74.76 ± 22.55 | 2.21 | 85.81 ± 12.35 | 76.70 ± 14.55 | 1.19 | |
| DenseVoxNet | – | 40.63 ± 14.34 | 26.58 ± 12.15 | 27.55 | 27.88 ± 14.01 | 17.04 ± 10.44 | 4.67 |
| CoMat1 | 87.07 ± 13.21 | 79.03 ± 16.66 | 2.04 | 87.95 ± 10.46 | 79.88 ± 14.93 | 1.10 | |
| CoMat2 | 88.91 ± 12.84 | 81.98 ± 16.93 | 2.72 | 72.02 ± 18.79 | 59.42 ± 21.65 | 12.68 | |
| CoMat3 | 89.47 ± 14.48 | 83.40 ± 18.84 | 2.39 | 85.53 ± 10.25 | 76.01 ± 14.41 | 2.05 | |
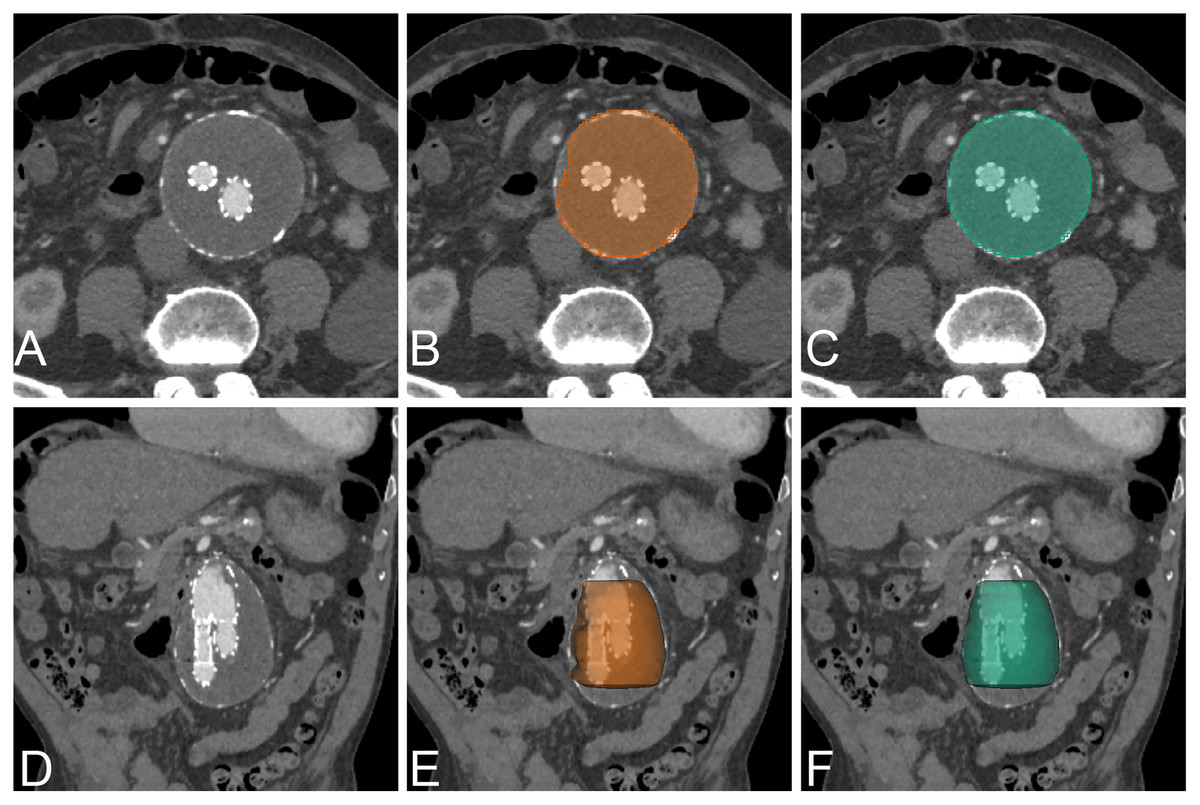
Figure 8: Example of post EVAR.
An example of CNN segmentation of post-operative EVAR of AAA, visualized on axial and 3D volume rendering. The upper row is post-contrast axial CT images of source image (A) CNN segmentation (B) and ground-truth (C). The lower row is post-contrast coronal reformatted CT image of source image (D) coronal reformatted CT image with 3D volume rendering of CNN segmentation (E) and ground-truth (F).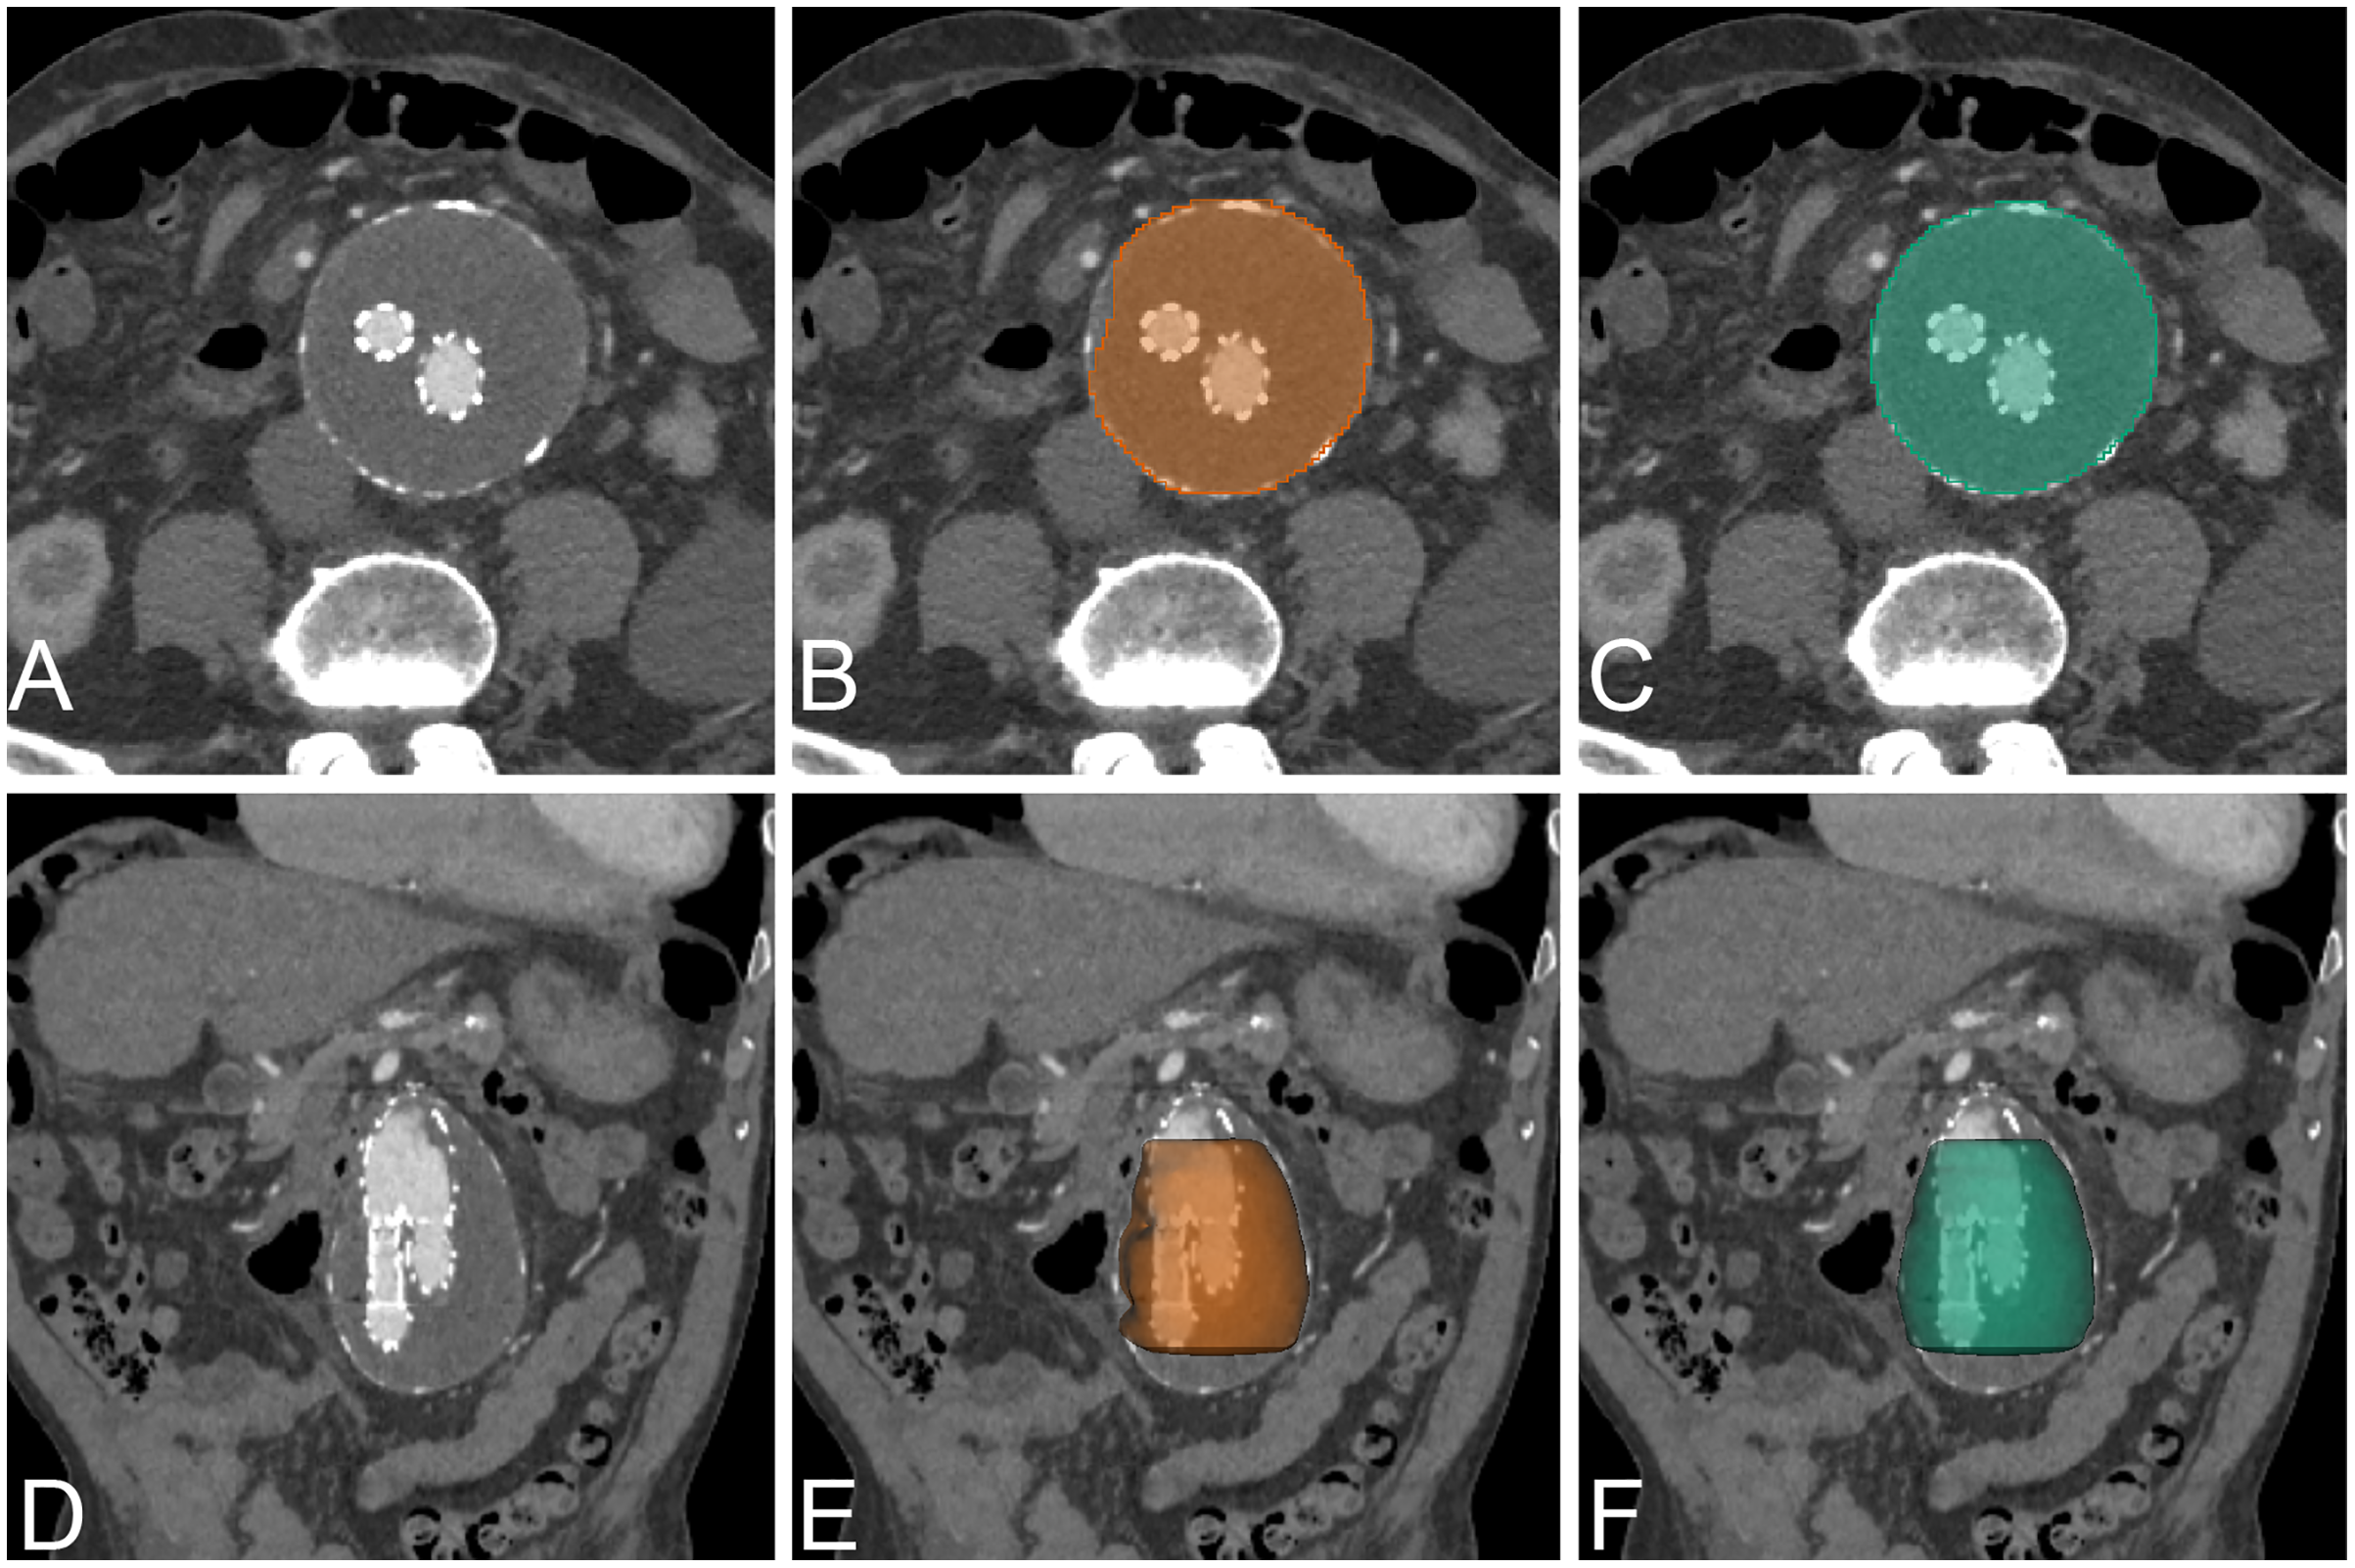
In our proposed approach, the post-operative EVAR has slightly worse results than pre-operative results because of the presence of metallic stent graft and smaller size of aortic lumen as compared with pre-operative. Our result showed that a transfer learning approach with a small amount of training data is sufficient to provide good segmentation results. The benefit of transfer learning is that small amounts of data to train still provide excellent results. In the NCCT dataset of post-operative EVAR, all of the networks are best with CoMat2 but there is no significant difference from other types of coordinate information. The reason is that metallic stent-graft (high pixel intensity) can enhance contrast resolution in the center of the AAA lumen, in which CoMat2 has enough information to enhance the performance. In the CECT dataset, the coordinate information provides benefit only for AG-DSV-UNet and DenseVoxNet. The contrast and metallic stent in the lumen of AAA should be strong coordinate information for training the models. Furthermore, all types of coordinate information also significantly improved the performance with the DenseVoxNet network (p = 0.00) on both NCCT and CECT similar to pre-operative dataset.
The major limitation of the CNN-based approach is the matrix size of the dataset. In this implementation, the maximum allowed size of the CT dataset due to limited GPU memory is 64 slices in the z-axis and 256 × 256 in the transverse plane. The original 512 × 512 matrix of the CT image was thus scaled down to 256 × 256. Future development of GPUs with increased size of memory will enable using the original matrix size and longer slices of the training dataset. An alternative approach to this problem is to separate the volume into multiple patches such as 256 × 256 × 32 pixels to maintain the original resolution of the dataset volume. However, because of the difference in patient body size and variation of the aorta, the aorta may get distributed among different patches, resulting in a decrease in accuracy of segmentation at the edges of adjacent patches. In addition, the multiple patches also require post-processing steps.
Conclusions
This article has introduced a CNN-based approach for AAA segmentation with incorporated coordinate information. It was shown that the proposed solution using 3D CNN can be effectively applied for segmenting AAA in both NCCT and CECT preoperative datasets. No data augmentation or pre-processing was required in our proposed method. The best networks for pre-operative NCCT and CECT datasets are AG-DSV-UNet+CoMat3 and standard UNet+CoMat1, respectively. Our model can be effectively transferred to the post-operative EVAR dataset with high accuracy. The best networks for post-operative NCCT and CECT datasets are standard UNet+CoMat2 and standard UNet+CoMat3, respectively. The incorporated coordinate information demonstrates the non-dependent improvement of performance in AAA segmentation on a variety of CNN networks. A further extension of this research can be carried forward by extending the segmentation algorithm to cover the entire aorta. Future research could examine advanced encoding methods for incorporating coordinate information to improve performance in the image processing domain. The segmentation result could be reliable for volumetric assessment for further clinical research. We believe that this CNN approach with incorporated coordinate information also has a potential to solve difficult segmentation problems in the other grayscale medical images.