

Uncovering the natural variability of araucariacean exudates from ex situ and in situ tree populations in New Caledonia using FTIR spectroscopy
- Published
- Accepted
- Received
- Academic Editor
- Debabrata Goswami
- Subject Areas
- Analytical Chemistry (other), Infrared Spectroscopy, Spectroscopic Analysis
- Keywords
- Agathis, Amber, Araucariaceae, Araucaria, Gum, Gum resin, Resin, New Caledonia, FTIR-ATR
- Copyright
- © 2022 Seyfullah et al.
- Licence
- This is an open access article distributed under the terms of the Creative Commons Attribution License, which permits unrestricted use, distribution, reproduction and adaptation in any medium and for any purpose provided that it is properly attributed. For attribution, the original author(s), title, publication source (PeerJ Analytical Chemistry) and either DOI or URL of the article must be cited.
- Cite this article
- 2022. Uncovering the natural variability of araucariacean exudates from ex situ and in situ tree populations in New Caledonia using FTIR spectroscopy. PeerJ Analytical Chemistry 4:e17 https://doi.org/10.7717/peerj-achem.17
Abstract
Background
Understanding the natural variability of plant resins is crucial for evaluating the chemical information stored in ambers that may support inferring palaeoenvironmental conditions. However, even among extant resin-producing plants, the variation of resinous exudates within and between tree genera and species is still poorly understood.
Methods
We analysed plant exudates from across the Araucariaceae in New Caledonia using Fourier-transform infrared spectroscopy in attenuated total reflection mode (FTIR-ATR). Both, wild (in situ) and arboretum grown (ex situ) populations were used to uncover the effects of intergeneric, inter- and intraspecific variation of the araucariacean plants on the resin chemistry.
Results
We show that even resins from the same species in the same habitat do have natural (intraspecific) chemical variation. Some of the variation can result from the degree of resin polymerisation, but this is not the only source of variation. Wild sourced resins have greater natural intraspecific chemical variation than the arboretum sourced ones. Interspecific and intergeneric differences were not easy to distinguish in the resins sampled. This has strong implications for the evaluation of the chemical information from worldwide ambers: multiple samples should be analysed to give a more accurate picture of the natural chemical variation present and how this may or may not overlap with the chemistries of other resin types. Additionally we discovered that the Araucariacean species can produce up to three distinct types of exudate (gum, resin, and gum resin). This is the first time that gum resins have been identified and characterized with FTIR-ATR. We also provide a guide on how to distinguish the exudate types when using FTIR-ATR.
Introduction
The New Caledonian archipelago is situated in the Coral Sea about 1,500 km east of Australia, and is considered a global biodiversity hotspot (Myers et al., 2000). It has the highest ‘endemism richness’ (a measure of both species endemism and species richness) for vascular plants in the world (Kier et al., 2009). Its diverse flora is considered outstanding for both angiosperms and conifers (Heads, 2019). For conifers, New Caledonia is the most diverse place on earth with four families spread across 14 genera and 44 species (Farjon & Filer, 2013; Mill et al., 2017; Earle, 2021). It is the world centre of diversity for the genus Araucaria Juss. (Araucariaceae) (Farjon & Filer, 2013), with 13 of a total of 20 species present, and the genus Agathis Salisb. (Araucariaceae) is represented by five of 17 species (Earle, 2021).
Some of the Araucariaceae are highly resinous today, and so can be used as a model for understanding the genesis of conifer-derived ambers. Ambers are fossilised plant resins, which were originally viscous liquid exudates that hardened through polymerisation, and then underwent maturation after burial in sediments (Ragazzi & Schmidt, 2011). Besides the extensive investigation of biological inclusions inside different ambers, there is growing interest in the chemical information stored in ambers such as carbon isotopes that have been used to infer palaeoenvironmental conditions of the source plants (e.g., Nissenbaum, Yakir & Langenheim, 2005; Gaigalas & Halas, 2009; McKellar et al., 2011; Aquilina et al., 2013), although care is needed in the interpretation of these data (Dal Corso et al., 2017). Alternatively, identifying biomarkers to indicate the source plant has had some important successes e.g., Otto et al., 2002; Yamamoto et al., 2006; Pereira et al., 2009; McCoy et al., 2017; Seyfullah et al., 2020, although not all amber source plants for the major deposits have been identified yet (see Seyfullah et al., 2018). The majority of New Zealand and some Australian ambers is thought to have derived from Agathis (Thomas, 1969; Anderson, Winans & Botto, 1992; Lambert et al., 1993; Lyons, Masterlerz & Orem, 2009; Seyfullah, Sadowski & Schmidt, 2015).
What is not yet clear is the extent of natural variability in resin chemistry within a species (intraspecific variation) and between different species within a genus (interspecific variation), and how this could affect interpretations of amber chemistry. Tappert et al. (2011) showed that infraspecific variability (specific variability at a level below that of a species, e.g., subspecies, variety) in a sample of conifer resins was low when analysed using spectroscopy, meaning that it could be possible to identify different species, despite quite different local ecological conditions from the analysis of the resin or amber. However, recent work shows that under experimental conditions resin chemistry variability reflects genetic variability in the source plant, and that this is not currently taken in to account when resins and ambers are analysed as the sample sizes are too small to encompass all the variation (Seyfullah et al., 2021).
There are different solid state spectroscopic methods available to analyze the bulk chemistry of resins and ambers such as Raman (e.g., Edwards, Farwell & Villar, 2007; Lozano et al., 2020), 13C nuclear magnetic resonance (13C NMR, e.g., Lambert et al., 1999; Martinez-Richa et al., 2000) and infrared (IR, e.g., Beck, Wilbur & Meret, 1964; Kosmowska-Ceranowicz & Vávra, 2015) and Fourier transform infrared (FTIR spectroscopy, Wolfe et al., 2009). FTIR spectroscopy was used as this method requires minimal sample amounts and preparation, and is regularly used to profile ambers and resins (e.g., Seyfullah, Sadowski & Schmidt, 2015; Tappert et al., 2011; Wolfe et al., 2009; Wolfe et al., 2016).
Here we use a set of analyses on exudates collected from ex situ and in situ stands of araucariacean trees in New Caledonia (Fig. 1A) to uncover the natural variability of araucariacean exudates. These exudates were collected from two sources, either mature planted plots consisting of individual araucariacean species of the same age grown together at the Ouénarou Arboretum (ex situ exudates, Figs. 1–2), or from wild growing trees from different habitats on Grande Terre (in situ exudates, Figs. 1A, 3), the main island of New Caledonia. The ex situ samples from the arboretum allowed us a unique opportunity to examine any potential taxonomic differences among the exudates from different species across two Araucariacean genera, as the trees were planted at the same time in the early 1980s and are exposed to the same environment. We could then compare these samples to exudates from in situ wild stands to understand the potential effect of differing environments on the exudates from same taxa. The Araucariaceae have some highly resinous taxa today and are thought to be an amber source plant family, making them of interest in resin and amber studies. We examined and identified the types of exudates produced using FTIR-ATR spectroscopy, and examined the effects of intraspecific and interspecific variability on the resins.
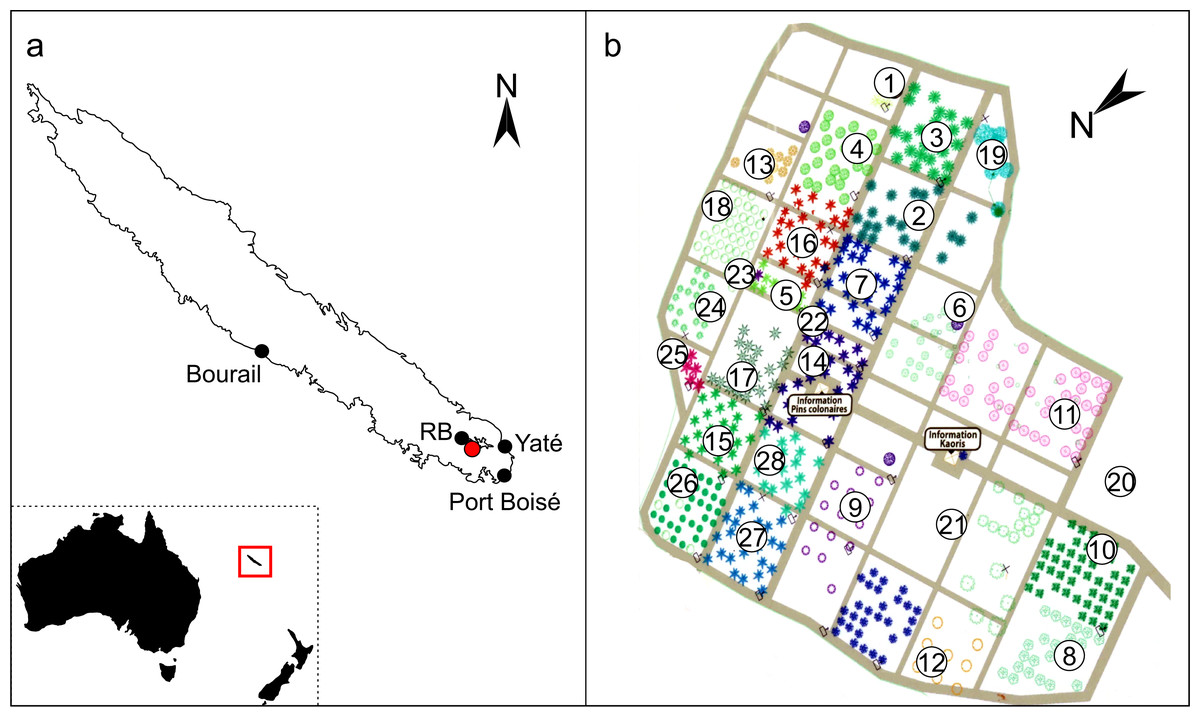
Figure 1: Locations of the Araucariaceae sampled for exudates in New Caledonia.
(A) Inset map indicates the relative location of New Caledonia to Australia and New Zealand in the Coral Sea, the red box is expanded in the main image to show the main island Grande Terre in the New Caledonian archipelago. Red dot indicates the Ouénarou Arboretum where the ex situ resins were sourced, black dots indicate the four localities where wild-collected resins were sourced, RB = Parc Provincial de la Rivière Bleue. (B) Plan of the Ouénarou Arboretum close to Parc Provincial de la Rivière Bleue (entrance adapted from the arboretum, Province Sud) showing the different blocks of species grown 1: Montrouziera, 2: Ar. scopulorum, 3: Ar. cunninghamii, 4: Ar. bidwillii, 5: Ar. subulata, 6: Alpitonia, 7: Ar. nemorosa, 8: Eleocarpus, 9: Hernandia, 10: Arillastrum, 11: Santalum, 12: Ag. montana, 13: Ag. macrophylla, 14: Ar. heterophylla, 15: Ar. luxurians, 16: Ar. columnaris, 17. Ar. muelleri, 18: Ag. lanceolata, 19: Frangraea, 20: Ag. macrophylla (planted as Ag. obtusa), 21: Acacia, 22: Ar. bernieri, 23: Dacrydium, 24: Ag. corbassonii, 25: Ar. laubenfelsii, 26: Ag. ovata, 27: Ar. montana, 28: Ar. rulei.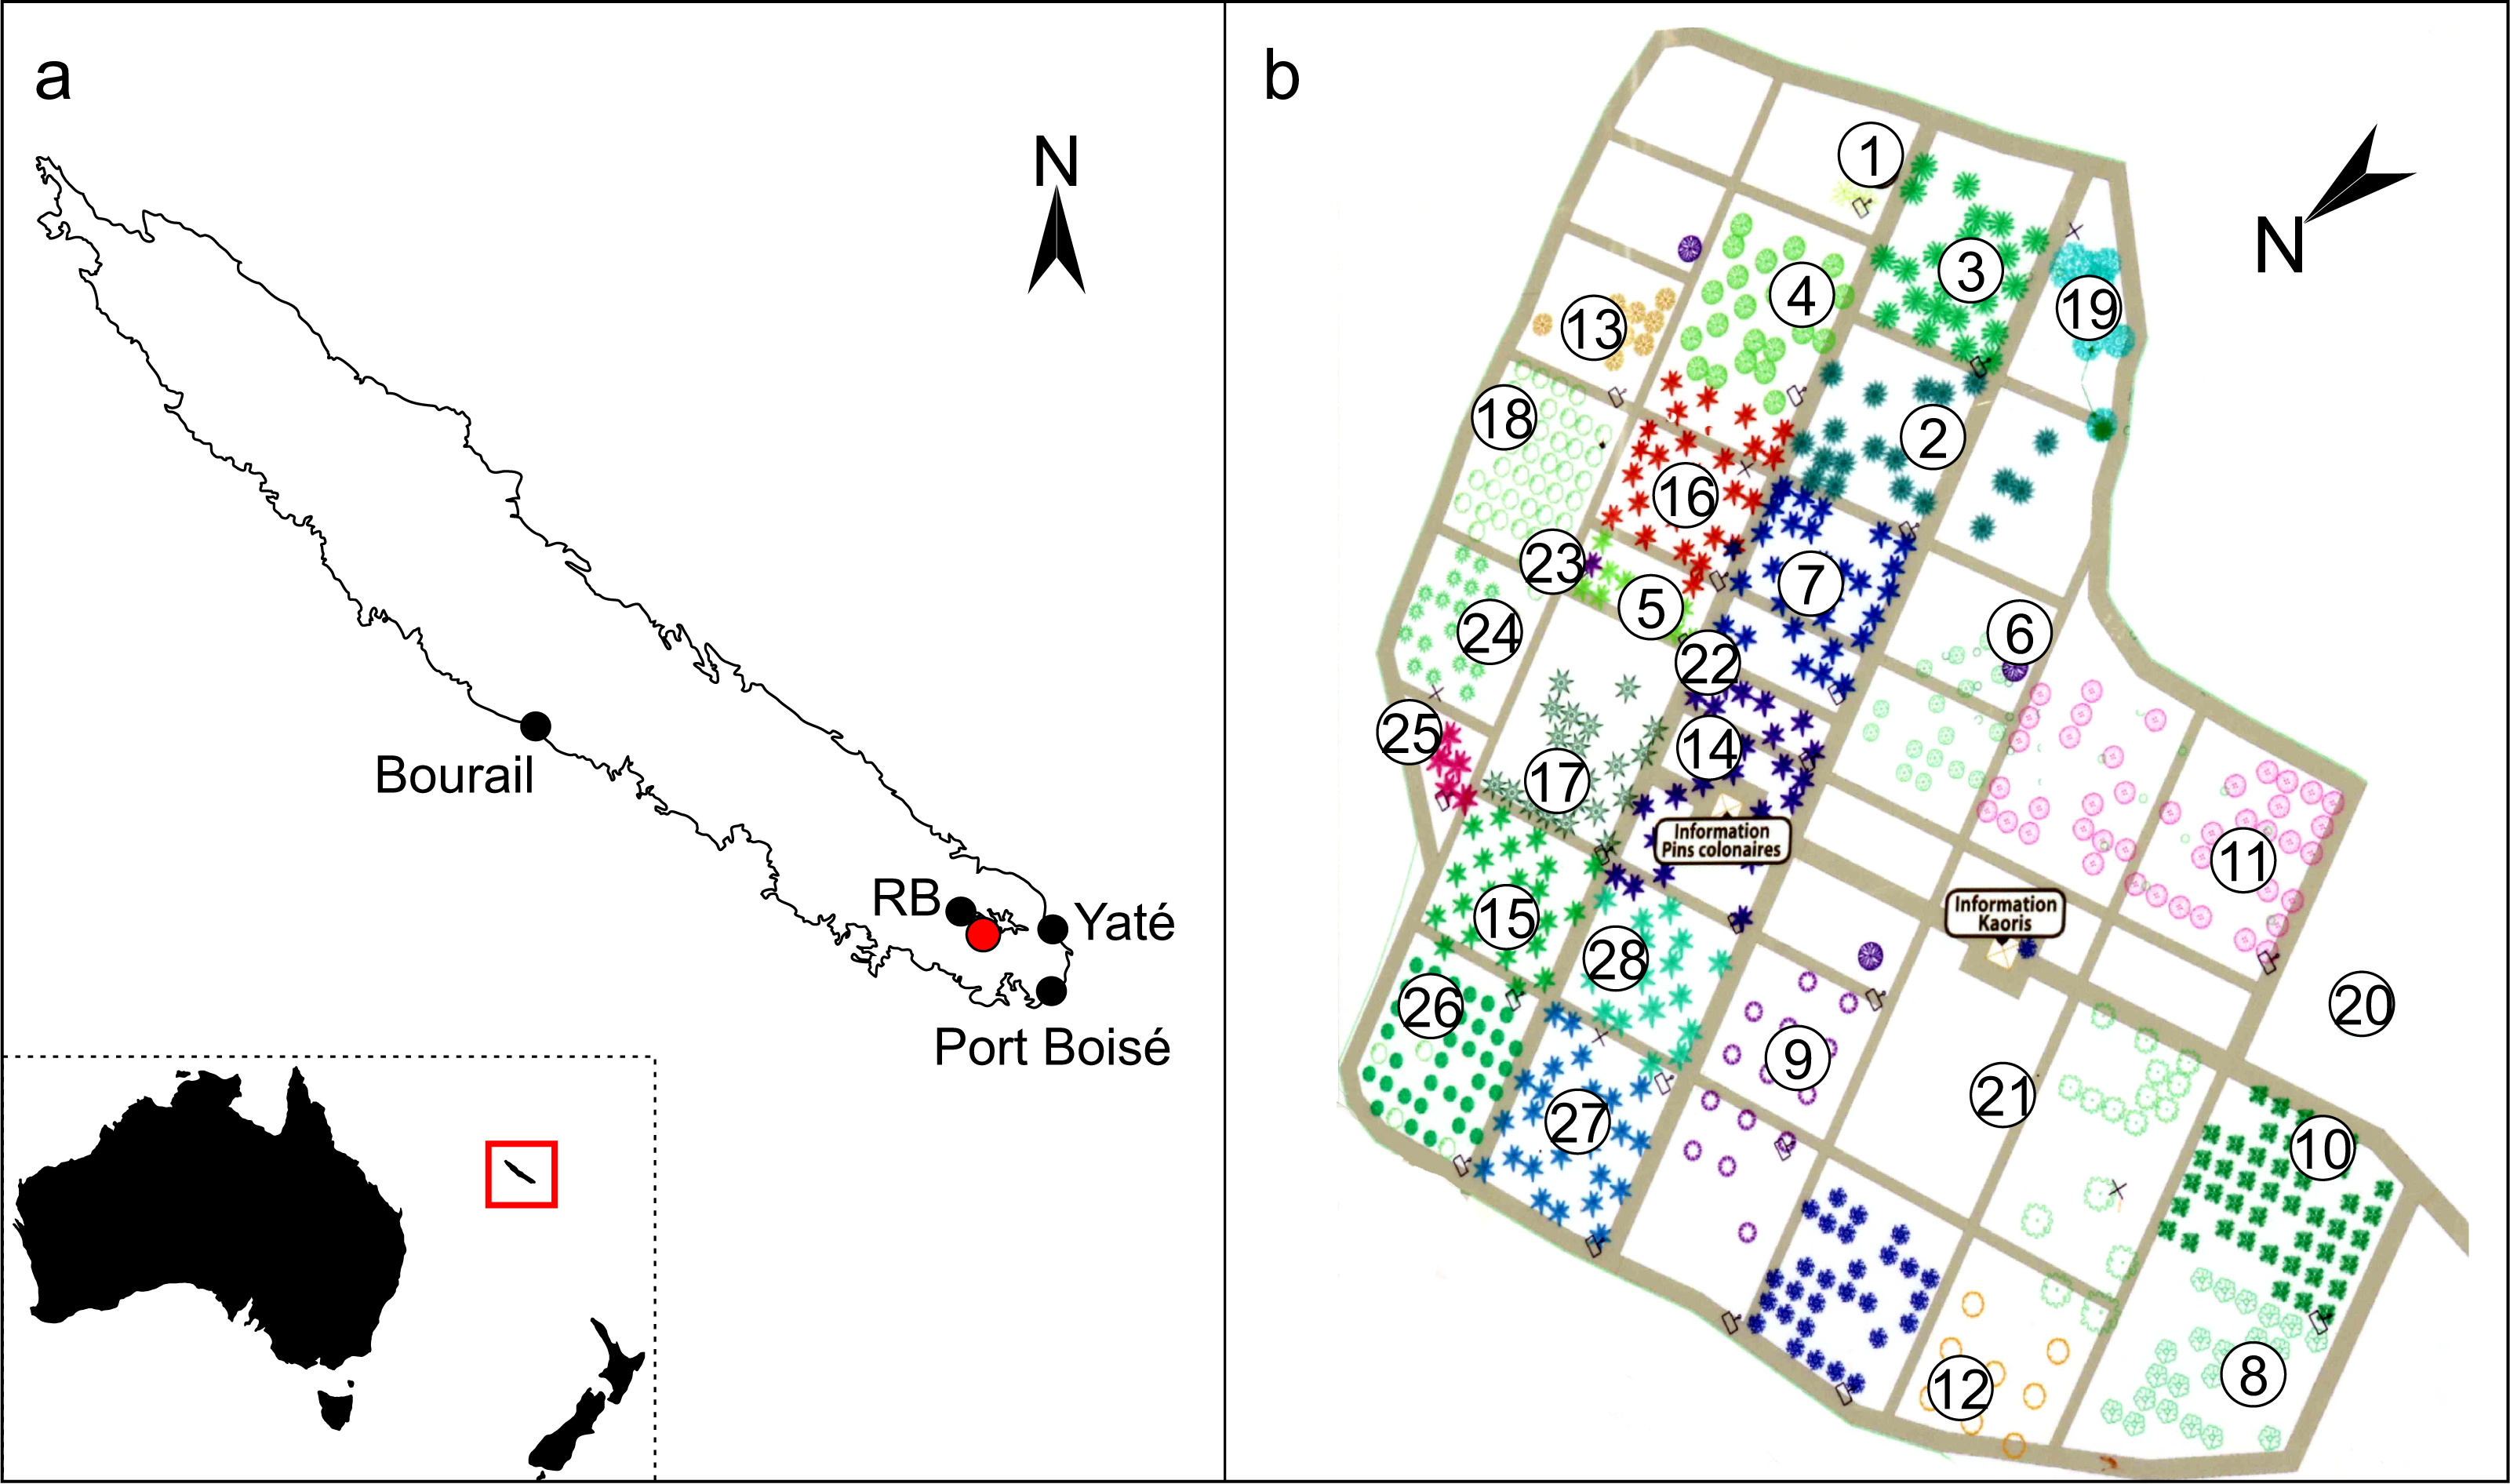
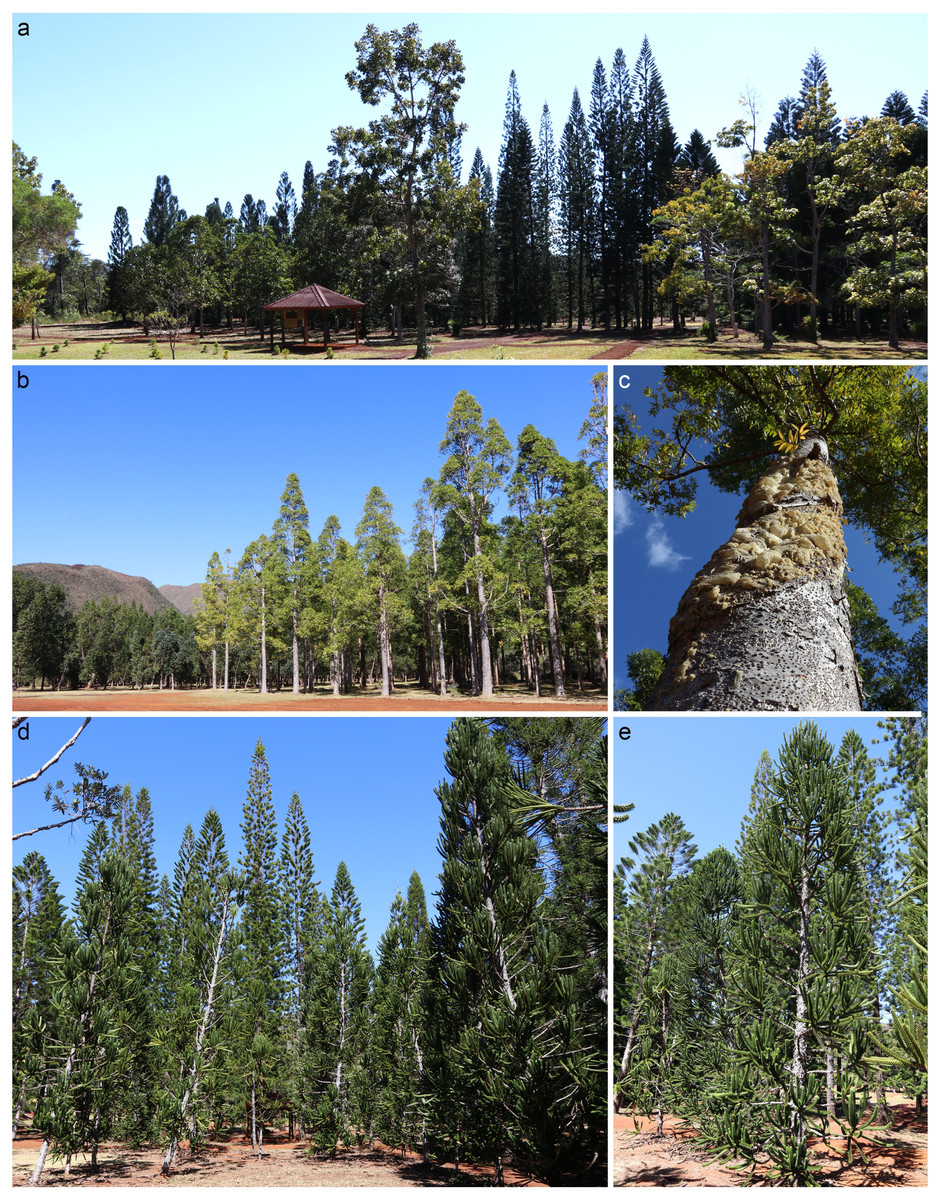
Figure 2: Araucariacean trees planted at the Ouénarou Arboretum in the 1980s.
(A) Plots with different Agathis and Araucaria species. (B) Agathis moorei. (C) Agathis moorei with massive exudate production. (D) Araucaria laubenfelsii. (E) Araucaria muelleri. September 2016.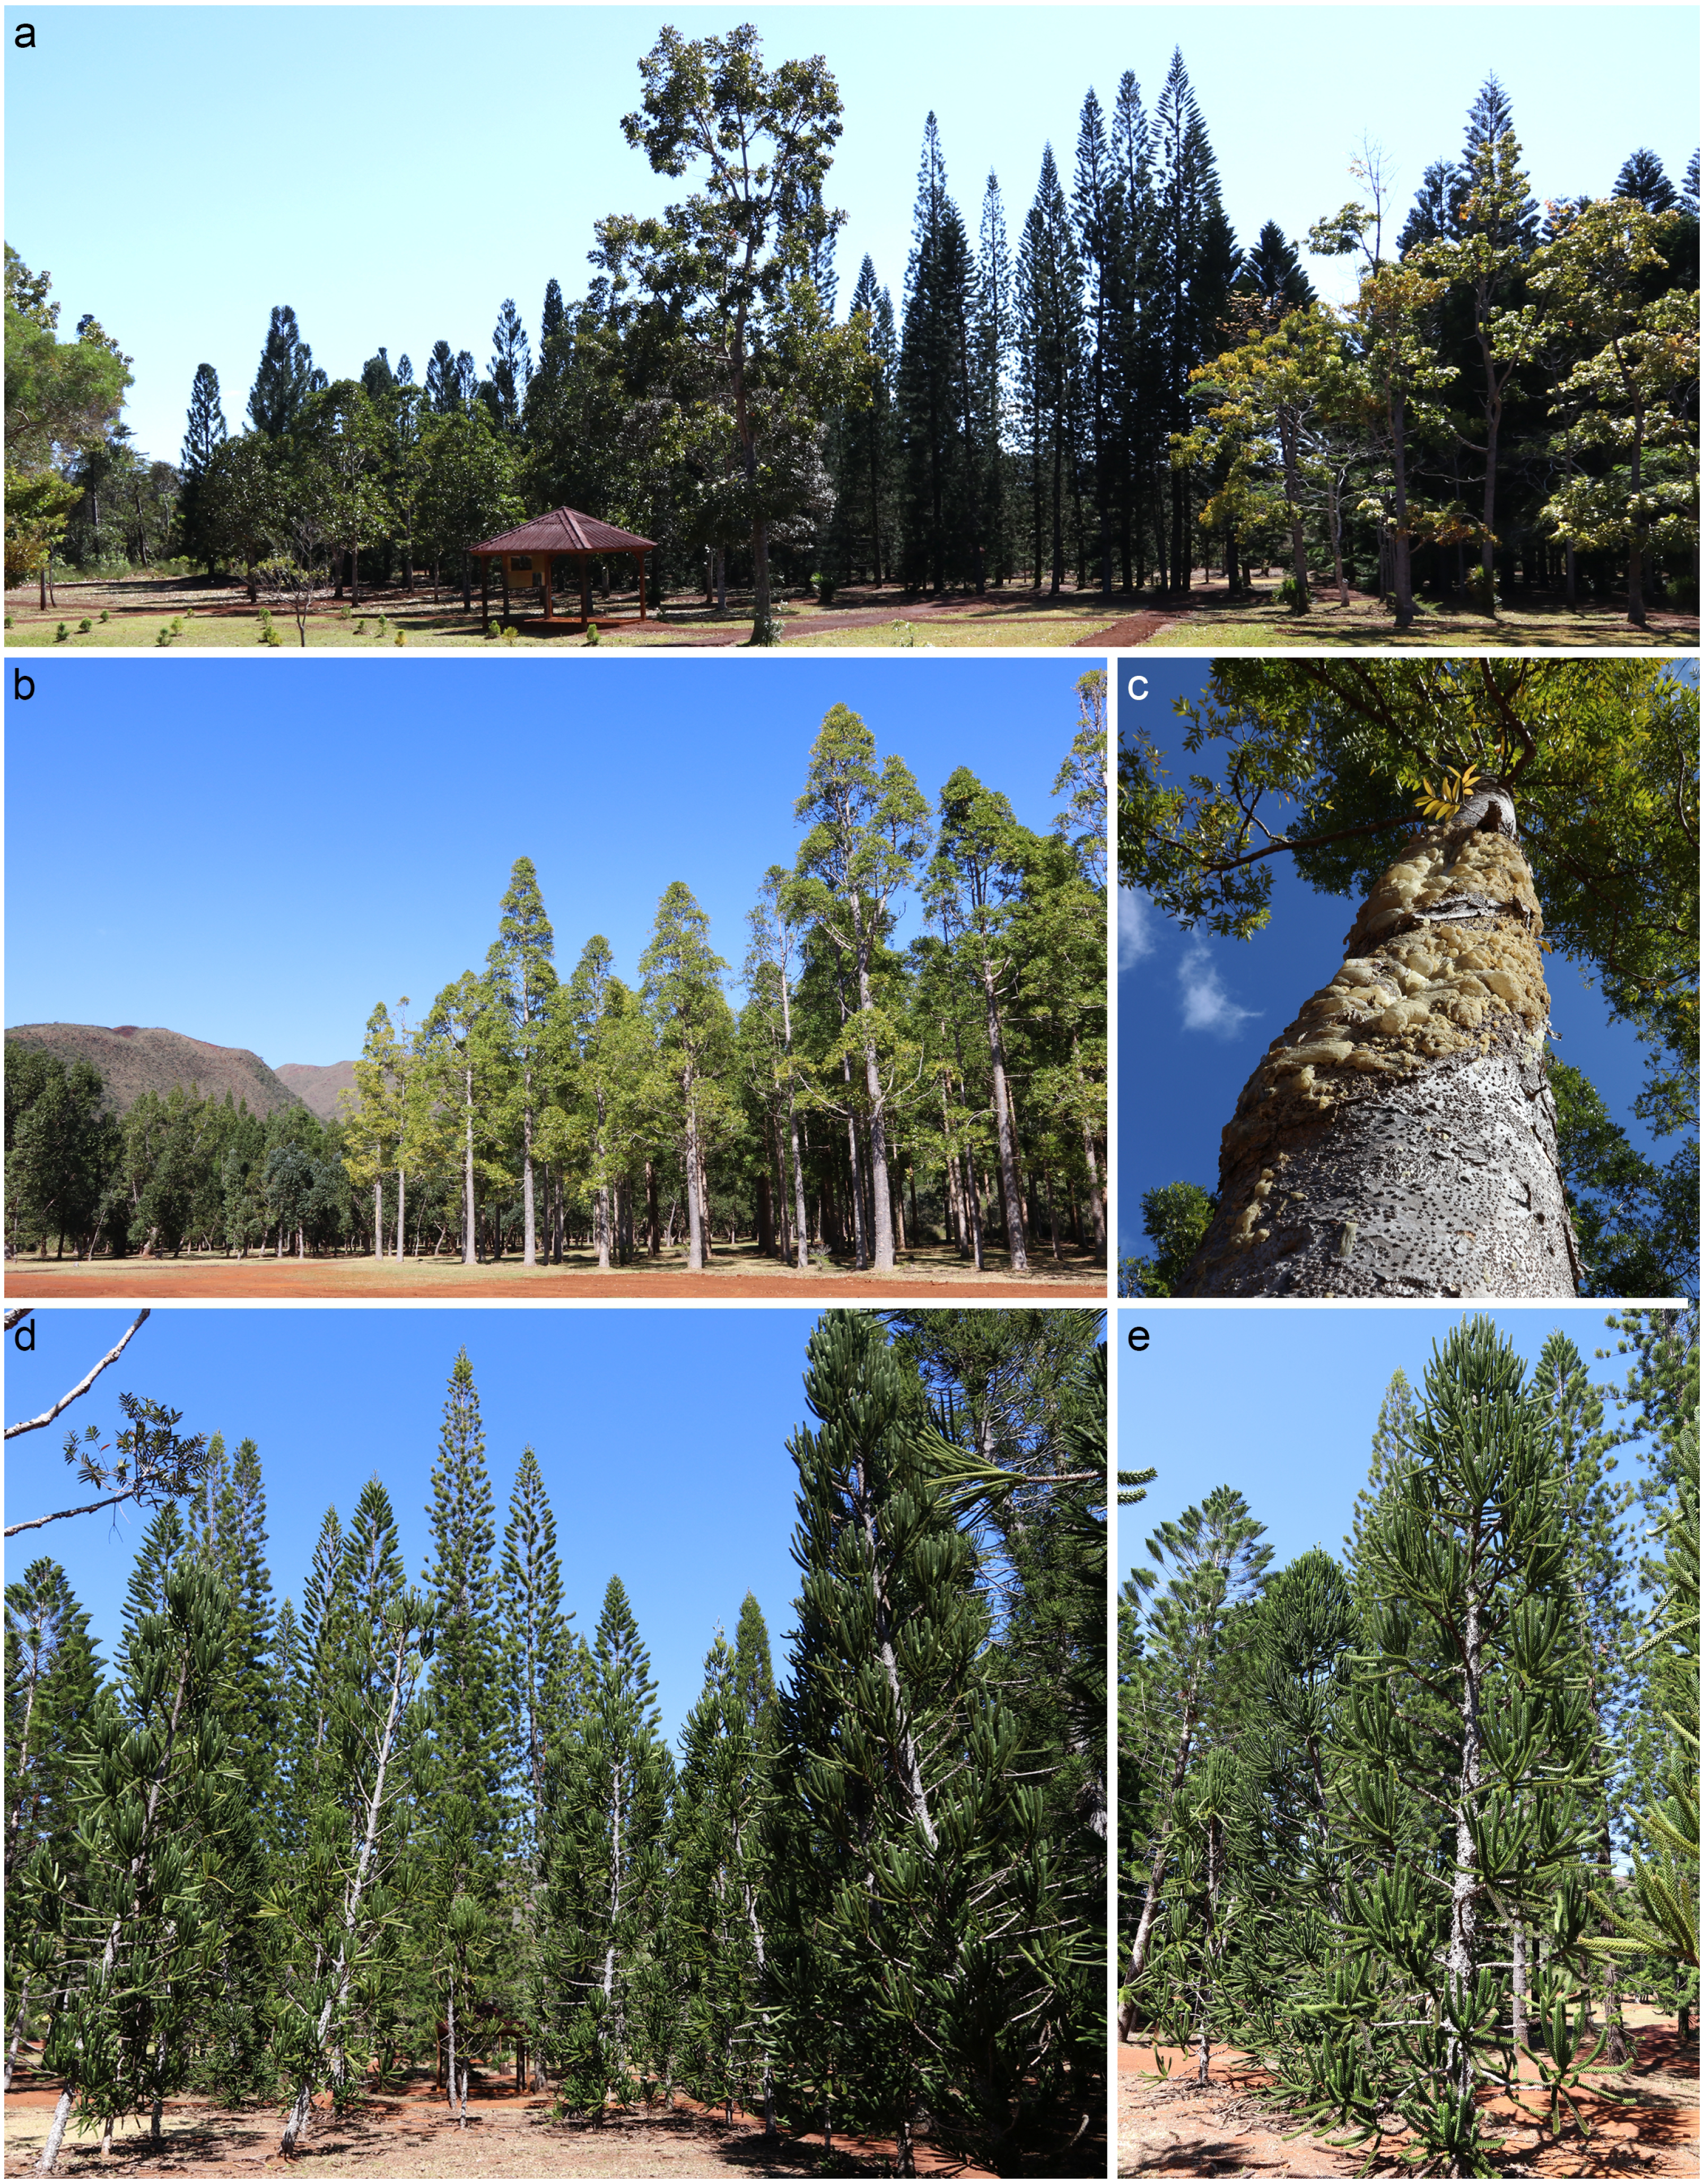
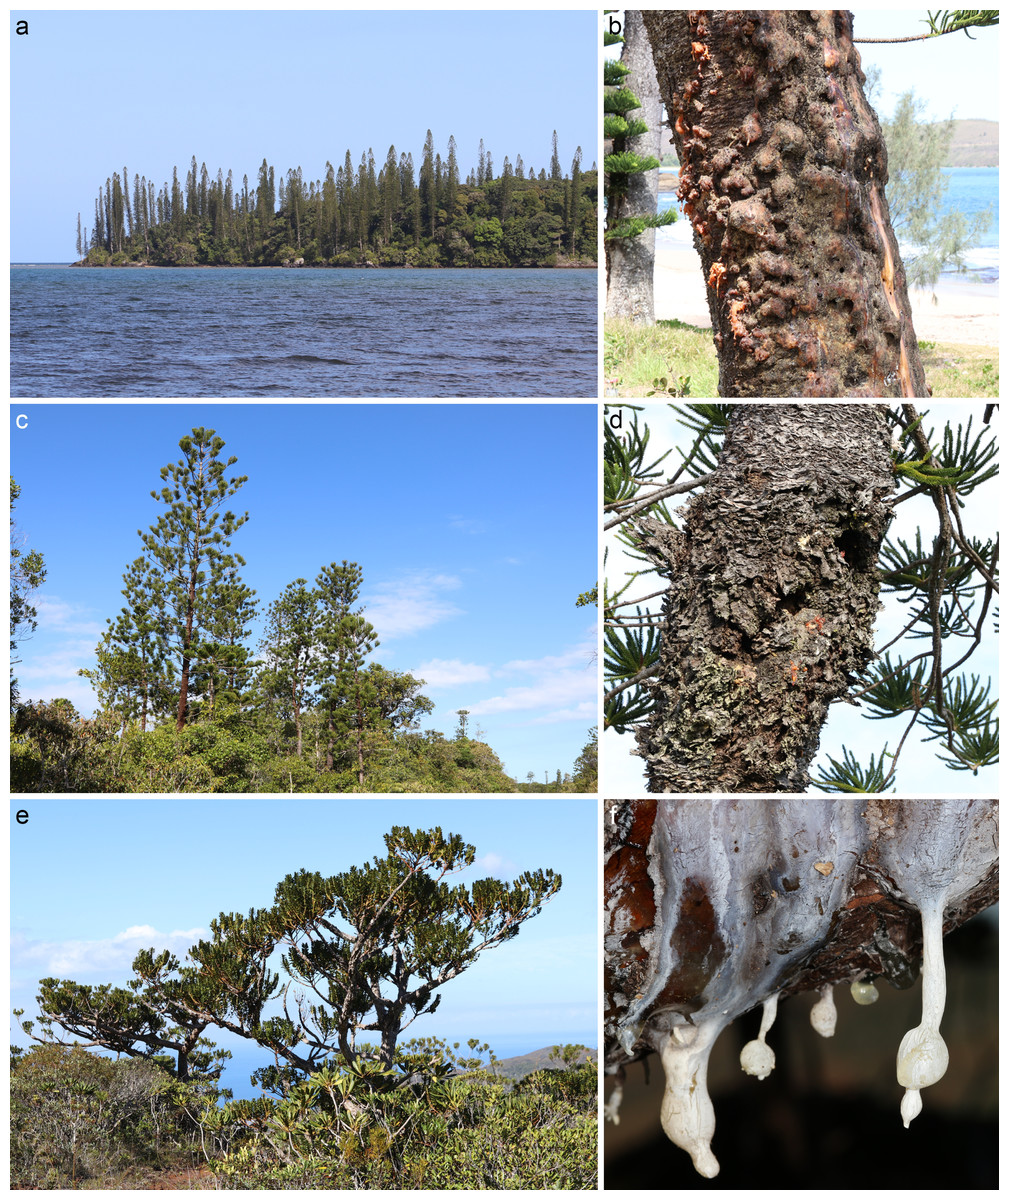
Figure 3: Araucariacean populations in the New Caledonian wilderness.
(A) Araucaria columnaris near Port Boisé. (B) Trunk of Araucaria columnaris with massive exudation near Bourail. (C) Araucaria nemorosa near Port Boisé. (D) Trunk of Araucaria nemorosa with exudate. (E) Agathis ovata near Yaté. (F) Exudate on a branch of Agathis ovata. September 2016.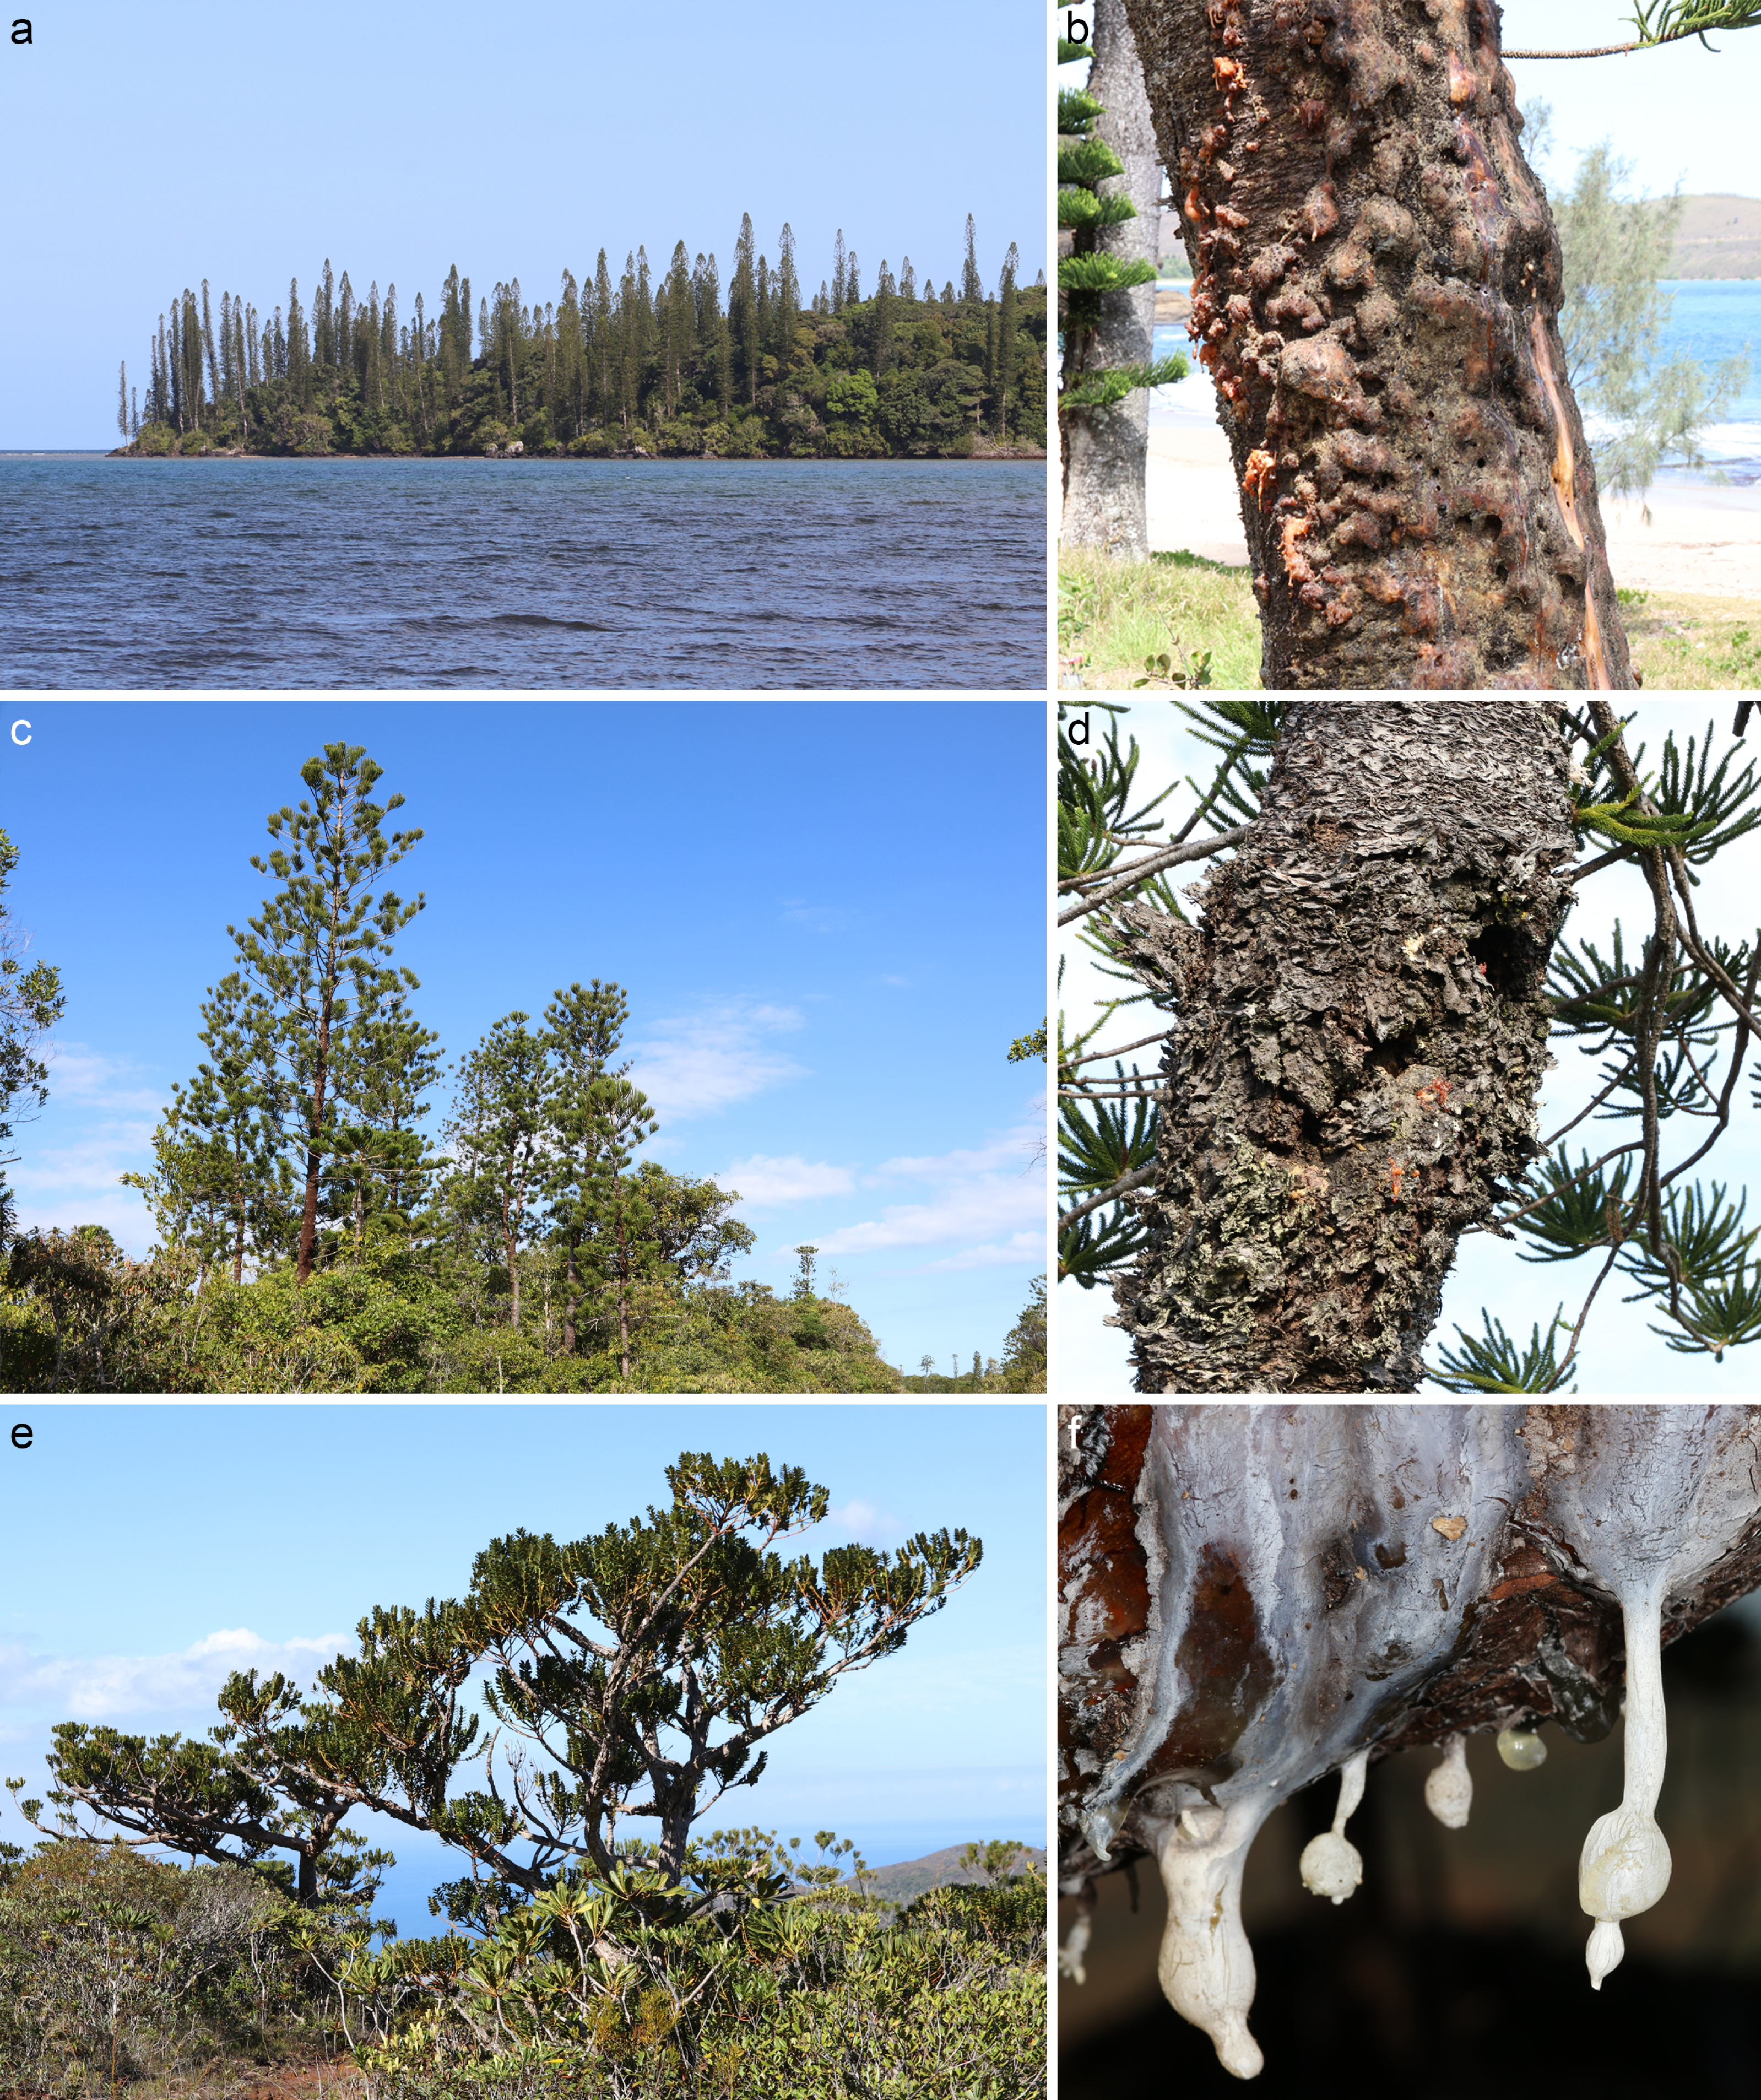
The exudates were found to be one of three different types: resin, gum, or a mixture of gum and resin here termed a gum resin, with sometimes two or three different types occurring in one species. Gums are polysaccharide-derived, resins are terpene-based, and the gum resins are a mixture of both. This is also the first time gum resin has been clearly identified using FTIR-ATR spectroscopy, and we show how to distinguish the three exudate types. We also highlight the natural intraspecific chemical variation in resins, particularly in wild sourced resins.
Materials & Methods
Fieldwork and all the naturally exuded samples’ collection in southern New Caledonia were permitted by the Direction de l’Environnement (Province Sud), New Caledonia, permit no 2388-2016/ARR/DENV, and permit no. 2016-014330/GNC-Pr from the New Caledonian Government for locality and collection access. The exudate samples originated from different locations across the southern province of Grande Terre (the main island) in New Caledonia (Fig. 1). The samples were obtained without causing damage to the trees, using a new individual sterile scalpel to scrape the exudates from the tree into stoppered labelled tubes, whilst being careful not to incorporate any bark or other organics to minimize contamination.
Exudates from the Ouénarou Arboretum near the Parc Provincial de la Rivière Bleue entrance
We were allowed to collect exudates from trees grown in plots at the arboretum at 22°09′04″S, 166°44′11″E, just outside the main gates to Parc Provincial de la Rivière Bleue, off the Route du Parc de le Rivière Bleue (Fig. 1 red dot). Here there are numerous same sized plots each planted with a different species of Araucariaceae (Fig. 2). Many endemic species but also some non-endemic Araucariaceae from the Pacific region are present. The trees are of the same age and were planted in the early 1980s. There are five endemic species not planted at the arboretum: Araucaria schmidii de Laub., Araucaria biramulata Buchh., Araucaria goroensis R.R. Mill et Ruhsam, Araucaria humboldtensis Buchh., because either they were not successfully cultivated (pers. comms. arboretum staff) or the species has only been recently recognized i.e., Ar. goroensis.
Some endemic species present in the arboretum had no exudate available to sample: Araucaria bernieri Buchh., Araucaria columnaris J.R.Forst. Hook, Araucaria laubenfelsii Corbasson, Araucaria montana Brongn. & Gris, Araucaria nemorosa de Laub, Araucaria rulei F.Muell., Araucaria scopulorum de Laub., and Araucaria subulata Vieill. The non-endemic Araucaria heterophylla (Salisb.) Franco from Norfolk Island also lacked exudates.
Endemic species with collected exudates were (number of sampled trees in brackets): Agathis corbassonii de Laub. (10), Agathis lanceolata Lindley ex Warb. (3), Agathis montana de Laub. (5), Agathis moorei (Lindl.) Mast. (4), Agathis ovata Moore ex Vieill. Warb. (3), Araucaria luxurians (Brongn. & Grisb.) de Laub. (1), and Araucaria muelleri (Carrière) Brongn. & Grisb. (1). We also sampled non-endemic trees: Araucaria bidwillii Hook (2) from Australia, Araucaria cunninghamii Mudie (4) found in Australia and New Guinea, and Agathis macrophylla (Lindl.) Mast., (16) found across the Pacific islands.
This sampling enabled us to collect exudates from different species across two Araucariaceae genera, which are all grown together under the same care regime and microclimate, allowing the examination of solely taxonomic (e.g., species and generic) differences in these exudates. Care was taken to avoid any grafted trees. The reasons for the exudation (e.g., branch break, root damage) were noted for all samples along with the species.
Exudates from wild growing Araucariaceae in New Caledonia
We collected exudates (using the same permits) from wild growing trees across several sites on Grande Terre (Fig. 1): those from Araucaria columnaris were collected from nine trees at Bourail, Agathis lanceolata were collected from 11 trees at Parc Provincial de la Rivière Bleue, Araucaria nemorosa were collected from eight trees at Port Boisé, and a sole sample of Agathis ovata was collected from Yaté.
FTIR spectroscopy
The samples were prepared as previously described in Seyfullah et al. (2021). Specifically the exudates were examined under a binocular microscope to check for any contaminants. Uncontaminated and dry exudate pieces were then selected, approximately 4–5 mm3 per sample, and individually powdered to avoid cross-contamination with extensive cleaning between sample preparations. The powdered exudates were then analysed using FTIR spectroscopy (Bruker Vertex 70) using a Globar light source, a KBr beamsplitter and a DLaTGS detector as in Seyfullah et al. (2021). The spectrometer was constantly purged by dry air to reduce background signals from atmospheric H2O and CO2. The spectra were collected in attenuated total reflection (ATR) mode using a Bruker Platinum A225 diamond ATR accessory that was installed in the sample chamber of the spectrometer as in Seyfullah et al. (2021). The powdered sample was placed on the 2 × 2 mm surface of the diamond and was pressed onto the crystal by a torque-controlled anvil. For each sample spectra were collected in the range from 4,000 to 650 cm−1 in 32 scans with a spectral resolution of four cm−1. A background spectrum was taken before each sample spectrum as in Seyfullah et al. (2021). Each sample was measured until three identical spectra were recorded, with the last one of the identical spectra chosen per sample for further analysis. The ATR crystal and anvil were cleaned thoroughly with ethanol between samples to prevent cross-contamination. The spectra were visualized using SpectraGryph v1.2.13 and spectrographic bands were identified by comparison with previous reports (Lyons, Masterlerz & Orem, 2009; Tappert et al., 2011; Beltran et al., 2016). The FTIR spectra from each sample of exudate were used to determine the type of exudate collected, resin or otherwise, following Tappert et al. (2011). These authors had identified key peaks for different plant exudates. A cleaned sample of Cycas revoluta Thunb. gum was also measured for comparison. All samples and their interpretation are listed in Table S1. Only the samples showing distinct resin spectra were then statistically analysed using R.
| Genus, species | Origin / locality | Native to New Caledonia | Exudate type from literature | Exudate types this study |
|---|---|---|---|---|
| Araucaria | ||||
| bidwillii | Arboretum | No | Gum resin (Anderson & Munro, 1969), Gum (Tappert et al., 2011) | Resin, gum resin |
| columnaris | Wild at Bourail | Yes | Gum resin (Anderson & Munro, 1969; Lambert et al., 1993) | Resin, gum resin |
| cunninghamii | Arboretum | No | Gum resin (Anderson & Munro, 1969), Resin (Tappert et al., 2011; Wolfe et al., 2009) | Resin, gum resin |
| luxurians | Arboretum | Yes | – | Gum resin |
| muelleri | Arboretum | Yes | – | Gum resin |
| nemorosa | Wild at Port Boisé | Yes | Resin (Seyfullah, Sadowski & Schmidt, 2015) | Resin, gum, gum resin |
| Agathis | ||||
| corbassonii | Arboretum | Yes | – | Resin |
| lanceolata | Arboretum and wild at Parc Provincial de la Rivière Bleue | Yes | Resin (Lambert et al., 1993; Tappert et al., 2011; Seyfullah, Sadowski & Schmidt, 2015) | Resin |
| macrophylla | Arboretum | No | Resin (Lambert et al., 1993) | Resin |
| montana | Arboretum | Yes | – | Resin |
| moorei | Arboretum | Yes | Resin (Lambert et al., 1993 | Resin |
| ovata | Arboretum and wild at Yaté | Yes | Resin (Seyfullah, Sadowski & Schmidt, 2015) | Resin |
Statistical analyses using R
All data manipulation and analysis was modified from Seyfullah et al. (2021) and was carried out in R version 4.1.0 (R Core Team, 2021) with the packages baseline version 1.3-1 (Liland, Almøy & Mevik, 2010) and RColorBrewer version 1.1-2 (Neuwirth, 2014) (SI). Each spectrum was standardised to zero mean and unit variance (z-scores) using the equation (x −)/σ, where x is the absorbance value, is the spectrum arithmetic mean, and σ is the spectrum standard deviation. The baseline was corrected using a modified polynomial fitting with a second order polynomial baseline. We used principal component analysis (PCA) and cluster analysis for data visualization and exploration (Varmuza & Filzmoser, 2009). The PCA and cluster analyses were run on the sample spectra. The cluster analysis was run using the Euclidean distance and with the unweighted pair group method with arithmetic mean (UPGMA) linkage algorithm. A cluster analysis was also applied to the taxon-mean spectra to simplify the relationships between the species and aid visualization as in Seyfullah et al. (2021).
Where there are more than two principle components the variation was explored with first and second derivatives to test whether any clearer pattern could be distinguished using the Prospectr package (Stevens & Ramirez-Lopez, 2021). Using derivatives of the spectra may highlight smaller details in the spectra, but it also increases the level of noise in the analysis (Varmuza & Filzmoser, 2009; Julier et al., 2016). To overcome this, the derivatives were only carried out on the Savitzky–Golay smoothed spectra. Savitzky–Golay smoothing fits polynomial curves to successive windows across a data series, and can be adjusted to vary the amount of smoothing given (Varmuza & Filzmoser, 2009; Julier et al., 2016). We used an 11 point smoothing window and a 2nd degree polynomial for the Savitzky-Golay convolution function. Then the PCA and cluster analyses were run again.
The two datasets were analysed both separately and combined together using these methods.
Data availability
All the datasets and R scripts are available in the supplementary information.
Results
Determination of exudates
Using FTIR-ATR, we found only one type of exudate (resin) in Agathis species, both from arboretum and wild-sourced trees (Table 1, Fig. 4, Fig. S1). Key features of resins detected with infrared spectroscopy were identified based on Lyons, Masterlerz & Orem (2009), Tappert et al. (2011) and Beltran et al. (2016), (Table 2). There is a very variable to sometimes almost absent wide peak generally found around 3,400 cm−1 caused by the stretching of O–H bonds, with a small peak at 3,076 cm−1 due to the deformation vibrations of =C–H groups. Then there is a more prominent peak at around 2,930 cm−1, which is produced by methylene groups, plus two smaller peaks at 2,870 cm−1 and 2,848 cm−1, off the shoulder of the 2,935 cm−1 peak. All three peaks result from aliphatic stretching of single C–H bonds. The next peak is at 1,692 cm−1, with a weak to barely present shoulder at around 1,722 cm−1, both are related to the C=O (carbonyl) bonds. A smaller peak 1,640 cm−1 is probably related to O–H bending bond or to exomethylene or to unsaturated C–C bond stretching vibrations. In the fingerprint region of the spectra (between 1,550–650 cm−1), there are various peaks. The Agathis species all share the following peaks. Peaks at 1,443 cm−1 and at 1,385 cm−1, are due to C–H bending motions of methyl and methylene functional groups. Three peaks: 1,230 cm−1, 1,150 cm−1, 1,030 cm−1, are due to C–O single bonds, and the peak at 887 cm−1, is attributed to the out-of-plane C–H bending motions in terminal methylene groups.
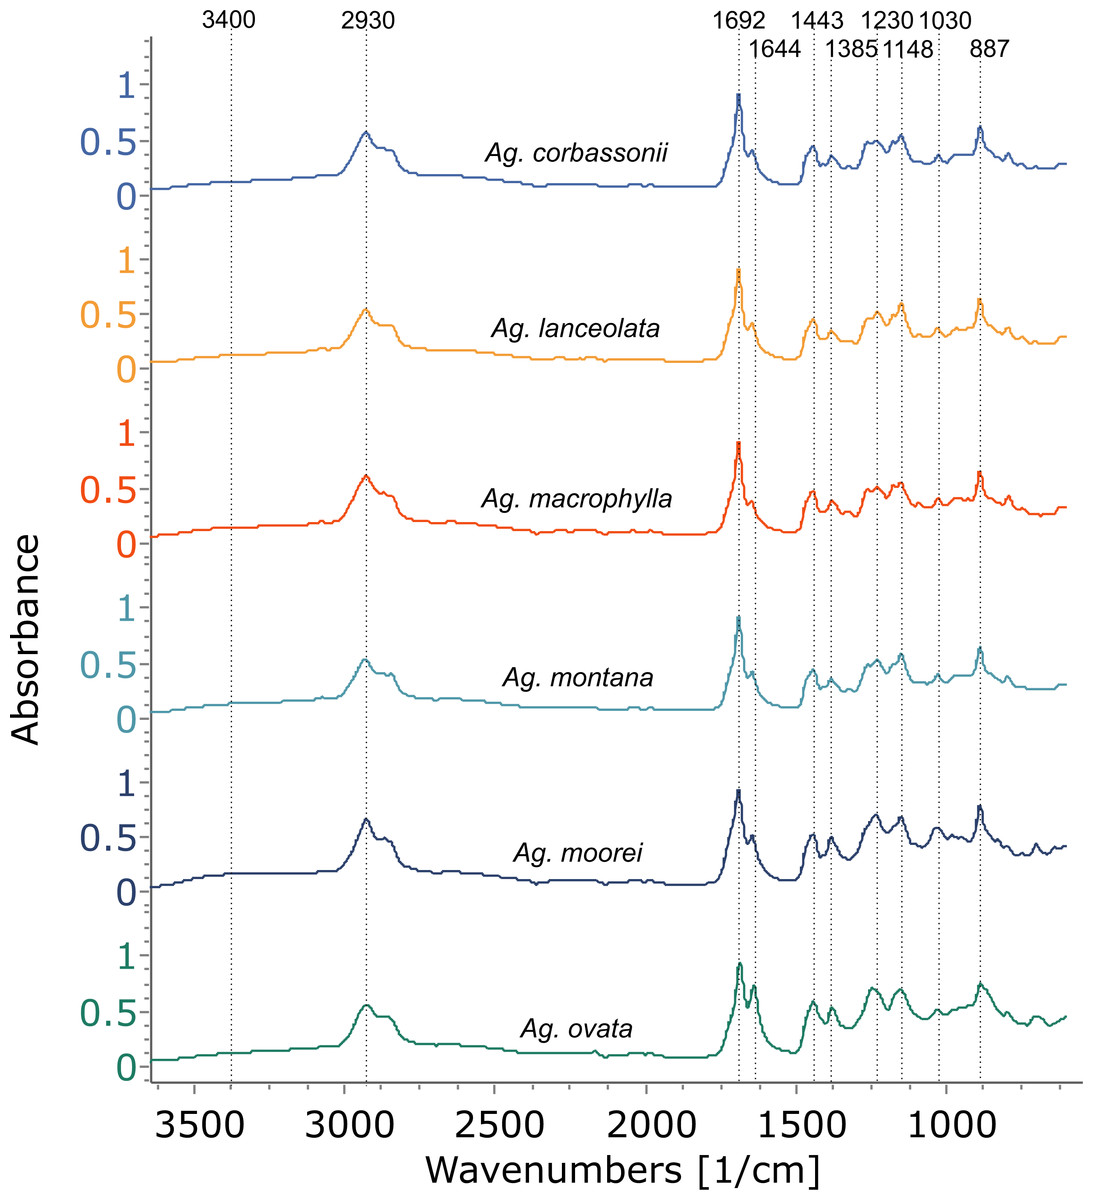
Figure 4: FTIR spectra of resins from the Agathis species present at the arboretum.
Dotted lines indicate key features of the spectra and their wavenumbers.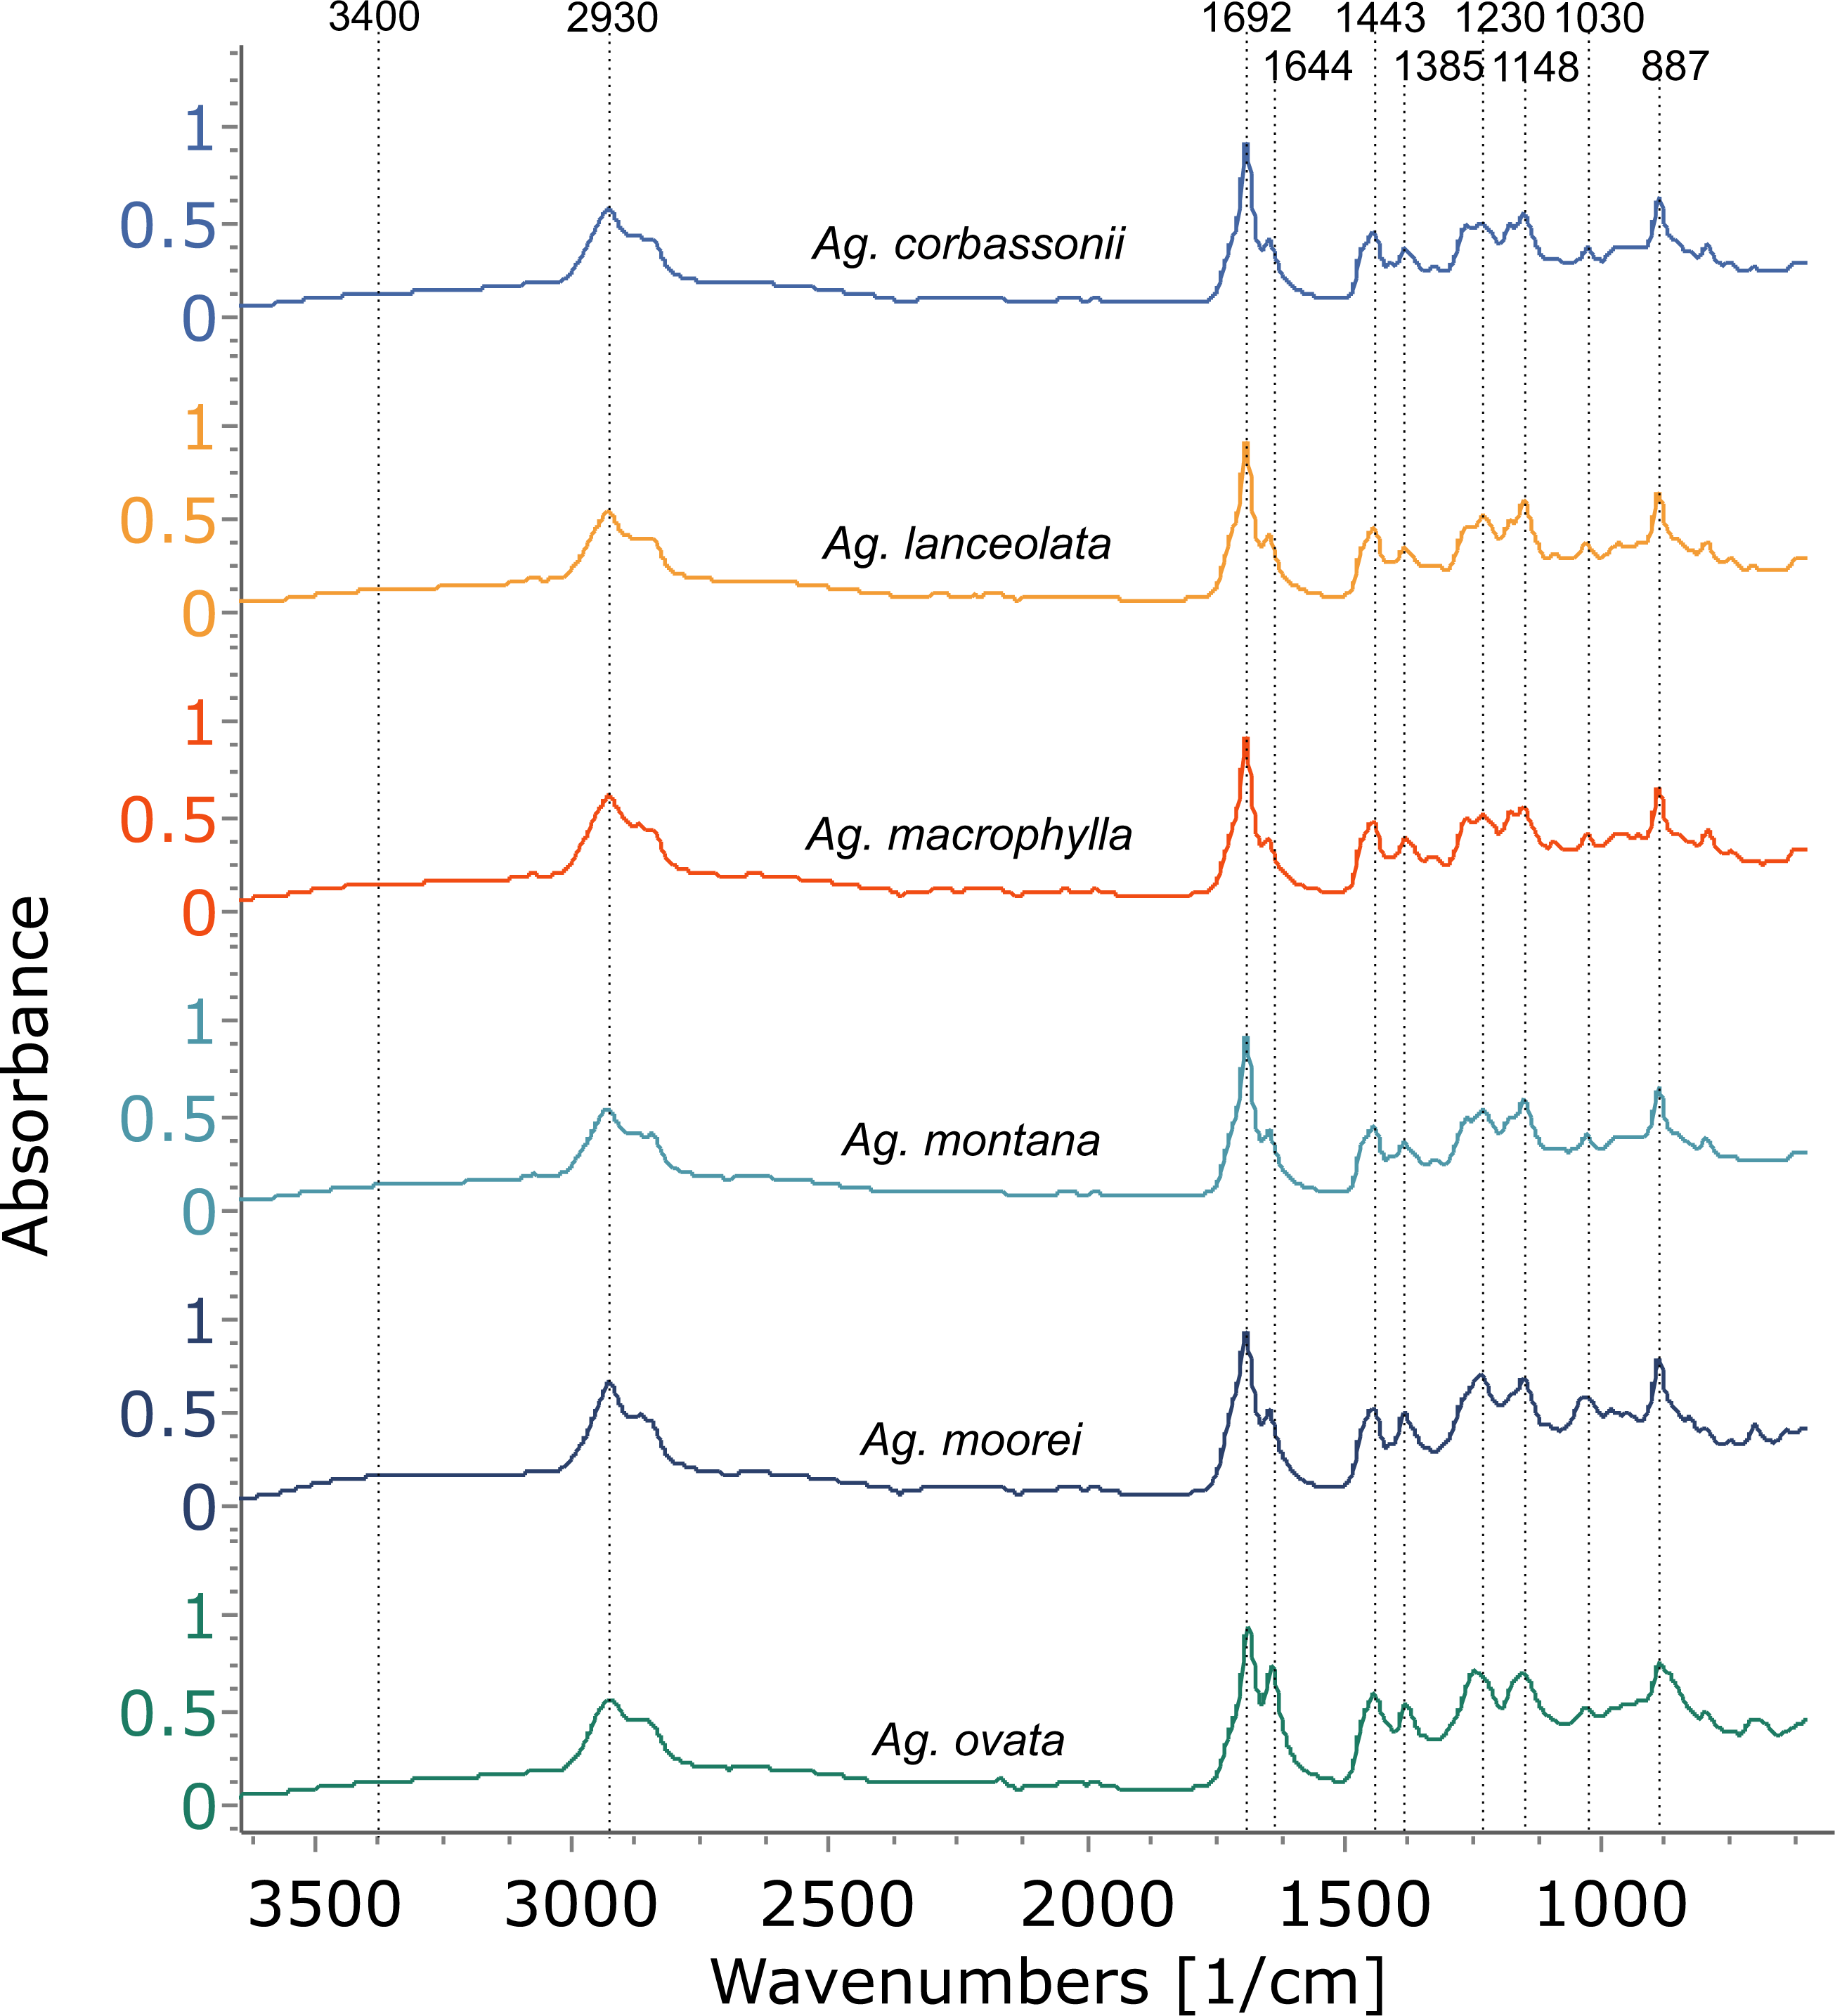
| Band wavelength (cm−1) | Interpretation |
|---|---|
| Resin spectra | |
| 3,400–3,200 | vO–H bonds stretching of alcohols and/or carboxylic acids/vs OH |
| 3,076 | vsCHn deformation vibrations of =C–H groups/alkynes |
| 2,935 | vasCHn aliphatic stretching of methylene groups |
| 2,870 | vCHn aliphatic stretching of methyl groups |
| 2,848 | vsCHn aliphatic stretching of methylene groups |
| 1,693 | vC=O double bonds in carboxyl groups of resin acids |
| 1,640 | δO–H bending bond or exomethylene, or unsaturated vC–C bond |
| 1,443 | δasC–H bending motions of methyl and methylene groups |
| 1,385 | δsC–H vibrations of methyl and methylene groups |
| 1,230, 1,150, 1,030 | vasC–O single bond stretching |
| 887 | =C–H out-of-plane bending motions in terminal methylene groups |
| Gum spectra | |
| 1,030 | vC–O single bond stretching. Wide and most intense peak in fingerprint region |
Notes:
- v
-
stretching
- as
-
asymmetric
- s
-
symmetric
- δ
-
in plane bending
The Araucaria species, however, show a mixture of two to three exudate types sometimes even within one species: resin, gum, and gum resin (Table 1, Fig. 5, Figs. S2, S3). The resin spectra appear similar to those of Agathis (Fig. 6, Fig. S4) and were analysed further using PCA and cluster analysis (below). Plant gums are visually indistinguishable from resins, but are chemically distinct water-soluble polysaccharides rather than terpene-based, water-insoluble resins. Using Tappert et al. (2011), the features of Araucaria and Cycas gums measured with infrared spectroscopy are a very prominent peak at around 3,400 cm−1 with a peak at around 2,930 cm−1 that also lacks the clear peaks at 2,870 cm−1 and 2,848 cm−1 found in the Agathis and Araucaria resins (Table 2, Fig. 5, box 1, Fig. S2). The gum spectra have a very weak peak at 1,692 cm−1 unlike the strong peak plus the accessory peak at 1,644 cm−1, present in resin spectra (Fig. 5 box 2, Fig. S2 ; plus also see Fig. 4, Fig. S1 for these peaks in resin spectra). In the fingerprint region, the largest, widest, and most distinctive peak is around 1,027 cm−1, slightly shifted compared to the 1,030 cm−1 peak (Table 2; (Tappert et al., 2011). However, for the resins it is a far smaller, sharper peak (Fig. 5 box 3, Fig. S2). There is also a shoulder to this peak at 1,070 cm−1, thought to be due to C–O single bond stretching.
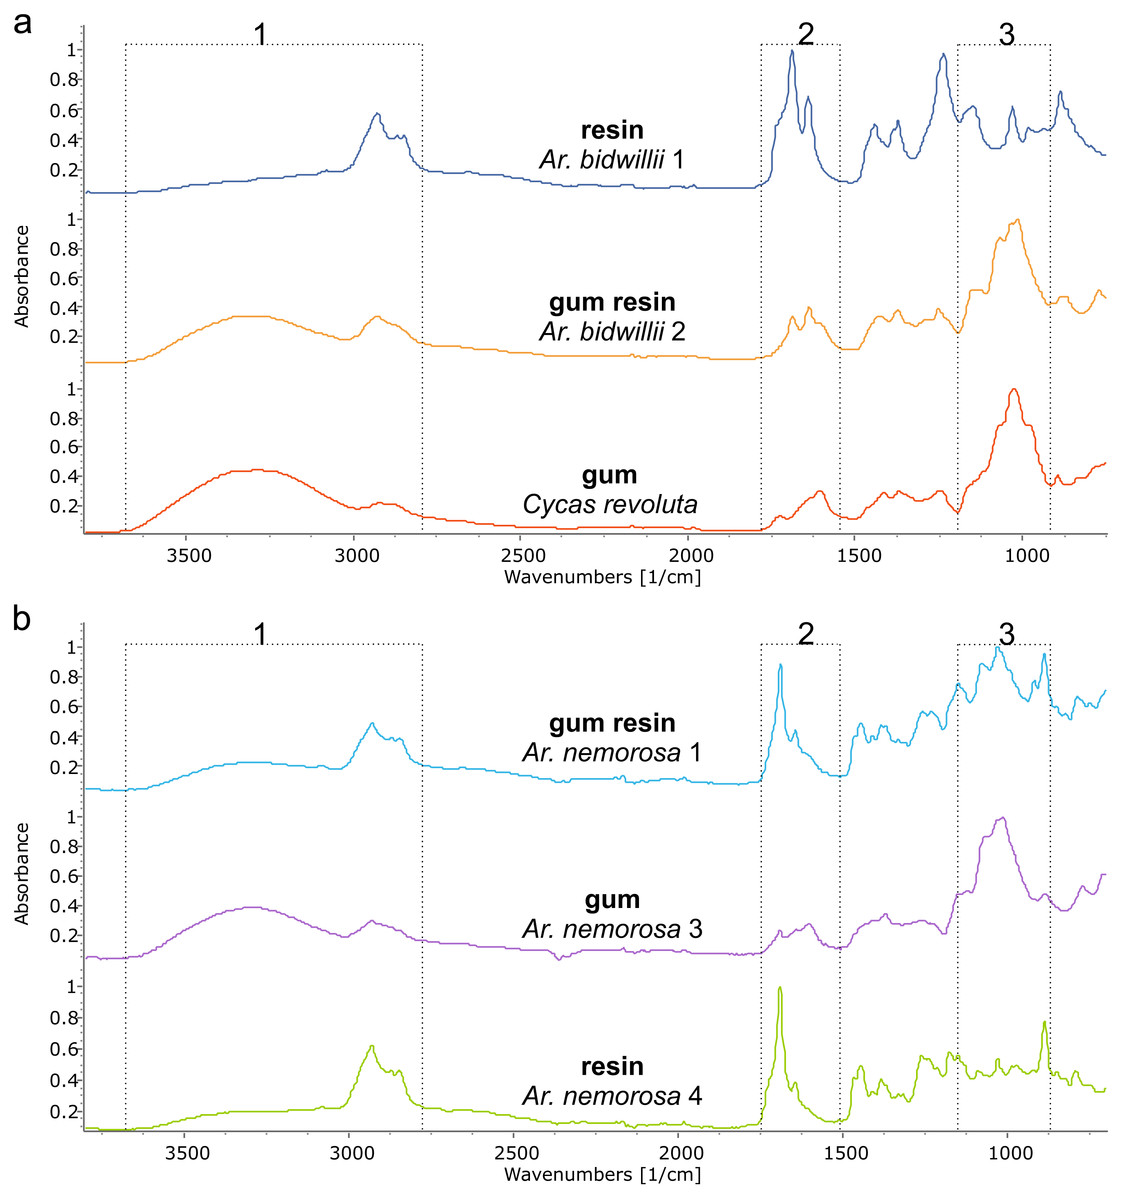
Figure 5: FTIR spectra of different exudate types from a single species. The dotted boxes highlight the three areas of interest for comparing the different exudate types.
(A) Araucaria bidwilli from the arboretum produced both a resin (Ar. bidwillii 1) and a gum resin (Ar. bidwillii 2) and are compared against a gum spectrum from Cycas collected near Bourail. (B) Wild-sourced Araucaria nemorosa produced three exudate types: a gum resin (Ar. nemorosa 1), a gum (Ar. nemorosa 3) and a resin (Ar. nemorosa 4). Sample number given after species name.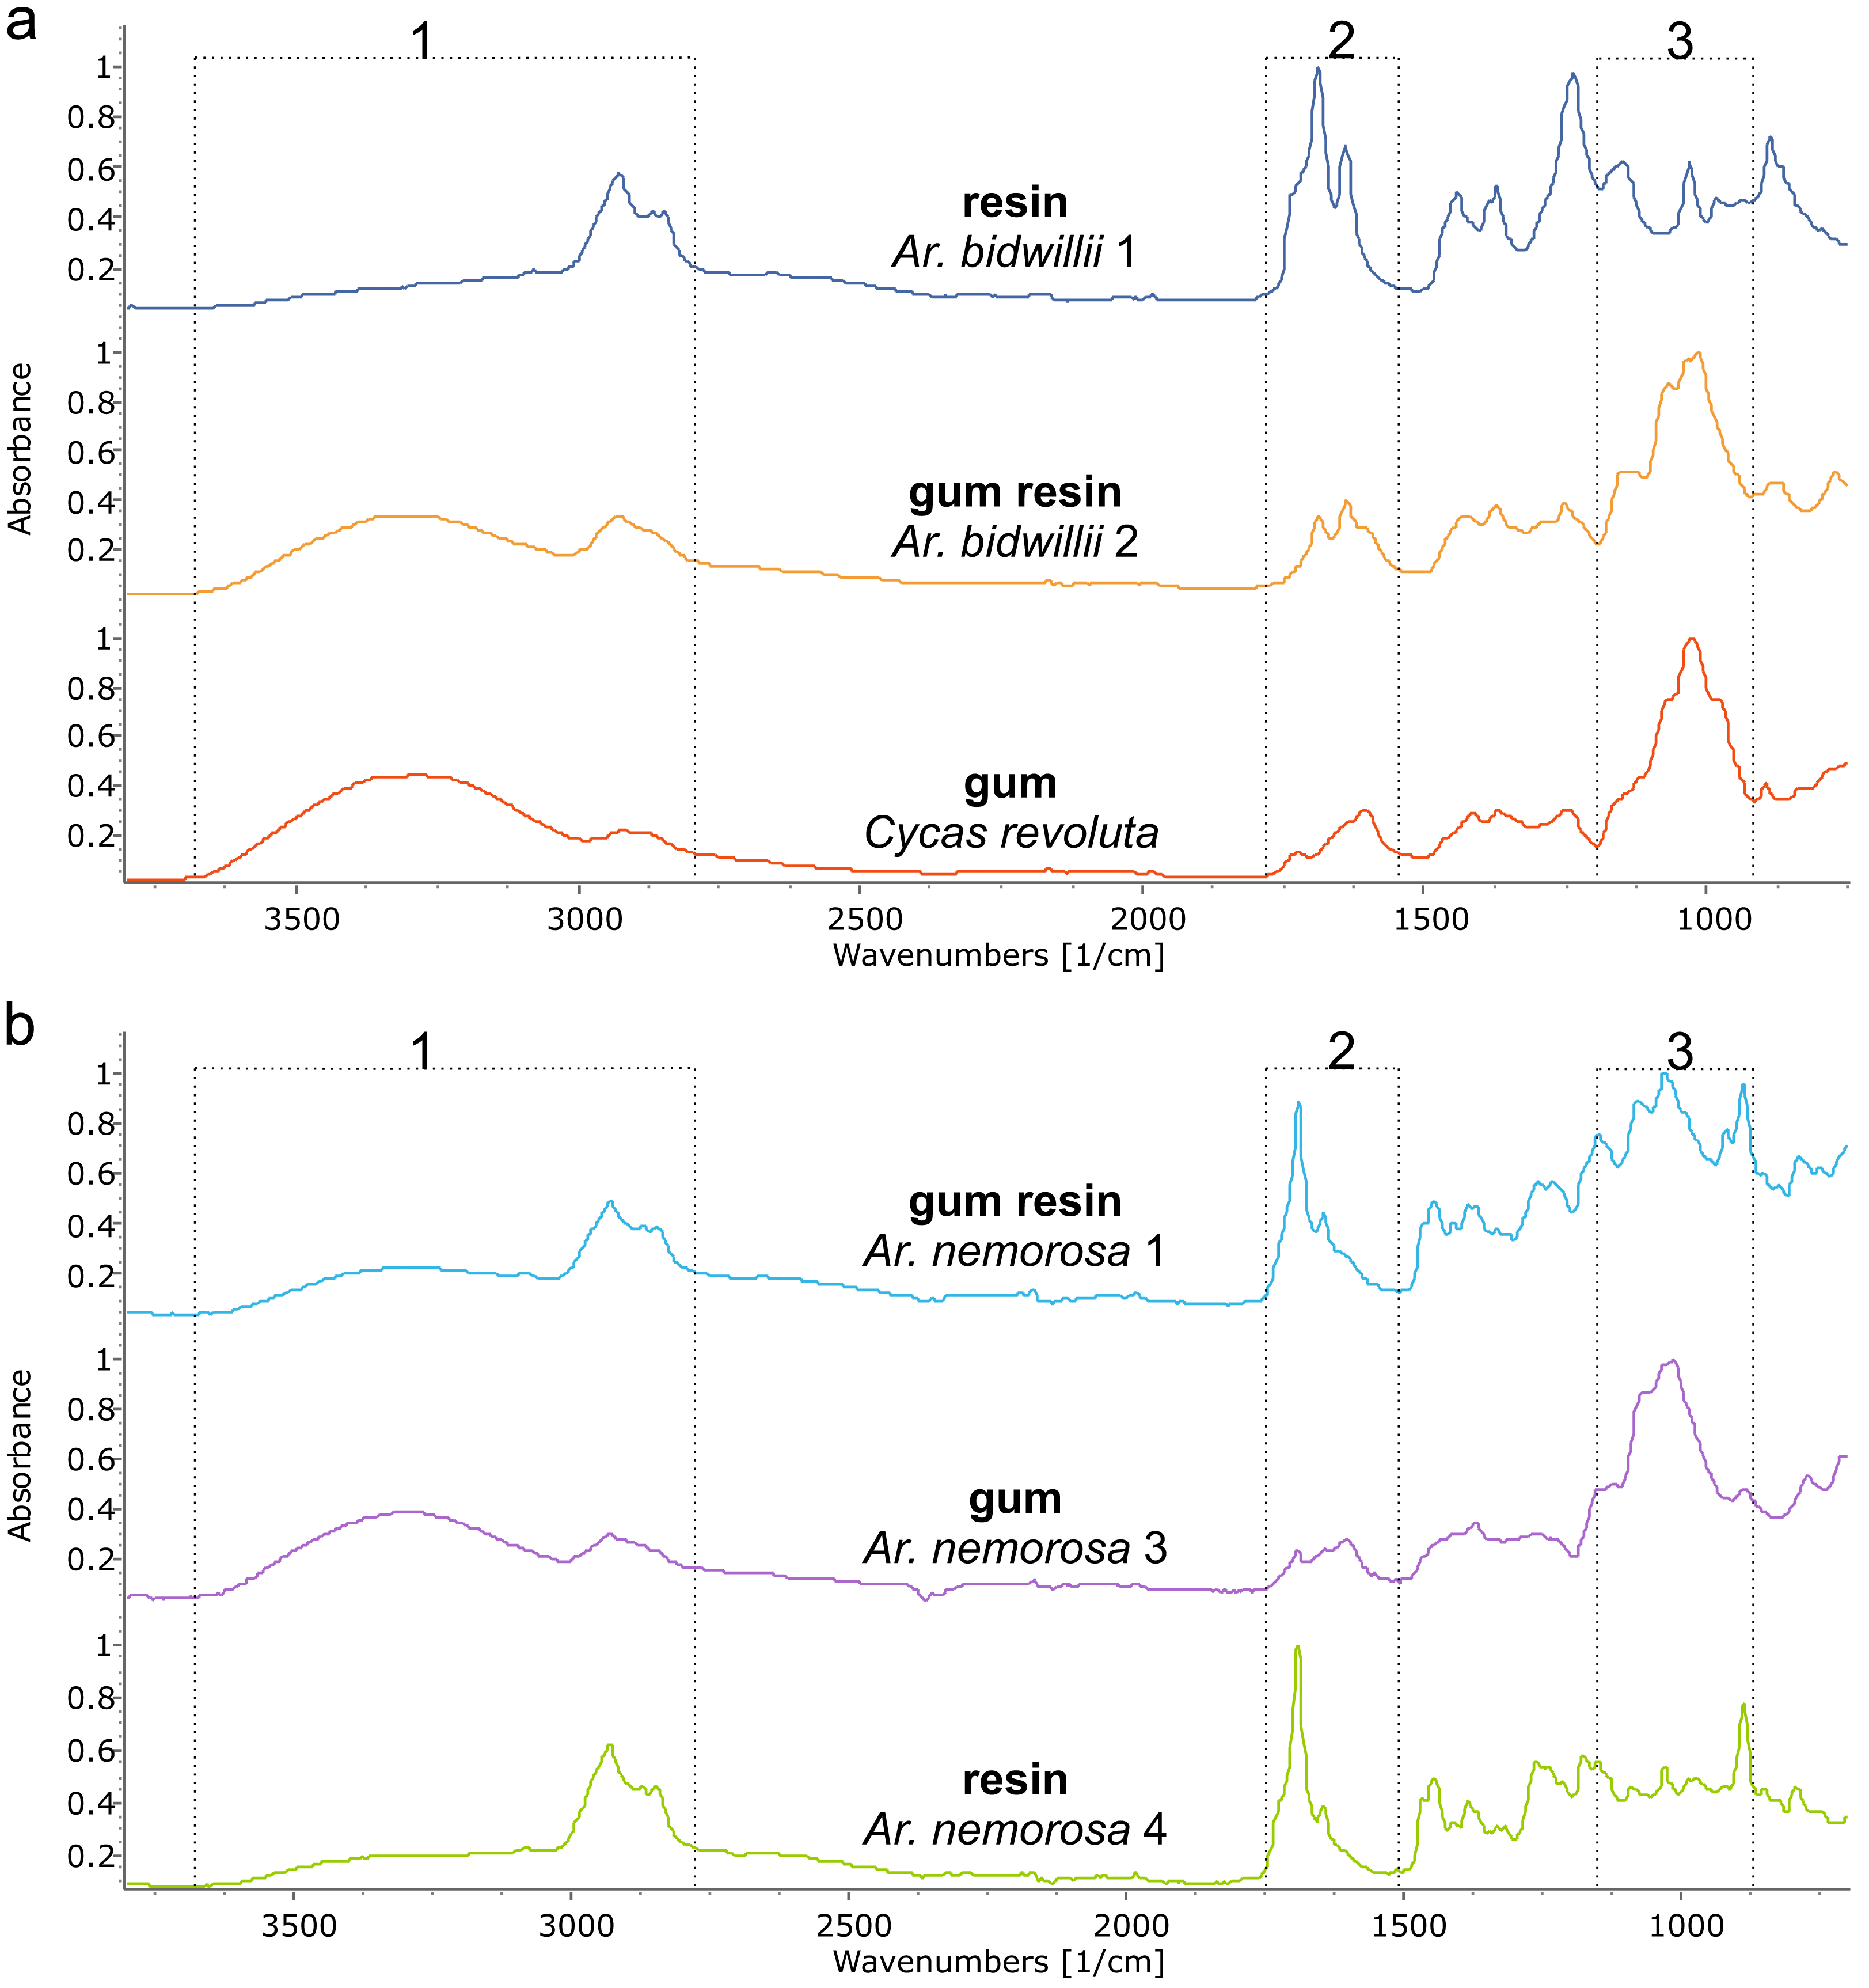
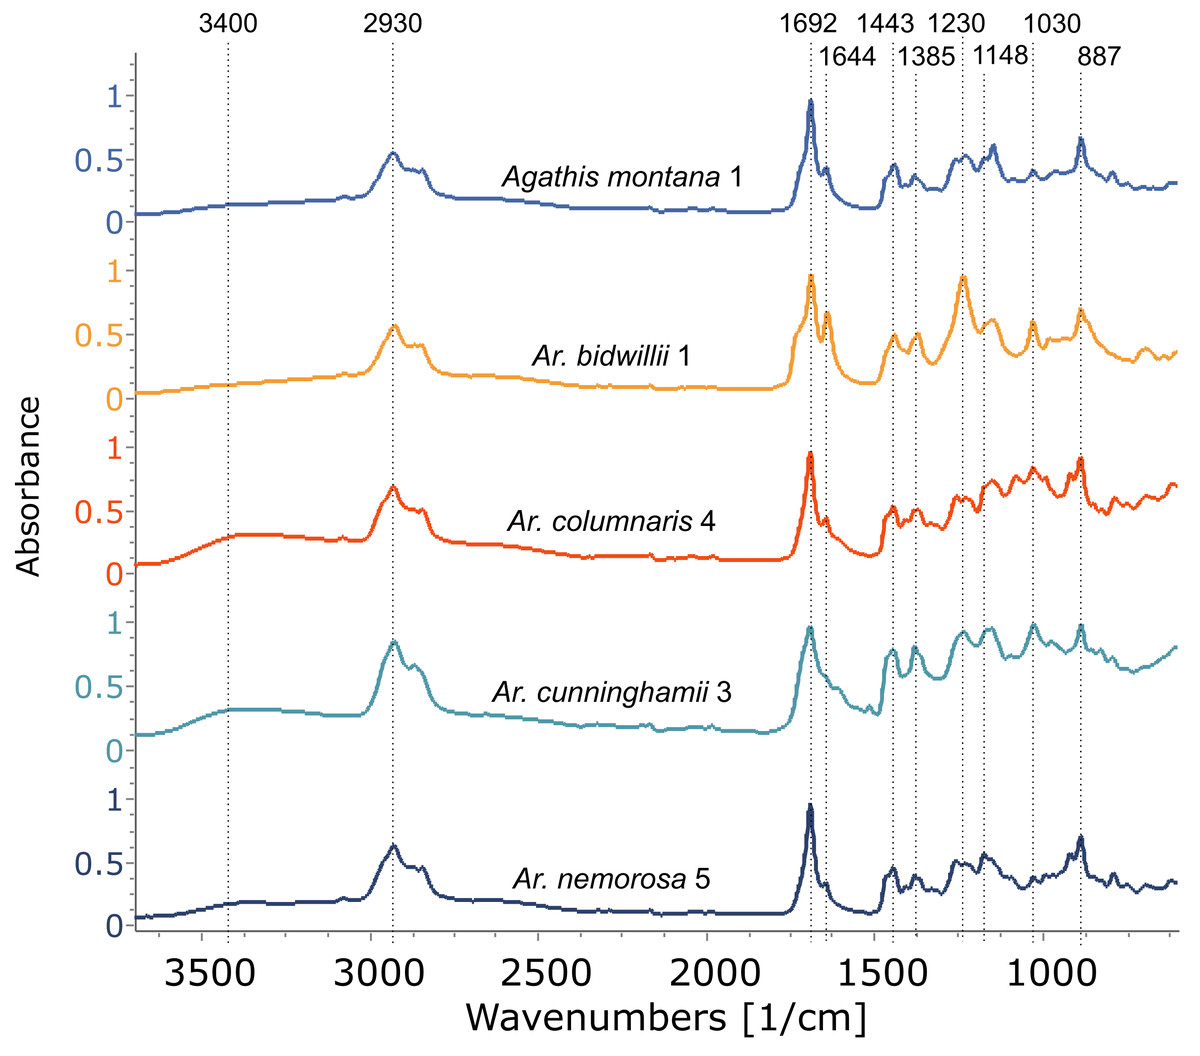
Figure 6: FTIR spectra of resins from different Araucaria species, with a resin from Agathis montana for comparison.
Dotted lines indicate key features of the spectra and their wavenumber. Sample number indicated after species name.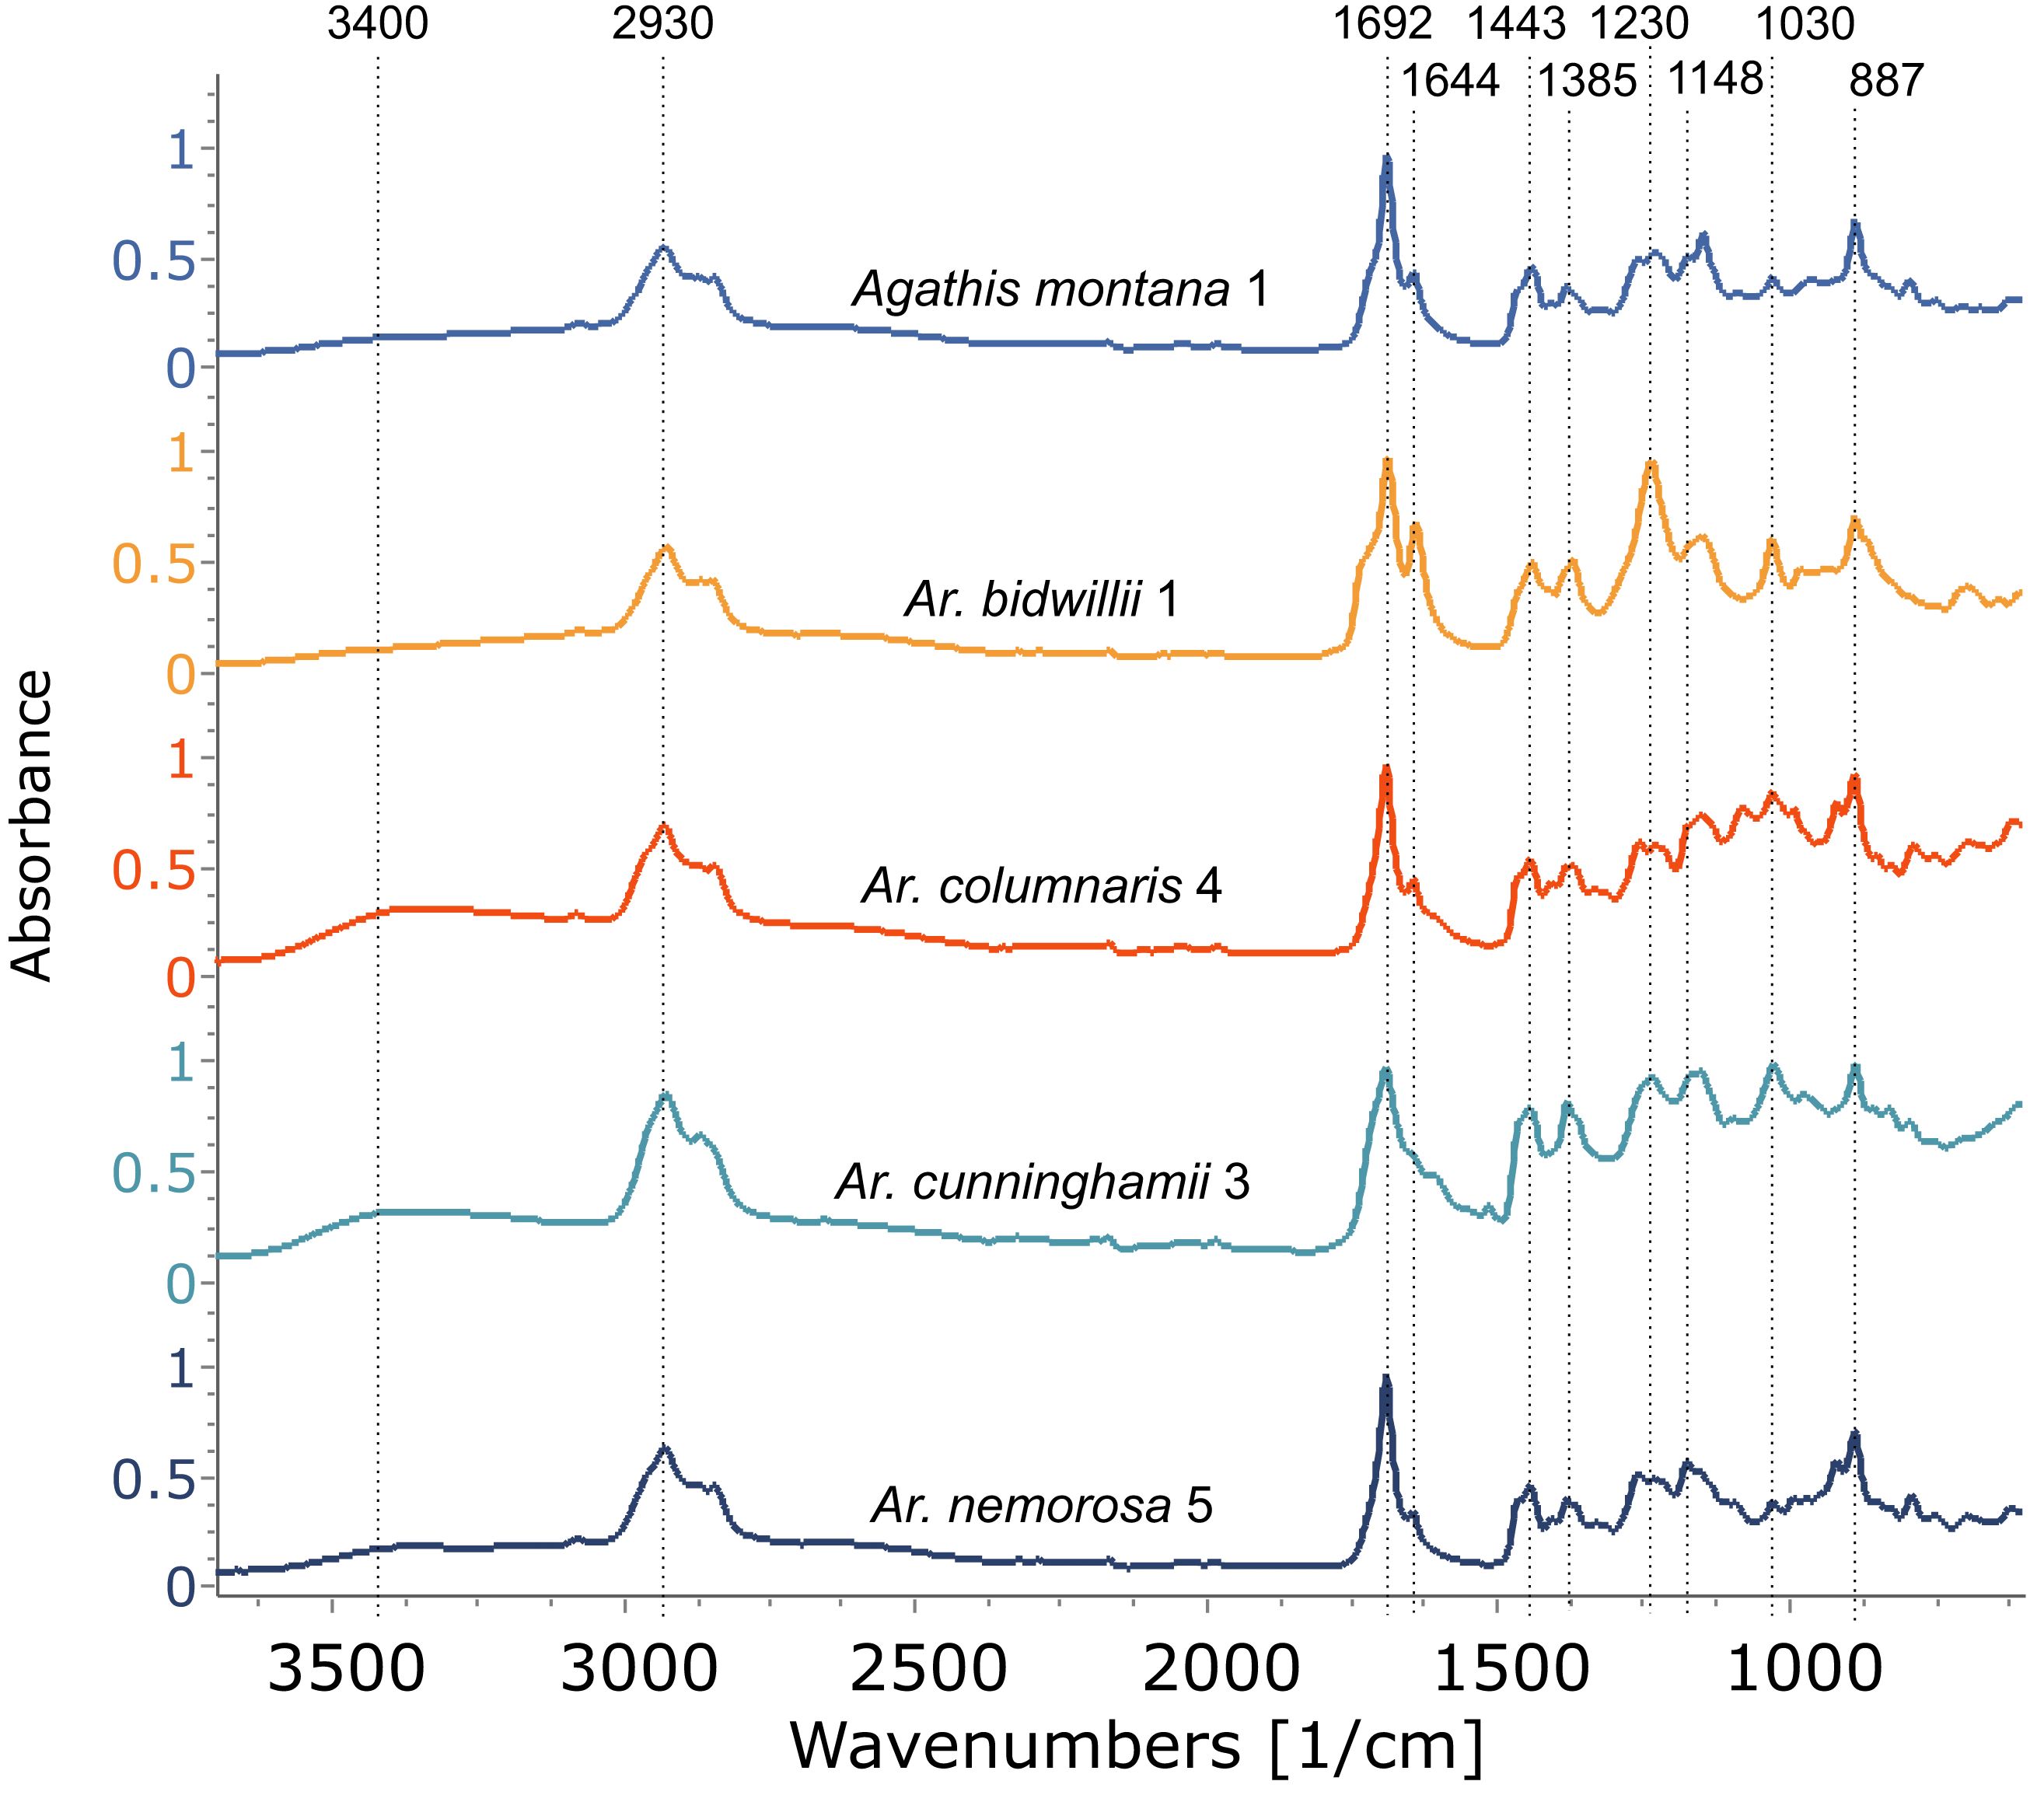
The third exudate type that we refer to here is also not visually distinct even under light microscopy, from either a resin or a gum. With FTIR this third type of exudate shows a clear mixture of both the gum and resin bands in their spectra and so is termed here gum resins (Fig. 5, Tables 1, 2, Fig. S2). Gum resins are a mixture of resin and gum, but there is no way to visually discern either component as they appear totally intermixed in to one exudate, it is likely that the components are mixed at a sub-light microscopic level. All these features with FTIR bands enable us to distinguish the three exudate types. Ar. bidwillii from the arboretum provided resin from one tree and gum resin from the other (Fig. 5, Table 1), while wild-sourced Ar. nemorosa was found to produce gum resin, gum and resin from separate wild trees (Fig. 5, Table 1). The sole samples of Ar. luxurians and Ar. muelleri, both from the arboretum, were gum resins, while Ar. columnaris (wild-sourced) and Ar. cunninghamii (arboretum sourced) both had trees that produced either gum resin or resin (Table 1, Fig. S3).
Intergeneric, inter-, and intraspecific resin comparisons
Resins from the Ouénarou Arboretum
The arboretum provided the perfect way to investigate the potential intergeneric, inter- and intraspecific effects on exudate production and its bulk chemistry. The endemic Araucaria species produced far smaller amounts of exudates than the endemic Agathis species (see Table 1 for exudate types). In most cases the exudate was in response to some kind of obvious physical damage.
For resins from all the species at the arboretum, a PCA of the uncorrected spectra shows that more than 90% of the variance was due to four principal components. However, due to the observed slight baseline drift, a baseline correction was applied, which resulted in 90% of the variance being due to five principal components, (proportion of variance for PC1: 38.2%, PC2: 28.75%; standard deviation for PC1: 4.087, PC2: 3.5459), these baseline corrected data were used for the multivariate analyses shown in Fig. 7.
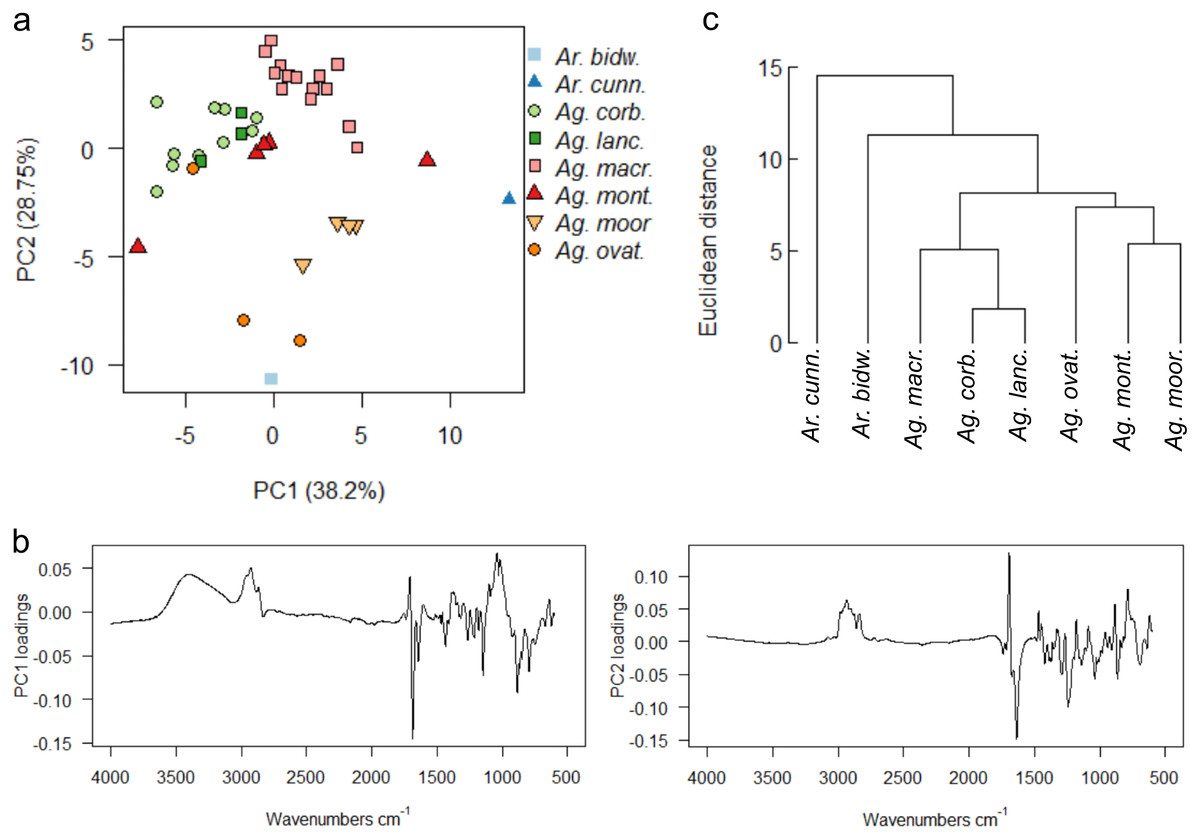
Figure 7: Multivariate analysis of resins sourced from the arboretum.
(A) Principal components analysis showing PC1 vs. PC2; (B) loadings for PC1 and PC2; (C) taxon-mean spectra cluster analysis. Sample size indicated in brackets for each species Ar. bidw. –Araucaria bidwillii (1), Ar. cunn. –Araucaria cunninghamii (1), Ag. corb. –Agathis corbassoni (10), Ag. lanc. –Agathis lanceolata (3), Ag. macr. –Agathis macrophylla (16), Ag. mont. –Agathis montana (5), Ag. moor. –Agathis moorei (4), Ag. ovat. –Agathis ovata (3).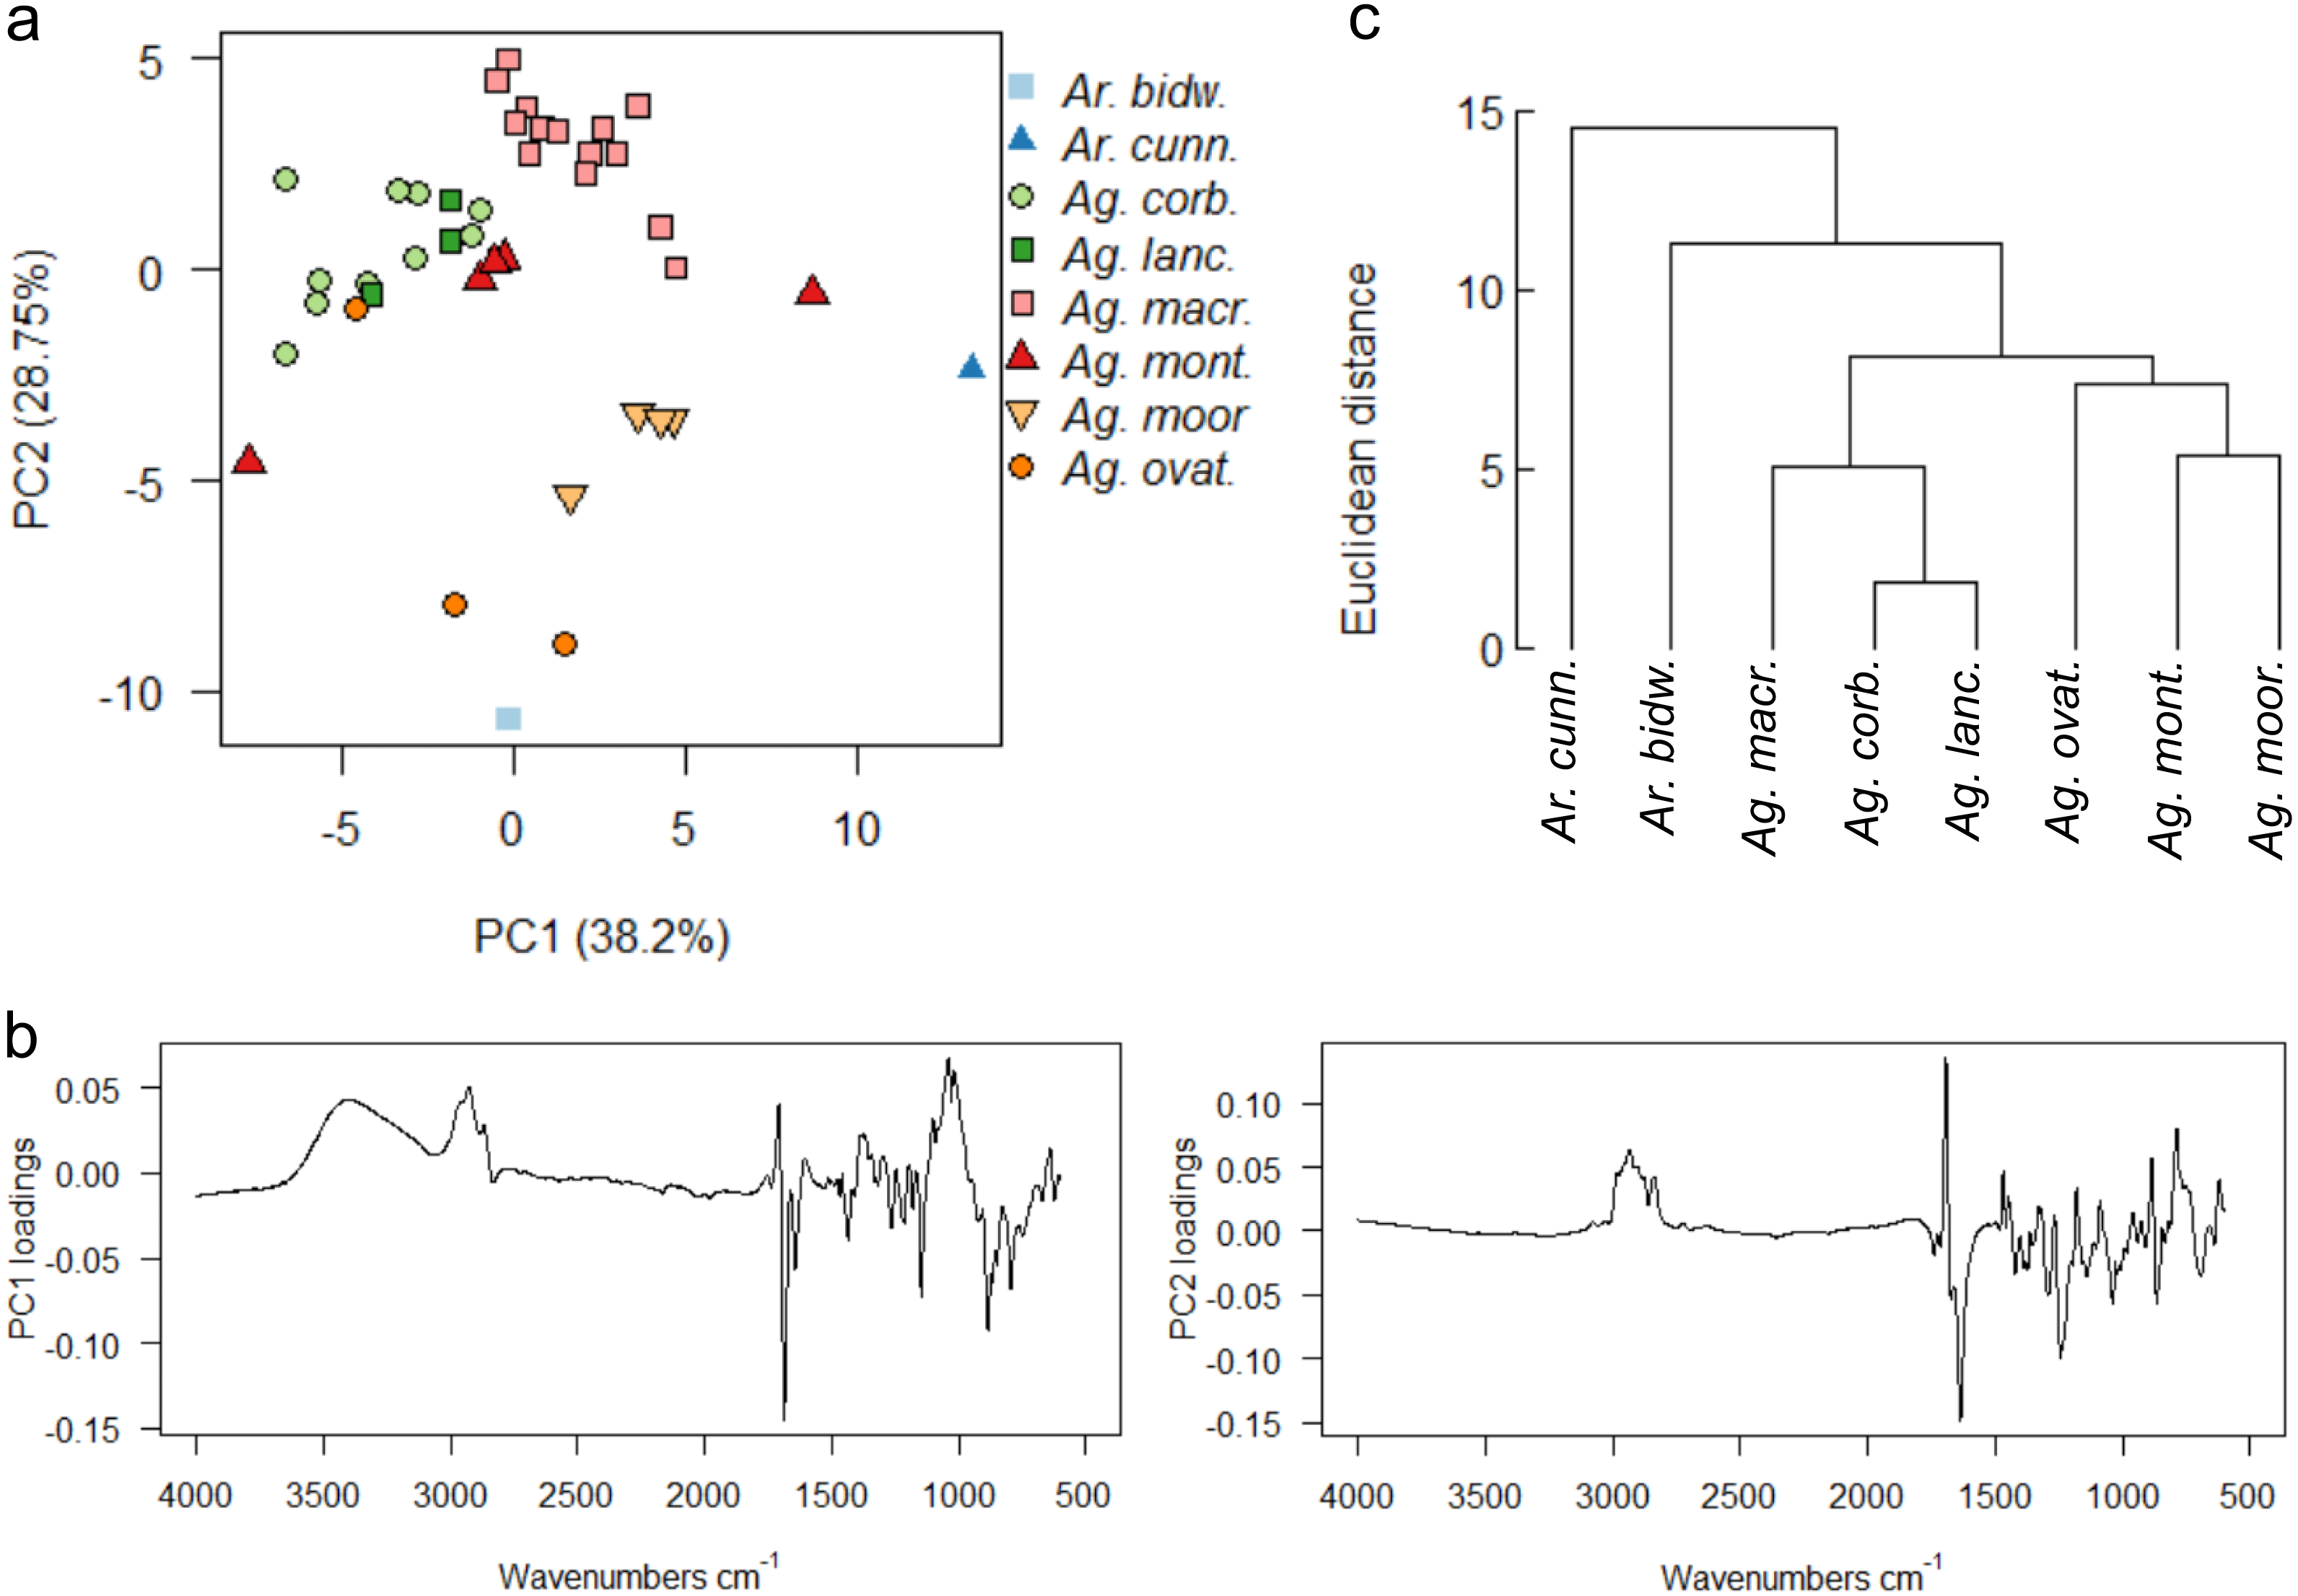
There is no clear split depending on genus for the resin spectra, although the two Araucaria species samples are more different to the bulk of the Agathis samples when using PCA (Fig. 7A). The PC1 loadings show that the peaks at 3,400 cm−1, the triplet of peaks at 2,930 cm−1, 2,870 cm−1 and 2,848 cm−1, plus peaks at 1,722 cm−1, 1,692 cm−1 and 1,030 cm−1, identified above, are key to the spectral differences between the species, whereas the peaks indicating the triplet at 2,930 cm−1, 2870 cm−1 and 2,848 cm−1, and peaks at 1,722 cm−1 and 1,640 cm−1 are key when examining the PC2 loadings (Fig. 7B). However, despite the low sample number, the two Araucaria species resin spectra are more different than the Agathis resin spectra, as detected mean cluster analysis (Fig. 7C).
With PCA, Ag. lanceolata groups consistently within Ag. corbassonii so the spectra cannot easily be distinguished in those species. This may be in part due to there being very few (n = 3) samples of Ag. lanceolata compared to some of the other resins and the variance is because of minor differences in the band intensities across the spectra. All Agathis species’ spectra are prone to some overlapping but do form some species-specific groupings (Fig. 7A). Varying amounts of spread for the different species resin spectra is seen and is not linked to sample size: Ag. montana and Ag. ovata have a large dispersal in their resin spectra despite the low number of samples compared to the more intensively sampled Ag. corbassonii and Ag. macrophylla (Fig. 7A). The dispersion in Ag. montana is due to samples ‘4’ and ‘5’, where both samples show deviation from the other three samples and from each other in the 3,400–2,700 cm−1 (samples numbered in Fig. S5) and in the fingerprint regions (Fig. 8A, Fig. S6A). These differences have been suggested by Tappert et al. (2011) to indicate differing levels of polymerisation based on these variable –OH bands in the resins, so we interpret sample ‘5’ as the most polymerised and sample ‘4’ the least. In Ag. ovata, samples ‘2’ and ‘3’ are similar to each other but differ in the fingerprint region compared to sample ‘1’, with only single peaks at 1,245 cm−1 and 1,148 cm−1 instead of the doublets in sample ‘1’; and an additional accessory peak at 866 cm−1, to the large peak at 886 cm−1 (Fig. 8B, Fig. S6B). Why these differences are present is unknown.
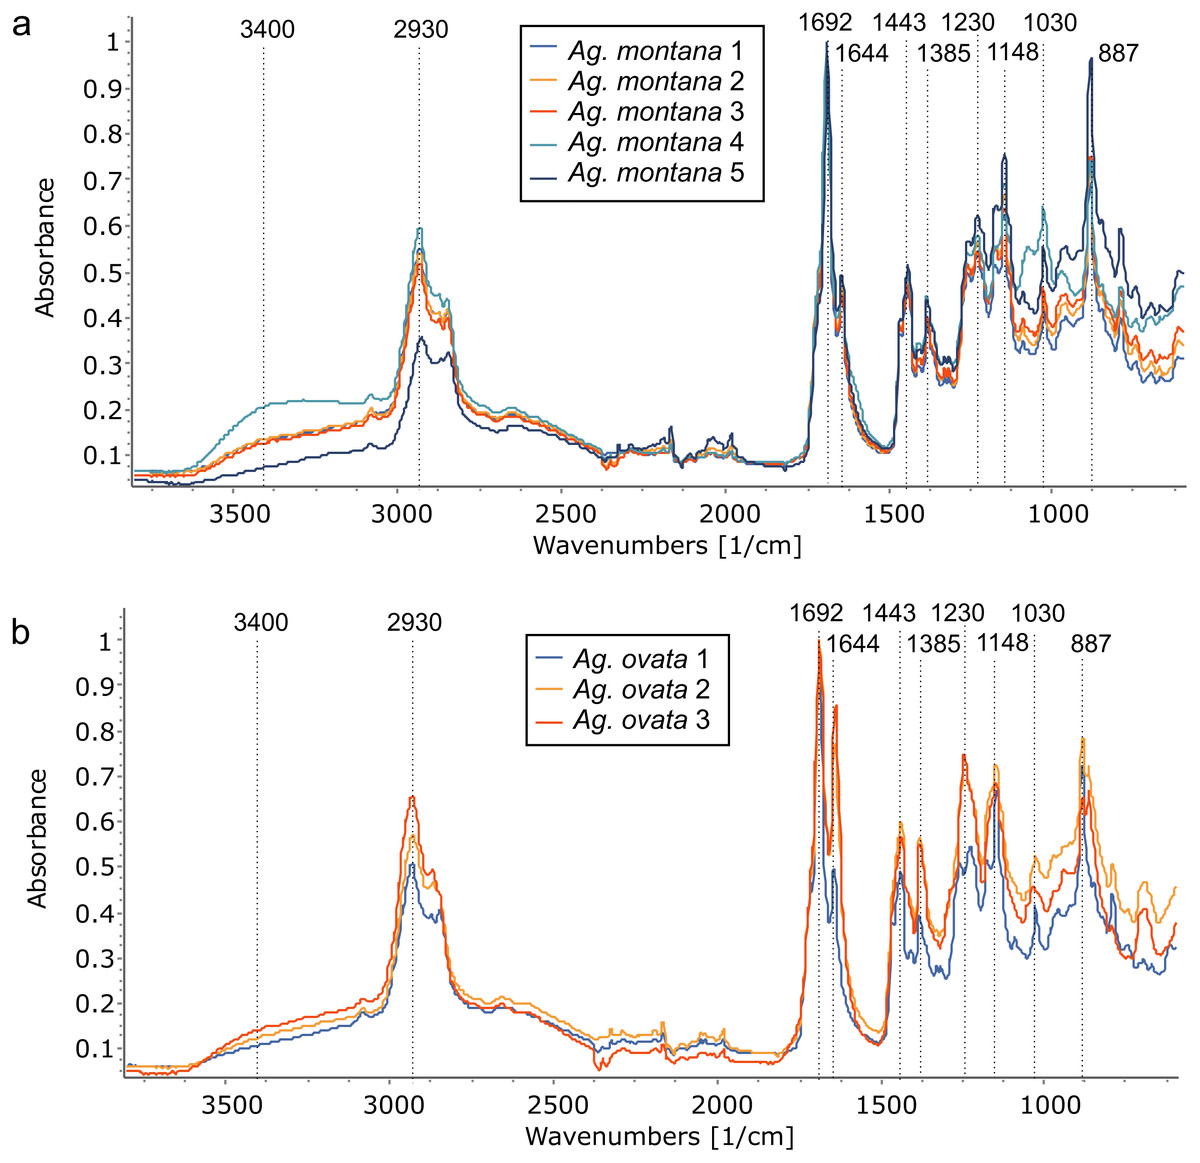
Figure 8: Comparing resin FTIR spectra within Agathis species, all arboretum sourced.
(A) Ag. montana resins show the greatest variation in the 3,400–2,700 cm−1 region indicating differing levels of polymerisation and also in the fingerprint regions. (B) In contrast, the Ag. ovata resins are more similar to each other in the 3,400–2,700 cm−1 region but do differ in the fingerprint regions. Dotted lines indicate key features of the spectra and their wavenumber.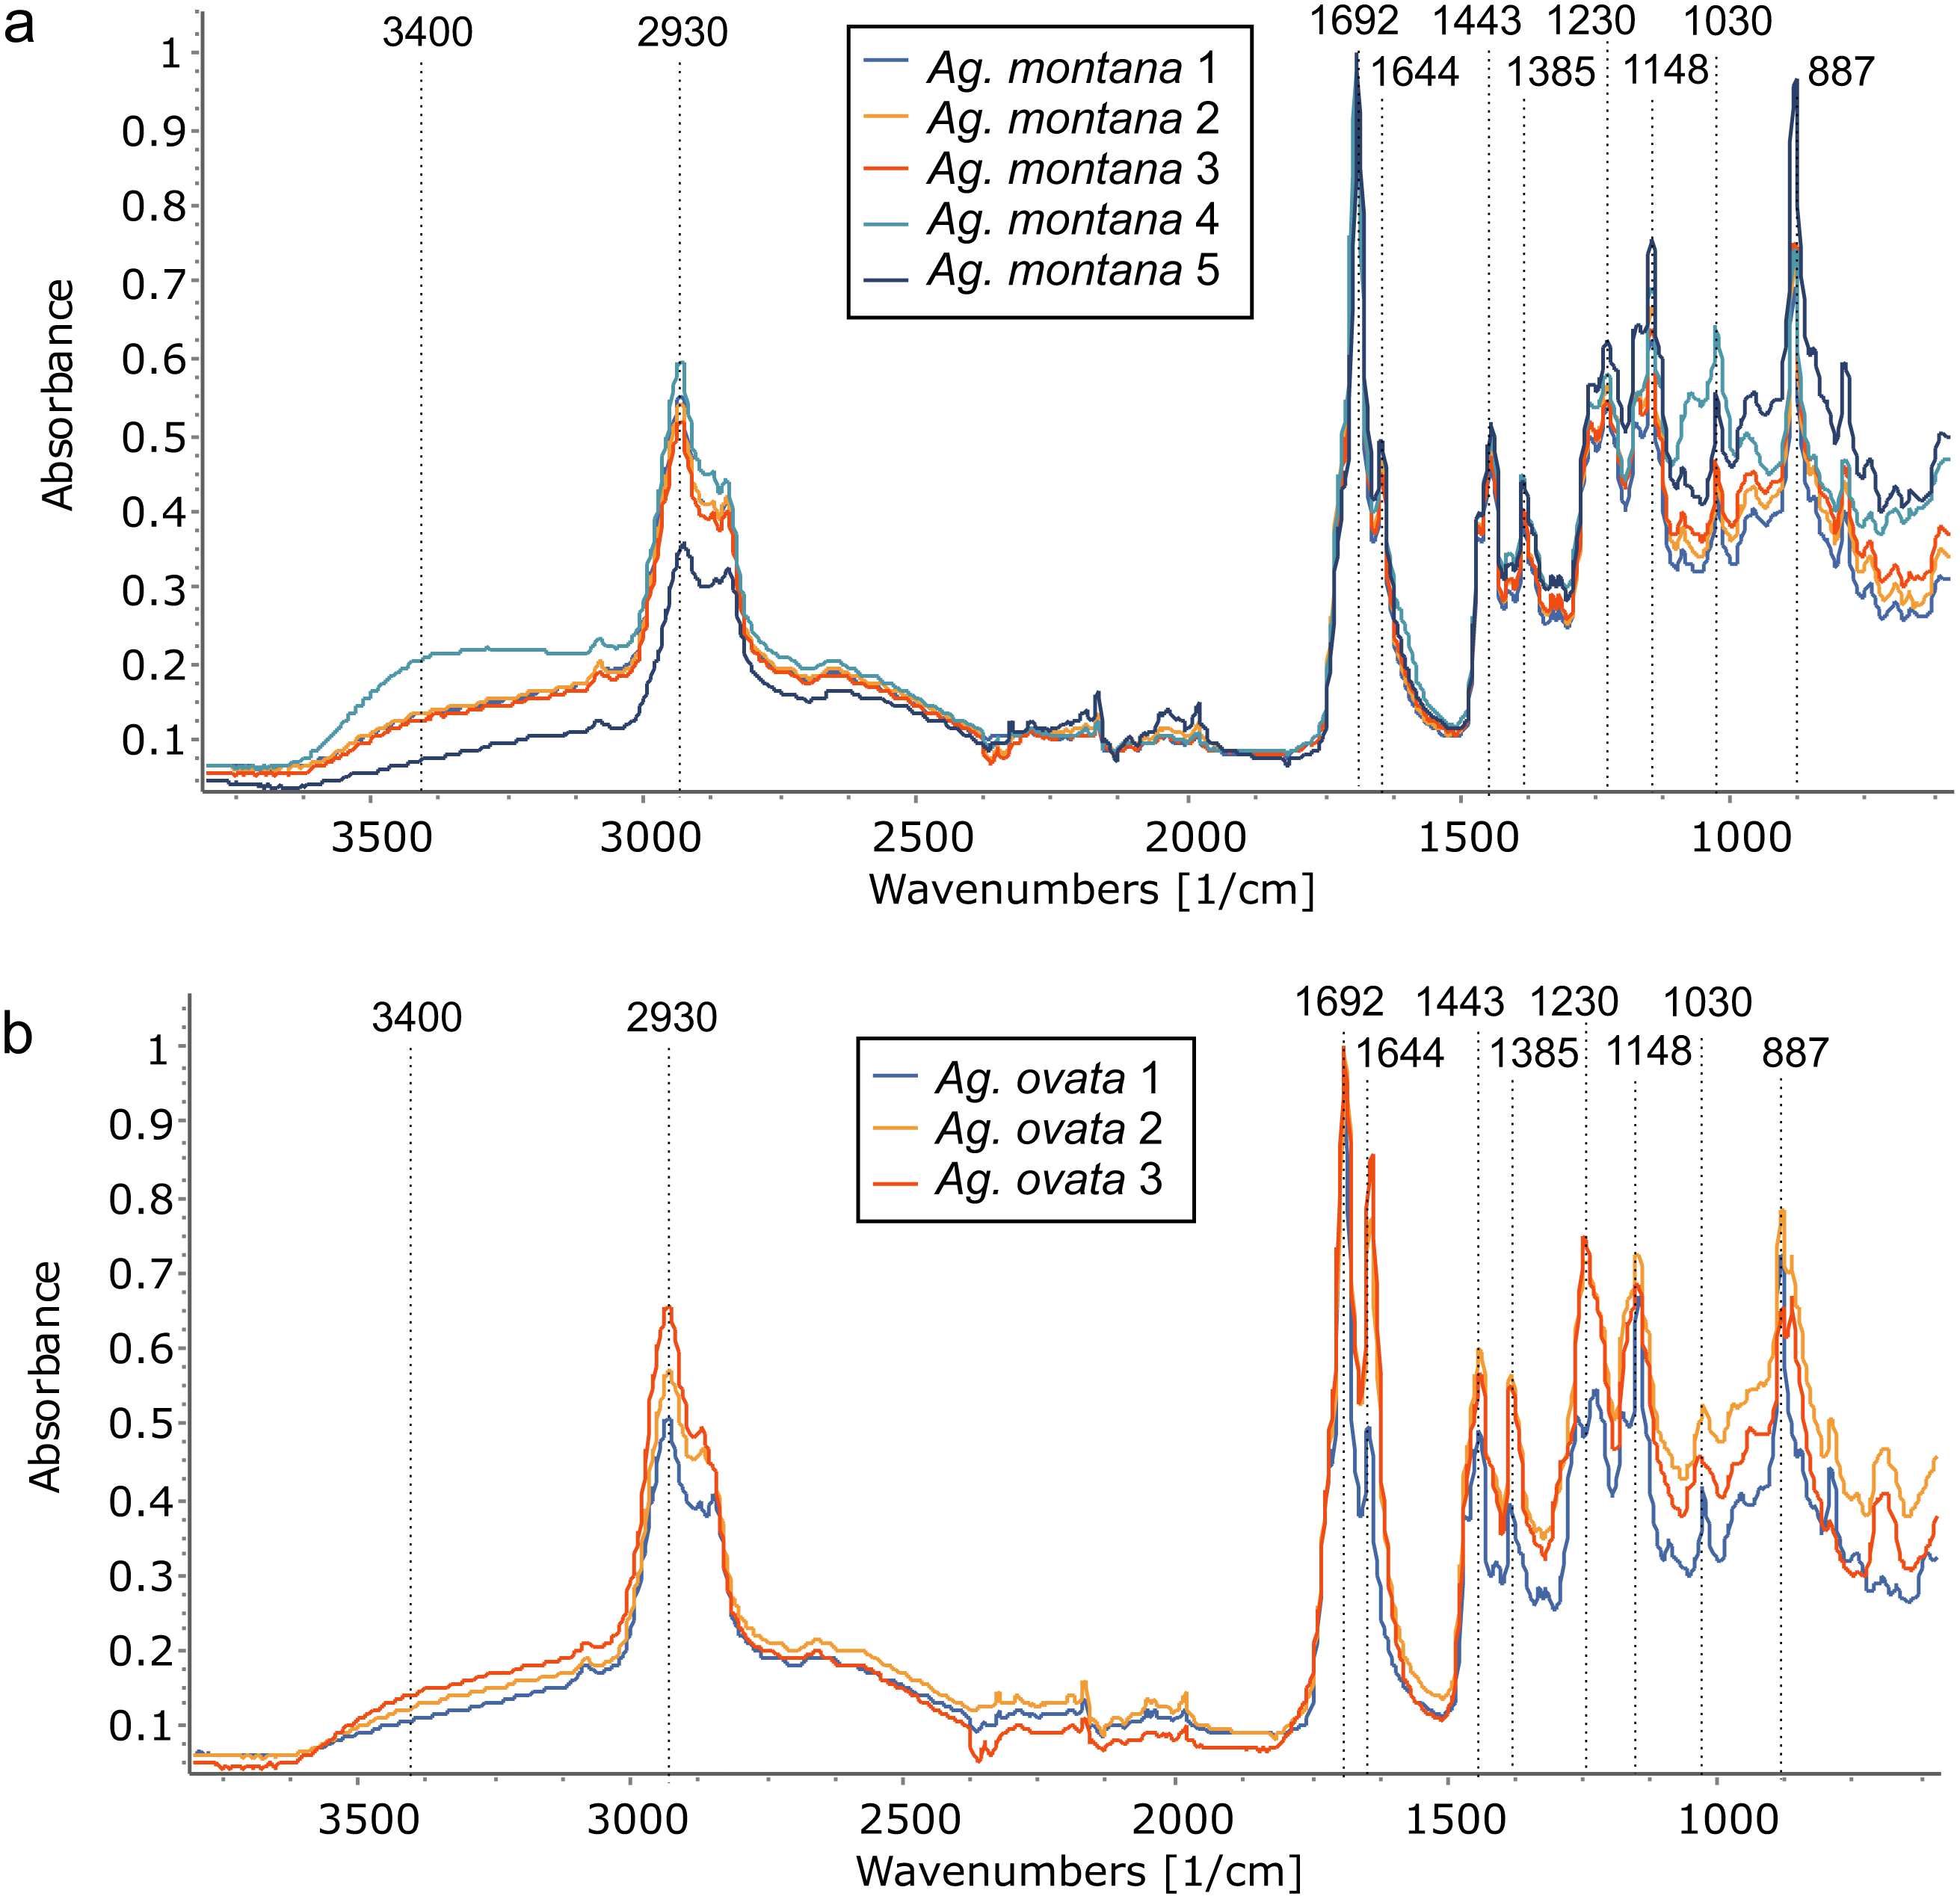
The dispersal across the Ag. corbassonii samples is initially harder to explain as the spectra are all very similar overall; however, the band intensities differ particularly in the fingerprint region, and the main outliers are the samples showing the greatest deviation from the mean. Additionally, the most-outlying sample (‘16’, Fig. S5) has a minor peak instead of a shoulder at 1,720 cm−1 on the main shared peak at 1,690 cm−1, but why is not clear. The dispersal of Ag. macrophylla samples follows a similar pattern in its dispersal as the Ag. corbassonii samples where the spectra are all very similar overall but the band intensities differ particularly in the fingerprint region (Fig. S5). The outliers are the samples with the greatest dispersion, samples ‘2’ and ‘3’ have the lowest values whereas samples ‘8’, ‘10’ and ‘12’ have the highest and this accounts for the dispersion across the grouping (Fig. S5).
To further explore the relationships of the different resins, the derivatives of the spectra were analysed using PCA and taxon-mean spectra cluster analyses (Fig. S7). The first and second derivatives show highly similar distributions of samples in ordination space, which in turn are broadly similar to the PCA on the non-derivitised spectra (Fig. 7A). The PCAs using the derivitised spectra show clearer within-species groupings compared to the non-derivitised spectra, however, with Ag. moorei appearing more distinct from the other Agathis resin spectra. Ag. lanceolata still groups consistently with Ag. corbassonii, nonetheless (Fig. S7A). The taxon-mean spectra cluster analyses show continued support for the distance of the two Araucaria species resins from those of Agathis, although the relationships between the Agathis resin spectra do vary between taxon-mean spectra cluster analyses; compare non-derivitised spectra (Fig. 7C) with the derivitised spectra (Fig. S7B).
As the trees are all grown together from seedlings the environmental or microhabitat differences are assumed to be negligible. The variation in the resin spectra is then at least partly due to the biological variation between the genera and species, within each individual in a species, plus perhaps how ‘old’ a resin was when it was collected (i.e., the degree of polymerisation), and why it was produced. The reasons for the resin exudation in each case was noted before sampling and all derived from some kind of physical damage, so we can likely exclude different resin responses due to differing stimuli i.e., there was no sample exuded as a clear response to insect attack or fire in any tree plot at the arboretum. All the species show varying spectra where more than one sample was available, and the analyses show that in all cases except for Ag. montana this was most likely due to minor individual responses and resin chemistries. Contrastingly, in the Ag. montana samples there is an observable difference thought to be due to differing levels of polymerisation of the resins, which was not detected in the other species.
Wild-collected resins
Wild-collected resins from four species (Ag. lanceolata, Ag. ovata, Ar. columnaris, Ar. nemorosa) from one of four separate localities across the southern portion of Grande Terre were analysed (Fig. 1, black dots). The uncorrected spectra show that more than 92% of the variance was due to four principal components. A baseline correction was applied due to the observed slight baseline drift, which resulted in 91% variance due to four principal components (proportion of variance for PC1: 54.05%, PC2: 19.87%, standard deviation for PC1: 6.25, PC2: 3.79), these baseline corrected data were used for the multivariate analyses shown in Fig. 9. The greatest dispersion is found in Ar. nemorosa even though it only has the second-largest sample size (Ag. lanceolata has the largest in this wild-collected dataset) (Fig. 9A). The dispersion in both species is likely due to several different factors such as: the genetic variation of the source trees and differences in their environments at their different localities. For the Ar. nemorosa resins we also detected a difference in the degree of resin polymerisation (the –OH band at 3,400 cm−1, Fig. S8A) that is not seen in the Ag. lanceolata resins as the variation mostly derives from differences in the fingerprint region (Figs. S8B–S8C). The variance in Ar. nemorosa was mainly due to samples ‘6’ and ‘8’ differing from the remaining samples, with sample ‘6’ being the most polymerized and sample ‘8’ the least. The PC1 loadings indicate that the peaks at 3,400 cm−1 and 1,692 cm−1, 1,640 cm−1, and 886 cm−1, identified above, are key to the spectral differences between the species, whereas the peaks at 1,692 cm−1 and 1,640 cm−1 are key when examining the PC2 loadings (Fig. 9B). The two single sampled species (Ar. columnaris and Ag. ovata) are the most different from the others in this analysis, and this is reflected in the mean taxon cluster analysis (Fig. 9C).
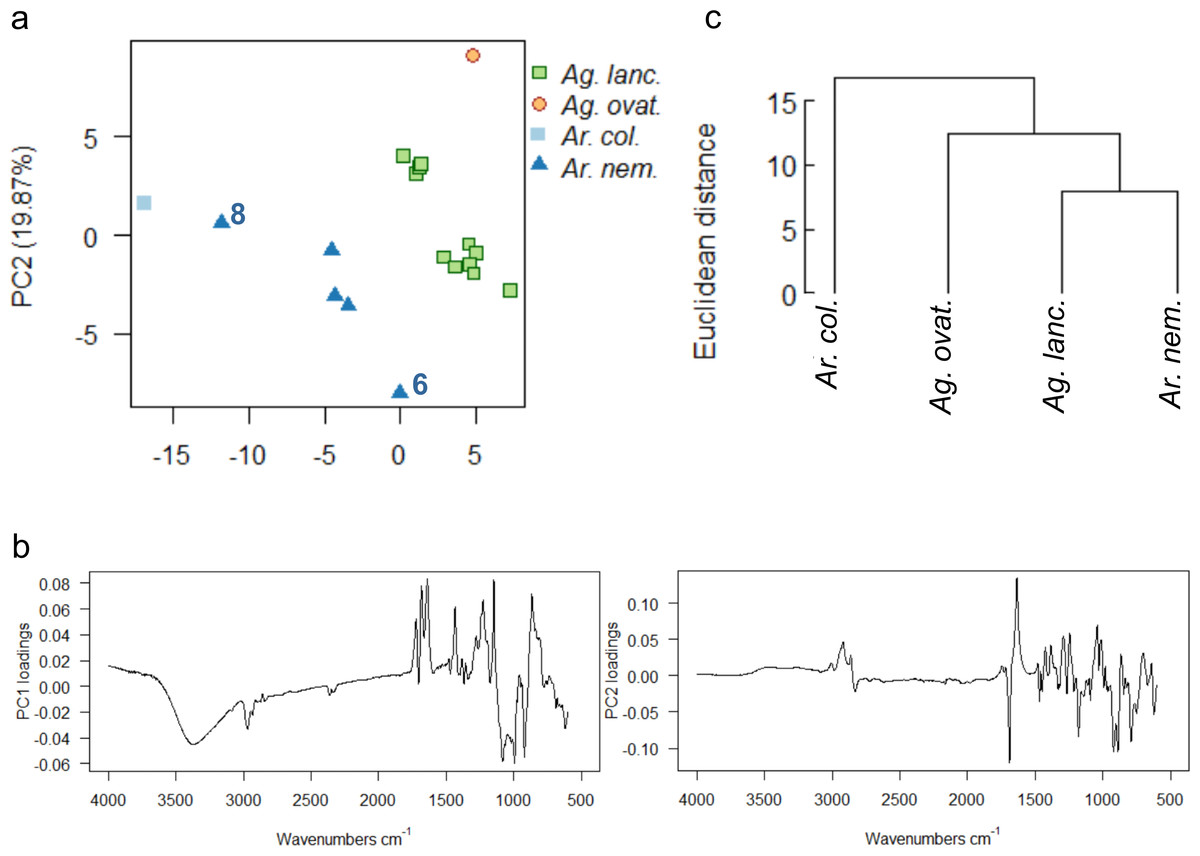
Figure 9: Multivariate analysis of resins sourced from wild plants.
(A) Principal components analysis showing PC1 vs. PC2, numbers 6 and 8 indicate most divergent spectra for Ar. nemorosa; (B) loadings for PC1 and PC2; (C) taxon-mean spectra cluster analysis. Sample size indicated in brackets for each species Ag. lanc. –Agathis lanceolata (3), Ag. ovat. –Agathis ovata (3), Ar. col. –Araucaria columnaris (9), Ar. nem. –Araucaria nemorosa (8).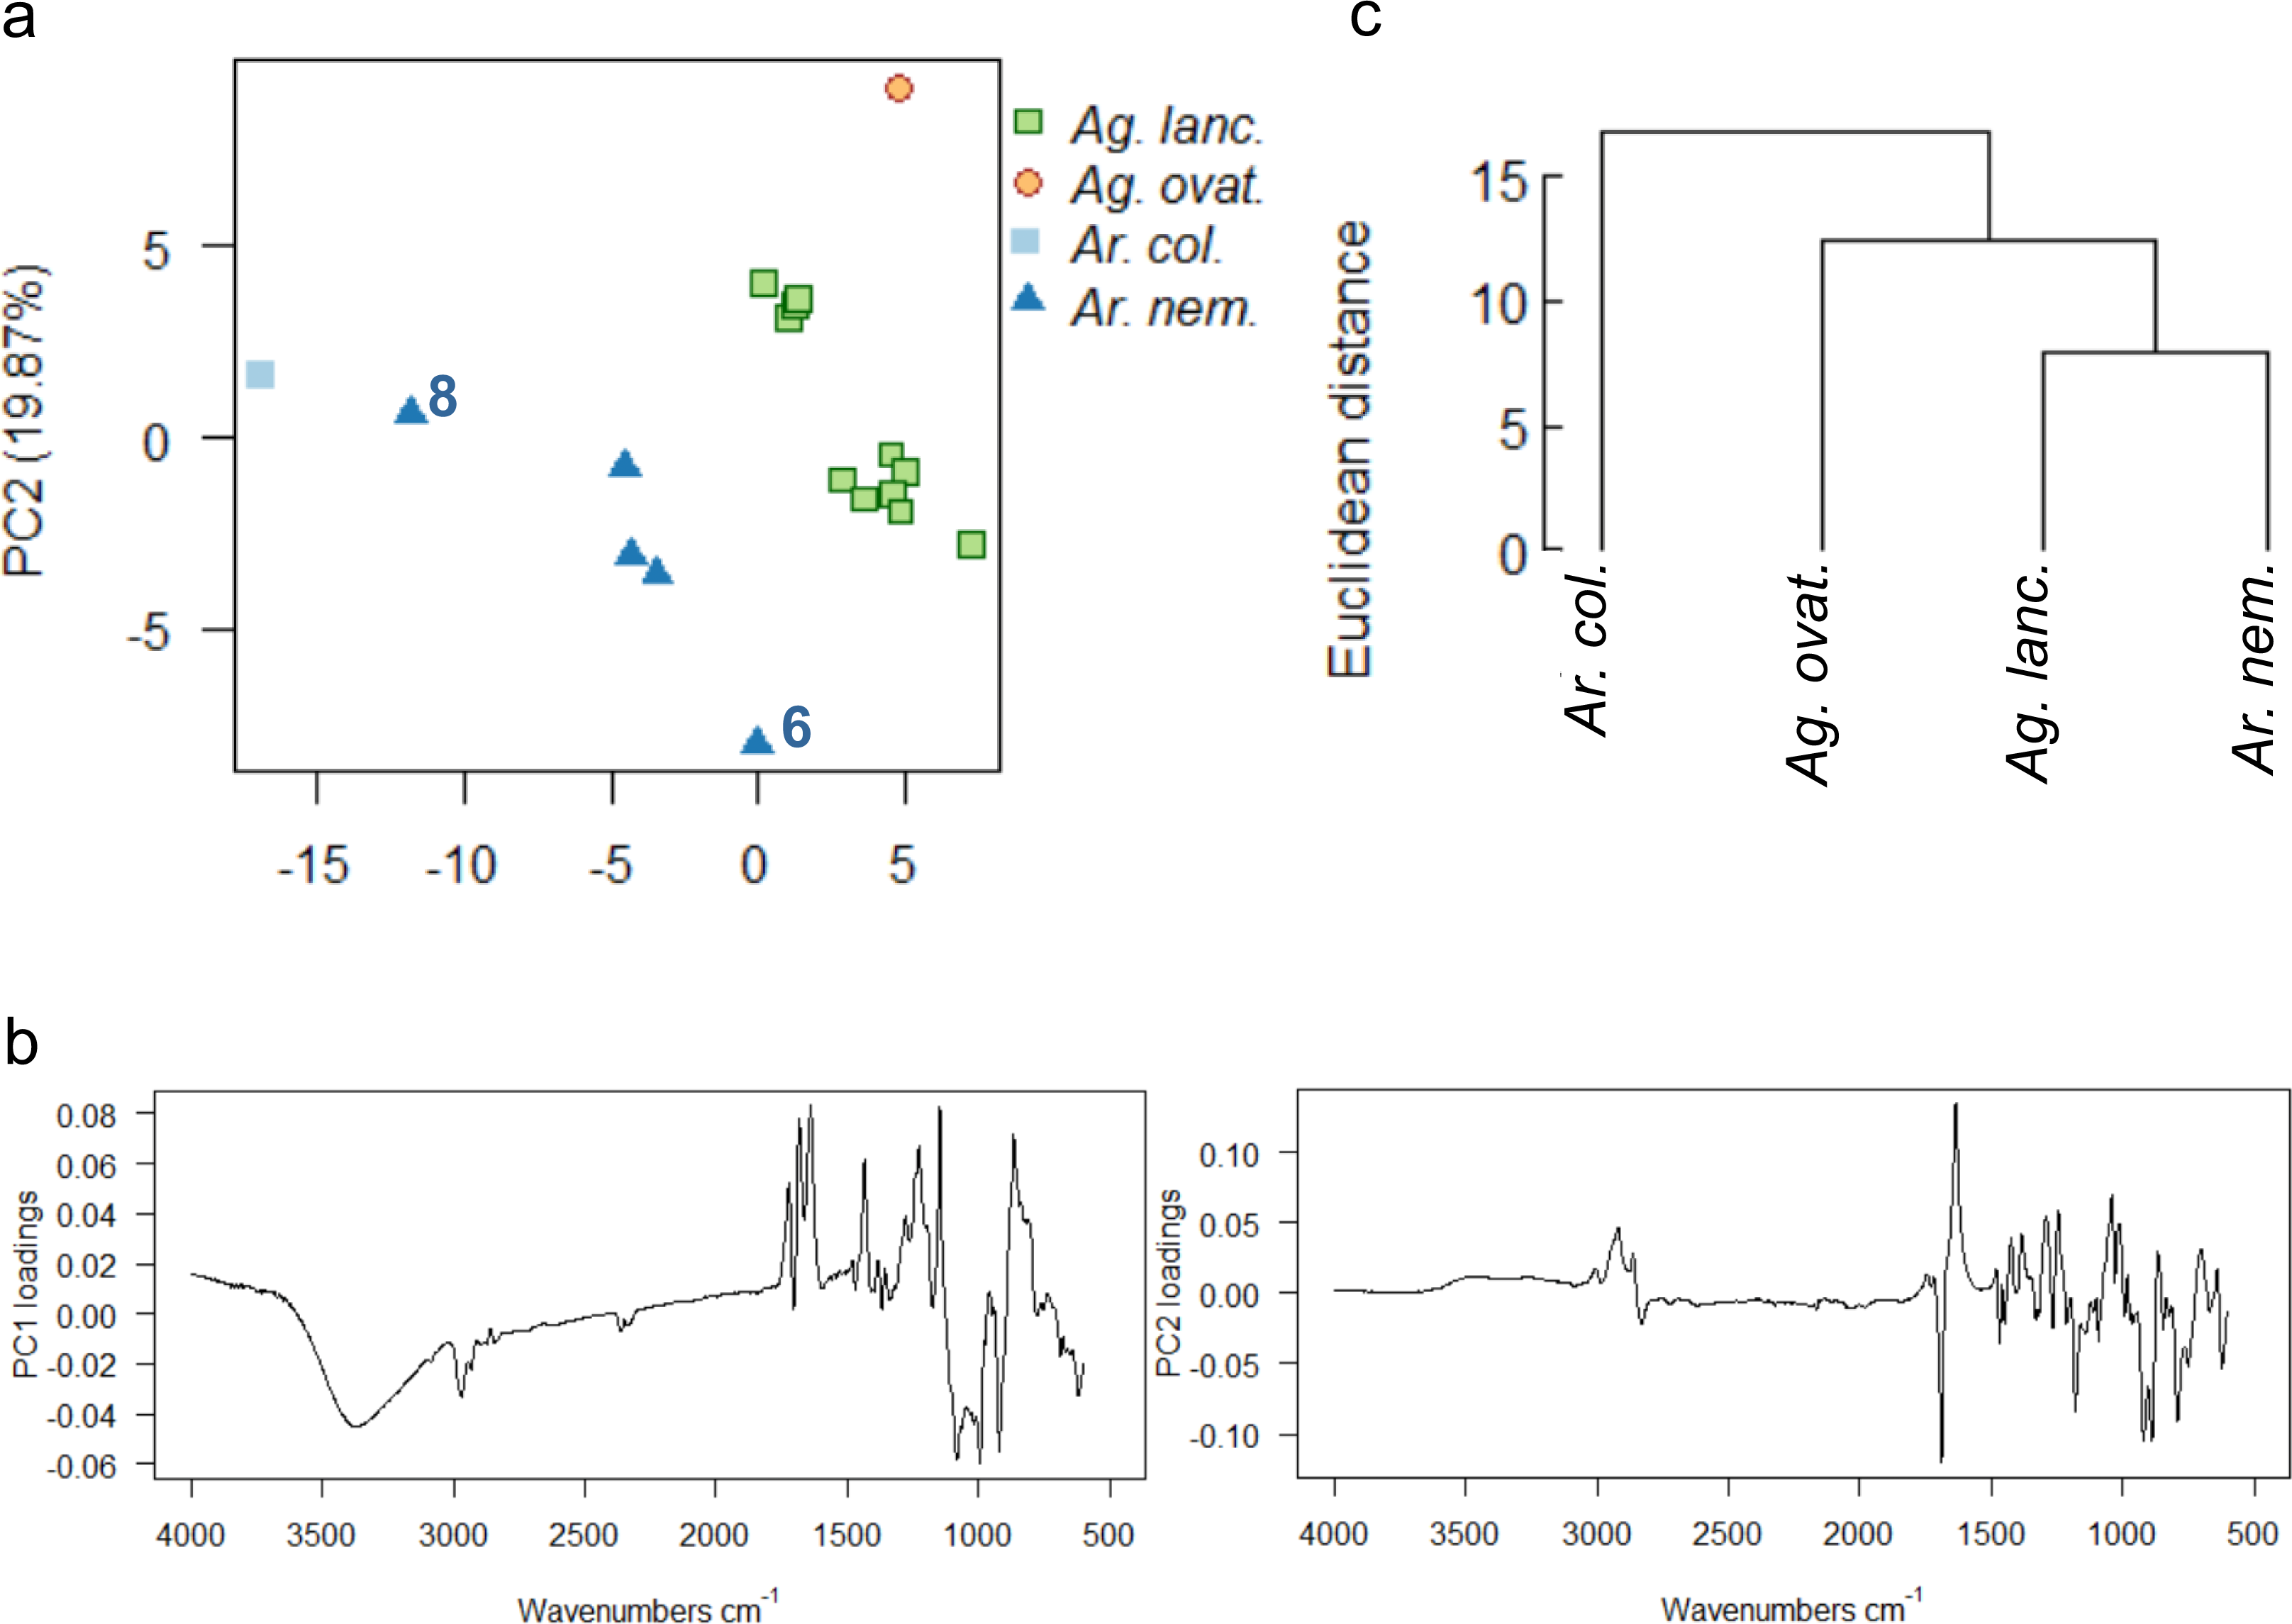
The PCA and taxon-mean spectra cluster analyses of the derivatives of the spectra further clarify the data (Fig. S9). Both derivatives show similar distributions of spectra in ordination space, although the Ar. columnaris spectrum now just groups with the Ar. nemorosa spectra group (Fig. S9A), which is slightly different to the PCA on the non-derivitised spectra (Fig. 9A). The taxon-mean spectra cluster analyses of the derivitised data also show both Araucaria species to be more similar to each other than to either Agathis species (Fig. S9B), which is not seen in the non-derivatised analysis (Fig. 9C).
Comparing arboretum- and wild-derived resins
A final PCA (Fig. 10A) and mean taxon cluster analysis (Fig. 10C) were carried out by adding the wild-sourced Ag. lanceolata and Ag. ovata resins to the arboretum dataset and re-running the analyses . A baseline correction was applied due to the baseline drift, which resulted in 90% variance due to four principal components (proportion of variance for PC1: 36.35%, PC2: 28.61%, standard deviation for PC1: 3.92, PC2: 3.48) and these data were used for Fig. 10.
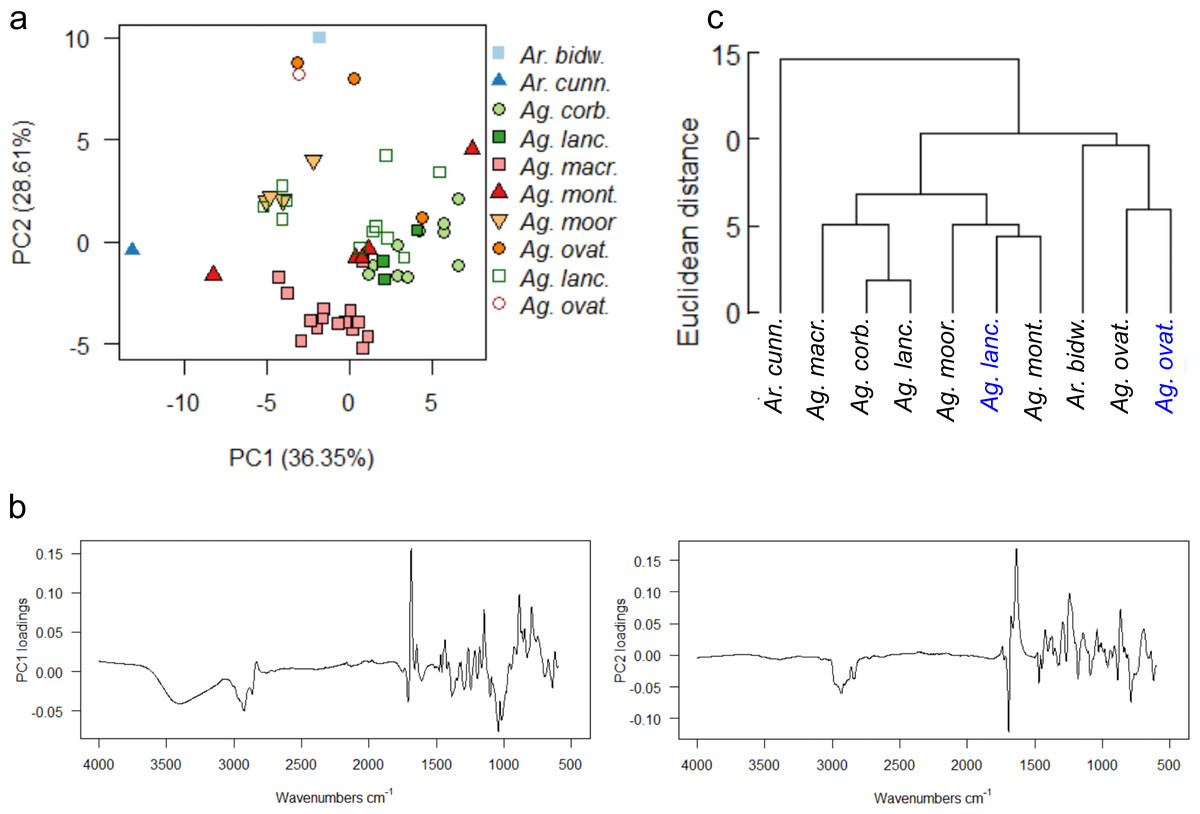
Figure 10: Multivariate analysis of resins sourced from both wild and arboretum plants.
(A) Principal components analysis showing PC1 vs. PC2, closed symbols indicate arboretum-derived resins, open symbols wild-derived; (B) loadings for PC1 and PC2; (C) taxon-mean spectra cluster analysis, arboretum sourced samples in black, wild sourced in blue. Taxa and sample numbers as in Figs. 7 and 9.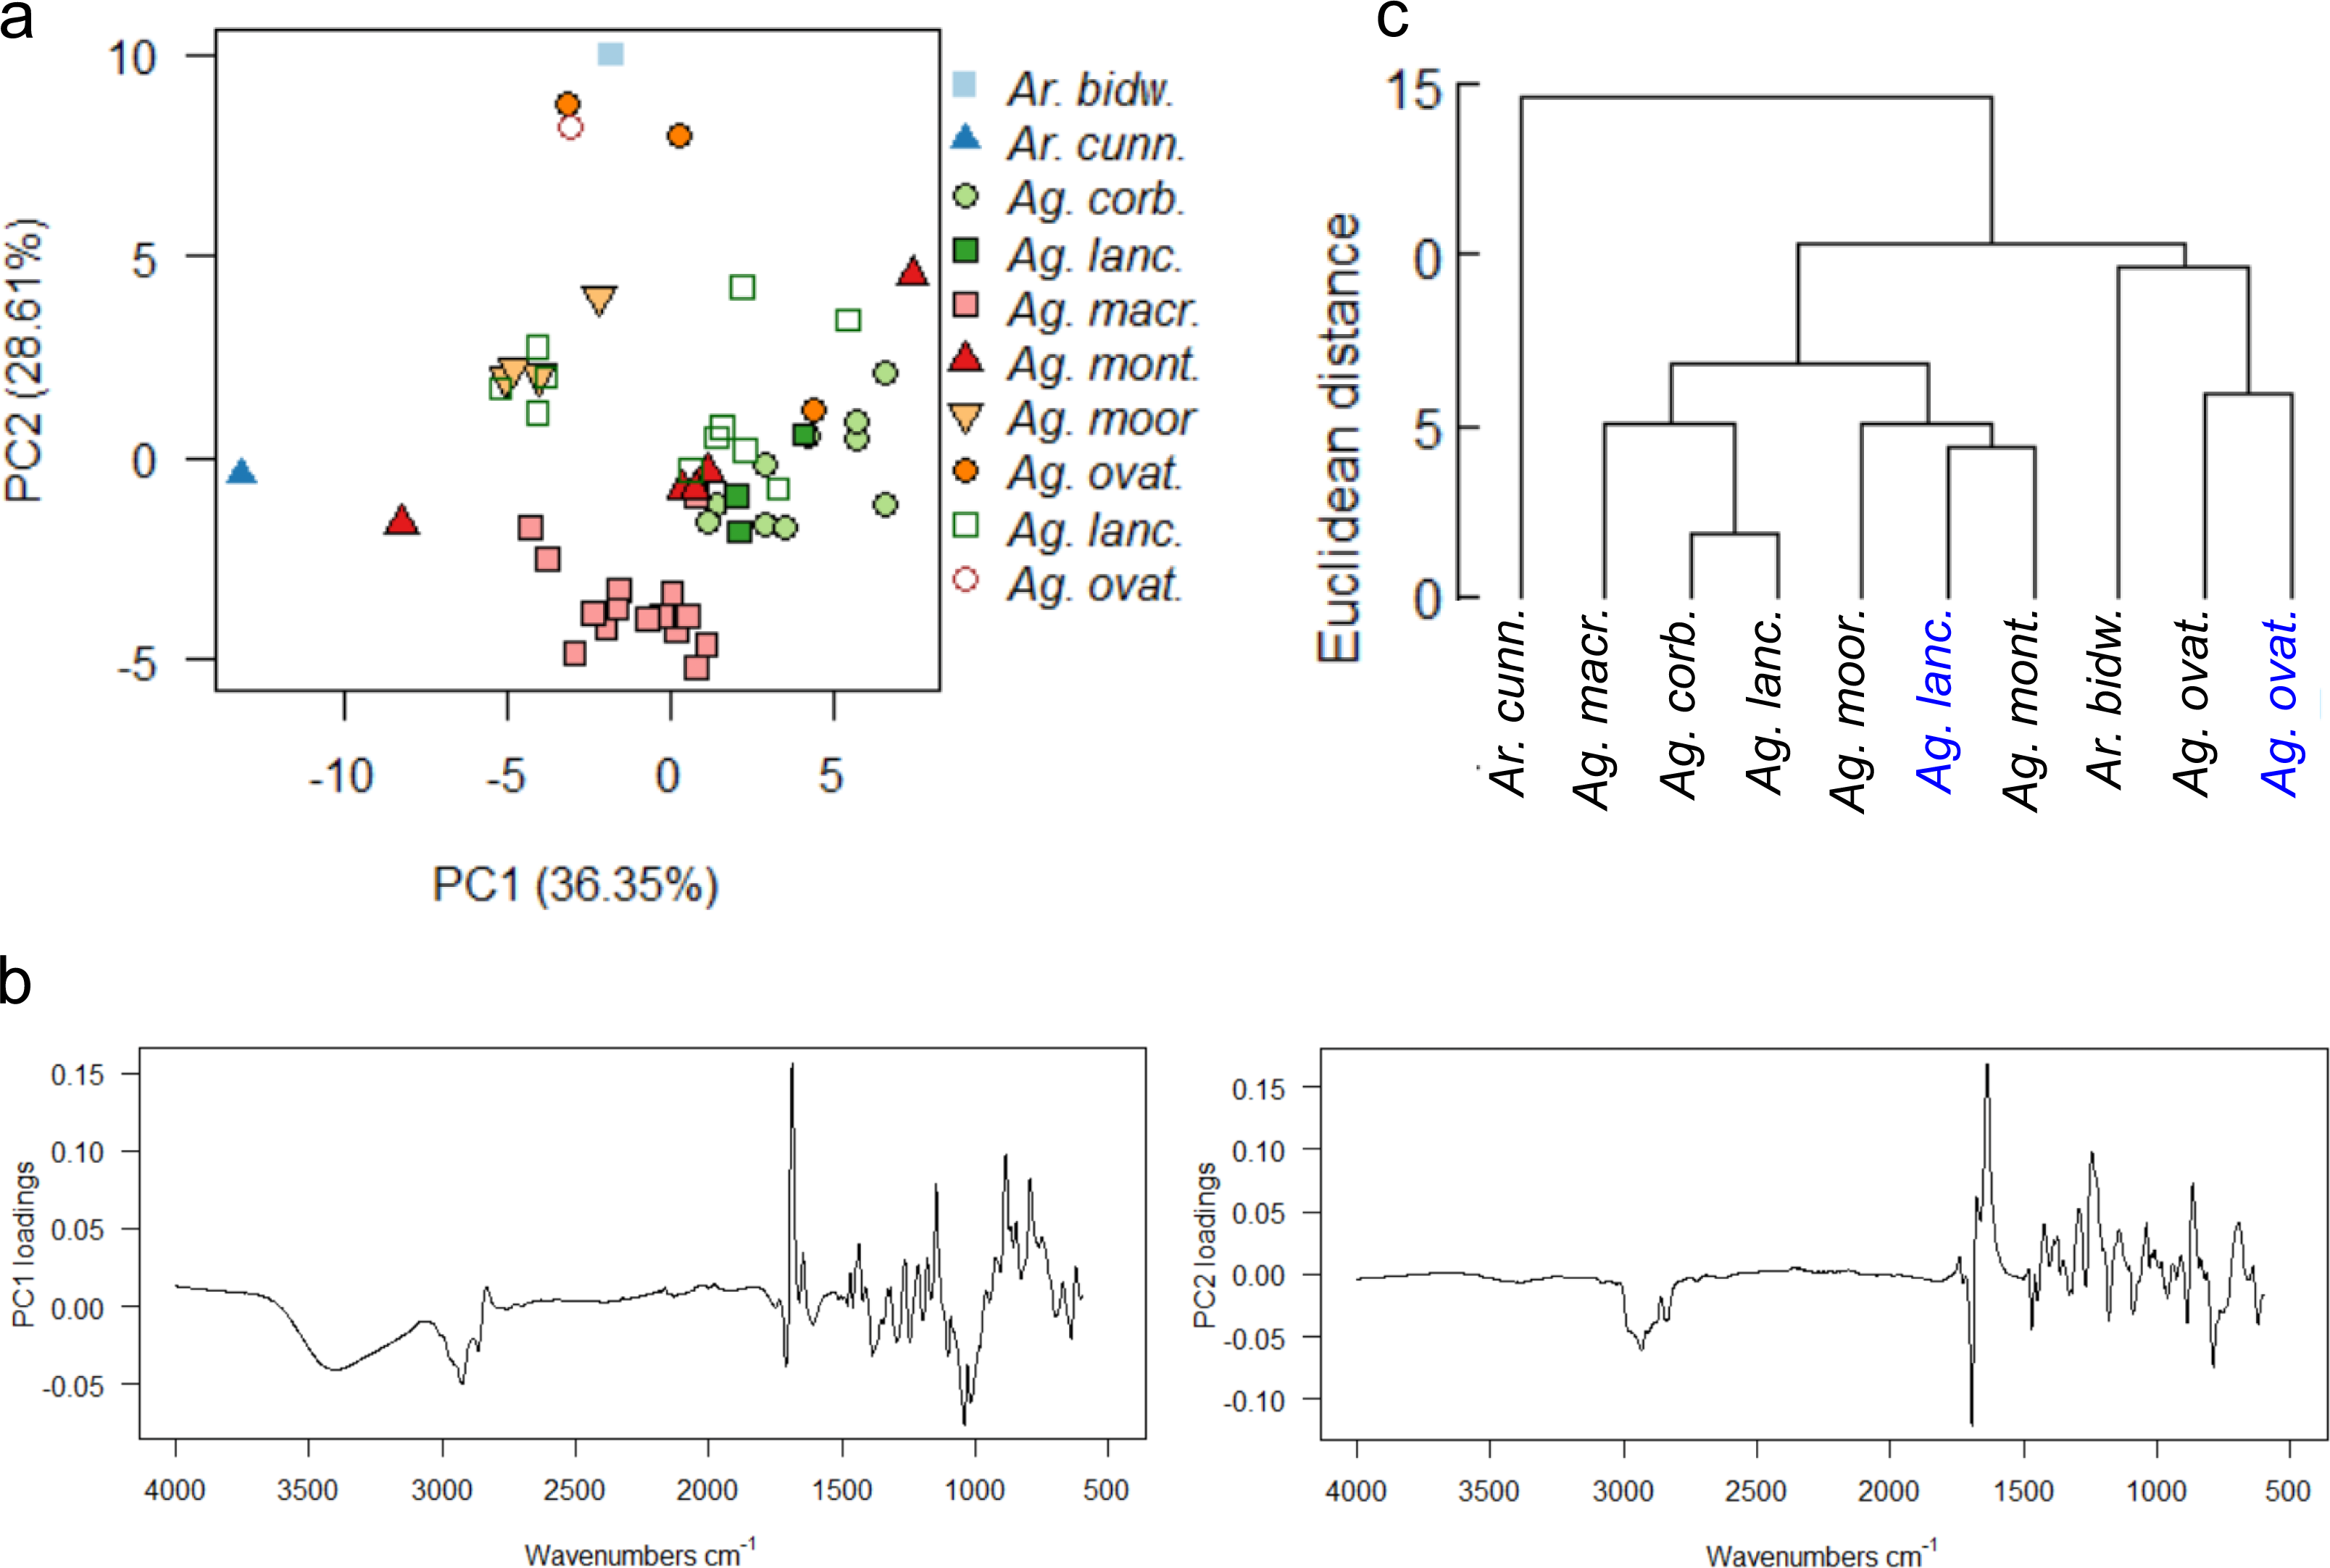
The PCA shows that the sole wild sourced Ag. ovata resin groups with the arboretum sourced Ag. ovata resins, but that the wild sourced Ag. lanceolata resins have much more dispersion than the arboretum sourced resins (Fig. 10A). This is likely due in part to the increased availability of samples for this species, but this also may be reflecting other conditions affecting the resin chemistries i.e., genetic variation of the source trees and differences in their environments at their different localities, but not the degree of resin polymerisation as the spectral differences are seen in the fingerprint region not the typical –OH band i.e., 3,400 cm−1 (Figs. S9B–S9C). The PC1 loadings indicate that the peaks at 3,400 cm−1 and 1,692 cm−1, identified above, are key to the spectral differences between the species, whereas the peaks at 1,692 cm−1 and 1,640 cm−1 are key when examining the PC2 loadings (Fig. 10B). The mean taxon cluster analysis (Fig. 10C) shows that the different sources of resin spectra do not pair for Ag. lanceolata, which is expected when looking at the PCA, and is linked to the large variance observed in the wild-sourced resins overall, and how much more variable they are compared with the arboretum-sourced Ag. lanceolata resins.
The PCAs of the derivatised data are very similar to each other, but have slightly different distributions of samples in ordination space (Fig. S10A), when compared with the non-derivatised data (Fig. 10A). However, the same pattern of distributions for the Ag. ovata and Ag. lanceolata resins are seen, with the wild sourced Ag. lanceolata resins having far more dispersion than the Ag. lanceolata resins sourced from the arboretum (compare Figs. S7A, S9A, S10A). The mean taxon cluster analysis (Fig. S10B) show that the different sources of resin spectra do not pair for Ag. lanceolata, and in fact pair with Ag. montana resins sourced from the arboretum. This reflects the large variance observed in the wild-sourced Ag. lanceolata resins and that they are more variable than the arboretum-sourced Ag. lanceolata resins.
Discussion
Araucariacean exudate determination using FTIR-ATR spectroscopy
FTIR spectroscopy is shown here to be able to distinguish three types of exudate found across different species of Araucaria: gums, gum resins and resins; whereas only resins and gums in Araucariaceans have been described previously (e.g., Tappert et al., 2011). Resins and gums are the easiest to distinguish using FTIR-ATR spectroscopy (Fig. 5, Table 2) as there are distinct bands that indicate their presence as noted by Tappert et al. (2011). Gum resins, as the name suggests, are a mixture of the two types sharing both sets of characteristic bands (Fig. 5, Fig. S1). The Agathis species exudates tested here are all resins, whether endemic to New Caledonia or not (Table 1, Fig. 4). The Araucaria species show a mixture of exudate types (Table 1, Fig. 5, Fig. S1), although the exudates of Ar. luxurians and Ar. muelleri (both New Caledonian endemics) were found to be only gum resins (Table 1, Fig. S3). This may be due to the low sampling, one tree per species, as further samples may show additional exudate types for these two species.
Besides reports of resin from Araucaria species (e.g., Seyfullah, Sadowski & Schmidt, 2015; Tappert et al., 2011; Wolfe et al., 2016, see Table 1), there have also been reports of gums and gum resins sometimes from the same species, although not all using FTIR analyses (see Table 1, Anderson & Munro, 1969; Lambert et al., 1993; Tappert et al., 2011). Care is therefore needed then when using exudates from Araucaria to be sure which type they are, and we do not yet have a full picture of the exudates across the genus.
The mixture of exudate types even within a single species is unexpected, particularly when a resin and an apparently pure gum (not just a gum resin) are present, e.g., in Ar. nemorosa (Fig. 5B) and little is known about how these exudates are produced. In the resinous angiosperm Hymenaea, the gum in the gum resins is thought to originate from the schizolysigenous development of secretory tissues, i.e., the lysis of secretory cells and their subsequent breakdown mixing in with the resin (Langenheim, 2003). Araucariaceans have resinous shoots and leaves, but do not have radial resin canals in their wood and do not appear to form traumatic resin canals, unlike e.g., Pinus (Heady, Banks & Evans, 2002; Esteban et al., 2004). They instead share resin plugs that can be common in tracheids adjacent to medullary rays in the wood, and the ray cells are often resin-filled, leading Heady, Banks & Evans (2002) to believe that the ‘resin of resin plugs is exuded into tracheids through intervening cross-field pits in adjacent rays’. Hudgins, Christiansen & Franceschi (2004) showed that two Araucaria species have dormant axial resin ducts within the secondary phloem (near the bark surface) that could become activated to produce resin, unlike Pinaceae and Podocarpaceae. Perhaps this difference in exudate producing anatomy allows the production of the varying exudate chemistries in Araucaria, although further research is needed to test this. The gum resins of the few Araucaria species profiled are thought to have very similar gum components and it has been suggested that all gymnosperm-derived gums contain 3-0-methylrhamnose as a component (Anderson & Munro, 1969).
Fossil resins (ambers) are thought to retain indicators or biomarkers (e.g., carbon isotopes, see McKellar et al., 2011 but also Dal Corso et al., 2017) of the past environment into which they were exuded. This means that ambers are considered as having potential as a palaeoenvironmental proxy. However, how much of these original environmental or biological signals are retained in amber is unknown. This is because it is currently undetermined what signals are contained in the exuded resin prior to its maturation to amber and how much variability there is in resin and therefore in amber chemistries even within the same species. The natural variability of modern resin from the araucariaceans is a model for this work as many ambers are conifer derived, and some ambers are from araucariacean sources.
It was previously thought that the only liquid plant exudates that could be found in the fossil record were resins preserved as ambers. There are, however, only two cases to date of other fossil exudates being recovered: latex filaments (Simoneit, Otto & Wilde, 2003), and a plant gum (Roberts et al., 2020). These extremely rare occurrences suggest that more testing of fossil exudates is needed to ascertain their actual affinity, rather than relying solely on visual inspection, as the gum certainly appeared as a resin (see Roberts et al., 2020).
Intergeneric, inter- and intraspecific variability of resins
There was no clear difference between the resins of the two genera from the arboretum, but there was in the wild samples. Interspecific differences were most clear when analyzing the arboretum-sourced resins, although there were some overlapping groups (Ag. lanceolata and Ag. corbassonii, Fig. 7A). The variance was mostly due to variation in the fingerprint regions suggesting biological interspecific and intraspecific differences as the trees were all the same age and grown together at the arboretum. However, following Tappert et al. (2011), Ag. montana spectra from the arboretum are the exception as they show an additional variation in their degree of polymerisation, (Fig. 8A), explaining their greater observable variance (Fig. 7A). These analyses show that within a species grown in arboretum plots (sharing a microhabitat and microclimate) the resins have natural chemical variation seen as dispersion within the species grouping in the PCAs. When we focus on the samples with no effects from the degree of polymerisation it is apparent that this is not the only source of variation seen, as there is still dispersion in the PCA for other species. This means other natural intraspecific sources for this variation (not the degree of polymerisation) are present in the resins, and that varying interspecific differences are also seen by the groupings, but they may overlap (Figs. 7A, 8, Fig. S6A).
The fewer wild-sourced resins also showed a large amount of variance (Ag. lanceolata and Ar. nemorosa, Fig. 9A). For Ar. nemorosa the differences in the spectra (Fig. S8A) are linked to the degree of polymerisation following Tappert et al. (2011), plus natural intraspecific variations in resin chemistry. The intraspecific variation was largest in the in situ wild Ag. lanceolata sourced resins (greater PCA dispersion Fig. 9A, spectra shown in Figs. S8B–S8C) than the arboretum sourced Ag. lanceolata resins (Fig. 7A). Peak intensity differences in the fingerprint region explain this variance (Fig. S8C), so we interpret these as intraspecific differences. Conversely, geographic differences between the wild-derived and arboretum-derived Ag. lanceolata resins (Fig. 10A) are unlikely as the two areas are not so far apart (see Fig. 1). It is possible that habitat differences in the wild-sourced resins may at least partly underlie some of the differences in their fingerprint regions as these are more extreme than those seen in the arboretum-sourced resins (Fig. 10A). The wild trees were not artificially planted and cared for and so are more likely to be affected by, and respond to, their local environment individually. This may account for the additional variance/intraspecific variation observed in the wild-sourced resins on top of that already observed in the Ag. lanceolata resins from the arboretum (Fig. 10A).
This strongly suggests that in order to capture a good representation of the chemical variation in a species resin spectra, multiple well-documented sources of a species resin should be analysed and compared. The degree of polymerisation is one factor in the variation, but can be identified when comparing the spectra, particularly in the –OH bands. However, other biological and ecological factors underlying this natural chemical variation are also present. The full picture of the causes of chemical variation in resins is only in its infancy (see McCoy et al., 2021; Seyfullah et al., 2021). The implication is then that for ambers (fossil resins) in the fossil record there could also be more variation in their spectra, so testing of samples should include as many samples as is feasible to generate a better representation of the amber spectra for a deposit or an amber variety.
Conclusions
FTIR-ATR can now be used to identify three types of plant exudate: gum, gum resins and resins as the spectra can be differentiated. Resins from the same species in the same microhabitat have natural chemical variation. Some of the variation can result from the degree of resin polymerisation, but this is not the only source of variation. Wild sourced resins have greater natural chemical variation than the arboretum sourced ones for the same species. This has strong implications when sampling both modern and fossil resins: multiple samples should be analysed, where possible, to give a more accurate picture of the natural chemical variation present and how this may or may not overlap with other resin chemistries.