
PGM5: a novel diagnostic and prognostic biomarker for liver cancer
- Published
- Accepted
- Received
- Academic Editor
- Vladimir Uversky
- Subject Areas
- Bioinformatics, Gastroenterology and Hepatology, Oncology
- Keywords
- Liver cancer, Diagnosis, Prognosis, Data mining, PGM5
- Copyright
- © 2019 Jiao et al.
- Licence
- This is an open access article distributed under the terms of the Creative Commons Attribution License, which permits unrestricted use, distribution, reproduction and adaptation in any medium and for any purpose provided that it is properly attributed. For attribution, the original author(s), title, publication source (PeerJ) and either DOI or URL of the article must be cited.
- Cite this article
- 2019. PGM5: a novel diagnostic and prognostic biomarker for liver cancer. PeerJ 7:e7070 https://doi.org/10.7717/peerj.7070
Abstract
Background
Liver cancer is a common malignancy and a significant public health problem worldwide, but diagnosis and prognostic evaluation remain challenging for clinicians. Metabolic reprogramming is a hallmark of cancer, and we therefore examined the diagnostic and prognostic value of a metabolic enzyme, phosphoglucomutase-like protein 5 (PGM5), in liver cancer.
Methods
All data were from The Cancer Genome Atlas database. R and related statistical packages were used for data analysis. Hepatic PGM5 expression was determined in different groups, and the chi-squared test and Fisher’s exact test were used to determine the significance of differences. The pROC package was used to determine receiver operating characteristic (ROC) curves, the survival package was used to for survival analysis and development of a Cox multivariable model, and the ggplot2 package was used for data visualization.
Results
PGM5 expression was significantly lower in cancerous than adjacent normal liver tissues, and had modest diagnostic value based on ROC analysis and calculations of area under the curve (AUC). Hepatic PGM5 expression had positive associations with male sex and survival, but negative associations with advanced histologic type, advanced histologic grade, advanced stage, and advanced T classification. Patents with low PGM5 levels had poorer overall survival and relapse-free survival. PGM5 was independently associated with patient prognosis.
Conclusion
PGM5 has potential use as a diagnostic and prognostic biomarker for liver cancer.
Introduction
Liver cancer is one of the most common malignancies, and patients typically experience poor prognoses (Llovet et al., 2016). According to global cancer statistics for 2018 (Bray et al., 2018), liver cancer is the sixth most common cancer and the fourth leading cause of cancer deaths, with about 841,000 new cases and 782,000 deaths each year. Although there have been improvements in surgical resection, transplantation, radiofrequency ablation, and chemical embolization, and therapy with sorafenib (an inhibitor of multiple tyrosine kinases) is now available, patient prognosis has only modestly improved in recent years. Histological parameters, including histological subtype and grade, together with TNM classification, are mainly used for patient evaluation and prediction of prognosis. However, accurate prediction of prognosis remains challenging for clinicians. There is an urgent need for novel biomarkers to improve diagnostic accuracy and better predict prognosis.
Metabolic reprogramming is a hallmark of all cancers. Phosphoglucomutase-like protein 5 (PGM5, also called aciculin), which metabolizes glucose-1-phosphate into glucose-6-phosphate, may play an important role in liver cancer. In the past ten years, studies of PGM5 have focused on its role in muscle tissues, and reported its associations with the cytoskeletal proteins dystrophin and utrophin (Belkin & Burridge, 1994; Belkin & Burridge, 1995a; Belkin & Burridge, 1995b). Several additional studies identified its chromosome fusion site and relationship with telomeres (Edwards et al., 1995; Fan et al., 2002). Recent studies used cell transformation to investigate its expression and pathogenic role in bladder and colorectal cancers (Li et al., 2018; Uzozie et al., 2017).
However, no studies have yet reported the clinical significance, diagnostic value, and prognostic value of PGM5 in patients with liver cancer. We examined the hepatic expression of PGM5 in patients with liver cancer, determined its association with clinical parameters, calculated its diagnostic value using receiver operating characteristic (ROC) curves, and performed survival analysis and Cox modeling to evaluate its effect on prognosis.
Materials & Methods
Data mining of a public database
Data mining was used to obtain raw data on patients with liver hepatocellular carcinoma. In particular, RNAseq data of PGM5 and clinical data were downloaded from The Cancer Genome Atlas database using UCSC Xena (https://xenabrowser.net/datapages/?cohort=TCGA%20Liver%20Cancer%20(LIHC)&removeHub=https%3A%2F%2Fxena.treehouse.gi.ucsc.edu%3A443%22). There was no need for ethical approval because all data were publicly available.
Statistical analysis
All statistical analyses produce were performed using R (version 3.5.2) and related packages (R Development Core Team, 2018). PGM5 expression data are presented in boxplots. The Wilcoxon rank-sum test (also known as Mann–Whitney non-parametric test) was used to compare two groups, and the Kruskal–Wallis test was used to compare three or more groups. ROC was drawn using the pROC package to evaluate the diagnostic value of PGM5 by calculation of the AUC (Robin et al., 2011). Patients were divided into a high expression group and a low expression group using the threshold PGM5 level identified from the ROC curve. The chi-squared test and Fisher’s exact test were used to assess the significance of associations between PGM5 level and clinical parameters. Survival analysis and the Cox model were implemented using the survival package in R to determine the prognostic value of PGM5 overall, and in different subgroups (Therneau & Grambsch, 2000), with calculations of hazard ratios (HRs) and 95% confidence intervals (95% CIs). Data were plotted using the ggplot2 package in R (Wickham, 2011).
Results
Characteristics of patients with hepatocellular carcinoma
The Cancer Genome Atlas database provided the characteristics of 373 patients with hepatocellular carcinoma, including age, sex, cancer stage, histologic grade, histological type, TNM classification, presence of residual tumor, and vital status (Table 1).
Lower hepatic PGM5 expression in cancerous than normal tissues
We determined the association of PGM5 expression with different tissue characteristics (Fig. 1). The results show that PGM5 expression was lower in tissues with liver cancer (n = 373) than in adjacent normal liver tissues (n = 50; P = 4.2 ×10⁻¹¹). In addition, PGM5 expression had inverse correlations with advanced histologic grade (P = 6.1 × 10⁻⁵) and advanced T classification (P = 0.034), and a positive correlation with survival (P = 0.022).
Hepatic PGM5 expression has diagnostic value in liver cancer
We analyzed the PGM5 expression data in cancerous liver tissues using ROC analysis for all patients, and for patients with different stages of cancer (Fig. 2). The results show that PGM5 expression had a modest diagnostic value for patients overall (AUC = 0.787) and for patients with different stages of cancer (AUCStageI = 0.782; AUCStageII = 0.773, AUCStageIII = 0.789; AUCStageIV = 0.740).
Hepatic PGM5 expression correlates with several clinical parameters
We evaluated the association of PGM5 expression with clinical parameters by dividing patients into a high expression group and a low expression group according to the threshold value identified from the ROC curve. Analysis of these data using a chi-squared test and Fisher’s exact test (Table 2) indicated that PGM5 expression was positively associated with male sex (P = 0.044) and survival (P = 0.009), but inversely associated with advanced histologic type (P = 0.045), advanced histologic grade (P = 0.044), advanced stage (P = 0.008), and advanced T classification (P = 0.001).
Hepatic PGM5 expression is an independent prognostic factor
Because high PGM5 expression correlated with improved survival, we also examined the role of PGM5 expression in prediction of patient prognosis. The results show that patients with lower PGM5 expression had a shorter overall survival (OS; Fig. 3, P = 9 × 10⁻⁴) and relapse-free survival (RFS; Fig. 4, P = 0.00015). Subgroup analysis indicated that PGM5 expression had significant prognostic value for OS in patients with stage I/II cancer (P = 0.0037) and for RFS in patients with stage I/II cancer (P < 0.0001) and grade G1/G2 cancer (P = 0.0039).
We developed a Cox model to evaluate the effect of PGM5 expression on OS and RFS (Tables 3 and 4). The univariate Cox model indicated the variables potentially associated with PGM5 expression were stage, histologic grade, and T classification. The multivariate Cox model identified PGM5 expression as an independent prognostic indicator of OS (HR = 1.51, 95% CI [1.04–2.18], P = 0.029) and RFS (HR = 1.67, 95% CI [1.18–2.36], P = 0.004).
| Characteristics | Number of patients(%) |
|---|---|
| Age | |
| <55 | 117(31.45) |
| ≥55 | 255(68.55) |
| Gender | |
| FEMALE | 121(32.44) |
| MALE | 252(67.56) |
| histological_type | |
| Fibrolamellar Carcinoma | 3(0.8) |
| Hepatocellular Carcinoma | 363(97.32) |
| Hepatocholangiocarcinoma (Mixed) | 7(1.88) |
| histologic_grade | |
| NA | 5(1.34) |
| G1 | 55(14.75) |
| G2 | 178(47.72) |
| G3 | 123(32.98) |
| G4 | 12(3.22) |
| Stage | |
| NA | 24(6.43) |
| I | 172(46.11) |
| II | 87(23.32) |
| III | 85(22.79) |
| IV | 5(1.34) |
| T_classification | |
| NA | 2(0.54) |
| T1 | 182(48.79) |
| T2 | 95(25.47) |
| T3 | 80(21.45) |
| T4 | 13(3.49) |
| TX | 1(0.27) |
| N_classification | |
| NA | 1(0.27) |
| N0 | 253(67.83) |
| N1 | 4(1.07) |
| NX | 115(30.83) |
| M_classification | |
| M0 | 267(71.58) |
| M1 | 4(1.07) |
| MX | 102(27.35) |
| radiation_therapy | |
| NA | 25(6.7) |
| NO | 340(91.15) |
| YES | 8(2.14) |
| residual_tumor | |
| NA | 7(1.88) |
| R0 | 326(87.4) |
| R1 | 17(4.56) |
| R2 | 1(0.27) |
| RX | 22(5.9) |
| Vital_status | |
| DECEASED | 130(34.85) |
| LIVING | 243(65.15) |
| Relapse | |
| NO | 179(55.94) |
| YES | 141(44.06) |
| PGM5 | |
| High | 165(44.24) |
| Low | 208(55.76) |
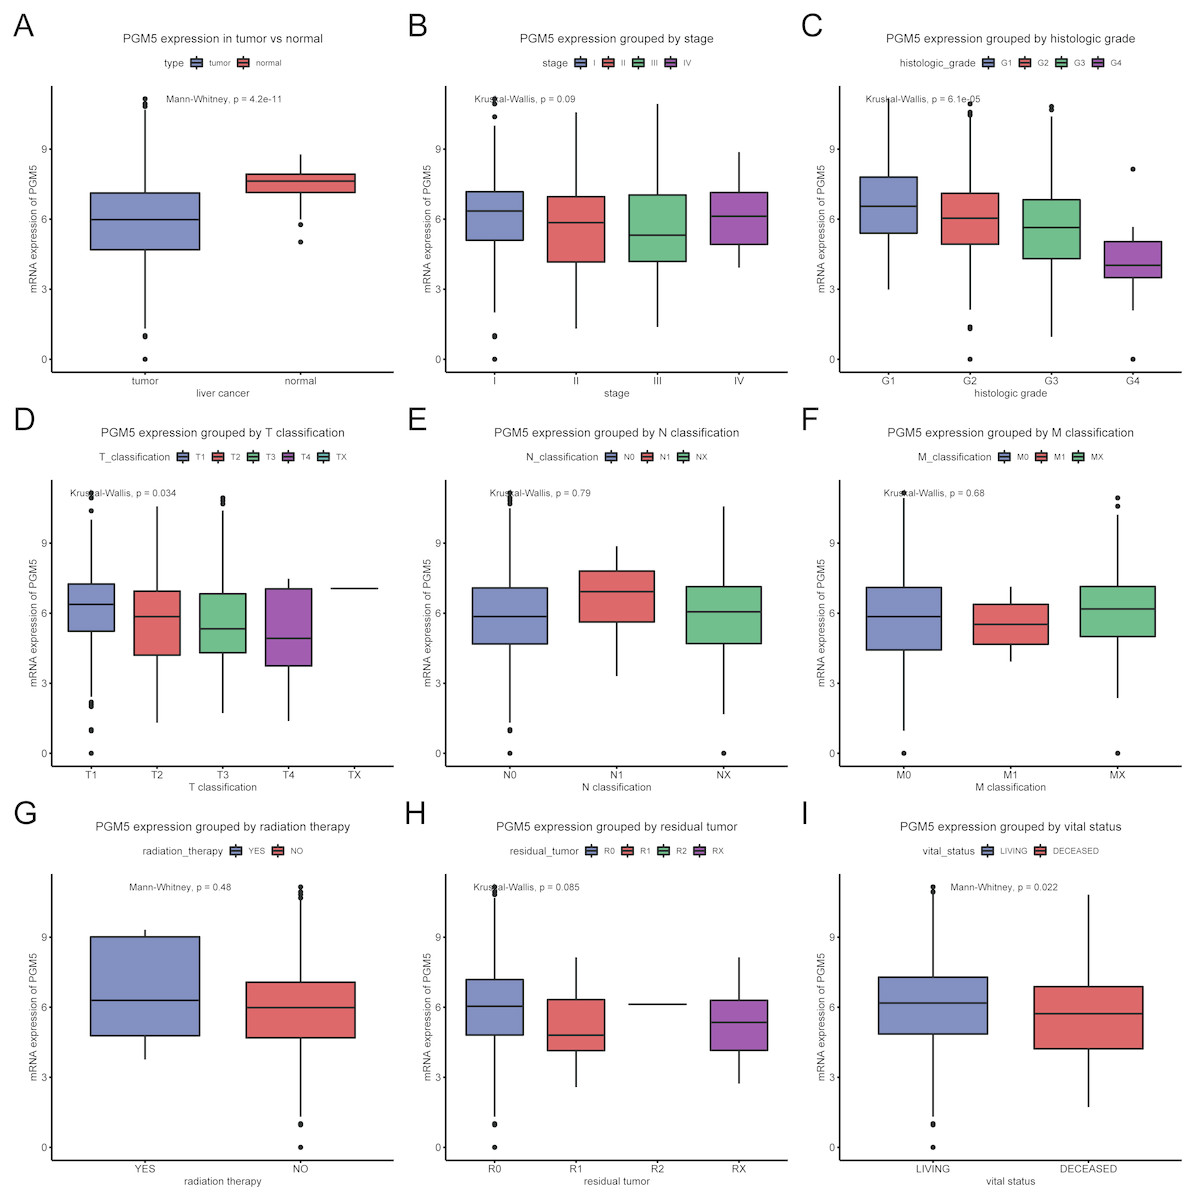
Figure 1: Expression of PGM5 in liver cancer.
Expression of PGM5 in cancerous vs. adjacent normal liver tissues (A), and according to clinical stage (B), histologic grade (C), TNM classification (D–F), receipt of radiation therapy (G), presence of residual tumor (H), and survival (I). Each box plot shows the median (center line), upper and lower quartiles (box), 95% confidence intervals (vertical lines), and outliers (points).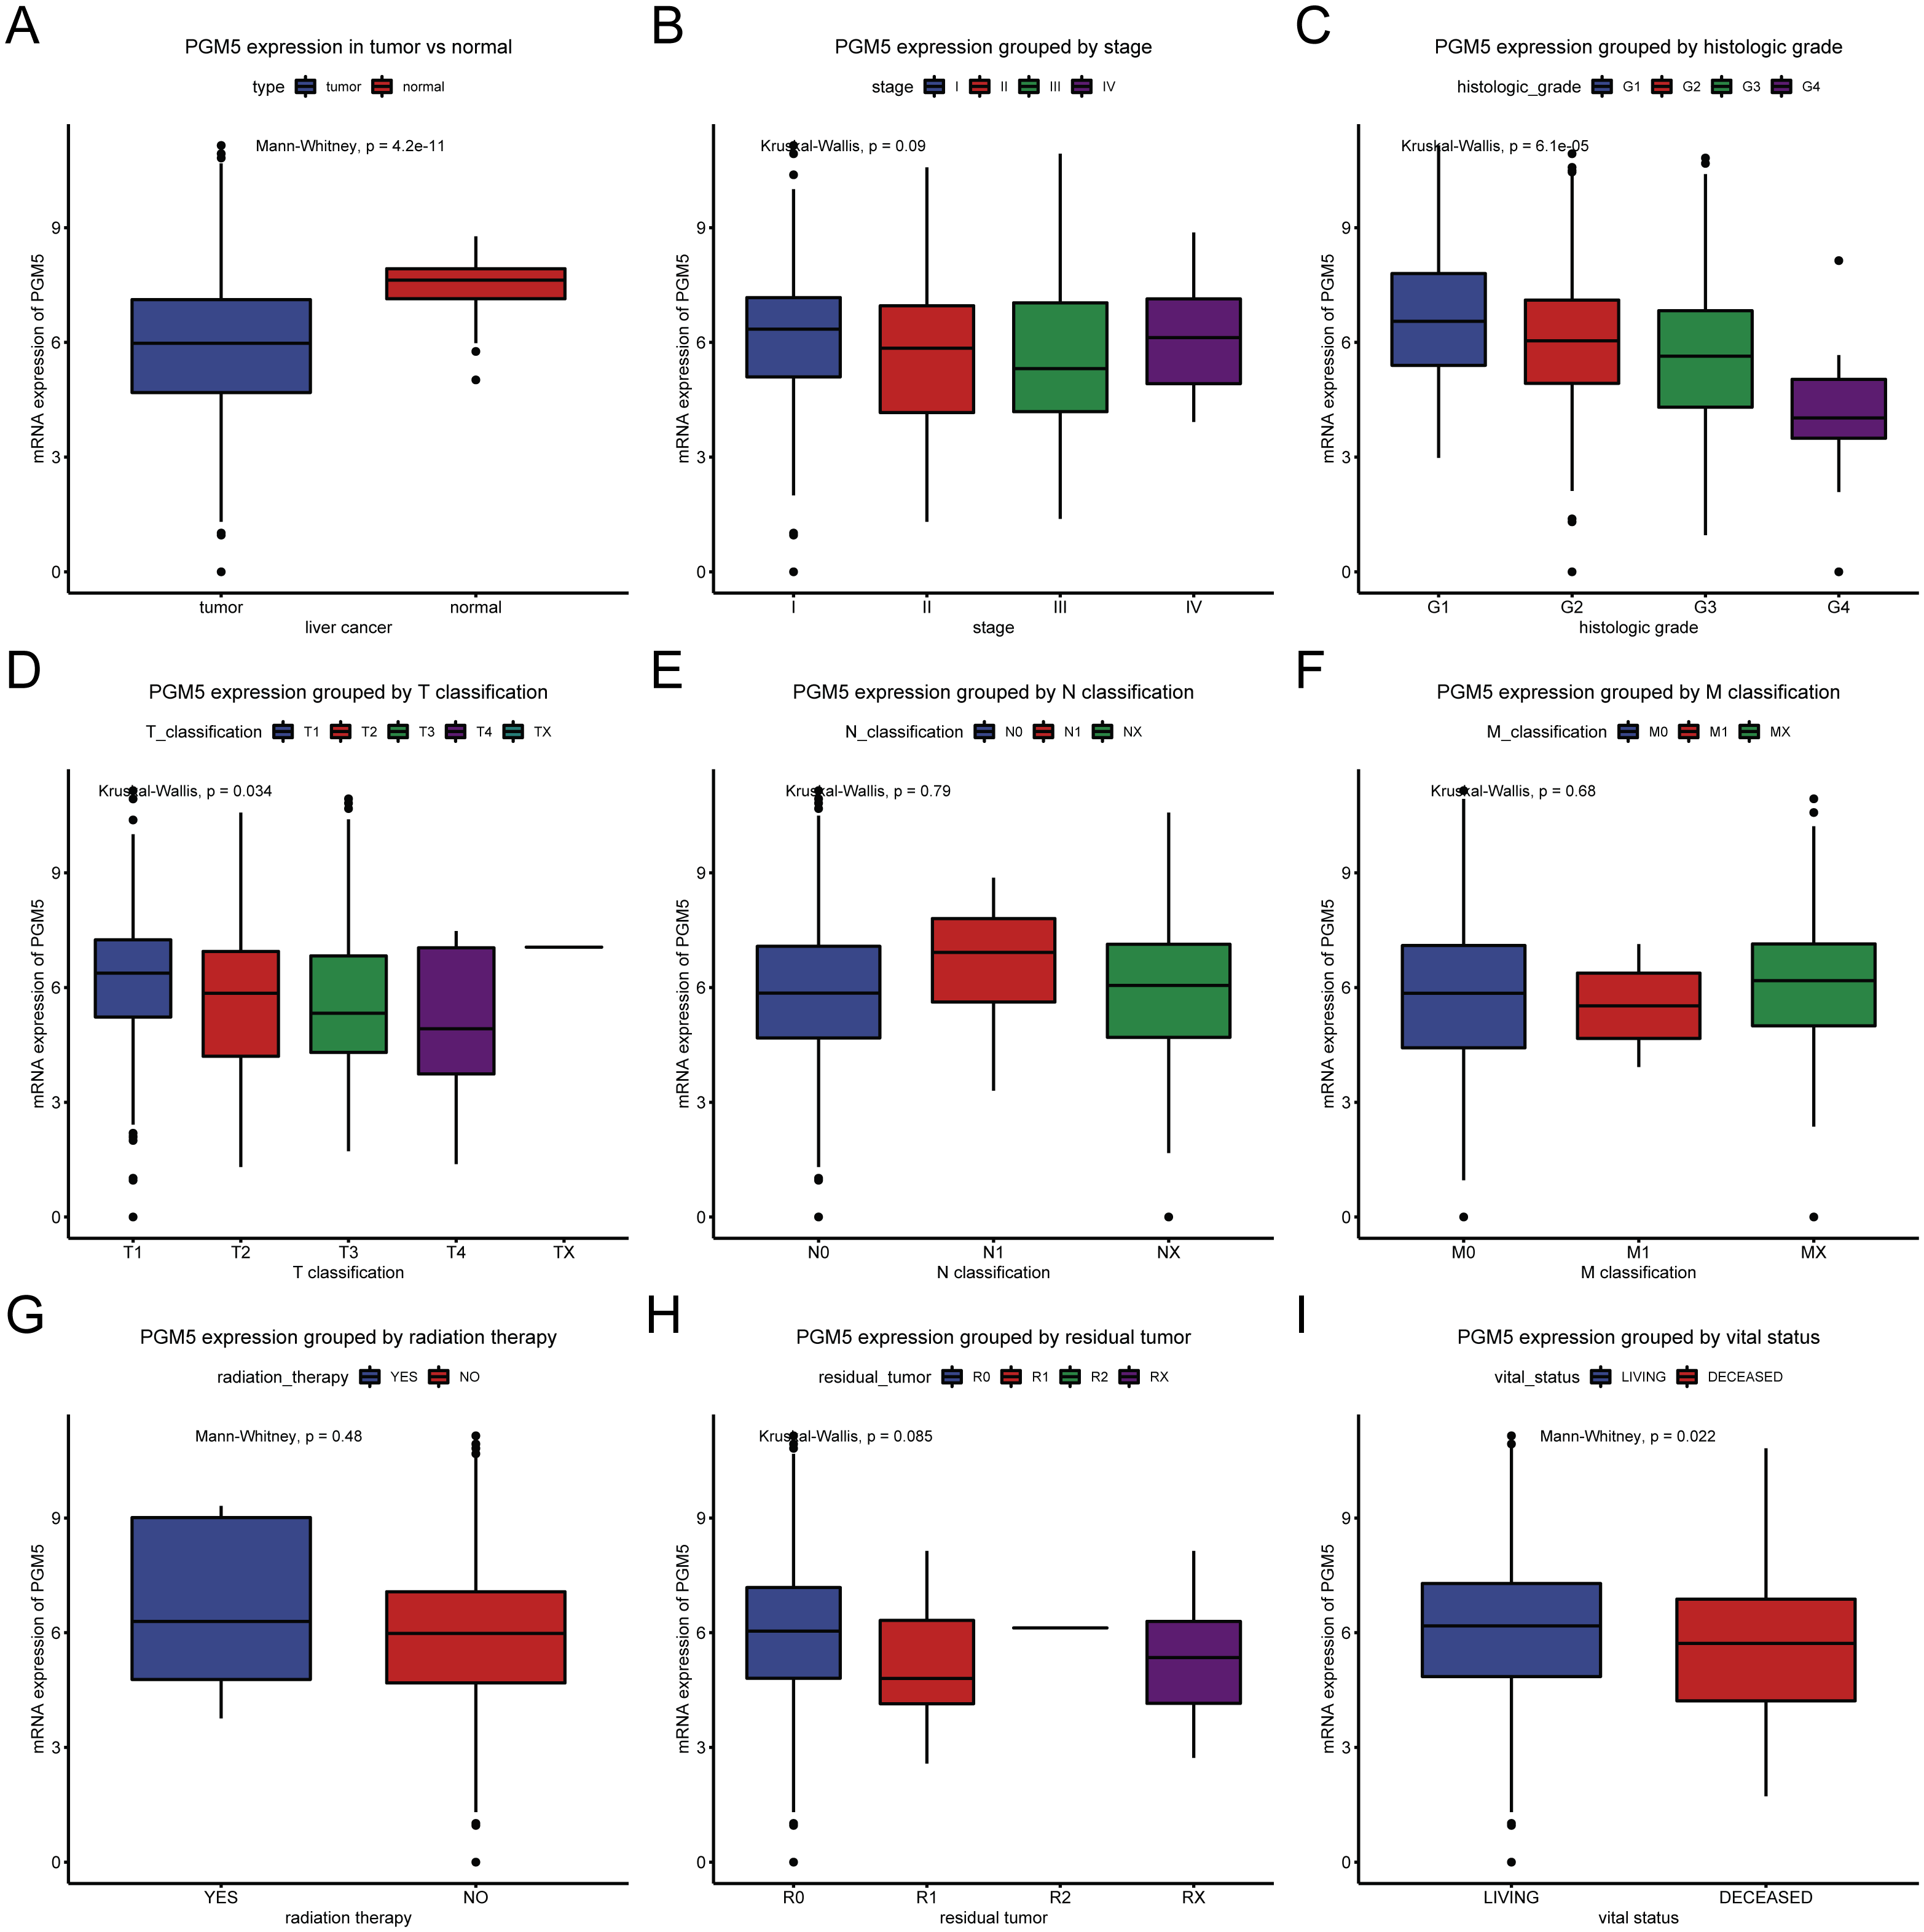
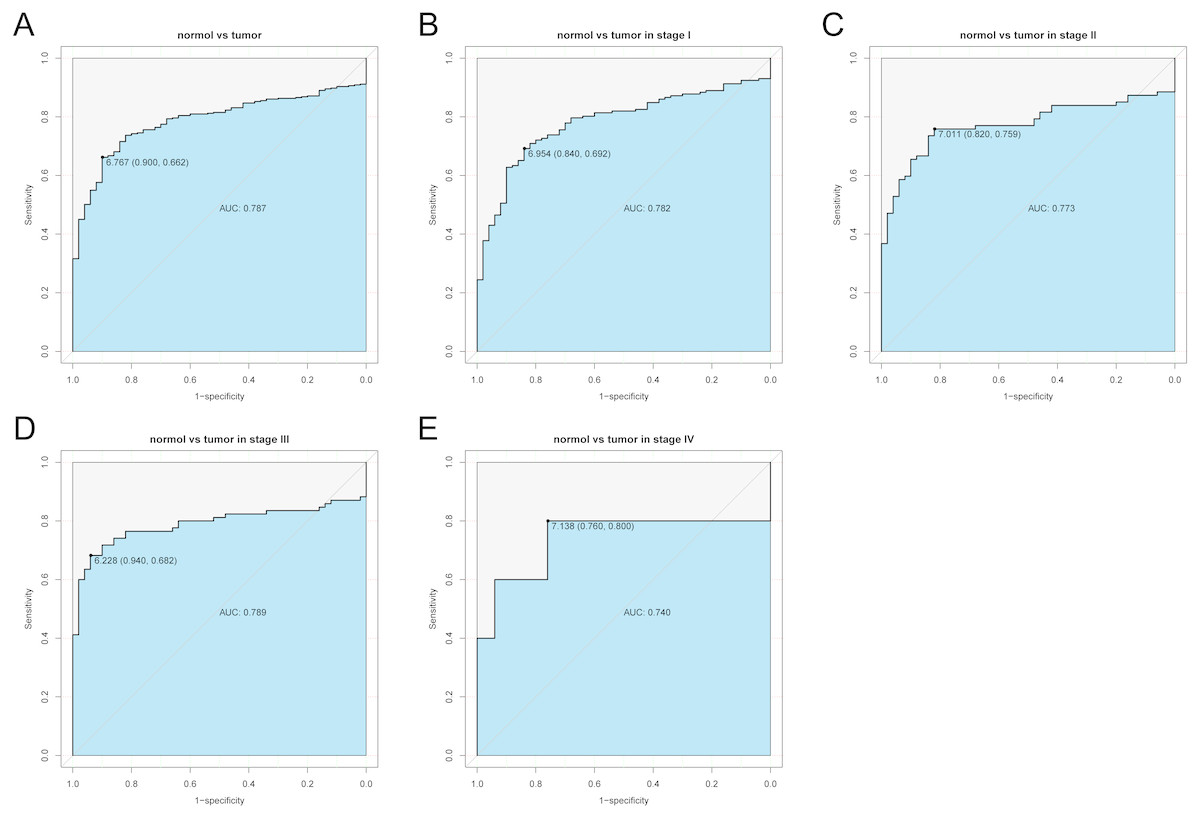
Figure 2: Receiver operating characteristic analysis of hepatic PGM5 expression.
Receiver operating characteristic analysis of hepatic PGM5 expression in (A) normal vs. cancerous tissues overall (A), normal vs. stage I cancerous tissues (B), normal vs. stage II cancerous tissues (C), normal vs. stage III cancerous tissues (D), and normal vs. stage IV cancerous tissues (E).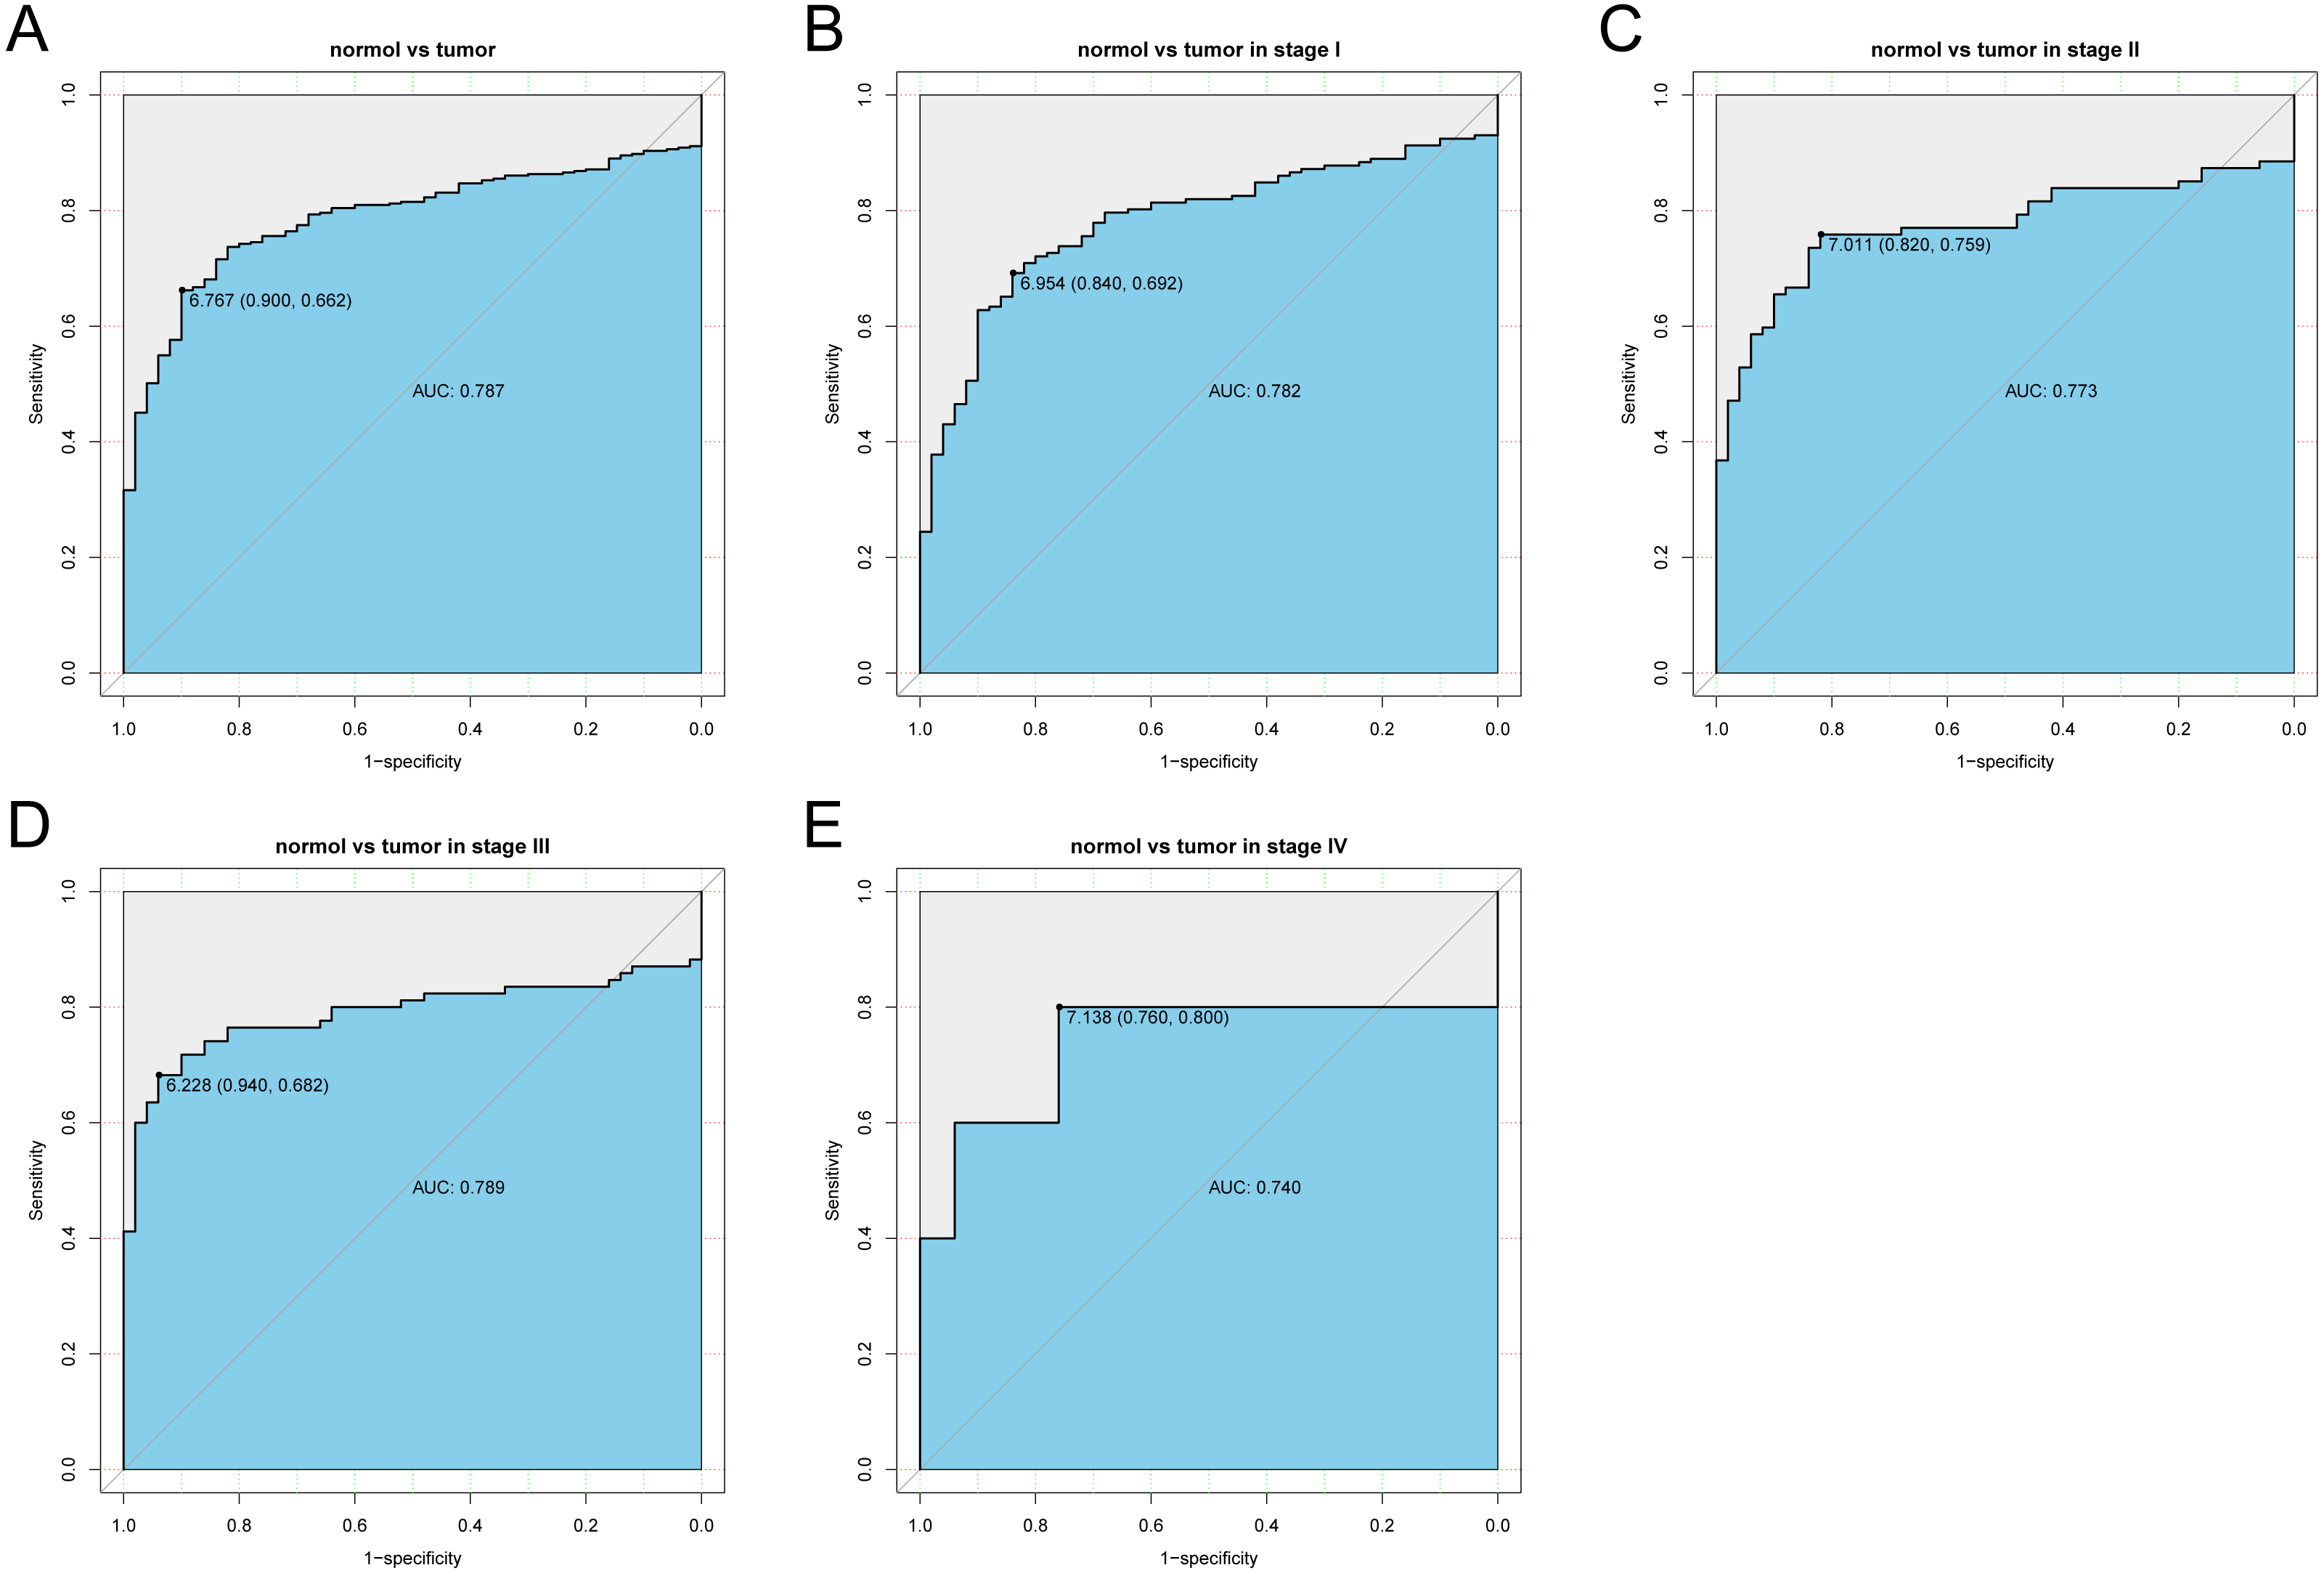
| Clinical characteristics | Variable | No. of patients | PGM5 expression | χ2 | p-value | |||
|---|---|---|---|---|---|---|---|---|
| High | % | Low | % | |||||
| Age | <55 | 117 | 53 | (32.12) | 64 | (30.92) | 0.019 | 0.892 |
| ≥55 | 255 | 112 | (67.88) | 143 | (69.08) | |||
| Gender | FEMALE | 121 | 44 | (26.67) | 77 | (37.02) | 4.040 | 0.044 |
| MALE | 252 | 121 | (73.33) | 131 | (62.98) | |||
| Histological type | Fibrolamellar Carcinoma | 3 | 3 | (1.82) | 0 | (0) | 9.357 | 0.005 |
| Hepatocellular Carcinoma | 363 | 162 | (98.18) | 201 | (96.63) | |||
| Hepatocholangiocarcinoma (Mixed) | 7 | 0 | (0) | 7 | (3.37) | |||
| Histologic grade | G1 | 55 | 32 | (19.63) | 23 | (11.22) | 12.826 | 0.004 |
| G2 | 178 | 83 | (50.92) | 95 | (46.34) | |||
| G3 | 123 | 47 | (28.83) | 76 | (37.07) | |||
| G4 | 12 | 1 | (0.61) | 11 | (5.37) | |||
| Stage | I | 172 | 91 | (58.71) | 81 | (41.75) | 11.191 | 0.008 |
| II | 87 | 35 | (22.58) | 52 | (26.8) | |||
| III | 85 | 27 | (17.42) | 58 | (29.9) | |||
| IV | 5 | 2 | (1.29) | 3 | (1.55) | |||
| T classification | T1 | 182 | 98 | (60.12) | 84 | (40.38) | 17.897 | 0.001 |
| T2 | 95 | 37 | (22.7) | 58 | (27.88) | |||
| T3 | 80 | 23 | (14.11) | 57 | (27.4) | |||
| T4 | 13 | 4 | (2.45) | 9 | (4.33) | |||
| TX | 1 | 1 | (0.61) | 0 | (0) | |||
| N classification | N0 | 253 | 110 | (67.07) | 143 | (68.75) | 1.592 | 0.451 |
| N1 | 4 | 3 | (1.83) | 1 | (0.48) | |||
| NX | 115 | 51 | (31.1) | 64 | (30.77) | |||
| M classification | M0 | 267 | 118 | (71.52) | 149 | (71.63) | 0.631 | 0.809 |
| M1 | 4 | 1 | (0.61) | 3 | (1.44) | |||
| MX | 102 | 46 | (27.88) | 56 | (26.92) | |||
| Radiation therapy | NO | 340 | 150 | (97.4) | 190 | (97.94) | 0.000 | 1.000 |
| YES | 8 | 4 | (2.6) | 4 | (2.06) | |||
| Residual tumor | R0 | 326 | 151 | (93.21) | 175 | (85.78) | 5.447 | 0.115 |
| R1 | 17 | 5 | (3.09) | 12 | (5.88) | |||
| R2 | 1 | 0 | (0) | 1 | (0.49) | |||
| RX | 22 | 6 | (3.7) | 16 | (7.84) | |||
| Vital status | DECEASED | 130 | 45 | (27.27) | 85 | (40.87) | 6.900 | 0.009 |
| LIVING | 243 | 120 | (72.73) | 123 | (59.13) | |||
Notes:
Bold values of P ≤ 0.05 indicate statistically significant.
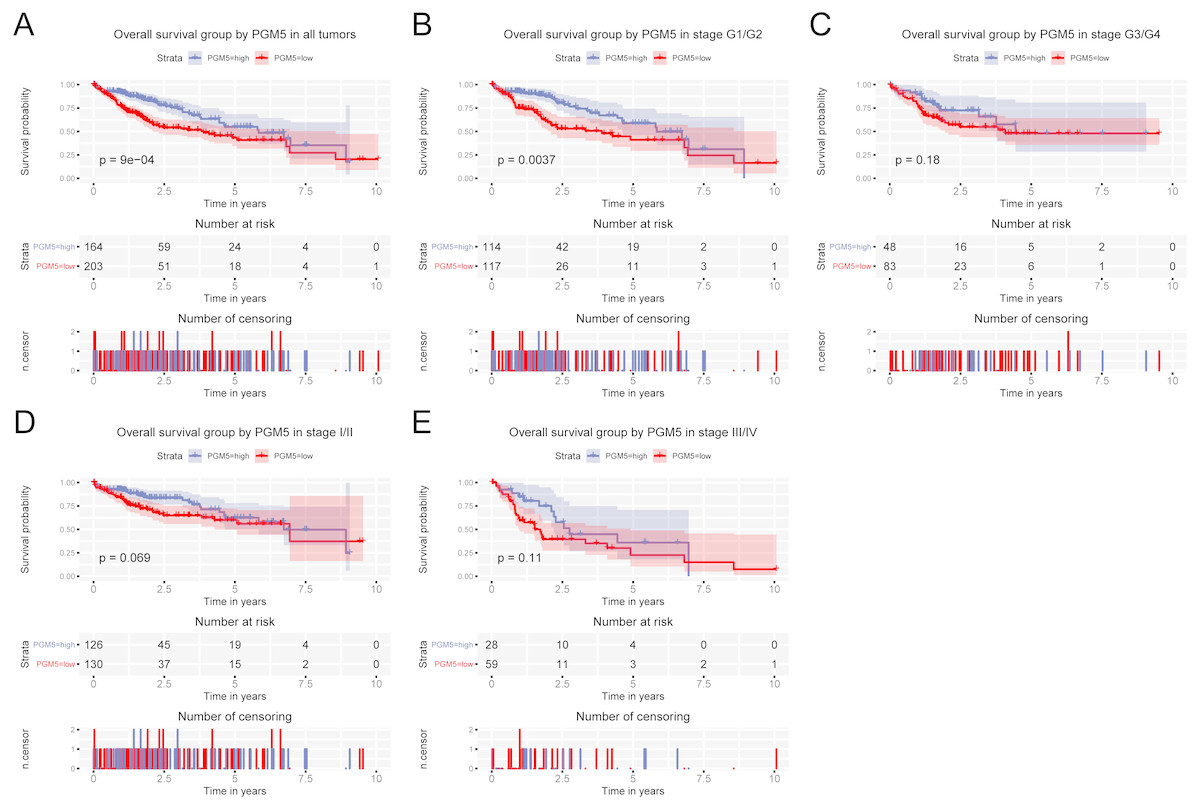
Figure 3: Relationship of hepatic PGM5 expression with overall survival.
Relationship of hepatic PGM5 expression with overall survival in all patients (A), patients with histological grade G1/G2 (B), patients with histological grade G3/G4 (C), patients with clinical stage I/II (D), and patients with clinical stage III/IV (E).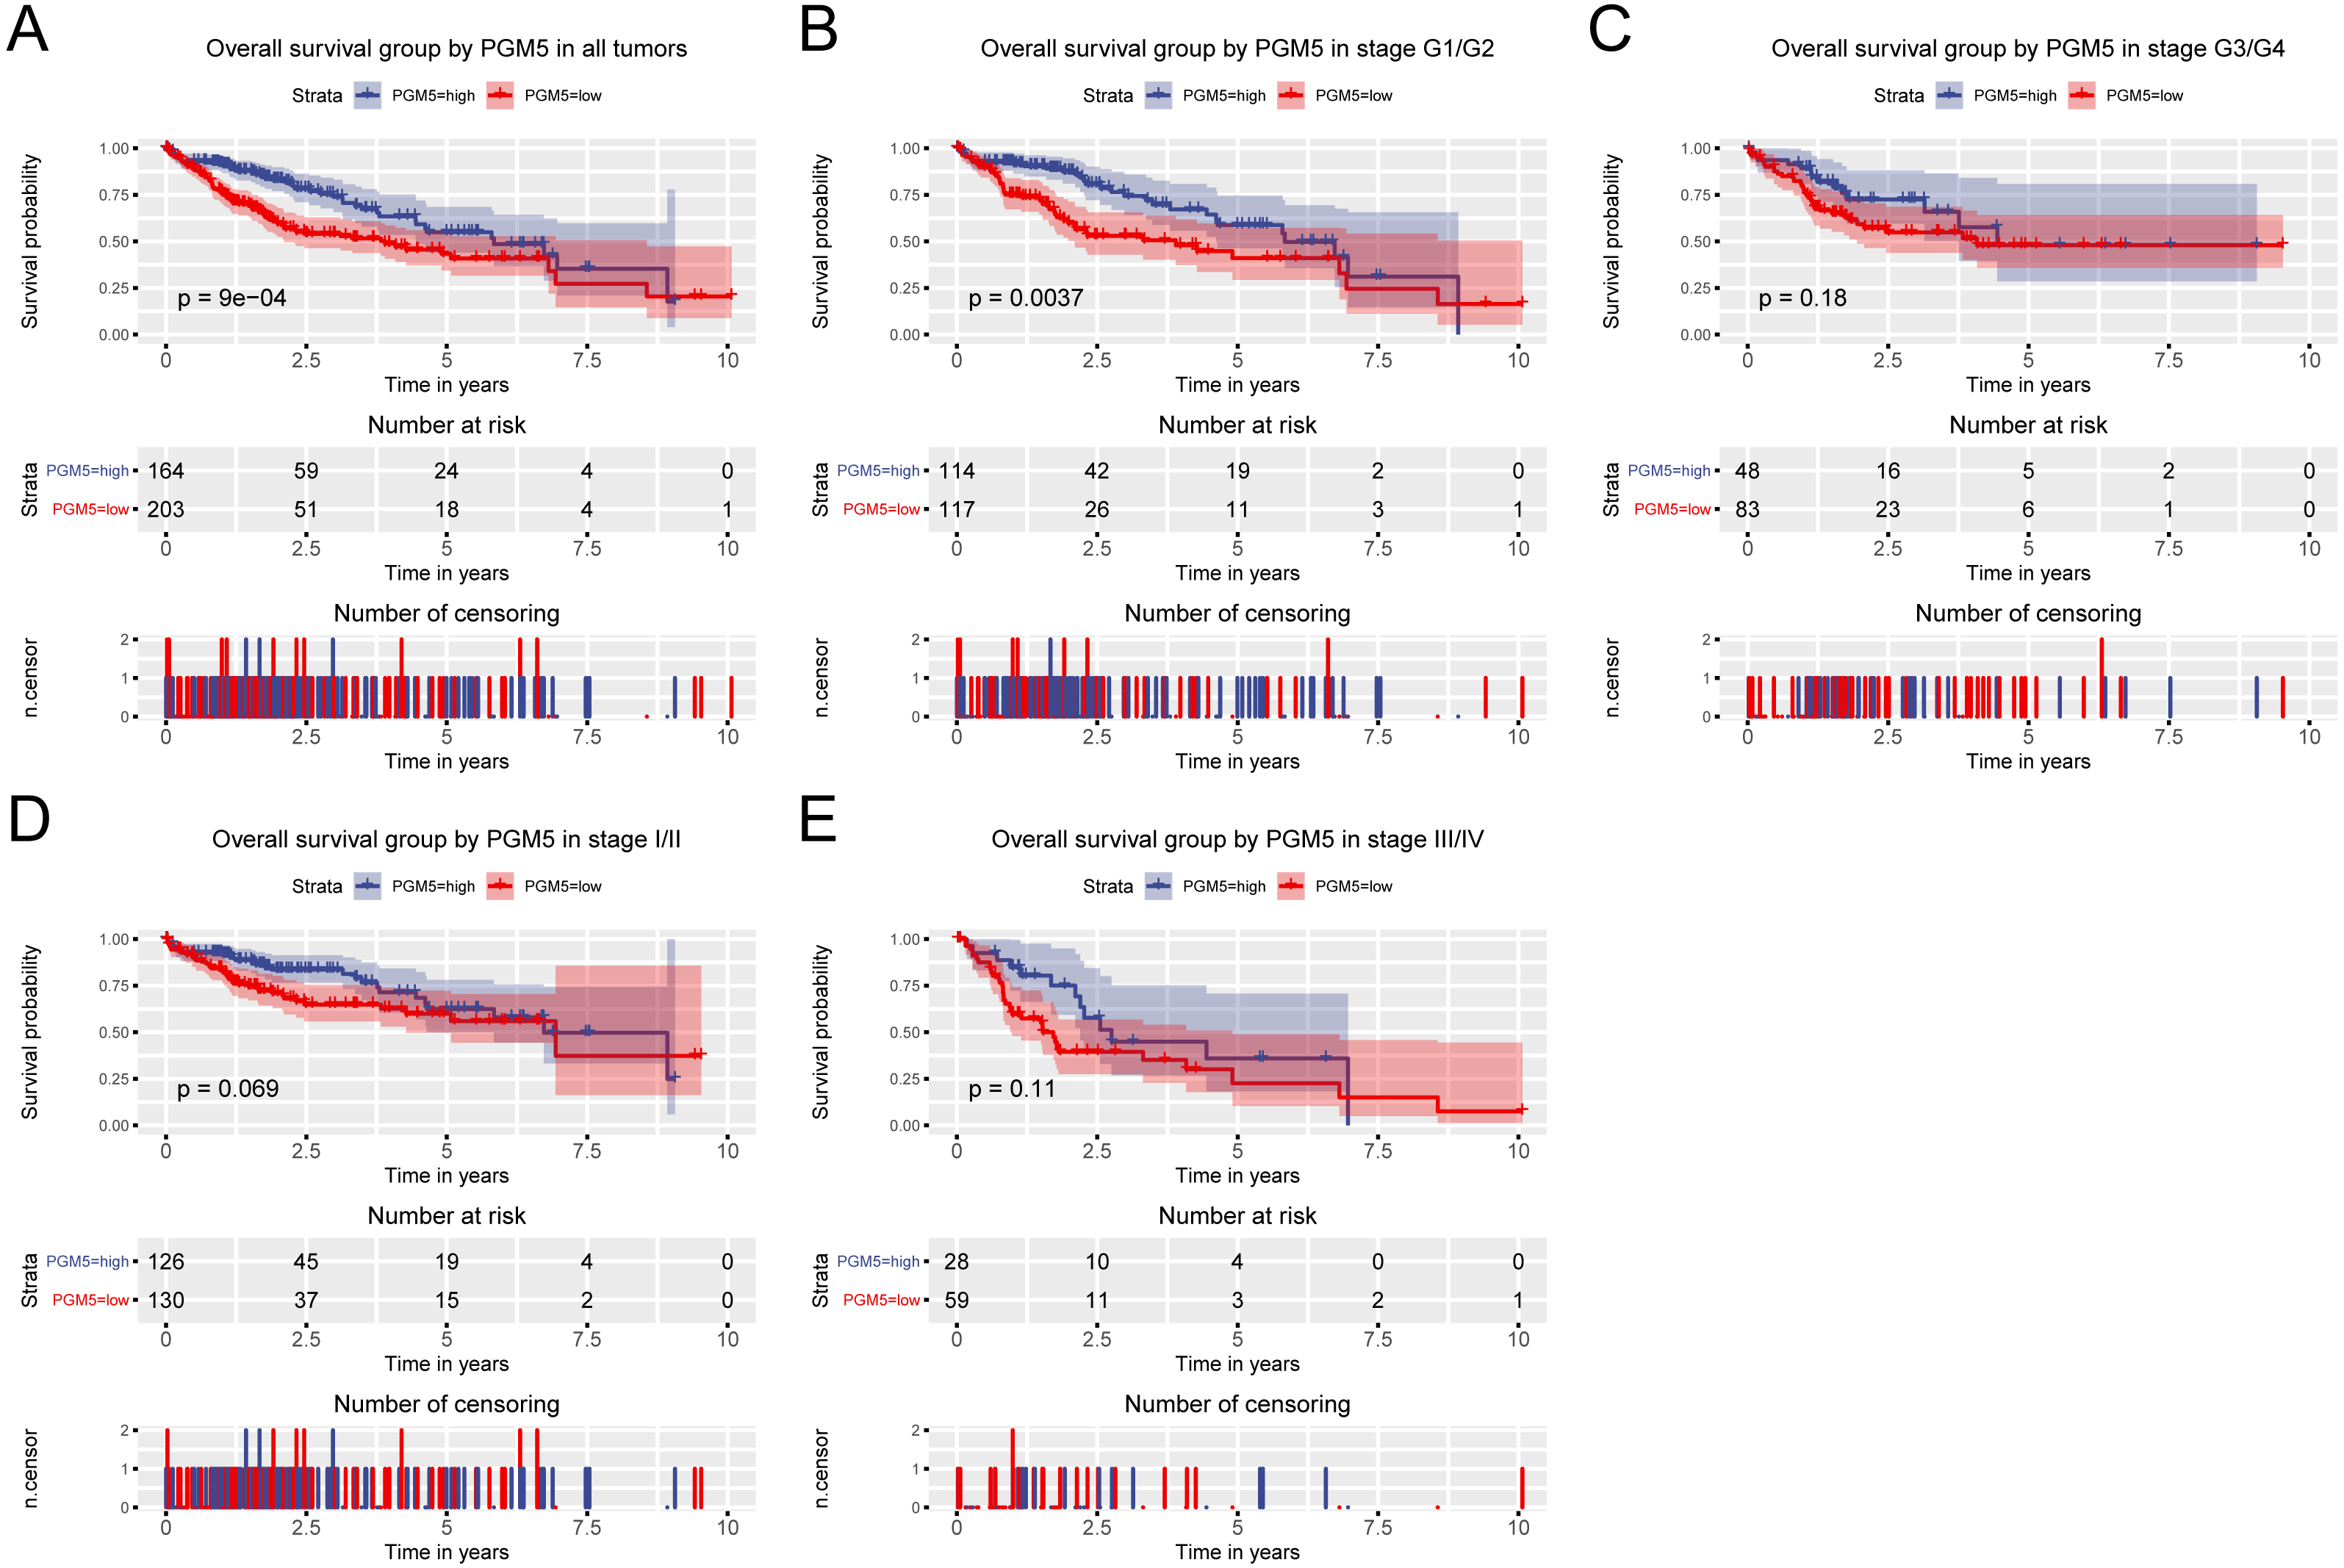
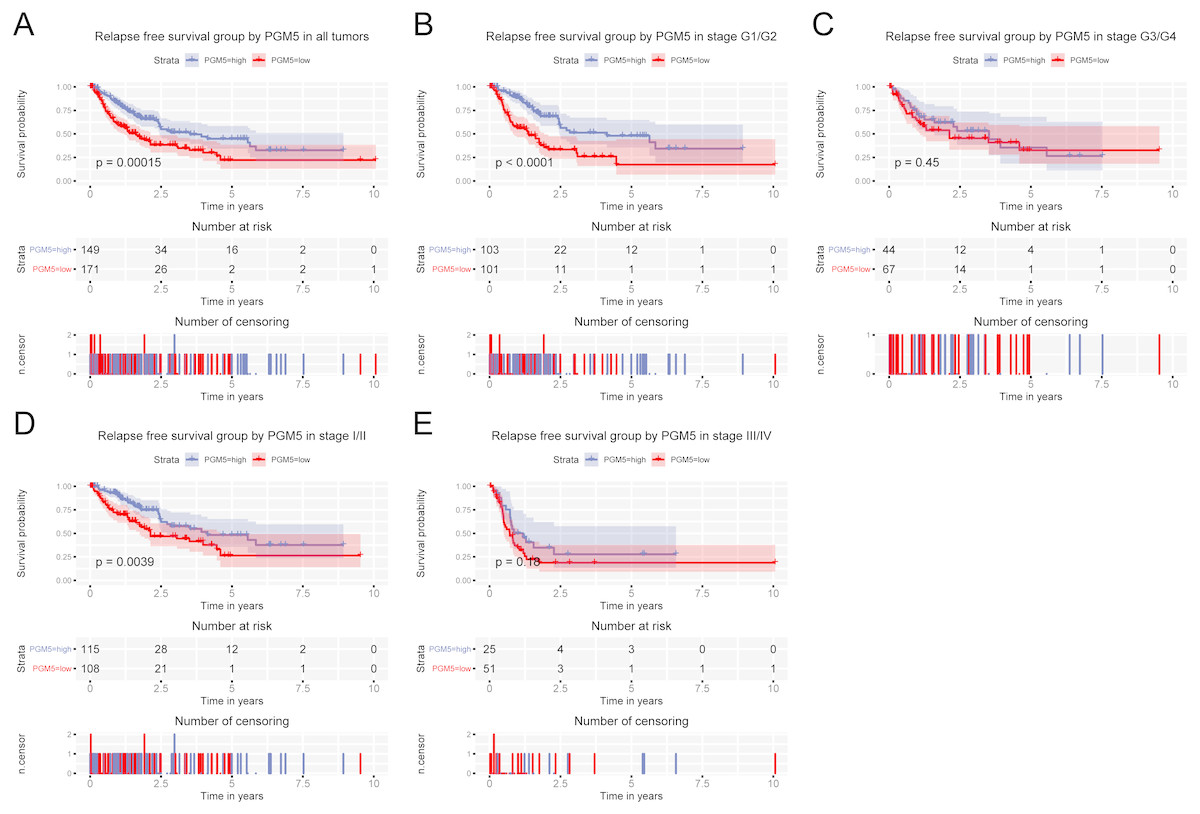
Figure 4: Relationship of hepatic PGM5 expression with relapse-free survival.
Relationship of hepatic PGM5 expression with relapse-free survival in all patients (A), patients with histological grade G1/G2 (B), patients with histological grade G3/G4 (C), patients with clinical stage I/II (D), and patients with clinical stage III/IV (E).
| Parameters | Univariate analysis | Multivariate analysis | ||||
|---|---|---|---|---|---|---|
| Hazard Ratio | 95% CI (lower∼ upper) | P value | Hazard Ratio | 95% CI (lower-upper) | P value | |
| Age | 1.00 | 0.69–1.45 | 0.997 | |||
| Gender | 0.80 | 0.56–1.14 | 0.220 | |||
| Histological type | 0.99 | 0.27–3.66 | 0.986 | |||
| Histologic grade | 1.04 | 0.84–1.3 | 0.698 | |||
| Stage | 1.38 | 1.15–1.66 | 0.001 | 0.87 | 0.7–1.09 | 0.220 |
| T classification | 1.66 | 1.39–1.99 | 0.000 | 1.77 | 1.39–2.24 | 0.000 |
| N classification | 0.73 | 0.51–1.05 | 0.086 | |||
| M classification | 0.72 | 0.49–1.04 | 0.077 | |||
| Radiation therapy | 0.51 | 0.26–1.03 | 0.060 | |||
| Residual tumor | 1.42 | 1.13–1.8 | 0.003 | 1.39 | 1.09–1.78 | 0.008 |
| PGM5 | 1.83 | 1.27–2.63 | 0.001 | 1.51 | 1.04–2.18 | 0.029 |
| Parameters | Univariate analysis | Multivariate analysis | ||||
|---|---|---|---|---|---|---|
| Hazard Ratio | 95% CI (lower∼ upper) | P value | Hazard Ratio | 95% CI (lower-upper) | P value | |
| Age | 0.90 | 0.63–1.28 | 0.550 | |||
| Gender | 0.99 | 0.7–1.41 | 0.966 | |||
| Histological type | 2.02 | 0.66–6.24 | 0.220 | |||
| Histologic grade | 0.98 | 0.8–1.21 | 0.883 | |||
| Stage | 1.66 | 1.38–1.99 | 0.000 | 1.14 | 0.88–1.48 | 0.326 |
| T classification | 1.78 | 1.49–2.12 | 0.000 | 1.57 | 1.19–2.05 | 0.001 |
| N classification | 0.97 | 0.67–1.4 | 0.874 | |||
| M classification | 1.17 | 0.79–1.74 | 0.432 | |||
| Radiation therapy | 0.74 | 0.26–2.16 | 0.584 | |||
| Residual tumor | 1.28 | 1.01–1.61 | 0.042 | 1.32 | 1.04–1.67 | 0.023 |
| PGM5 | 1.92 | 1.36–2.7 | 0.000 | 1.67 | 1.18–2.36 | 0.004 |
Discussion
Our team have been engaged in exploring the novel cancer biomarks for a long time (Jiao et al., 2018; Jiao et al., 2019a; Jiao et al., 2019b). The present study indicated that PGM5 expression was lower in cancerous than adjacent normal liver tissues. Hepatic PGM5 expression was also positively associated with male sex and survival, and negatively associated with advanced histologic type, histologic grade, clinical stage, and T classification. We also found that hepatic PGM5 expression had significant value as a diagnostic indicator of liver cancer and that patients with low hepatic PGM5 expression had poorer prognosis, in terms of OS and RFS. The results of our Cox model analysis indicated low hepatic PGM5 expression was an independent indicator of poor prognosis.
PGM5 (initially named aciculin) is a cytoskeletal protein present in smooth muscle tissues (Belkin & Burridge, 1994). Initial studies reported changes of PGM5 expression during muscledifferentiation, in that there is upregulation during muscle development, and that this protein is a useful marker of the contractile/differentiated smooth muscle phenotype (Belkin & Burridge, 1994; Moiseeva & Critchley, 1997). However, little is known about the expression of PGM5 during cancer pathogenesis. The present study indicated that PGM5 had lower expression in cancerous liver tissues than adjacent normal tissues, similar to the results of a previous study of colorectal cancer (Uzozie et al., 2017). Furthermore, we determined that hepatic PGM5 expression had a modest diagnostic value for liver cancer overall and for each of the four stages of liver cancer, suggesting it has potential use as a novel diagnostic biomarker.
Low hepatic PGM5 expression is associated with poor prognosis in patients with liver cancer. Previous studies found that PGM5 functions in multiple cell–matrix adherens junctions in association with dystrophin and utrophin, and that it interacts with filamin C and Xin during myofibril assembly, remodeling, and maintenance (Belkin & Burridge, 1995a; Belkin & Burridge, 1995b; Molt et al., 2014; Wakayama et al., 2000). Its chromosome fusion site is close to the telomere, and is related to the rearrangement of subtelomeric and pericentromeric regions (Fan et al., 2002; Wong et al., 2004). These previous findings suggest this protein has a role in cell–matrix adherens junctions and the regulation of telomeres during cancer progression, although no previous study has yet directly examined the specific function of PGM5 during the pathogenesis of cancer. Our study of patients with liver cancer indicated that hepatic PGM5 expression was positively associated with male sex and survival, and negatively associated with advanced histologic type, histologic grade, stage, and T classification. Our survival analysis indicated that low hepatic PGM5 expression was associated with poor prognosis, and was an independent prognostic factor for poor OS and RFS. These results indicate that PGM5 has potential as a prognostic biomarker, as well as a diagnostic marker, for liver cancer.
This study and several previous studies suggest that PGM5 has a role in the pathogenesis of several cancers, and has potential value as a diagnostic and prognostic biomarker for liver cancer. However, this study is based on data mining of a single public database, so our findings require verification in different populations. Our future studies will examine the role of PGM5 in liver cancer of different populations and will also examine its molecular function using in vivo and in vitro experiments.
Conclusions
In summary, we found that PGM5 expression was lower in cancerous than adjacent normal liver tissues, and was positively associated with male sex and survival, and negatively associated with advanced histologic type, histologic grade, stage, and T classification. In addition, patients with low expression of hepatic PGM5 had poorer OS and RFS. Our Cox model results indicated that hepatic PGM5 expression was an independent prognostic factor. However, our results are based on data mining of a selected group of patients from a public database, so verification is required for additional populations.