
Fluoroquinolone resistance determinants in carbapenem-resistant Escherichia coli isolated from urine clinical samples in Thailand
- Published
- Accepted
- Received
- Academic Editor
- Cindy Shuan Ju Teh
- Subject Areas
- Microbiology, Epidemiology, Infectious Diseases, Urology
- Keywords
- Escherichia coli, Urine, Fluoroquinolone resistance, Carbapenem resistance, Virulence factors
- Copyright
- © 2023 Boueroy et al.
- Licence
- This is an open access article distributed under the terms of the Creative Commons Attribution License, which permits unrestricted use, distribution, reproduction and adaptation in any medium and for any purpose provided that it is properly attributed. For attribution, the original author(s), title, publication source (PeerJ) and either DOI or URL of the article must be cited.
- Cite this article
- 2023. Fluoroquinolone resistance determinants in carbapenem-resistant Escherichia coli isolated from urine clinical samples in Thailand. PeerJ 11:e16401 https://doi.org/10.7717/peerj.16401
Abstract
Background
Escherichia coli is the most common cause of urinary tract infections and has fluoroquinolone (FQ)-resistant strains, which are a worldwide concern.
Objectives
To characterize FQ-resistant determinants among 103 carbapenem-resistant E. coli (CREc) urinary isolates using WGS.
Methods
Antimicrobial susceptibility, biofilm formation, and short-read sequencing were applied to these isolates. Complete genome sequencing of five CREcs was conducted using short- and long-read platforms.
Results
ST410 (50.49%) was the predominant ST, followed by ST405 (12.62%) and ST361 (11.65%). Clermont phylogroup C (54.37%) was the most frequent. The genes NDM-5 (74.76%) and CTX-M-15 (71.84%) were the most identified. Most CREcs were resistant to ciprofloxacin (97.09%) and levofloxacin (94.17%), whereas their resistance rate to nitrofurantoin was 33.98%. Frequently, the gene aac(6′)-Ib (57.28%) was found and the coexistence of aac(6′)-Ib and blaCTX-M-15 was the most widely predominant. All isolates carried the gyrA mutants of S83L and D87N. In 12.62% of the isolates, the coexistence was detected of gyrA, gyrB, parC, and parE mutations. Furthermore, the five urinary CREc-complete genomes revealed that blaNDM-5 or blaNDM-3 were located on two plasmid Inc types, comprising IncFI (60%, 3/5) and IncFI/IncQ (40%, 2/5). In addition, both plasmid types carried other resistance genes, such as blaOXA-1, blaCTX-M-15, blaTEM-1B, and aac(6′)-Ib. Notably, the IncFI plasmid in one isolate carried three copies of the blaNDM-5 gene.
Conclusions
This study showed FQ-resistant determinants in urinary CREc isolates that could be a warning sign to adopt efficient strategies or new control policies to prevent further spread and to help in monitoring this microorganism.
Introduction
Urinary tract infections (UTIs) are one of the most common bacterial infections with ∼150 million cases per year globally, which pose a large burden on the healthcare system as the associated costs have reached USD 6 billion (Badamchi et al., 2019; Foxman, 2014). A UTI is one of the most common extraintestinal infections, with 80% of UTIs caused by Escherichia coli, which is the target of empirical therapy (Córdoba et al., 2017). Fluoroquinolones (FQs) are the drugs of choice to treat UTIs, especially complicated cases and catheter-associated UTIs, since this antibiotic class has a wide spectrum of antimicrobial activities with excellent bioavailability, good oral absorption, and good tissue penetrability (Sharma, Jain & Jain, 2009). Although serious side effects associated with fluoroquinolone treatment have been mentioned by the US FDA (US Food and Drug Administration, 2016), this antibiotic remains the drug of choice.
The progressive emergence of resistance to fluoroquinolones and other antibiotics commonly used for UTI treatment has been observed in several countries over the last few years (Córdoba et al., 2017; Lee, Lee & Choe, 2018; Cunha et al., 2016). The resistance rate against FQ has recently increased, particularly among the Enterobacterales, especially E. coli (Faine et al., 2022; Kibwana et al., 2023). FQ resistance in E. coli showed that the mutations in the quinolone resistance-determining regions (QRDRs) of the chromosomal genes gyrA, parC, and parE lead to alteration of the target proteins (DNA gyrase and topoisomerase IV) of these antimicrobial agents and the operons of the endogenous transmembrane efflux pump AcrAB-TolC (marR and acrR) (Chen, Erickson & Meng, 2020). The efflux pump (oqxAB), a variant of the aminoglycoside-modifying enzyme aac(6′)-Ib-cr and qnr determinants (qnrA) that encode DNA gyrase protection proteins, was also identified to have the potential to reduce the susceptibility to FQs and lead to resistance in E. coli (Cheng et al., 2020).
The most common mechanisms are the mutation of the gene that encodes type II topoisomerases (DNA gyrase and topoisomerase IV), which are enzymes that are essential for DNA replication and alter the fluoroquinolone binding affinity of the enzyme. It inhibits the activity of DNA gyrase and topoisomerase IV, which are enzymes that are essential for DNA replication (Hopkins, Davies & Threlfall, 2005).
In Thailand, there is insufficient data about FQ-resistant E. coli. In 2015, we began conducting the Emerging Antimicrobial Resistant Bacterial Surveillance Program (EARB). In this program, we focused on carbapenem-resistant Enterobacterles (CRE) and colistin-resistant Enterobacterles isolated from patients in 11 hospital networks in Thailand (Takeuchi et al., 2022; Boueroy et al., 2022).
Our previous CRE study showed K. pneumoniae (577 isolates) and E. coli (170 isolates) accounted for 97.5% of all CRE isolates (n = 766) (Takeuchi et al., 2022). In Takeuchi et al. (2022), E. coli isolates were most frequently isolated from urine (58.24%, 99/170), followed by blood (13.53%, 23/170). Takeuchi et al. (2022) mentioned the prevalence of carbapenemase genotypes and replicon types of carbapenemase gene-harboring plasmids but did not analyze FQ and other antimicrobial resistance determinants. The present study aimed to determine the antimicrobial resistance determinants (other than carbapenem), including fluoroquinolone resistance, extended-spectrum beta-lactamase production, virulence, and genotypes, among CREcs obtained from the urine of patients in Thailand during 2015–2020.
Materials & Methods
Bacterial isolates
The present study used 103 urine isolates of CREc during 2015–2020, comprising 88 isolates from a previous study (Takeuchi et al., 2022) and 15 isolates from the present study from eight provinces in Thailand under the EARB program (Fig. 1 and Table S1).
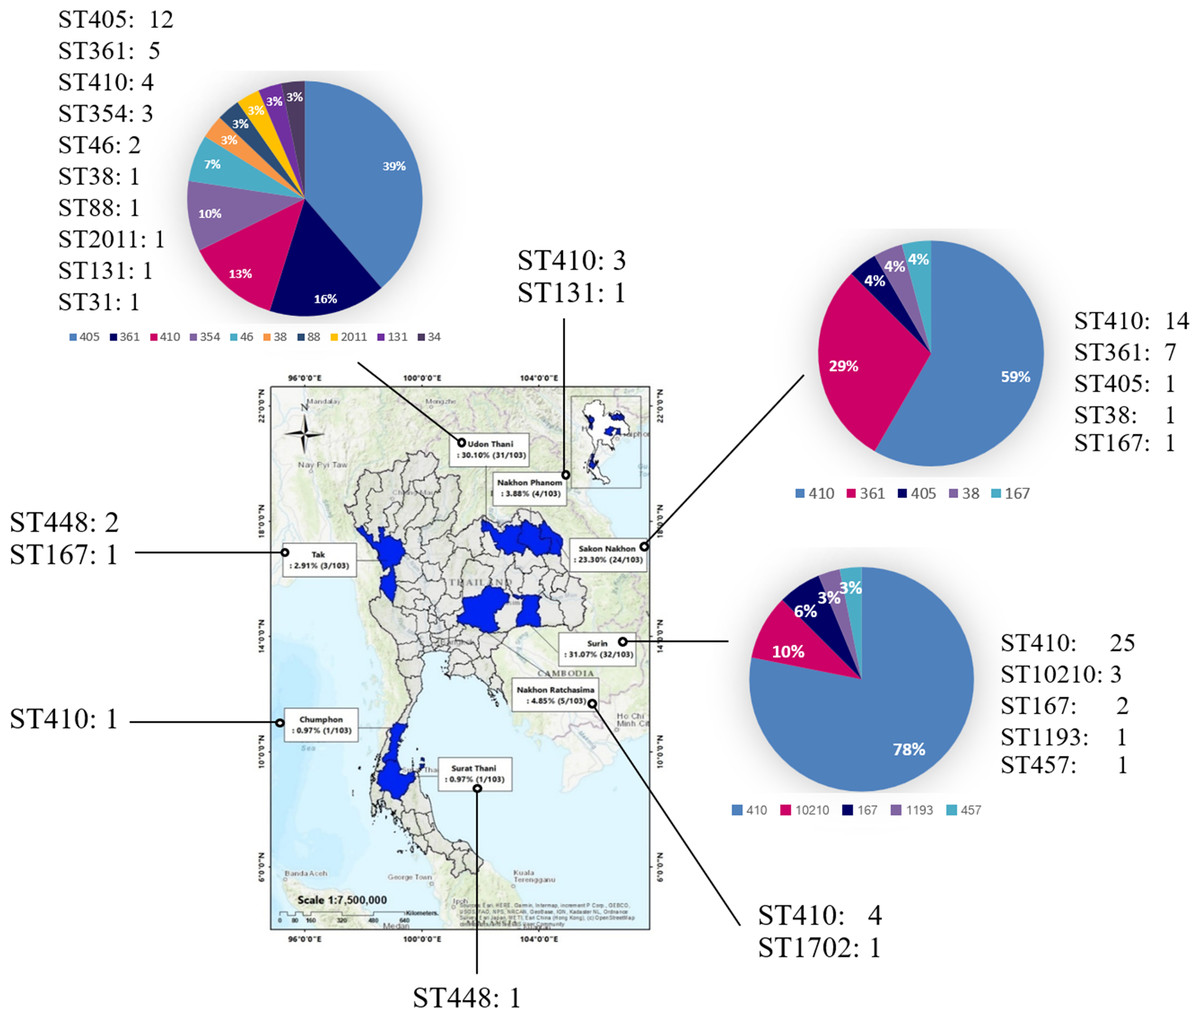
Figure 1: Provinces where samples were collected between 2015 and 2020.
Samples were collected from eight provinces nationwide: Surin, Udon Thani, Sakon Nakhon, Nakhon Ratchasima, Nakhon Phanom, Tak, Surat Thani, and Chumphon. (A geographical information system (GIS) software QGIS (version 2.18.28) was used to create a study map). The total number of isolates is shown in the map, and the number and percentage of ST is presented in the pie chart.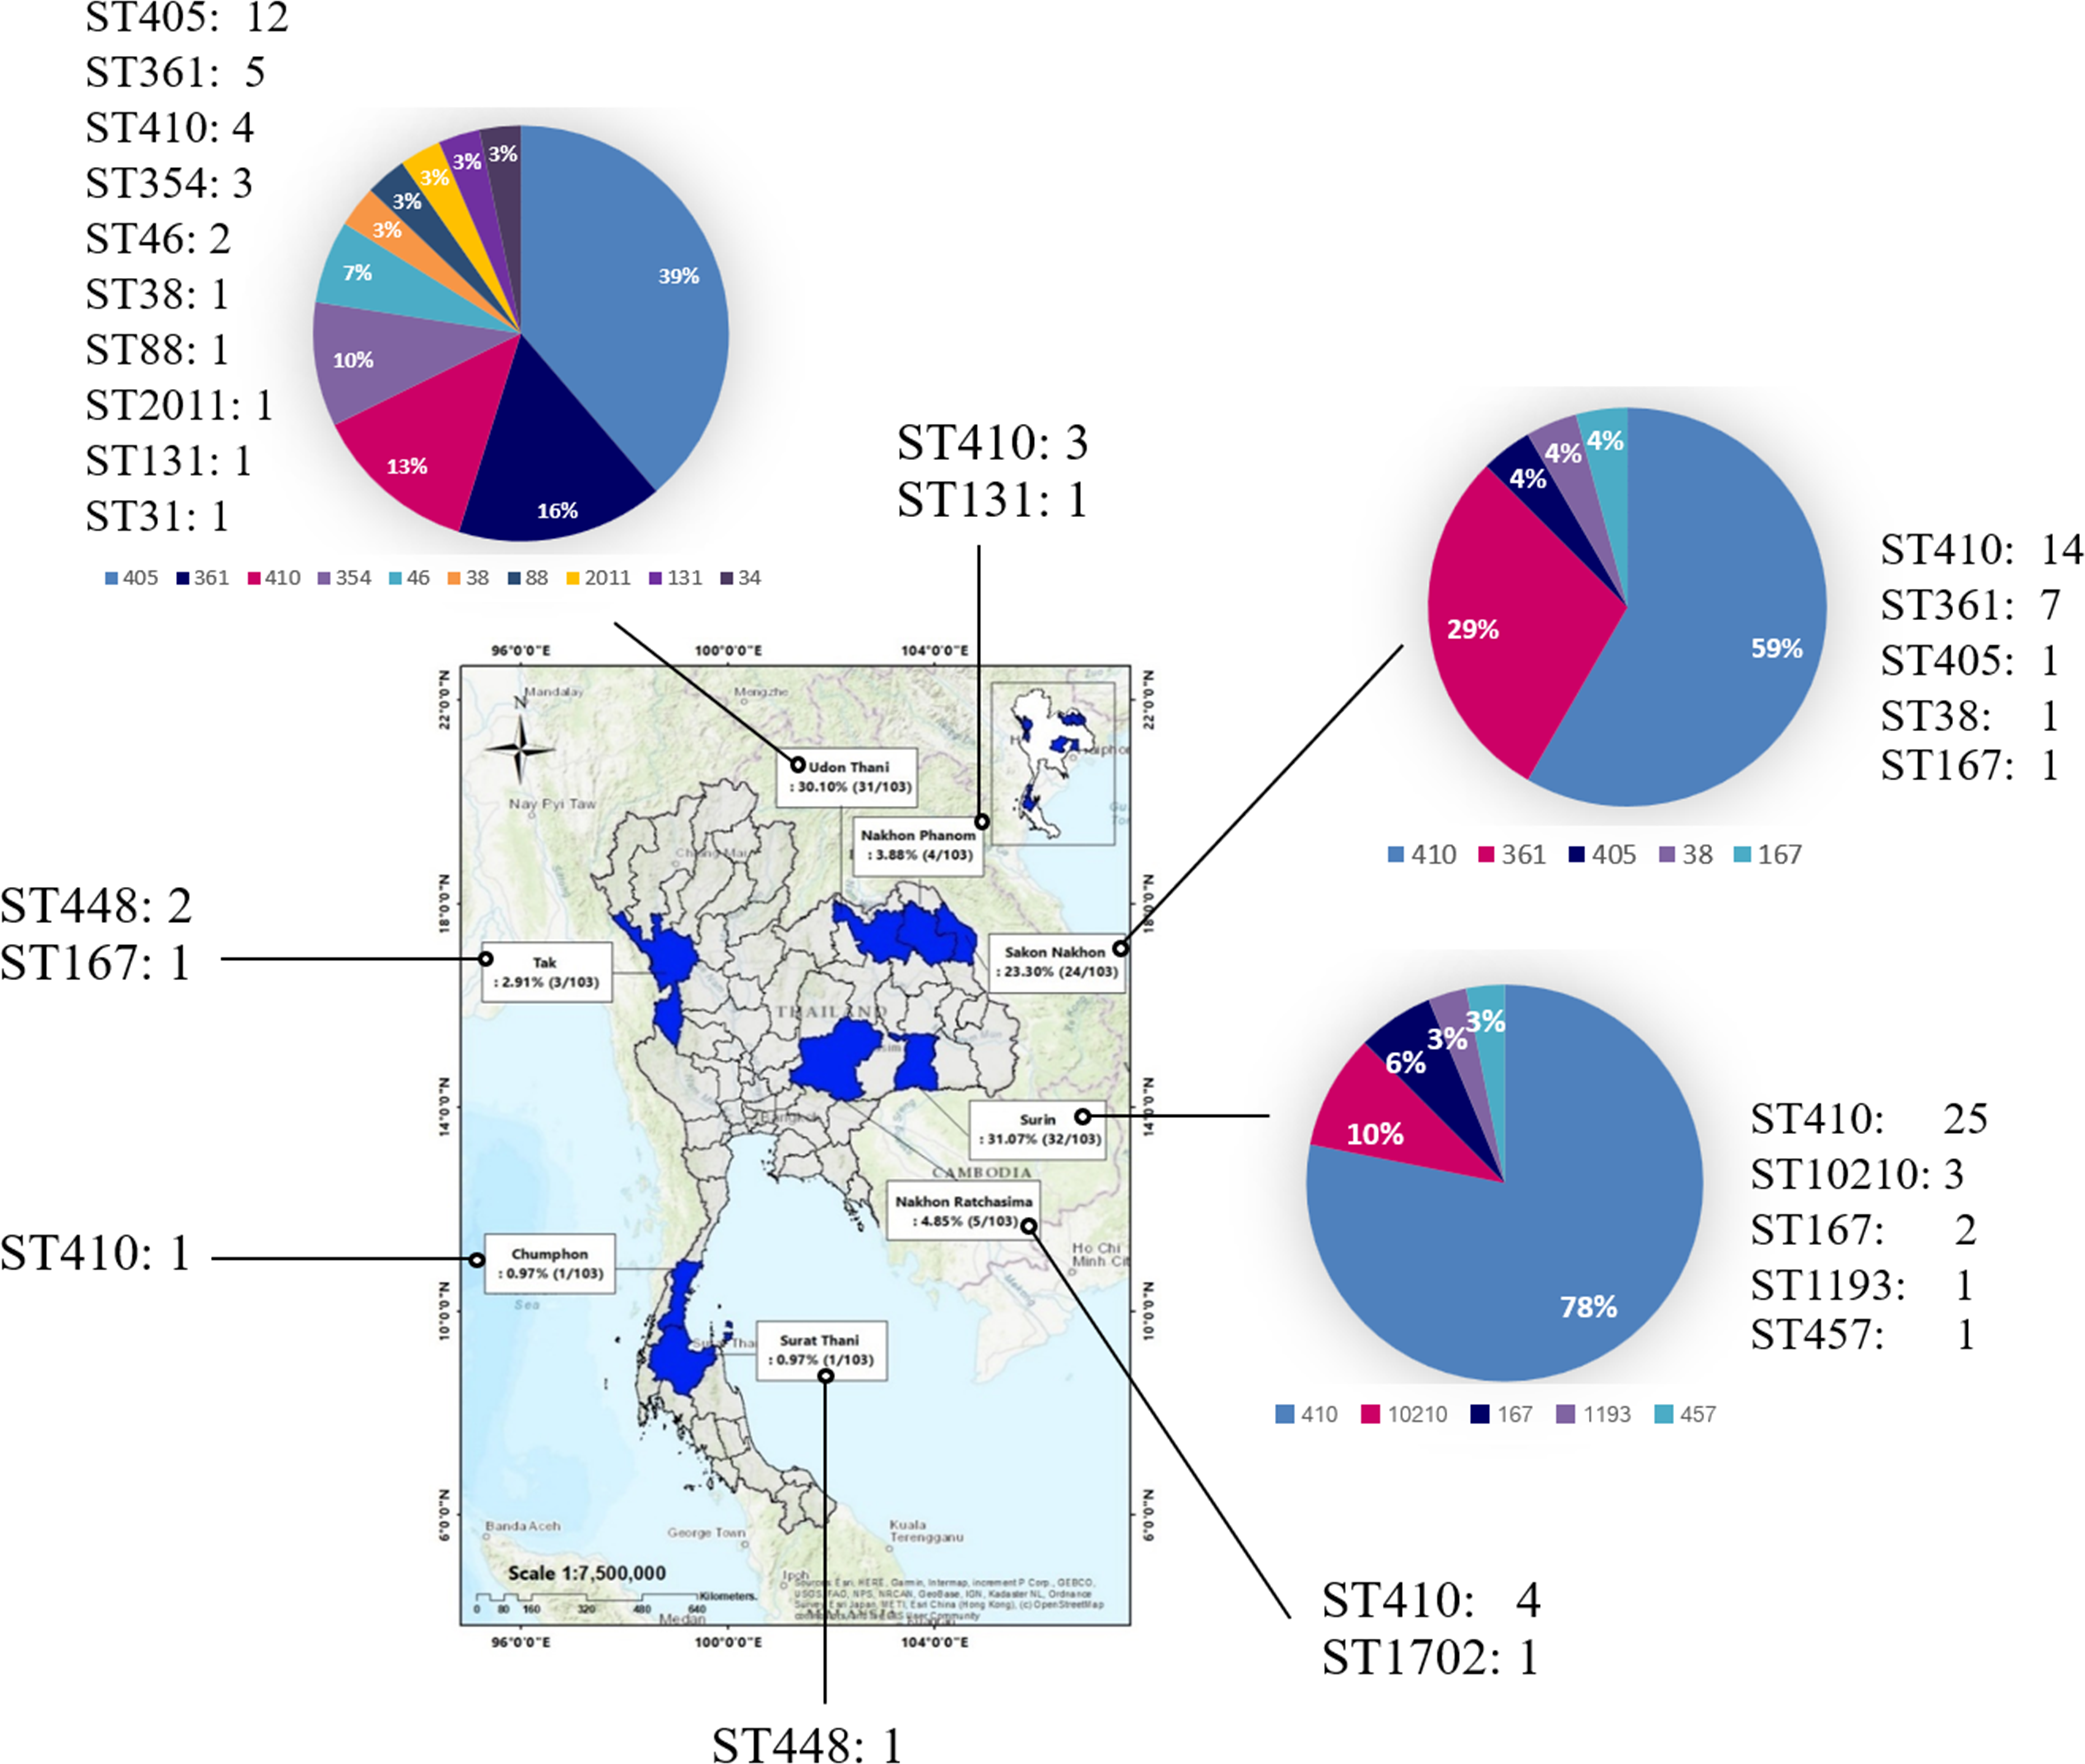
CREc definition in the present study revealed E. coli strains that are resistant to at least one of the carbapenem antibiotics (ertapenem, meropenem, doripenem, or imipenem) or produce a carbapenemase, an enzyme that can destroy carbapenem antibiotics.
Ethical approval
Ethical approval was obtained from the Ethics Committee of Osaka University Graduate School of Medicine, Osaka, Japan, with approval number 14468-5. The present study was conducted following the principles of the Declaration of Helsinki; the need for informed consent was waived.
Antimicrobial susceptibility testing
All isolates were subjected to antimicrobial susceptibility testing using the broth microdilution method according to 2022 Clinical and Laboratory Standards Institute guidelines (Clinical Laboratory Standard Institute, 2022). The broth microdilution method was conducted using cation-adjusted Mueller–Hinton broth (Becton, Dickinson and Company; Sparks, MD, USA) for antimicrobial susceptibility testing of ciprofloxacin, levofloxacin, and carbapenem. Susceptibility to nitrofurantoin (NFT) was carried out via a disk diffusion technique and was interpreted based on Clinical Laboratory standard institute (2022). E. coli ATCC 25922 was used for quality control.
Detection of ESBL production
The production of ESBL was tested for the 103 urinary CREc isolates using the combined disk method with cefotaxime (30 µg) and ceftazidime (30 µg) with or without clavulanic acid (10 µg) (Clinical Laboratory Standard Institute, 2022). An increase in the zone size ≥5 mm for cefotaxime and ceftazidime with or without clavulanic acid was considered to indicate ESBL production (Clinical Laboratory Standard Institute, 2022). E. coli ATCC 25922 was used as a negative control.
Biofilm formation assay
The biofilm production of the urinary CREc isolates was determined using the Congo red agar (CRA) method, as previously described (Tajbakhsh et al., 2016). Briefly, the CREc isolates were cultured on CRA made of brain heart infusion agar with 36 g/L sucrose and Congo red dye 0.8 g/L, and they were incubated at 37 °C for 24–48 h. The biofilm production was characterized based on six color tones of colonies: very black, black, and almost black (interpreted as strong, moderate, and weak biofilm producers, respectively) and bordeaux, red, and very red (reported as non-biofilm producers).
Whole-genome sequencing and genome assembly
Bacterial DNA was extracted using the Applied Biosystems™ MagMAX™ DNA Multi-Sample Ultra 2.0 Kit (Thermo Fisher Scientific, Waltham, MA, USA) according to the manufacturer’s instructions. All 103 isolates were sequenced using the short-read sequencing Illumina platform, HiSeq 3000 (Illumina, San Diego, CA, USA) (Takeuchi et al., 2022).
Complementarily, five isolates (nos. AMR0278, C032, C300, C359, and C439) were selected for long-read sequencing using the Oxford Nanopore Technologies (ONT) platform (Oxford Nanopore Technologies, Oxford, UK) based on their representative strains for each main branch of the dendrogram constructed using Illumina assembled data (Fig. S1). Library preparation and sequencing were determined as described in Boueroy et al. (2022). Raw data were demultiplexed using Guppy v3.4.5 (ONT), specifying the high-accuracy model (–c dna_r9.4.1_450bps_hac.cfg). The ONT adapters were trimmed using Porechop v0.2.4 (https://github.com/rrwick/Porechop).
To obtain complete genomes, hybrid assemblies using the Illumina and ONT data were generated using Unicycler v0.4.8 (Wick et al., 2017; Chen, Erickson & Meng, 2020), and the quality of the assembly checked using QUAST v5.0.2. (Gurevich et al., 2013). Genome sequences were annotated using Prokka v1.14.6 (Seemann, 2014). The quality assemblies of the five isolates were the mean total sequence length (bp), N50, and the GCcontent (%), being 5103581.6, 4865394.2, and 50.62, respectively (Table S2).
Bioinformatics analysis
The multilocus sequence typing (MLST), serotype, and fimH type were analyzed using the Center for Genomic Epidemiology website (http://www.genomicepidemiology.org/). The presence of antimicrobial resistance genes and virulence genes were determined using the ResFinder v4.0 (Bortolaia et al., 2020), CARD (Alcock et al., 2023), and ecoli_vf databases. ABRicate v0.3 (https://github.com/tseemann/abricate) was used to scan assemblies for genes related to antimicrobial resistance and virulence and plasmid replicons compared to the ResFinder, ecoli_VF (https://github.com/phac-nml/ecoli_vf), and PlasmidFinder v2.1 (Carattoli et al., 2014) databases. Phylogenetic group identification was carried out using ClermonTyping 21.03 (http://clermontyping.iame-research.center/index.php) (Clermont et al., 2013). PubMed was searched for primary research articles describing mobile genetic elements (MGEs) carrying the same AMR genes in plasmid to identify putative homologous MGEs.
The QRDR mutations in gyrA, gyrB, parC, and parE were determined by performing a multiple sequence alignment of the protein sequence via Clustal Omega (https://www.ebi.ac.uk/Tools/msa/clustalo/) using the genes of E. coli strain K-12 (MG1655) as a reference.
We aligned the protein sequences of the IncFI plasmid carrying NDM-5 with homologous plasmids reported from China (MF156715.1), France (LR595692.1), and Myanmar (AP019191.1). Additionally, we aligned the protein sequences of the ColKP3-type plasmid carrying blaOXA-181 and qnrS (no. AMR0278) with homologous plasmids reported from the Netherlands (NZ_CP068910.1, NZ_CP068959.1, NZ_CP068881.1, NZ_CP068958.1, and NZ_CP068938.1), Switzerland (NZ_CP048332.1, NZ_CP048327.1, NZ_CP048321.1, and NZ_CP048325.1), Ghana (NZ_CP081309.1), Egypt (NZ_CP048918.1), France (NZ_LR595693.1), China (NZ_CP043335.1), and the United States (NZ_CP034284.1). The annotated MGEs were aligned using clinker and clustermap.js v.0.021 (Gilchrist & Chooi, 2021). The plasmid maps of strain no. AMR0278 was generated using Proksee (Grant, Arantes & Stothard, 2012).
Phylogenetic analysis
Panaroo v1.2.10 (https://github.com/gtonkinhill/panaroo) (Tonkin-Hill et al., 2020) was used to reconstruct the pangenome by grouping genes from the annotated assemblies into homology groups. The core-genome alignment was applied to build the phylogeny with IQ-TREE multicore version 2.2.0.3 (Nguyen et al., 2015). Trees were visualized using the interactive tree of life (iTOL) v6.5 (Letunic & Bork, 2021).
Pathotyping of CREc
Extraintestinal pathogenic E. coli (ExPEC) strains were identified following previously described criteria; they were classified as positive if ≥2 of the following five genes: papA, and/or papC, sfa/focDE, afa/draBC, iutA, and kpsMTII (Johnson et al., 2003). Uropathogenic E. coli (UPEC) was determined following previously reported criteria; specifically, if ≥3 of the four key marker genes (fyuA, chuA, vat, and yfcV) were present (Spurbeck et al., 2012). Avian pathogenic E. coli (APEC) were classified based on the presence or absence of all of the 13 virulence-associated genes: fliCH4, arpA, aec4, ETT22, frzorf4, fyuA, iha, ireA, iroN, iutA1, papA, tsh, and vat (Lucas et al., 2022).
Statistical analysis
Data were analyzed using SPSS version 26.0 (Chicago, IL, USA). Fisher’s exact test was used to establish the association between biofilm formation ability and adhesion factor genes in the 103 urine isolates of CREc. P < 0.05 was considered statistically significant.
Results and Discussion
Genotypic profiles of CREc urinary isolates (FQ-CREc)
Overall, 50.49% (52/103) of the isolates were ST410, followed by ST405 (12.62%, 13/103) and ST361 (11.65%, 12/103) as shown in Table S1. The 52 CREc ST140 isolates from the urine clinical samples were mainly isolated from Surin (25 isolates), Sakon Nakhon (14 isolates), Nakhon Ratchasima (four isolates), and Udon Thani (four isolates) provinces, Thailand (Fig. 1).
The CREc isolates were classified into phylogroups C (54.37%, 56/103), A (19.42%, 20/103), D (14.56%, 15/103), F (4.85%, 5/103), B1 (3.88%, 4/103), and B2 (2.91%, 3/103), respectively (Table S1). As shown in Table 1, the Clermont phylogroup C contained mostly ST410, ST12010, and ST88, whereas phylogroup A contained STs 34, 46, 167, 361, and 1702, while phylogroup D consisted of STs 38 and 405. Conversely, FimH typing demonstrated that the majority of these CREc isolates were fimH 24 (53.40%, 55/103), whereas O8:H9 or H9 (53.40%, 55/103) were the major serotypes in the present study.
| MLST | Clermont phylogroup | blaVEB−type | qnr | aac(6)-Ib-cr | gyrA | gyrB | parC | parE | CPFX | LVFX | Biofilm | Profiles | N |
|---|---|---|---|---|---|---|---|---|---|---|---|---|---|
| 410 | C | – | – | – | + | – | + | + | R | R | Strong biofilm | 1 | 9 |
| 410 | C | – | – | + | + | – | + | + | R | R | non biofilm producers | 2 | 7 |
| 410 | C | – | – | + | + | – | + | + | R | R | non biofilm producers | 3 | 6 |
| 410 | C | – | – | + | + | – | + | + | R | R | weak biofilm | 4 | 3 |
| 410 | C | – | – | + | + | – | – | + | R | R | non biofilm producers | 5 | 2 |
| 410 | C | – | – | + | + | – | – | + | R | R | non biofilm producers | 6 | 2 |
| 410 | C | – | – | + | + | – | + | – | R | R | non biofilm producers | 7 | 1 |
| 410 | C | – | qnrS 1 | + | + | – | + | + | R | R | non biofilm producers | 8 | 1 |
| 410 | C | – | – | + | + | – | + | + | R | R | Strong biofilm | 9 | 1 |
| 410 | C | – | – | – | + | – | + | + | R | R | Strong biofilm | 10 | 1 |
| 410 | C | – | – | – | + | – | + | + | R | R | non biofilm producers | 11 | 1 |
| 410 | C | – | - | – | + | – | + | + | R | R | weak biofilm | 12 | 1 |
| 410 | C | – | – | + | + | – | + | + | R | R | weak biofilm | 13 | 1 |
| 410 | C | – | - | + | + | – | + | + | R | R | Strong biofilm | 14 | 1 |
| 410 | C | – | – | – | + | – | + | + | R | R | weak biofilm | 15 | 1 |
| 410 | C | – | – | + | + | – | + | + | R | R | weak biofilm | 16 | 1 |
| 410 | C | – | – | + | + | – | + | + | R | R | moderate biofilm | 17 | 1 |
| 410 | C | – | – | + | + | – | + | + | R | R | weak biofilm | 18 | 1 |
| 410 | C | – | – | + | + | – | + | + | R | R | non biofilm producers | 19 | 1 |
| 410 | C | – | qnrS 1 | – | + | – | + | + | R | R | non biofilm producers | 20 | 1 |
| 410 | C | – | – | + | + | – | + | – | R | R | non biofilm producers | 21 | 1 |
| 410 | C | – | – | + | + | – | + | + | R | R | Strong biofilm | 22 | 1 |
| 410 | C | VEB-1 | - | + | + | – | + | + | R | R | non biofilm producers | 23 | 1 |
| 410 | C | – | – | + | + | – | + | + | R | R | Strong biofilm | 24 | 1 |
| 410 | C | – | - | + | + | – | + | + | R | R | Strong biofilm | 25 | 1 |
| 410 | C | – | - | + | + | – | + | + | R | R | non biofilm producers | 26 | 1 |
| 410 | C | VEB-1 | qnrA1 | + | + | – | + | + | R | R | non biofilm producers | 27 | 1 |
| 410 | C | – | qnrB17,qnrS1 | + | + | – | + | + | R | R | moderate biofilm | 28 | 1 |
| 410 | C | – | qnrS1 | + | + | – | + | + | R | R | non biofilm producers | 29 | 1 |
| 405 | D | – | – | + | + | + | + | + | R | R | weak biofilm | 1 | 2 |
| 405 | D | – | – | + | + | + | + | + | R | R | non biofilm producers | 2 | 2 |
| 405 | D | – | – | – | + | + | + | + | R | R | weak biofilm | 3 | 2 |
| 405 | D | – | – | – | + | + | + | + | R | R | non biofilm producers | 3 | 1 |
| 405 | D | – | – | + | + | + | + | + | R | R | Strong biofilm | 4 | 1 |
| 405 | D | – | – | + | + | + | – | + | R | R | weak biofilm | 5 | 1 |
| 405 | D | – | – | + | + | + | + | + | R | R | weak biofilm | 6 | 1 |
| 405 | D | – | – | – | + | + | – | + | R | R | non biofilm producers | 7 | 1 |
| 405 | D | – | – | + | + | + | + | + | R | R | weak biofilm | 8 | 1 |
| 405 | D | – | – | – | + | + | – | + | R | R | weak biofilm | 9 | 1 |
| 361 | A | – | – | – | + | – | + | – | R | R | non biofilm producers | 1 | 5 |
| 361 | A | – | – | – | + | – | + | – | R | R | non biofilm producers | 2 | 3 |
| 361 | A | – | – | + | + | – | + | – | R | R | non biofilm producers | 3 | 1 |
| 361 | A | – | – | – | + | + | + | – | R | R | non biofilm producers | 4 | 1 |
| 361 | A | – | – | + | + | – | + | – | R | R | non biofilm producers | 5 | 1 |
| 361 | A | – | – | – | + | – | – | – | R | R | non biofilm producers | 6 | 1 |
| 167 | A | – | – | – | + | – | + | + | R | R | weak biofilm | 1 | 1 |
| 167 | A | – | qnrS1 | – | + | – | + | + | R | R | Strong biofilm | 2 | 1 |
| 167 | A | – | – | – | + | – | + | + | R | R | weak biofilm | 3 | 1 |
| 167 | A | – | - | + | + | – | + | + | R | R | weak biofilm | 4 | 1 |
| 448 | B1 | – | – | + | + | – | + | + | R | R | weak biofilm | 1 | 1 |
| 448 | B1 | – | – | + | + | – | + | + | R | R | non biofilm producers | 2 | 1 |
| 448 | B1 | – | – | – | + | – | + | + | R | R | weak biofilm | 3 | 1 |
| 448 | B1 | – | – | – | + | – | + | + | R | R | non biofilm producers | 4 | 1 |
| 354 | F | – | – | – | + | + | + | + | R | R | Strong biofilm | 1 | 1 |
| 354 | F | – | – | – | + | + | + | + | R | R | moderate biofilm | 2 | 1 |
| 354 | F | – | qnrB6 | – | + | + | + | + | R | R | moderate biofilm | 3 | 1 |
| 10210 | C | – | – | + | + | – | + | + | R | R | non biofilm producers | 1 | 1 |
| 10210 | C | – | – | + | + | – | + | + | R | R | Strong biofilm | 2 | 1 |
| 10210 | C | – | – | + | + | – | – | – | R | R | non biofilm producers | 3 | 1 |
| 46 | A | – | – | + | + | – | + | + | R | R | non biofilm producers | 1 | 1 |
| 46 | A | – | – | + | + | – | + | + | R | R | weak biofilm | 2 | 1 |
| 38 | D | – | – | + | + | – | + | – | S | S | moderate biofilm | 1 | 1 |
| 38 | D | – | – | – | + | – | + | + | R | R | weak biofilm | 2 | 1 |
| 131 | B2 | – | – | + | + | – | + | + | R | R | moderate biofilm | 1 | 1 |
| 131 | B2 | – | – | – | + | – | + | + | R | R | Strong biofilm | 2 | 1 |
| 2011 | F | – | – | + | + | + | + | + | R | R | moderate biofilm | 1 | 1 |
| 457 | F | – | – | – | + | + | + | + | R | R | moderate biofilm | 1 | 1 |
| 1193 | B2 | – | – | – | + | – | + | + | R | R | moderate biofilm | 1 | 1 |
| 1702 | A | – | – | – | + | – | + | + | R | R | non biofilm producers | 1 | 1 |
| 34 | A | – | – | + | + | – | – | – | S | S | non biofilm producers | 1 | 1 |
| 88 | C | – | – | – | + | + | + | S | S | non biofilm producers | 1 | 1 |
Notes:
- MLST
-
multilocus sequence typing
- CPFX
-
ciprofloxacin
- LVFX
-
levofloxacin
- +
-
positive
- -
-
negative
- R
-
resistance
- S
-
sensitivity
To determine genetic relationships, a core-genome SNP-based phylogeny of the 103 CREc genomes is shown in Fig. 2. Most CREc urinary isolates were divided into six large clusters based on the main branches of the tree. The first cluster comprised ST361. The second cluster contained ST46. The third cluster consisted of ST34, ST167, and ST1702. The fourth cluster contained ST1193, ST131, ST2011, ST457, and ST354. The fifth cluster consisted of ST38 and ST405. The last cluster contained mainly ST410 strains and ST88 and ST448 (Fig. 2).
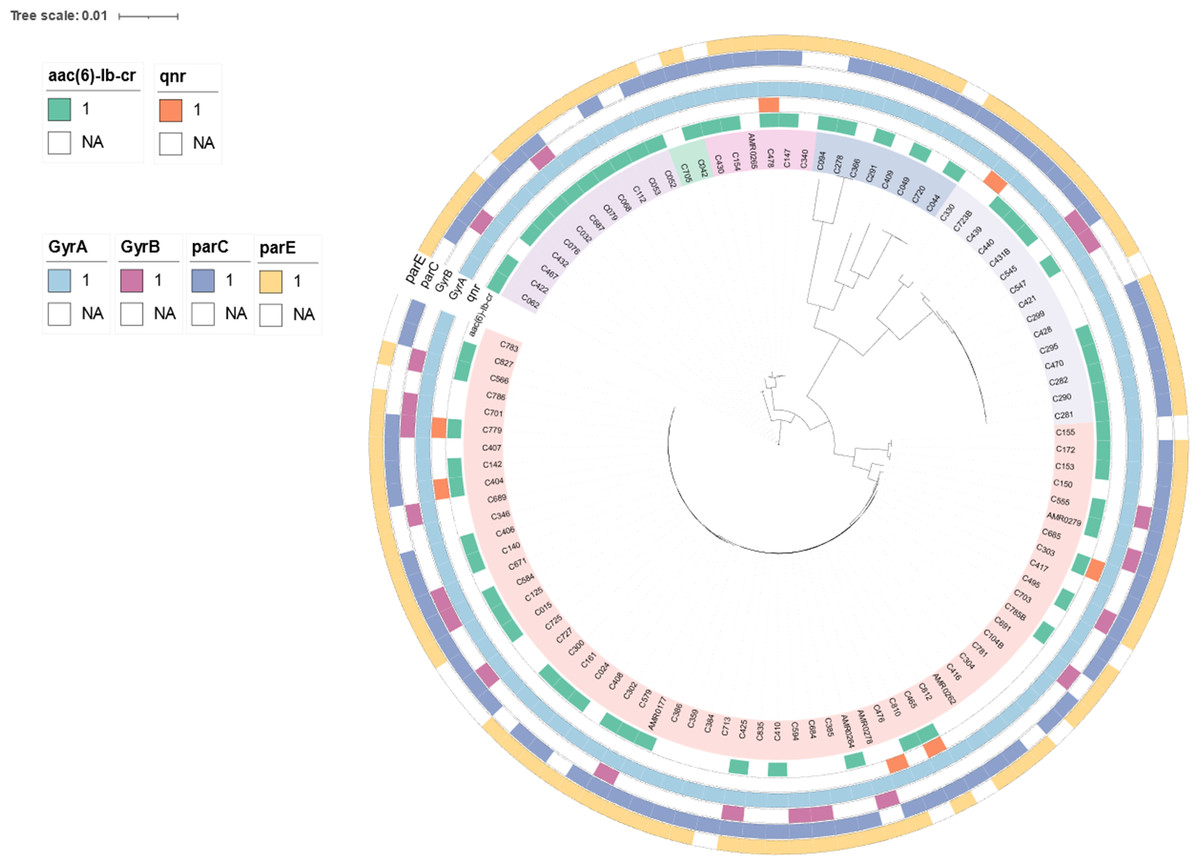
Figure 2: The existence of PMQR genes (aac(6′)-Ib and qnr) and QRDR mutations (gyrA, gyrB, parC, and parE) in CREc urinary isolates.
Core-genome maximum-likelihood phylogeny based on 103 CREc isolates genomes reconstructed using Panaroo and IQ-TREE. The tree was visualized using iToL.
The present study revealed that the CREc urinary isolates mainly belonged to the phylogroup C, which are considered to be associated with commensal status or intestinal pathotypes (Tenaillon et al., 2010). Nevertheless, the UTI E. coli isolates were significantly more frequent in the phylogroups B2 and D (Amarsy et al., 2019). Our study showed that phylogroup D had second prevalence and phylogroup B2 had rare status. The Clermont phylogroup C contained mainly ST410. This ST is an emerging and international high-risk clone worldwide, associated with a large number of clinical infections (Roer et al., 2018). In Thailand, ST410 has been identified in clinical isolates that co-harbored mcr and blaNDM (Boueroy et al., 2022; Paveenkittiporn et al., 2021).
Pathotyping, virulence genes, and biofilm formation of urinary CREc
Pathotyping identified only 17.48% (18/103) ExPEC of urinary CREc isolates. One (0.97%, 1/103) CREc isolate was identified as UPEC (≥3 UPEC virulence factors) (Table 2). No APEC was found in the present study. Although most urinary CREc in this study could not be classified, they seem to be commensal or non-pathogenic pathotypes. Among the three investigated virulence factor classes, 20.39% (21/103) of the isolates were identified as having two UPEC-associated markers (Table 2). All 103 urinary CREc isolates carried one or more APEC-associated markers: fimC (91.26%, 94/103), fyuA (57.28%, 59/103), irp2 (47.57%, 49/103), iss (24.27%, 25/103), iucD (17.48%, 18/103), papC (10.68%, 11/103), astA (2.91%, 3/103), and vat (0.97%, 1/103) (Table 2).
| Virulence factor classes | Virulence factors | Prevalence (%) of isolates | No. of positive/ No. of total |
|---|---|---|---|
| Extraintestinal pathogenic E. coli (ExPEC) | papAH | 15.53 | 16/103 |
| papC | 10.68 | 11/103 | |
| sfa/focDE | 0 | 0/103 | |
| afa/draBC | 3.88 | 4/103 | |
| kpsM | 18.45 | 19/103 | |
| iutA | 8.74 | 9/103 | |
| ≥2 ExPEC VFs | 17.48 | 18/103 | |
| Uropathogenic E. coli (UPEC) | vat | 0.96 | 1/103 |
| fyuA | 57.69 | 59/103 | |
| chuA | 22.12 | 22/103 | |
| yfcV | 0 | 0/103 | |
| ≥3 UPEC VFs | 0.97 | 1/103 | |
| Avian pathogenic E. coli (APEC) | fliCH4 | 0 | 0/103 |
| arpA | 0 | 0/103 | |
| aec4 | 0 | 0/103 | |
| ETT22 | 0 | 0/103 | |
| frzorf4 | 0 | 0/103 | |
| fyuA | 57.28 | 59/103 | |
| iha | 0 | 0/103 | |
| ireA | 0 | 0/103 | |
| iroN | 0.97 | 1/103 | |
| iutA1 | 8.74 | 9/103 | |
| papA | 15.53 | 16/103 | |
| tsh | 0 | 0/103 | |
| vat | 0.97 | 1/103 | |
| 13 APEC | 0 | 0 |
Notes:
- VFs
-
virulence factors
In total, 37 virulence genes were examined and categorized as adhesion molecules, invasion genes, toxins, iron uptake molecules, autotransporter systems, and protection factors, according to the genotypic profiles of the 103 urinary CREc isolates (Table S3). Overall, fim (100%), csg (100%), and ibeABC (100%) were the virulence genes with the highest distributions among isolates, followed by ecp (98.06%), espl (97.09%), hlyE (97.09%), eae (78.64%), cah (67.96%), upaG/ehaG (65.05%), tia (49.51%), and fyuA (47.57%) (Table S3). This was not surprising because these virulence factors, such as type 1 fimbriae (fim) and the major pilus subunit (ecpA), have also been reported in commensal E. coli (Pusz et al., 2014; Blackburn et al., 2009).
Almost all the ExPEC isolates in the presents study belonged mainly to the phylogenetic groups B2 and D and carried various virulence factors compared to the other phylogenetic groups (Table S4). Concordance with another report identified a higher number of virulence genes in phylogroups B2 and D compared to other groups in UTI E. coli isolates (Lee & Moon, 2016). In contrast, most urinary CREc isolates in the present study were not classified as any pathotype, which was consistent with them being Clermont types C and A (73.79%; 76/103).
In the biofilm assay, 50.49% (52/103) of the urinary CREc isolates produced weak-to-strong biofilm formation (Tables 1 and S5). Among these isolates, 20%, 9%, and 23% were strong, moderate, and weak biofilm producers, respectively. More than one-half (71.84%; 74/103) of these isolates could also be classified as weak and non-biofilm formation. In agreement with our findings, biofilm formation has been reported as low in prevalence in commensal E. coli strains (Karam, Habibi & Bouzari, 2018). According to another report, biofilm formation has greater carriage of adhesin genes (Fim, Pap, Sfa, and Afa) compared to non-biofilm formers (Katongole et al., 2020). Nevertheless, we did not observe any relationship between biofilm formation ability and the carriage of any adhesin genes (Table S6). Consistent with another report, the biofilm formation in carbapenem-resistant E. coli from the UTIs did not reveal any significant difference in the carriage rate of fimbriae genes (Chen et al., 2023).
Antimicrobial susceptibility and resistant genes in urinary CREc isolates
Among the 103 urinary CREc isolates, resistance levels of ciprofloxacin and levofloxacin were 97.09% (100/103) and 94.17% (97/103), respectively. Almost all isolates resisted FQs, with MICs, ranging from 2 to >32 µg/ml (Tables 2 and S5). The ESBL screening test showed that 77.67% of the isolates were ESBL producers, among which, 97.50% were also resistant to FQs (Tables 1 and S3). The resistance rate of NFT was 33.98% (35/103) in the CREc urinary isolates (Tables 1 and S3).
Carbapenems are the drug of choice for complicated UTIs caused by multidrug-resistant Enterobacteriaceae, especially those due to ESBL-producing E. coli (Amladi et al., 2019). Although FQs are the drug of choice to treat UTIs treatment, FQ resistance is an increasing issue that causes concern in several countries, including Greece, Senegal, and Saudi Arabia (Yang et al., 2010; Chaniotaki et al., 2004). National Antimicrobial Resistance Surveillance Thailand (http://narst.dmsc.moph.go.th/) reported that E. coli urinary isolates had a high percentage of resistance against ciprofloxacin (67.6%) and levofloxacin (66.6%).
Our urinary CREc isolates exhibited high resistance to ciprofloxacin (97.09%) and levofloxacin (94.17%). The high frequency among FQ-resistant determinants in urinary CREc isolates in our study raises serious concerns and the need to identify alternative antibiotics for UTI therapy. One choice is nitrofurantoin as a suitable candidate for the treatment of UTIs caused by multidrug-resistant pathogens (Munoz-Davila, 2014). Several studies have reported a low resistance rate of urinary E. coli to NFT, including 18.4% in Turkey (Pullukçu et al., 2007), 6.2% in Spain, and 3.7% in England (Farrell et al., 2003; Gobernado et al., 2007). Resistance rates to NFT in the CREc urinary isolates in the present study showed a low prevalence (33.98%) compared to other antibiotics. The resistance rate of NFT remained virtually unchanged, suggesting that it may be an important and economical option for UTI treatment (McKinnell et al., 2011).
Among the 103 isolates, 82 carried blaCTX-M-type ESBL genes (79.61%), with blaCTX-M-15 being predominant in urinary CREc isolates (74/82 (90.24%) (Table S7). In addition, blaCTX-M-27 was detected in ST131 (no. C366) and ST38 isolates (nos. C330 and C723B). The coexistence of blaCTX-M-55 and blaCTX-M-24 was identified in three CREs isolates with ST354. The carbapenemase genes identified were blaNDM-5 (74.76%, 77/103), followed by blaNDM-1 (17.48%, 18/103) (17.48%, 18/103) (Table S7). Other β-lactamase genes were detected in these urinary CREc isolates, such as blaTEM-1B (84.47%, 87/103), blaCMY (67%, 69/103), blaVEB (1.94%, 2/103), and blaTEM-150 (0.975, 1/103) (Table S7).
In this study, CREc urinary isolates harboring blaNDM-5 and blaCTX-M-15 were the majority of carbapenemase and ESBL genes, respectively. Other studies have revealed that NDM, especially blaNDM-5, is the main carbapenemase gene in CRE in Thailand (Takeuchi et al., 2022; Paveenkittiporn et al., 2021). The most widely distributed blaCTX-M enzyme worldwide is blaCTX-M-15, which is commonly found in E. coli isolates causing UTI (Price et al., 2013).
The PMQR genes were broadly identified among the urinary CREc isolates, with aac(6′)-Ib being present in 60 isolates (58.25%), qnrA1 in one isolate (0.97%), qnrB6 in one isolate (0.97%), qnrS1 in four isolates (3.88%), and qnrB17+qnrS1 in one isolate (0.97%) (Table 2 and Fig. 2). The coexistence of the qnrA1 and aac(6′)-Ib, or qnrS1 and aac(6′)-Ib, and qnrB17 and qnrS1 genes was detected in the ST410 lineage (Table 2). The coexistence of the blaCTX-M and PMQR genes was identified in 57 (55.34%) of the CREc isolates. The coexistence of blaTEM-1B and aac(6′)-Ib was the most widely distributed resistance genotype, which was observed in 59 (57.28%) of the isolates (Table 2). The coexistence of blaTEM-150 and qnrB6 was identified in one CRE isolate with ST354.
Analysis of the QRDR mutations in gyrA, gyrB, parC, and parE revealed that all isolates (100%) carried the gyrA- resistant variants S83L (99.03%, 102/103) and D87N (97.09%, 100/103) (Table 3). Resistance due to gyrB variants was identified in 20/103 (19.42%) of the isolates with the A618T variant being the most frequent substitution (75%, 15/20). The parC resistance-associated substitution was identified in 92/103 (89.32%) of the isolates with the substitution S80I being widely prevalent (94.57%, 87/92) (Table 3). The resistance variants in parE were detected in 86/103 (83.50%) of the isolates with the substitution S458A being the most common (86.05%, 74/86) (Table 3). The coexistence of mutations in the gyrA, gyrB, parC, and parE genes was detected in 14.56% (15/103) of the isolates, specifically in the ST405 (66.67%, 10/15), ST354 (20%, 3/15), ST457 (6.67%, 1/15), and ST2011 (6.67%, 1/15) lineages (Tables 1 and 3). Among these 15 isolates, all were resistant to FQ (100%, 13/13), were ESBL producers (86.67%, 13/15), and produced biofilms (80%, 12/15) (Tables 3 and S5).
| ST | GyrA | GyrB | parC | parE | Biofilm formations | N |
|---|---|---|---|---|---|---|
| 410 | S83L,D87N | - | S80I | S458A | non biofilm producers | 15 |
| 410 | S83L,D87N | - | S80I | S458A | Strong biofilm | 13 |
| 410 | S83L,D87N | - | S80I | S458A | weak biofilm | 8 |
| 410 | S83L,D87N | - | S80I, D475R | S458A | non biofilm producers | 6 |
| 410 | S83L,D87N | - | - | S458A | non biofilm producers | 4 |
| 410 | S83L,D87N | - | S80I | - | non biofilm producers | 2 |
| 410 | S83L,D87N | - | S80I, D475R | S458A | Strong biofilm | 2 |
| 410 | S83L,D87N | - | S80I | S458A | moderate biofilm | 2 |
| 405 | S83L,D87N,D678E | A618T, T653A, I663V | S80I, D475R | S458A | weak biofilm | 3 |
| 405 | S83L,D87N,D678E | A618T, T653A, I663V | S80I, D475R | S458A | non biofilm producers | 2 |
| 405 | S83L,D87N,D678E | A618T, T653A, I663V | S80I | S458A | weak biofilm | 2 |
| 405 | S83L,D87N,D678E | I663V | S80I | S458A | non biofilm producers | 1 |
| 405 | S83L,D87N,D678E | A618T, T653A, I663V | A192V, Q481H | V136I, I529L | Strong biofilm | 1 |
| 405 | S83L,D87N,D678E | A618T, T653A, I663V | S458A | weak biofilm | 1 | |
| 405 | S83L,D87N,R237H | A618T, T653A, I663V | S458A | non biofilm producers | 1 | |
| 405 | S83L,D87N,D678E | A618T, T653A, I663V | A192V, Q481H | V136I, I529L | weak biofilm | 1 |
| 405 | S83L,D87N,D678E | I663V | S458A | weak biofilm | 1 | |
| 361 | S83L,D87N | - | S80I, A84G, P401L | - | non biofilm producers | 5 |
| 361 | S83L,D87N | - | P401L | - | non biofilm producers | 3 |
| 361 | S83L,D87N | - | S80I, A84G | - | non biofilm producers | 2 |
| 361 | S83L,D87N | S464F | S80I, P461L | - | non biofilm producers | 1 |
| 361 | S83L,D87N | - | - | - | non biofilm producers | 1 |
| 167 | S83L,D87N | - | S80I, P577L | S458A | weak biofilm | 1 |
| 167 | S83L,D87N | - | S80I, P577L | S458A | Strong biofilm | 1 |
| 167 | S83L,D87N | - | S80I, D475R | S458A | weak biofilm | 1 |
| 167 | S83L,D87N | - | P577L | S458A | weak biofilm | 1 |
| 448 | S83L,D87N | – | S80I, L440R, | S458A | weak biofilm | 1 |
| 448 | S83L,D87N,R237H,D678E | – | S80I, L440R | S458T | weak biofilm | 1 |
| 448 | S83L,D87N,R237H,D678E | - | S80I, L440R | S458T | non biofilm producers | 1 |
| 448 | S83L,D87N | – | S80I, L440R, | S458A | non biofilm producers | 1 |
| 354 | S83L, D87N | E185D, S492N, A618T | S80I, E84G, R236L, D475E | V136I, V153I, I355T | Strong biofilm | 1 |
| 354 | S83L, D87N | E185D, S492N, A618T | S80I, E84G, R236L, D475E | V136I, V153I, I355T | moderate biofilm | 1 |
| 354 | S83L, D87N | A618T, T653A, I663V | S80I, R236L, D475D | V136I, V153I, I355T | moderate biofilm | 1 |
| 131 | S83L, D87N, A828S | – | S80I, E84V, I192V, A471G, D475R, Q481H | V136I, I529L | Strong biofilm | 1 |
| 131 | S83L, D87N, A828S | – | S80I, E84V, I192V, A471G, D475R, Q481H | V136I, I529L | moderate biofilm | 1 |
| 46 | S83L, D87N | – | S57T, S80I, D197E, K200N, D309E, D475E | Q428P | non biofilm producers | 1 |
| 46 | S83L, D87N | – | S57T, S80I, D157E, K159N, D309E, L343R, D475D | Q428P | weak biofilm | 1 |
| 10210 | S83L, D87N | – | S80I, D475R | S458A | non biofilm producers | 1 |
| 10210 | S83L, D87N | – | S80I | S458A | Strong biofilm | 1 |
| 10210 | S83L, D87N | – | – | – | non biofilm producers | 1 |
| 38 | D678E | – | D475E, Q695L | – | moderate biofilm | 1 |
| 38 | S83L, D87N, D678E | – | S80I, A90V, D475R | D463N | weak biofilm | 1 |
| 2011 | S83L, D87N, D678E | S492N, A618T, E655D | S80I, D475R | T172A, S458A | moderate biofilm | 1 |
| 457 | S83L,D87N,A863V | S492N | S80I | S458A | moderate biofilm | 1 |
| 1193 | S83L, D87N, D678E, A828S | – | S80I | L254Q | moderate biofilm | 1 |
| 1702 | S83L, D87N | – | S80I | S458A | non biofilm producers | 1 |
| 34 | S83L | – | – | – | non biofilm producers | 1 |
| 88 | S83L | D553E | – | A342T | non biofilm producers | 1 |
The occurrence of the QRDR mutations is common in FQ-resistant E. coli isolated from urine since the mutations play a significant role in conferring quinolone resistance. Mutations in gyrA are the primary cause of FQ resistance in Gram-negative clinical isolates (Varughese et al., 2018). In the present study, the QRDR gyrA S83L and D87N variants were the most common (97.09%), followed by parC S80I (84.47%), parE S458A (72.82%), and gyrB A618T (14.56%). Similarly, the mutations in gyrA (S83L, D87N, or D87Y), parC (E84V and S80I) parE (I529L, L416F, I444F, S458T, D475E, and S458A) have been identified in FQ-resistant E. coli clinical isolates in several other studies (Lindgren et al., 2005; Kim, Kim & Lee, 2022; Shigemura et al., 2012).
In the present study, the aac(6′)-Ib-cr gene was predominant (58%, 58/100) among the ciprofloxacin-resistant CREc isolates. Similarly, this gene was highly frequent in ciprofloxacin-resistant E. coli from UTI patients in Nigeria (Eghieye et al., 2020). In contrast, qnrA, qnrB, and qnrS were reported as highly prevalent in other studies (Eghieye et al., 2020; Ramírez-Castillo et al., 2018) but were low in the present study. Furthermore, the oqxAB gene was identified in 5.92% of the FQ non-susceptible E. coli isolated from UTI patients in Taiwan (Kuo et al., 2022); however, this was not identified in the present study.
Plasmidome in CREc urinary isolates
The most frequent plasmid replicon among the CREc isolates was IncFI (99.03%, 102/103), followed by Col (89.32%, 92/103) and IncI (19.42%, 20/103) (Table S5). Among the 103 urinary CREc isolates, we selected five representative strains, consisting of AMR0278, C032, C300, C359, and C439, for long-read sequencing to obtain complete genomes. Two different plasmid replicon types were identified in the 5 blaNDM-harboring isolates (Fig. 3). The most frequent plasmid replicon type was IncFI (60%, 3/5), followed by IncFI/IncQ (40%, 2/5). The sizes of the three IncFI plasmids were in the range 86,537–107,837 bp, whereas the two IncFI/IncQ plasmids were in the range 108,269–134,243 bp.
Figure 3: Protein level alignment of the blaNDM carrying plasmid in five CREc isolates.
Two different plasmid replicon types including IncFI and IncFI/IncQ were identified (A). Protein level alignment of the IncFI plasmid (no. AMR0278) carried NDM-5 with previously found in strains isolated in other country (B). Genes of interest are colored and defined in the legend. Alignments were made using clinker and clustermap.js and visualized using ApE v3.0.8. (C). Horizontal arrows indicate location, size, and direction of transcription, and visualized Proksee.
Among the NDM-harboring plasmids, other antimicrobial-resistant genes (blaOXA-1, blaCTX-M-15, blaTEM-1B, and aac(6′)-Ib) were detected in isolate nos. AMR0278, C300, C359, and C439 but not identified in C032 (Fig. 3A). Notably, the IncFI plasmid (no. AMR0278) carried three copies of the blaNDM-5 gene in the same plasmid, and, to the best of our knowledge, this is the first such plasmid reported (Fig. 3). The plasmid carried NDM-5 whose organization was close to the pM629-2-NDM5 of E. coli M629-2 isolated in Myanmar that also carried other antimicrobial-resistant genes (blaOXA-1, blaCTX-M-15, blaTEM-1B, and aac(6′)-Ib) at a percentage identity of 99.97% (Fig. 3B). We identified several insertion sequences upstream of the three NDM-5 genes in the IncFI plasmid (Fig. 3C).
This IncFI plasmid in the present study also carried blaOXA-1, blaCTX-M-15, blaTEM-1B, and aac(6′)-Ib. IncFII plasmids carrying NDM genes have a restricted host range; however, they are being increasingly reported (Pitart et al., 2015; Fiett et al., 2014). The IncFII-type plasmid (90 kb) reportedly co-carried blaNDM-5 together with blaTEM-1 and rmtB in a CREc isolate from a urine culture in Spain (Pitart et al., 2015). More recently, two blaNDM-5-carrying IncF plasmids were present in ST167 E. coli strains isolated in China (Feng et al., 2018) and Italy (Giufrè et al., 2018).
Additionally, strain no. AMR0278 carried the blaOXA-181 and qnrS1 genes located on a nonconjugative ColKP3-type plasmid that was 51,478 bp long (Fig. 4). This plasmid contained type IV secretory genes upstream and the IS6 family genes upstream and downstream of the blaOXA-181 and qnrS1 genes. In addition, this plasmid showed high similarity to the plasmids of E. coli and Klebsiella pneumoniae from Switzerland, the Netherlands, Ghana, Egypt, France, China, and the United States (Fig. 4). The ColKP3 plasmid type harbored almost all classes of AMR genes, such as blaOXA-181 and blaOXA-232, and is common in K. pneumoniae (Ragupathi et al., 2019; Weng et al., 2020; Naha et al., 2021). The present study showed that a nonconjugative ColKP3-type plasmid carried the blaOXA-181 and qnrS genes in an E. coli isolate.
Figure 4: Protein level alignment of the ColKP3-type plasmid carrying blaOXA-181 and qnrS (no. AMR0278) with previously found plasmids in strains isolated in other country.
Horizontal arrows indicate location, size, direction of transcription, and orientation of open reading frames. Alignments were made using clinker and clustermap.js.
A limitation of the present study was that we selected only five isolates to do complete genomes using the ONT platform, which may not have been representative of all the isolates in this study. Although we chose from the representative strains in each cluster of the phylogenetic tree, it could not cover all the studied strains that may have presented new characteristics. Therefore, further study with current CRE isolates should be undertaken and the results compared.
Conclusions
NDM-5 and CTX-M-15 were the predominant carbapenemase and ESBL genes, respectively, among the 103 urinary CREc isolates. The mutations in the QRDR of the gyrA and parC genes were the most predominant, followed by the presence of the PMQR determinant aac(6′)-Ib. The coexistence of blaCTX-M-15 and aac(6′)-Ib was widely observed. Among the CREc isolates, resistance to ciprofloxacin and levofloxacin was greater than 90%. NFT maintained high sensitivity rates greater than 60%. They can be chosen as empirical antimicrobial treatments for uncomplicated UTIs. The results of this study highlighted the significant frequency of FQ resistance in CREc urinary isolates in Thailand, which is reflected in infection control and must be adopted to prevent further spread, emphasizing the need to expand antimicrobial drug resistance screening at hospitals. Therefore, to decrease the prevalence of FQ-resistant determinants in urinary CREc organisms in the future, continual epidemiologic surveillance and monitoring of antimicrobial prescriptions and consumption are required.