
Comparative transcriptomics and bioinformatics analysis of genes related to photosynthesis in Eucalyptus camaldulensis
- Published
- Accepted
- Received
- Academic Editor
- Ganesh Nikalje
- Subject Areas
- Bioinformatics, Molecular Biology, Plant Science
- Keywords
- Eucalyptus camaldulensis, Transcriptional sequencing, Gene analysis, Photosynthesis
- Copyright
- © 2022 Zhan et al.
- Licence
- This is an open access article distributed under the terms of the Creative Commons Attribution License, which permits unrestricted use, distribution, reproduction and adaptation in any medium and for any purpose provided that it is properly attributed. For attribution, the original author(s), title, publication source (PeerJ) and either DOI or URL of the article must be cited.
- Cite this article
- 2022. Comparative transcriptomics and bioinformatics analysis of genes related to photosynthesis in Eucalyptus camaldulensis. PeerJ 10:e14351 https://doi.org/10.7717/peerj.14351
Abstract
The timber species Eucalyptus camaldulensis is one of the most important in southern China. Therefore, it is essential to understand the photosynthetic pattern in eucalyptus leaves. In the present study, eighteen photosynthesis-related genes were analyzed using bioinformatics methods. The results indicated that there were ten differentially expressed ribose-5-phosphate isomerase genes (RPI), and six of them were up-regulated in the mature leaves compared to the young leaves, while others were down-regulated. The differential expression of four rubisco methyltransferase genes (RBCMT) were observed. Two of them were up-regulated, while two were down-regulated in mature leaves compared to young leaves. Furthermore, two ribulose-phosphate-3-epimerase genes (RPE) were up-regulated in the mature leaves compared to the young leaves. In contrast, two genes involved in triosephosphate isomerase (TIM) were down-regulated in mature leaves compared with young leaves. The current study provides basic information about the transcriptome of E. camaldulensis and lays a foundation for further research in developing and utilizing important photosynthetic genes.
Introduction
Photosynthesis, as an important physiological activity of plants, changes its characteristics and can effectively reveal the internal physiological state of plants as well as regulate the ecological adaptation to their habitats (Moore et al., 2021; Simkin, López-Calcagno & Raines, 2019). Plant biomass and biological yield are primarily determined by photosynthesis (Andralojc et al., 2018). The process of photosynthesis includes two stages of light reaction and dark reactions, whereas enzymes play an important role in the dark reaction (Yan, Yan & Gu, 2008).
Photosynthesis is essentially a series of enzymatic reactions that involves the Ribulose 1,5-bisphosphate carboxylase gene (Rubisco), phosphoenolpyruvate carboxylase gene (PEP), ribose-5-phosphate isomerase gene (RPI), ribulose-phosphate 3-epimerase gene (RPE), malate dehydrogenase gene (MDH), fructose-1,6-bisphosphatase gene (FBP), Rubisco methyltransferase gene (RBCMT), and triosephosphate isomerase gene (TIM) (Ciou et al., 2015; Liang et al., 2011; Whitney & Andrews, 2001; Wang et al., 2011). One major way of improving photosynthesis efficiency is to enhance the catalytic efficiency of enzymes related to photosynthesis. Although Rubisco catalyzes the fixation of CO2 in photosynthesis, a crucial step in the process of carbon fixation (Evans, 1986; Makino, Mae & Ohira, 1988), its catalytic efficiency is low, and in order to compensate for the low catalytic efficiency of Rubisco, plants accumulate Rubisco in large quantities in cells, making the content of Rubisco account for 20%–50% of soluble protein in plant cells (Sharwood, 2017; Galmés et al., 2019). Studies showed that limiting carboxylation and regeneration of ribulose 1, 5-bisphosphate (RUBP) could reduce the content and activity of ribulose 1, 5-bisphosphate carboxylation/oxygenase (Rubisco), down-regulate the expression levels of Rubisco proteins RBCL and RBCS, and thus reduced the photosynthetic rate of plants, and caused the imbalance of material and energy metabolism in plants (Dizengremel, 2001; Pellegrini et al., 2017). Rubsico activase (RCA) was responsible for the activation of Rubisco in leaves, and Rubisco could show its carboxylation/oxygenation activity only after activation, the activity of Rubisco in plants was therefore dependent on the activation of RCA (Perdomo, Buchner & Carmo-Silva, 2021). In addition, other genes related to photosynthesis were less reported.
Eucalyptus camaldulensis is one of the most widely planted tree species worldwide due to its rapid-growing, high-yield, and cold-resistant properties. In China, it has been widely planted in the southern region and has been used for a wide range of purposes (Luo et al., 2014). The bark of E. camaldulensis appears smooth with light color and gray mottling, as well as the branches, which are soft and drooping. It is suitable for street plantation as well as landscaping and is widely used as a shade and shelter tree (Hirsch et al., 2020). Recent studies have been conducted on improving the photosynthetic capacity of eucalyptus in order to improve afforestation quality and generate greater economic, ecological, and social benefits (Yang et al., 2018). Plant leaves are the primary sites for photosynthesis, transpiration, and respiration, photosynthesis, which affects the growth, development, and morphogenesis of plant (Salgado-Luarte & Gianoli, 2011; Liu et al., 2018). Although genetic manipulation can significantly enhance photosynthetic efficiency or productivity, there have been very few studies focused on eucalyptus photosynthetic genes. In order to study photosynthesis and related key genes in E. camaldulensis leaves during growth, photosynthetic indexes and transcriptome of young and mature leaves were analyzed, and key candidate genes were analyzed using bioinformatics. A deeper understanding of the mechanism of photosynthesis as well as improvements to the photosynthetic performance of E. camaldulensis will provide a valuable theoretical basis and scientific guidance for selective breeding and genetic engineering.
Materials & Methods
Plant material
In early April 2020, leaf samples of E. camaldulensis were collected from Southern China Experiment Nursery in Zhanjiang, Guangdong, China (21°15′30.69″N, 110°06′41.95″E). The young leaves (1-month-old) and mature leaves (4-month-old) of three healthy E. camaldulensis plants in the same direction and same height of second canopy were collected from the same half-sib families located on the Morehead R. Queensland (15°15′S, 143°34′E) with three biological replicates. The samples were kept in liquid nitrogen for RNA extraction.
Determination of photosynthetic indexes
To measure the photosynthetic indexes of E. camaldulensis leaves, a portable photosynthetic apparatus (LI-6400XT) was used under natural light (from 10:00 to 12:00), which included the net photosynthetic rate (Pn), cond (Gs), trmmol (Tr), and leaf water use efficiency (WUE) = Pn/Tr. The stability of the environment was maintained by setting the light intensity at 1200 µmol m−2 s−1, the flow rate at 500 µmol s−1, and the CO2 concentration at the current atmospheric CO2 concentration ((400 ± 20) µmol mol−1), and the leaf temperature at 25 ± 1 °C. A total of three branches were selected, and three young and mature leaves were measured respectively in different parts of each branch with three biological replicates.
Measurement of the light response curve
LI-6400XT portable photosynthetic apparatus was used to measure the light response curve of E. camaldulensis leaves from 10:00 to 16:00. The experimental apparatus was set as an open-air circuit keeping CO2 at 400 µmol mol−1, and the gas flow rate was 500 µmol s−1, and other parameters were set as default. A total of 17 photosynthetically active radiation (PAR, µmol m−2 s−1) were set using LED red and blue light sources, which included 2000, 1800, 1600, 1400, 1200, 1000, 800, 600, 400, 200, 150, 100, 80, 60, 40, 20 and 0 µmol m−2 s−1. The net photosynthetic rates of leaves were measured at different light intensities. Before determining the photosynthetic rate, they were induced for 2 min under the light intensity of 1200 µmol m−2 s−1, and the waiting time for each light intensity point was 120–200 s. A rectangular hyperbola model was used to draw the light response curve (Baly, 1935). An(I) represents the net photosynthetic rate, I represents the light intensity, a represents the initial slope of the light response curve, Amax represents the maximum net photosynthetic rate, Rd represents the dark respiration rate. The analysis methods of one-way ANOVA and Duncan’s were used in SPSS19.0.
RNA extraction and transcriptome sequencing
Total RNA was extracted using FastPure Universal Plant Total RNA Isolation Kit (Vazyme, Nanjing, China). The quantification of RNA was performed using Nanodrop™ 1000 (Thermo Fisher Scientific, Waltham, MA, USA). Agilent 2100 Bioanalyzer was used to measure the 28S/18S and RIN values. The quality and integrity of the RNA samples were estimated using agarose gel electrophoresis, and samples were resolved on 1% agarose gel. The enriched mRNA was reversely transcribed to form double-stranded cDNA, and the double ends of cDNA were repaired, and the adaptor was added for PCR amplification to construct the on-machine library. RNA libraries were constructed using the Illumina HiSeqTM 4000 platform at Gidio company. The statistical power of this experimental design, calculated in RNAseqPS is 0.446 (Guo et al., 2014).
Sequencing data processing and analysis
TopHat (v2.0.10) was used to compare the reads with E. grandis reference genome (NCBI gcf_000612305.1). The assembly of sequences was performed by Cufflinks using reference annotation-based transcripts (RABT). The obtained transcript sequences were compared using BLAST with SwissProt, Gene Ontology, Cluster of Orthologous Groups of proteins, and Kyoto Encyclopedia of Genes and Genomes databases to annotate the function of the transcript.
The differentially expressed proteins were mapped to each term of the GO databases, and calculated the number of proteins in each term, and obtained the list of proteins with a certain GO function and the number of proteins. Hypergeometric tests were used to identify GO entries that were significantly enriched in differentially expressed proteins compared with the whole background protein, and the p-value of this hypothesis test could be calculated as follows:
N was the number of proteins with GO annotation among all background proteins; n was the number of differentially expressed proteins in N; M was the number of proteins annotated as a specific GO term among all background proteins; m is the number of differentially expressed proteins annotated as a specific GO term. After the calculated p-value was corrected by Benjamin&Hochberg(BH method), the threshold was taken as correct-p-value ≤0.05. The major biological functions of differentially expressed proteins could be determined by GO functional significance enrichment analysis.
Pathway significant enrichment analysis took KEGG pathway as the unit, and hypergeometric test was used to find out the pathways that were significantly enriched in differentially expressed proteins compared with background proteins. The p-value of this hypothesis test could be calculated as follows:
N was the number of proteins with pathway annotation among all background proteins; n was the number of differentially expressed proteins in N; M was the number of proteins annotated as a specific pathway among all background proteins; m was the number of differentially expressed proteins annotated as a specific pathway. After correction for multiple tests, pathways with q-value ≤0.05 were defined as those significantly enriched in differentially expressed proteins. Here, q-value is the p-value after FDR correction. The significant enrichment of pathway can identify the main biochemical metabolic pathways and signal transduction pathways involved in differentially expressed proteins.
Cuffdiff software (Trapnell et al., 2012) and EdgeR (Robinson, McCarthy & Smyth, 2010) were used to analyze the transcriptional expression and differences between mRNA sample pairs, respectively. DEGs were selected with a p-value <0.05 and —log2 fold change (log2FC)—>1 for subsequent analyses.
Gene analysis
DEGs related to photosynthesis were screened out based on the data of and transcriptome. To analyze the relative molecular weight, theoretical isoelectric point, instability coefficient, hydrophilicity index as well as lipid solubility index of the gene, the ProtParam in ExPASy (http://web.expasy.org/protparam/) were employed. The secondary and tertiary structures of protein were analyzed using the SOPMA (https://npsa-prabi.ibcp.fr/cgi-bin/npsa_automat.pl?page=/NPSA/npsa_sopma.html) and SWISS-MODEL (https://swissmodel.expasy.org/interactive#seque-nce), respectively.
RNA reverse transcription and QRT-PCR
M-MLV reverse transcriptase was adopted for synthesizing 2 µg RNA in line with Evo M-MLV RT Kit instructions (Accurate Biotechnology, China), and followed by a 1:10 dilution for subsequent experiments. The photosynthesis-related genes of E. camaldulensis were identified as verification genes. The total qRT-PCR reaction comprised of 20 µL containing 2 ×SYBR Green Pro Taq HS Premix (Tli RNaseH Plus) 10 µL, ROX Reference Dye 0.4 µL, forward primer (10 µmol L−1) 0.8 µL, reverse primer (10 µmol L−1) 0.8 µL, cDNA 2 µL, and RNase Free ddH2O 6 µL. The thermal profile was comprised of two segments: 30-S at 95 °C; 5-S denaturation at 95 °C, and 30-S annealing at 60 °C for altogether 40 cycles. Each reaction was repeated three times, and the actin gene was selected as a reference. Primer Express 2.0 Software (PE Applied Biosystems, USA) was applied in primer designing with default parameters. Table S1 displays the sequences of all the primers. The 2−ΔΔCt method (Livak & Schmittgen, 2001) and Microsoft Excel software were used to analyze the obtained data.
Results
Photosynthesis analysis of the mature and young leaves in E. camaldulensis
Photosynthesis analysis revealed that mature leaves’ photosynthetic rate, trmmol, cond, and leaf water use efficiency were significantly higher than those of young leaves at a light intensity of 1200 µmol m−2 s−1 (Fig. 1). A photosynthesis rate is also called as a photosynthetic intensity, which is a measure of the intensity of photosynthesis. The photosynthetic rate can be expressed as carbon dioxide absorbed or oxygen released per unit time and per unit leaf area. The light response curve reflects the variation of plant photosynthetic rate with increasing light intensity; the net photosynthetic rate increased rapidly from 0 to 600 µmol m−2 s−1. However, the net photosynthetic rate decreased slower at light intensities of 600–1600 µmol m−2 s−1. A higher net photosynthetic rate was observed for mature leaves than for young leaves (Fig. 2).
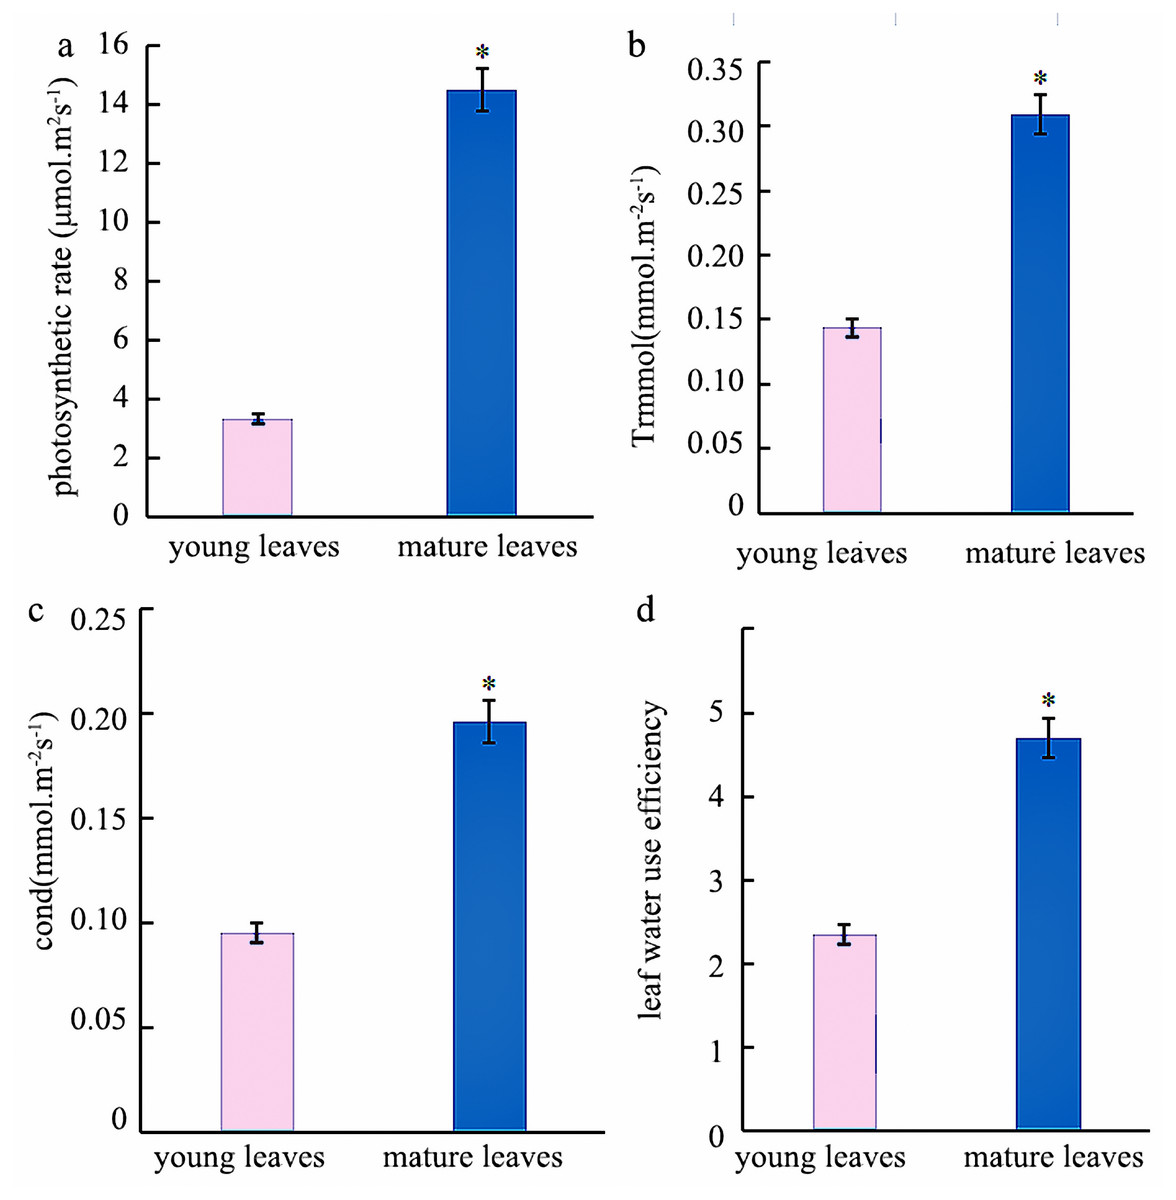
Figure 1: Analysis of the photosynthetic Indexes in young and mature leaves of Eucalyptus camaldulensis.
(A) photosynthetic rate, (B) trmmol, (C) cond, (D) leaf water use efficiency. The asterisk indicated significantly different at p < 0.05 in the young and mature leaves of E. camaldulensis. Vertical bars indicate the standard error.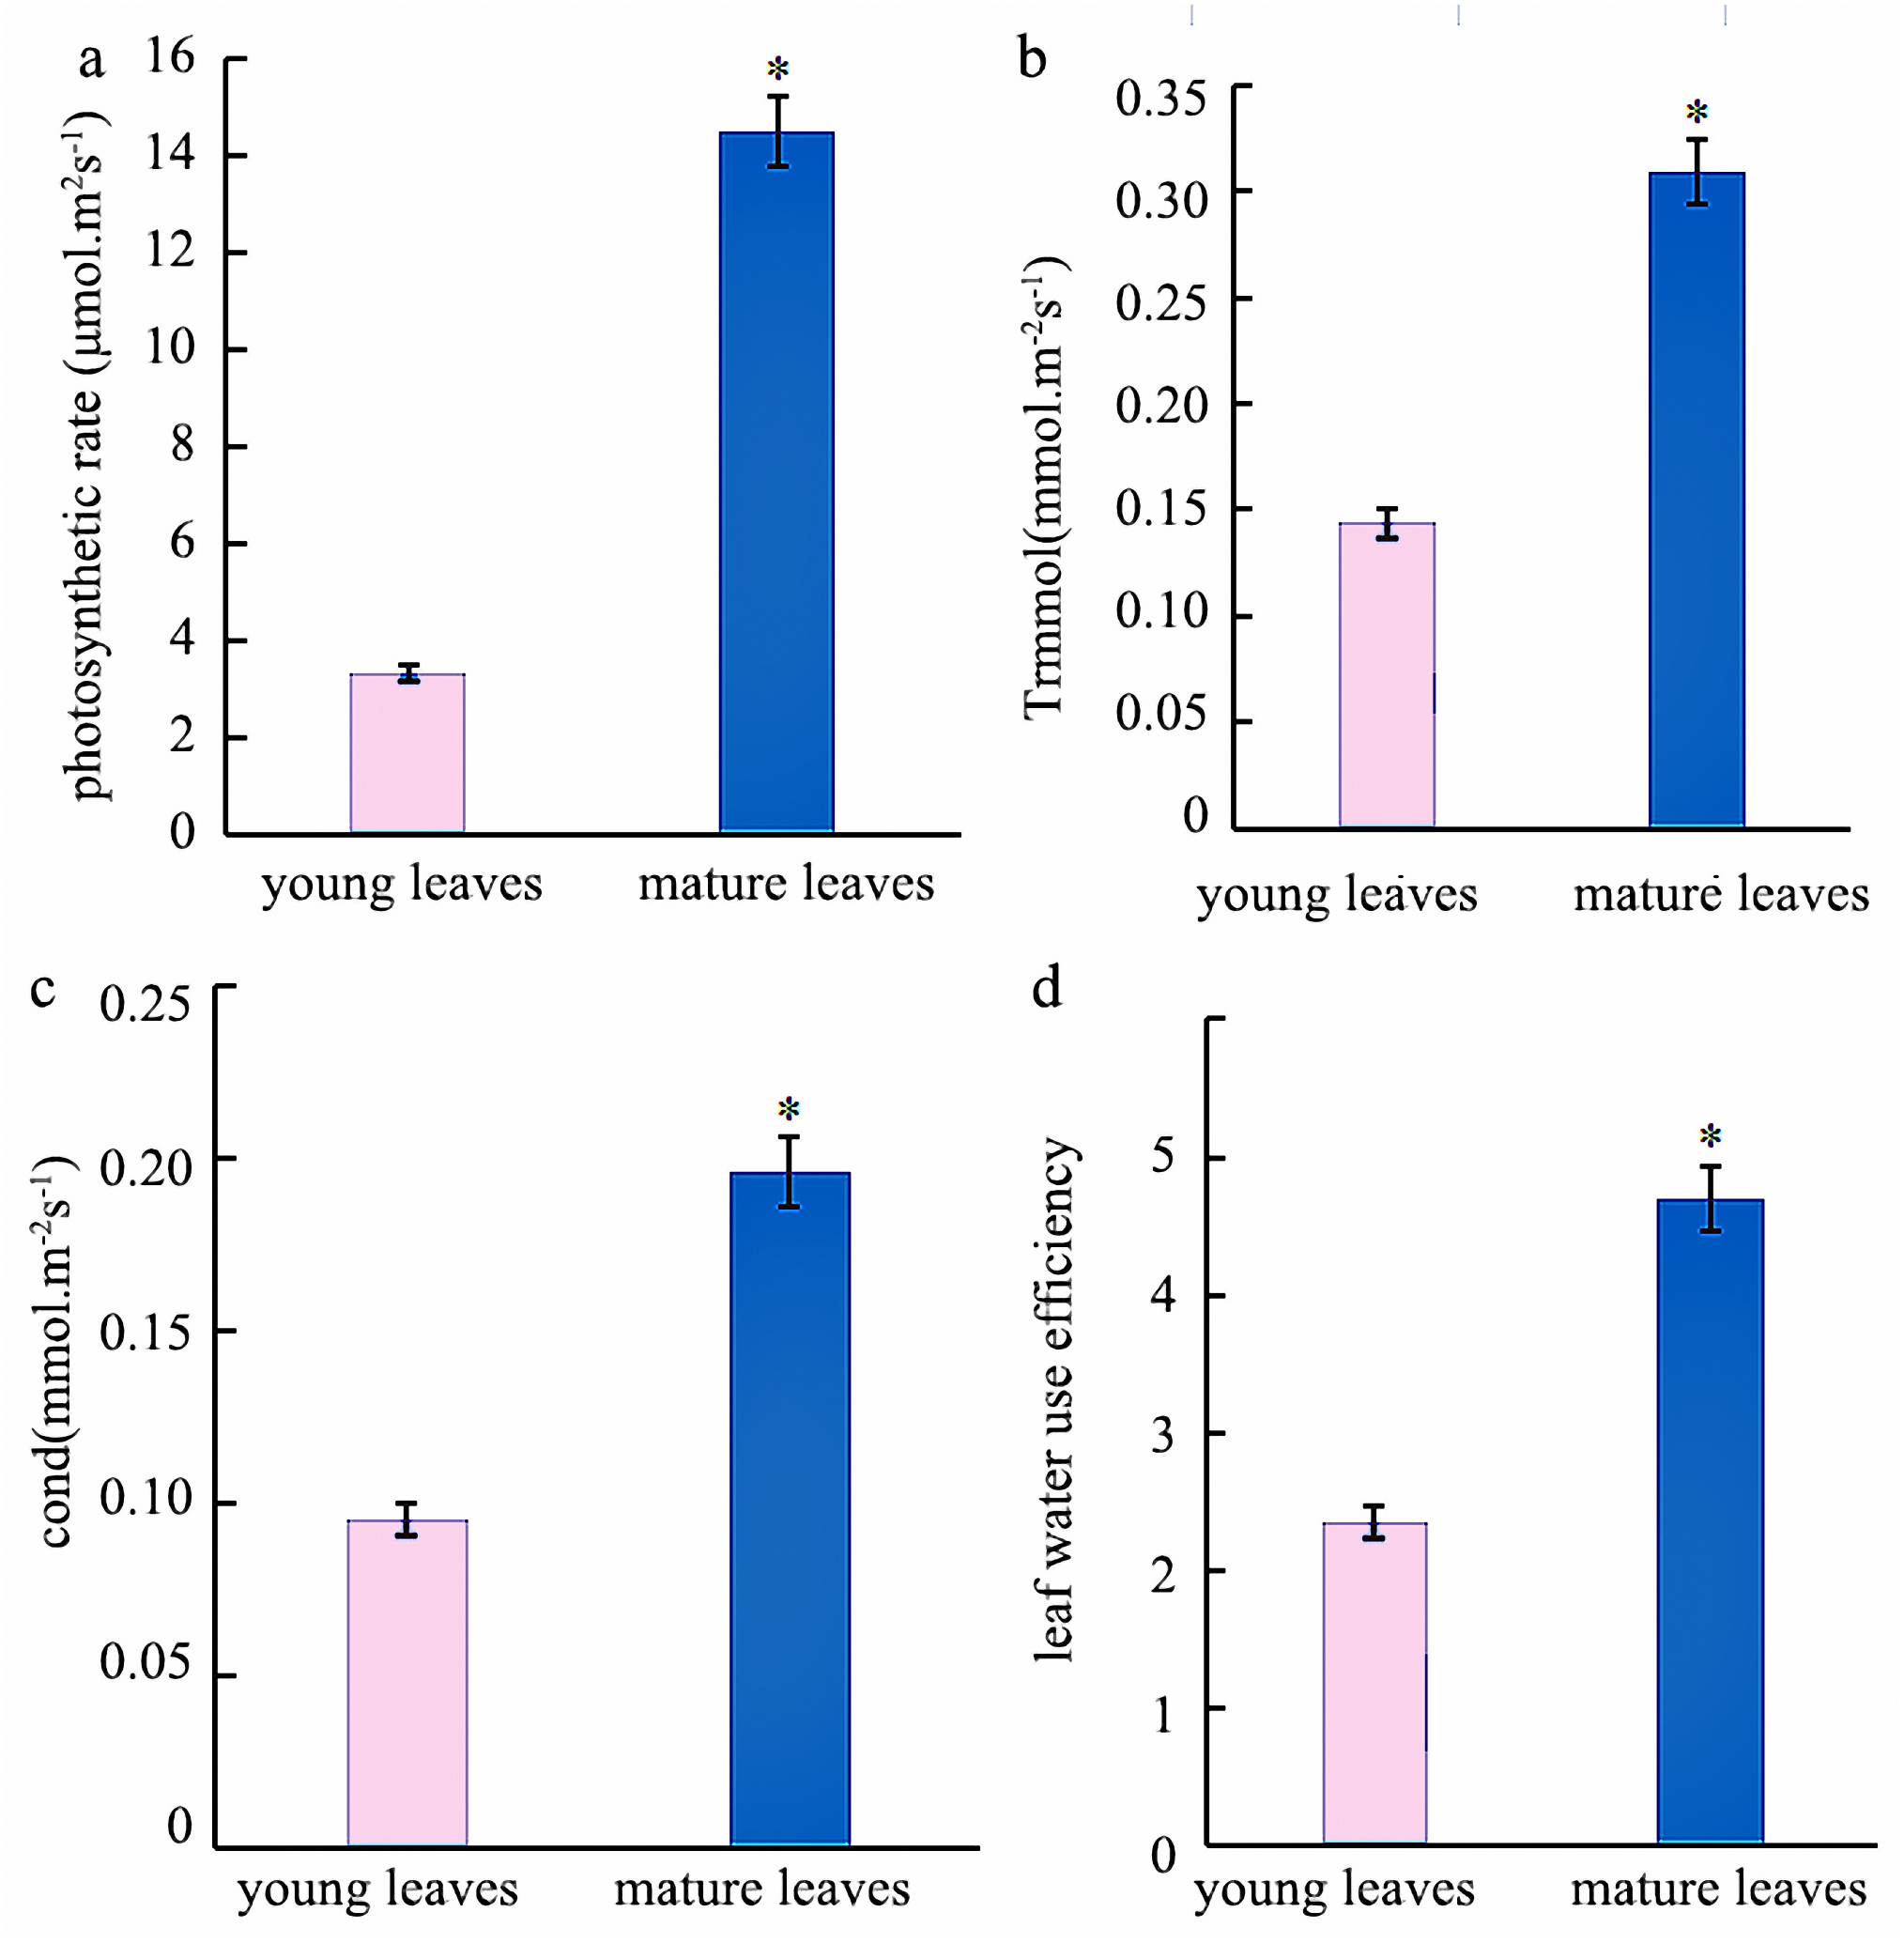
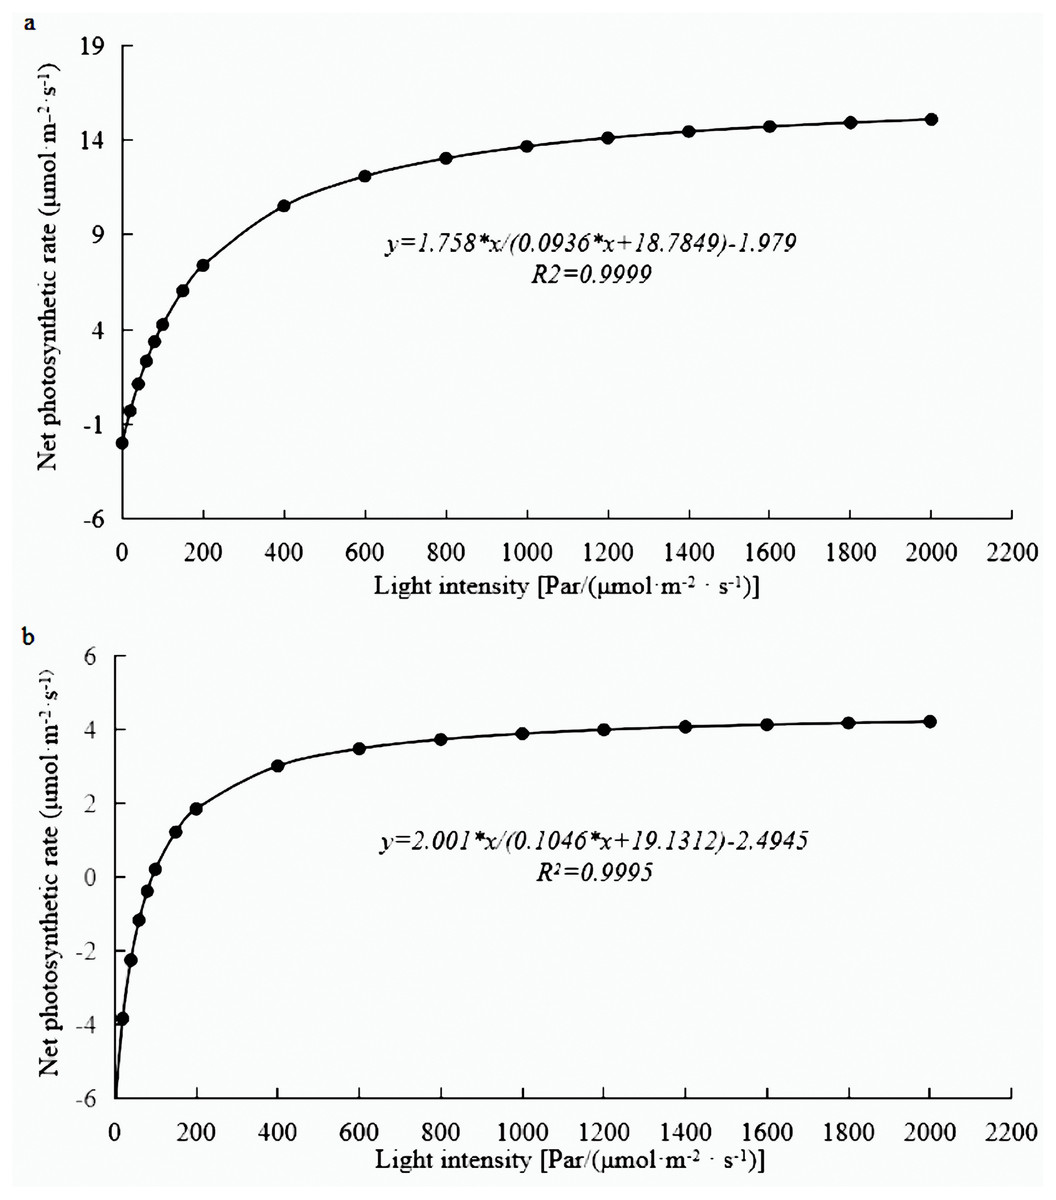
Figure 2: Light response curve of E. camaldulensis.
(A) young leaves, (B) mature leaves.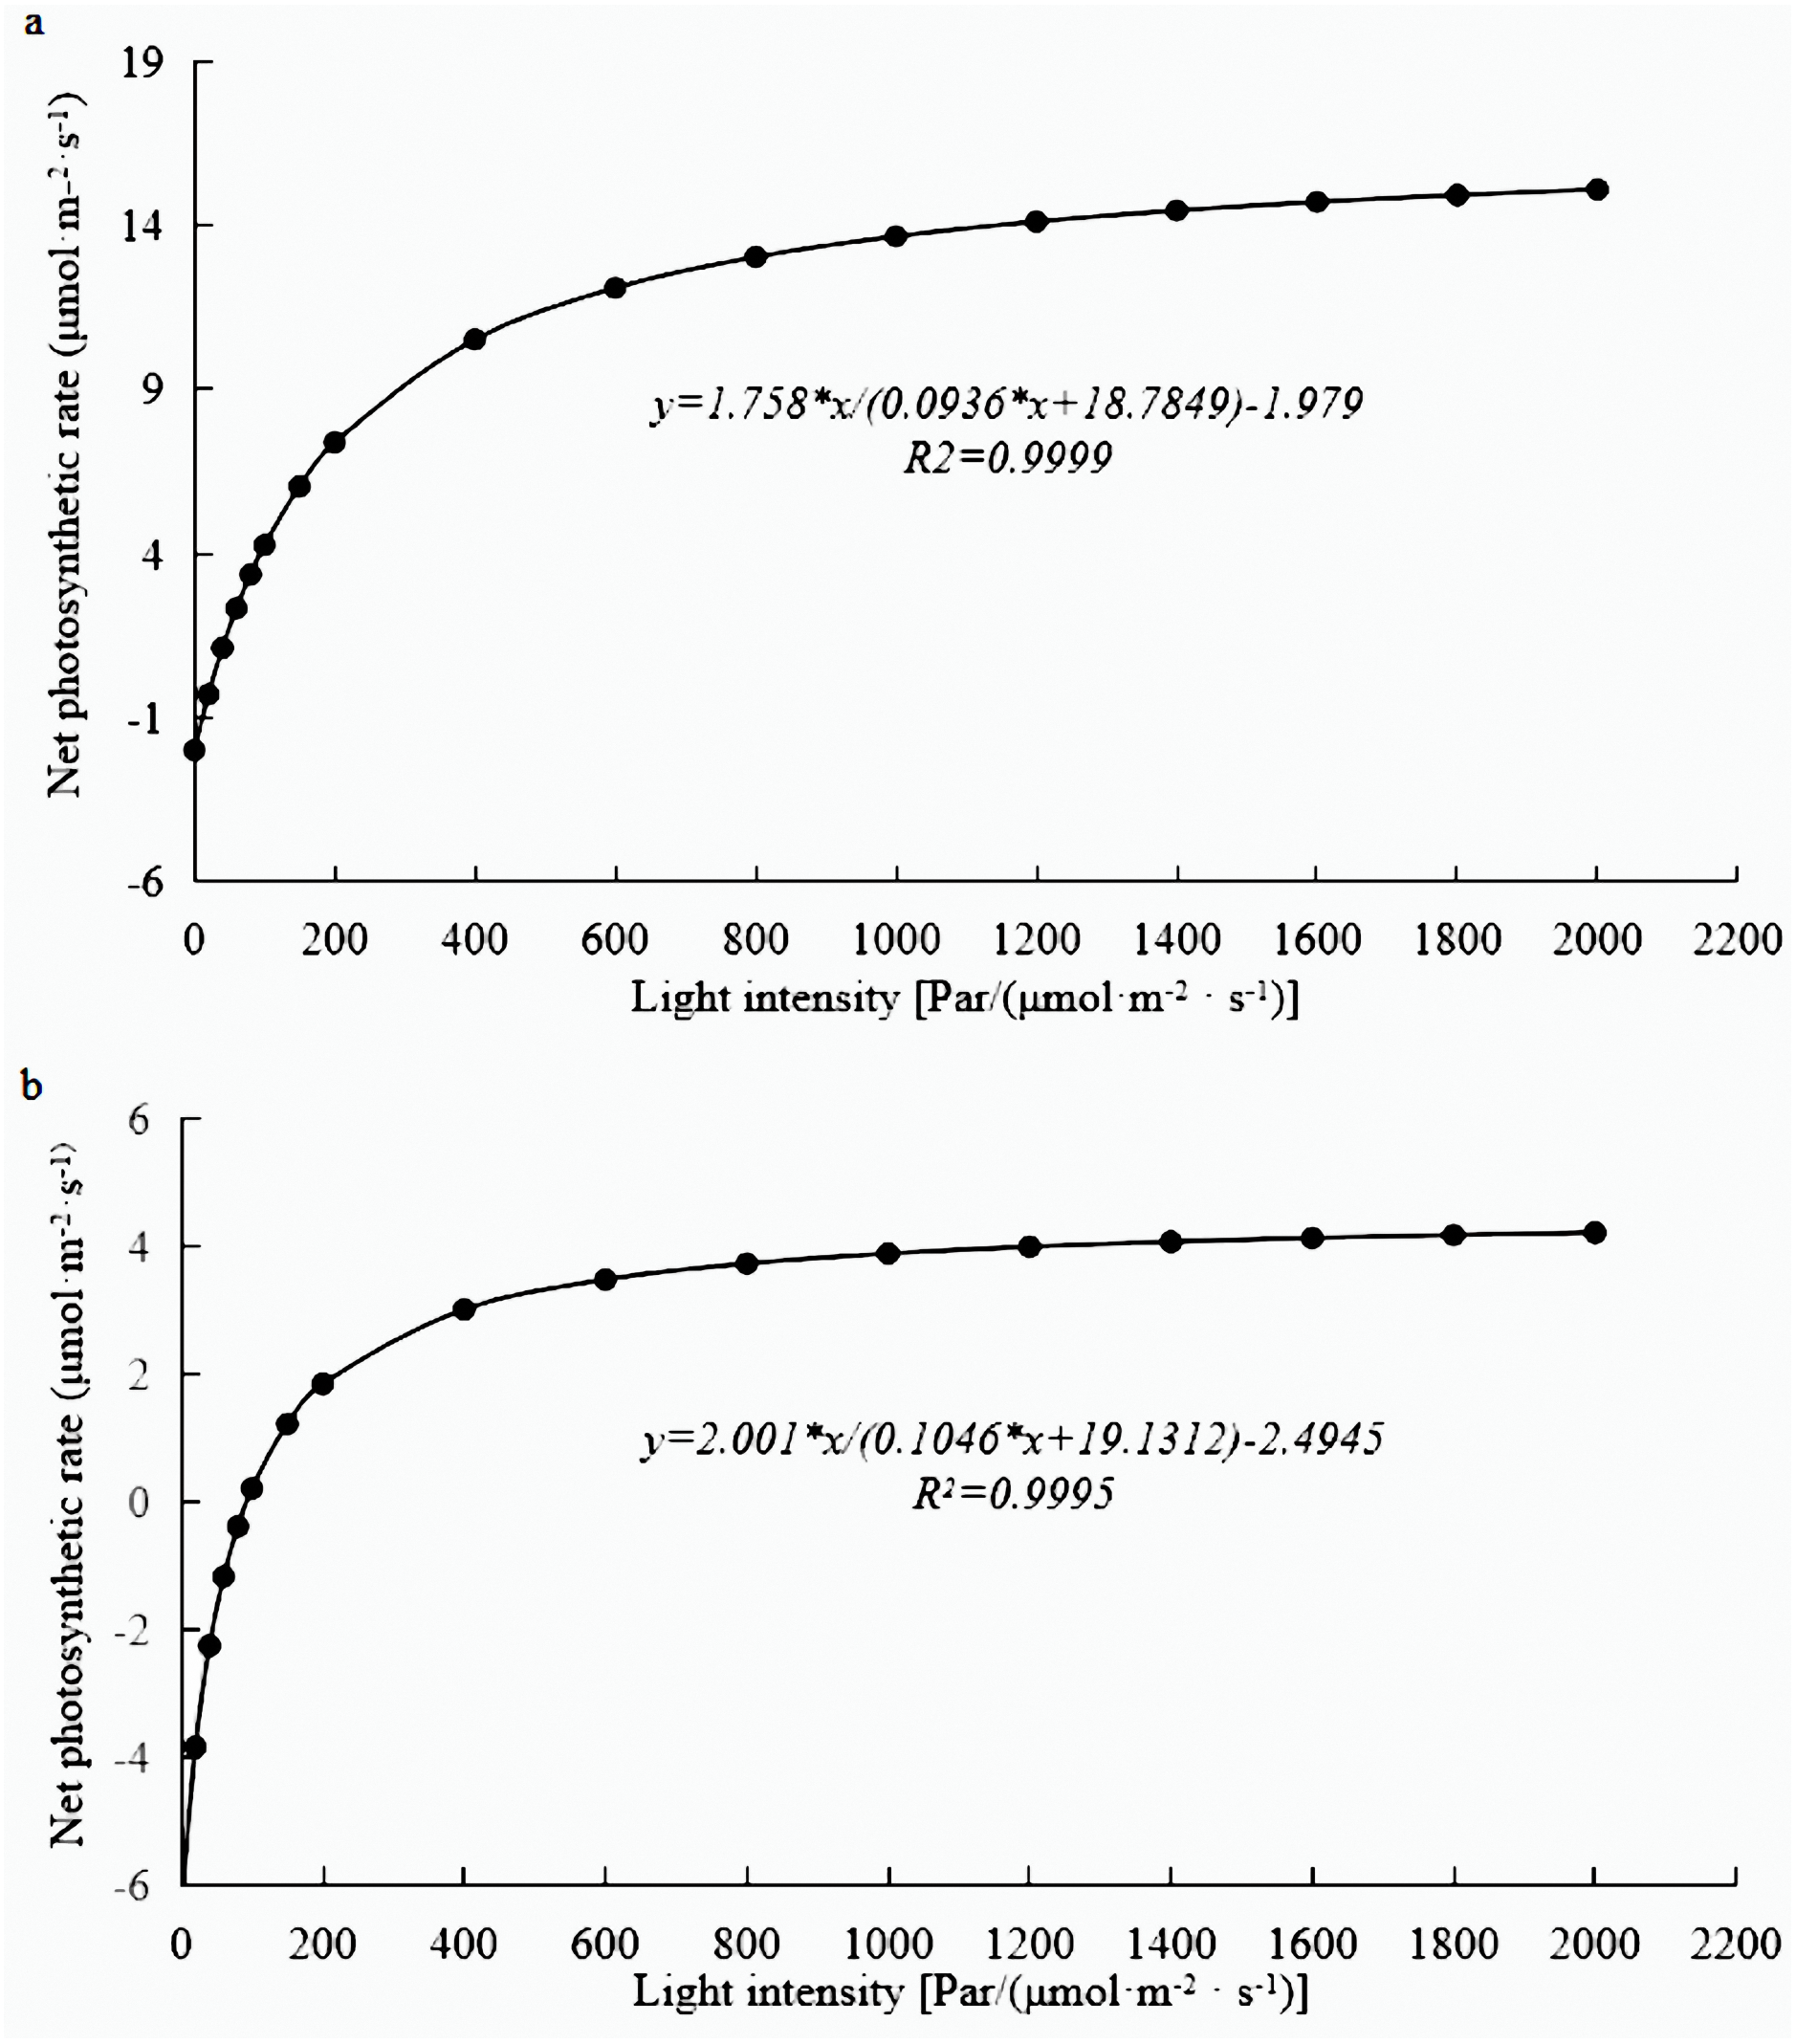
Differentially expressed genes related to photosynthesis in mature and young leaves of E. camaldulensis
We carried out a transcriptomic analysis on both young and mature leaf samples of E. camaldulensis to explore potential target genes. The overall raw/clean reads within each sample ranged between 6,914,804,063 and 8,686,921,500. This work also aligned sequence reads into the reference genome of E. grandis, and results indicated that >81% were map-able. The >92% Q30% and 48% GC concentrations suggested high-quality transcriptomic results for the subsequent analyses (Table 1).
| Sample | Raw date (bp) | Clean date (bp) | Mapped reads (%) | Q30 (%) | GC content (%) |
|---|---|---|---|---|---|
| Young leaves1 | 8667736800 | 8605418020 | 83.79 | 92.35 | 48.13 |
| Young leaves2 | 7998500400 | 7945293590 | 83.05 | 92.43 | 48.67 |
| Young leaves3 | 6958889600 | 6914804063 | 91.11 | 92.22 | 48.36 |
| Mature leaves1 | 8686921500 | 8634113369 | 83.38 | 92.32 | 48.67 |
| Mature leaves2 | 7575328200 | 7527501504 | 82.66 | 92.43 | 48.55 |
| Mature leaves3 | 8577291000 | 8517745455 | 81.41 | 92.18 | 48.28 |
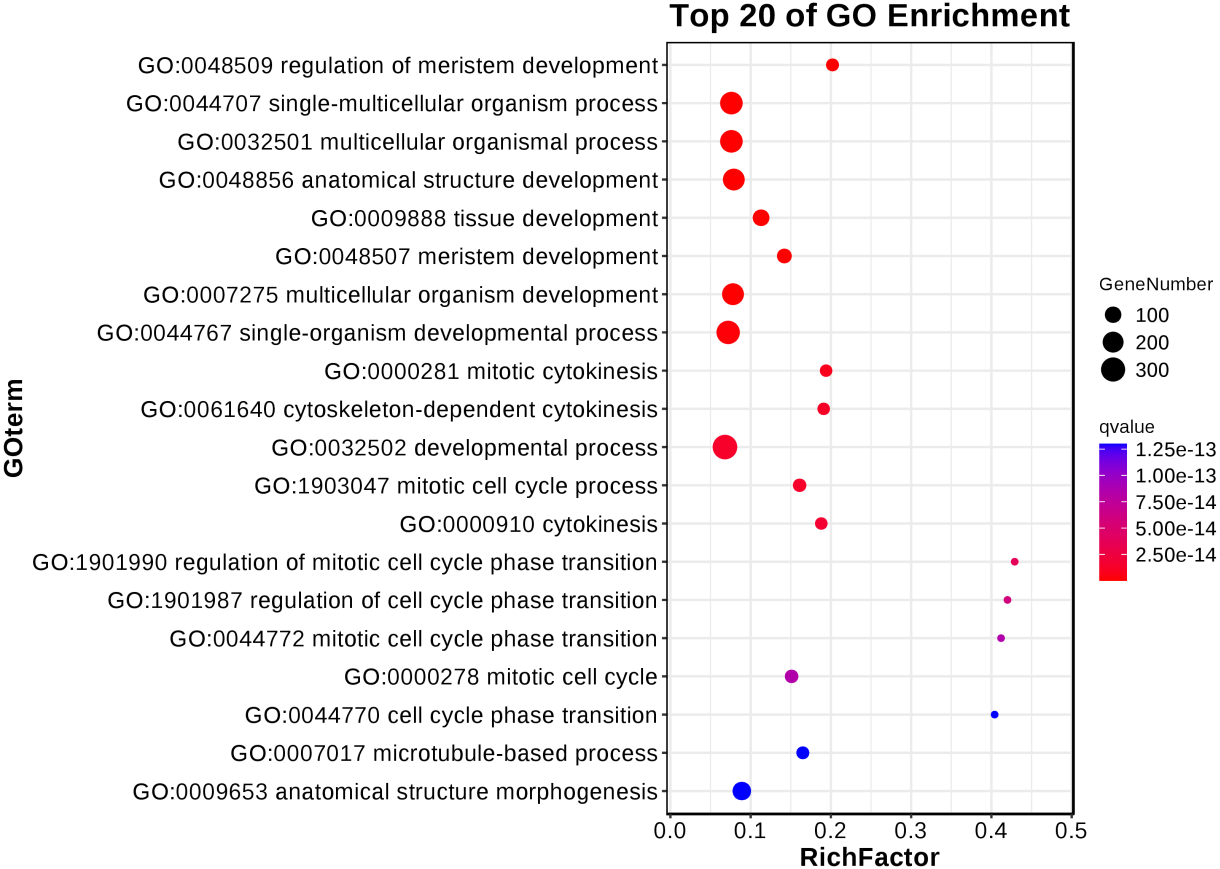
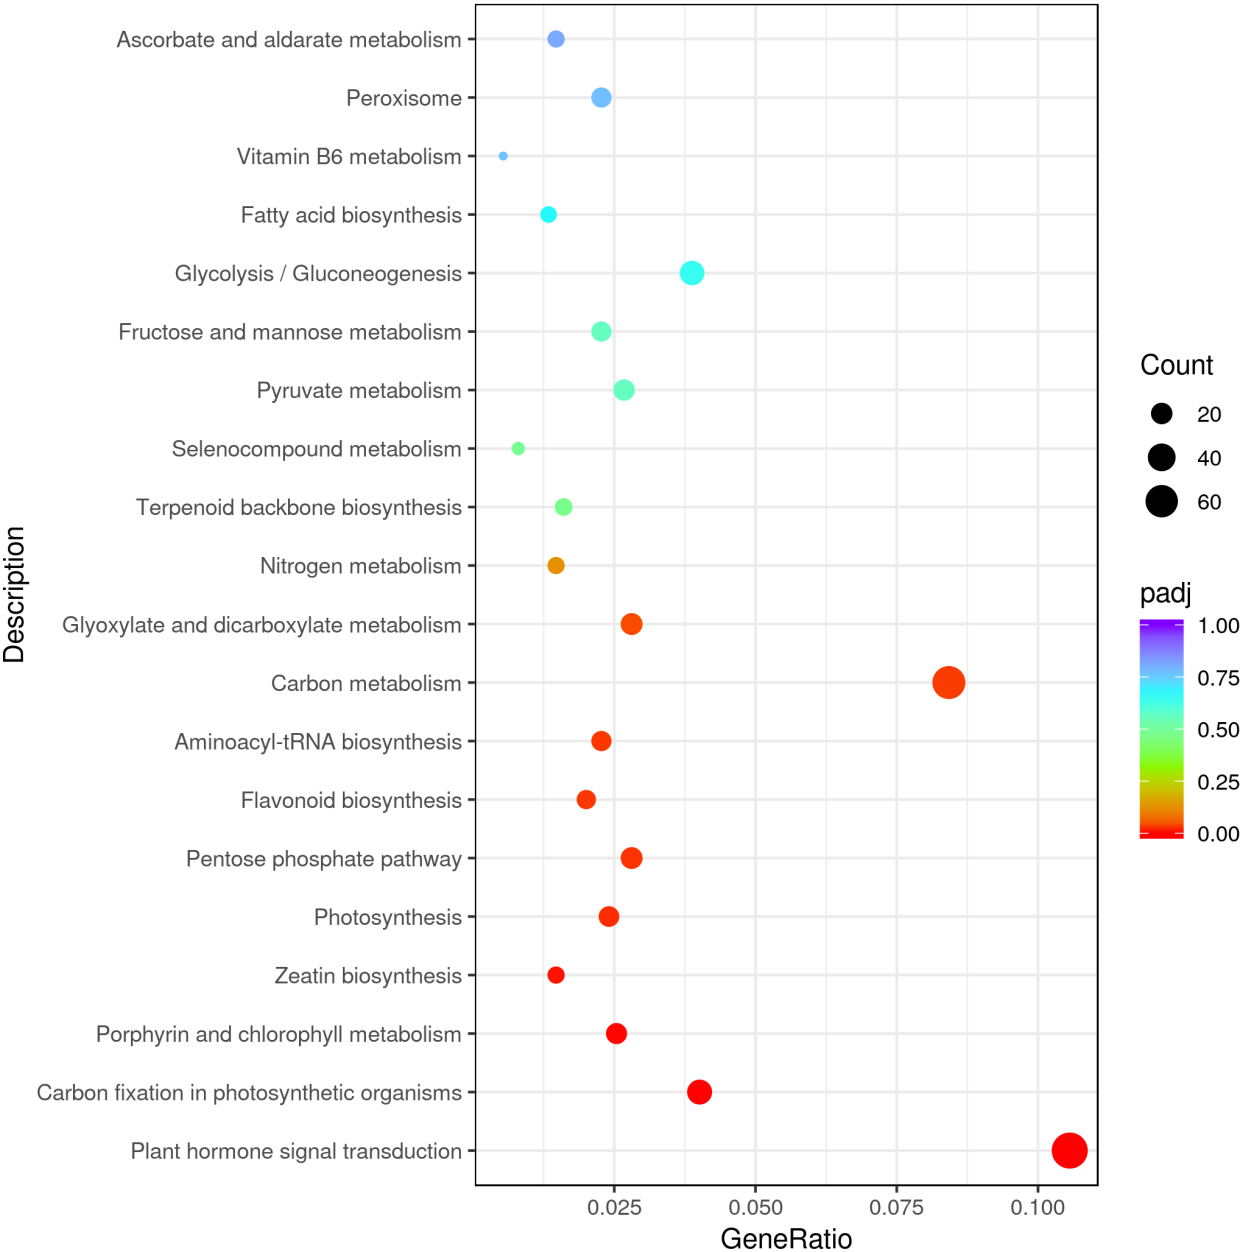
The results underlined that there were 18,443 differentially expressed genes (DEGs) in young and mature leaves in E. camaldulensis. A GO enrichment analysis indicated that DEGs were mainly enriched in the following processes: single-multicellular organism process, multicellular organism process, anatomical structure development, single-organism developmental process, multicellular organism development, and developmental process (Fig. 3). Furthermore, KEGG enrichment indicated that DEGs were mainly enriched in plant hormone signal transduction, carbon metabolism, photosynthesis, and carbon fixation in photosynthetic organisms (Fig. 4). We focused on the DEGs relating to photosynthesis, as mature leaves have a higher net photosynthetic rate than young leaves (Figs. 1 and 2).
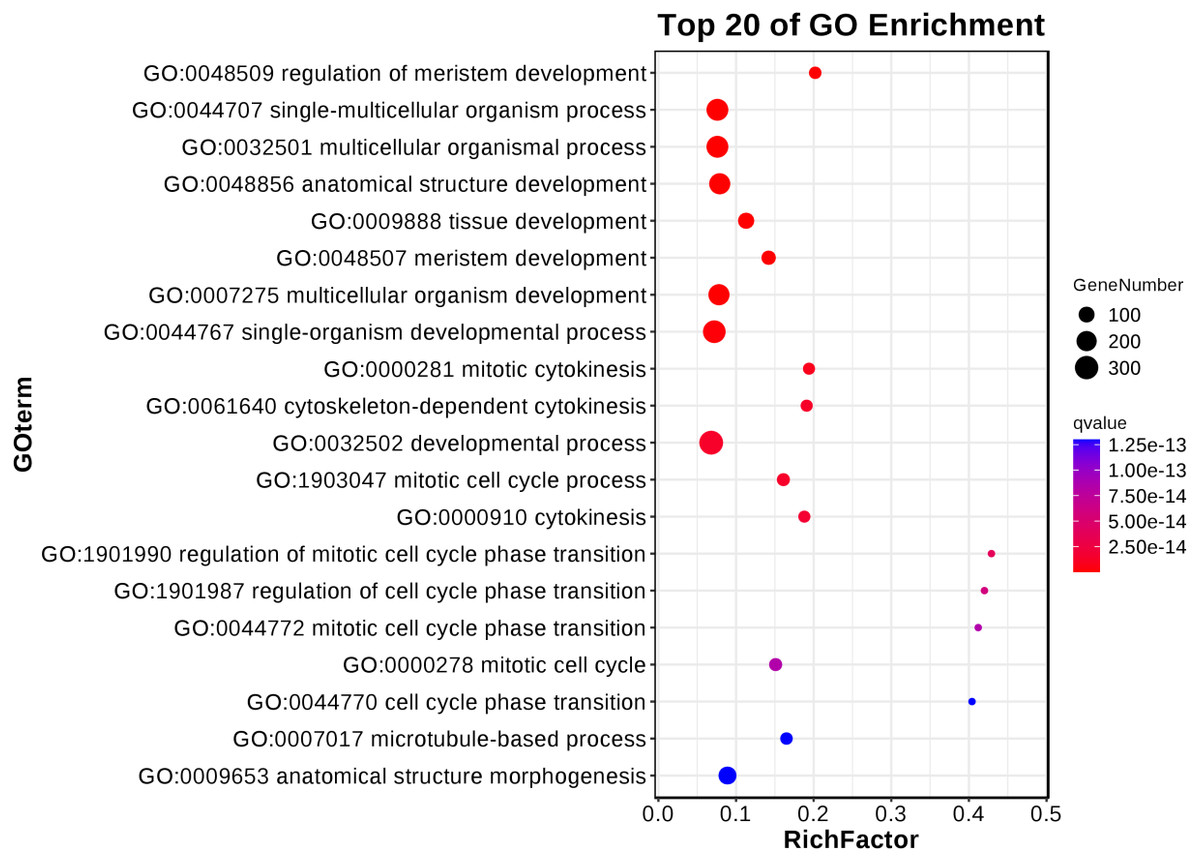
Figure 3: GO enrichment of differentially expressed genes in young and mature leaves of E. camaldulensis.

Figure 4: KEGG enrichment of differentially expressed genes in young and mature leaves of E. camaldulensis.
A total of 18 important DEGs were identified in E. camaldulensis related to photosynthesis at different periods. Among ten ribose-5-phosphate isomerases genes (RPI), six were up-regulated in the mature leaves compared to young leaves, while the other four were down-regulated. There were four differentially expressed rubisco methyltransferase (RBCMT); two of them were up-regulated as well as two were down-regulated in the mature leaves compared to the young leaves. Furthermore, two ribulose-phosphate-3-epimerase genes (RPE) were found, and both of these were up-regulated in the mature leaves in comparison to the young leaves. On the other hand, two triosephosphate isomerase genes (TIM) were down-regulated in the mature leaves relative to the young leaves (Table 2).
| Gene number | Genes name | Log2 FC | FDR | Expression pattern (in mature leaves) |
|---|---|---|---|---|
| Unigene0035694 | RPI1 | 1.819110678 | 6.22E−14 | up |
| Unigene0091294 | RPI2 | 5.15630553 | 8.70E−05 | up |
| Unigene0056101 | RPI3 | 4.517187259 | 8.70E−05 | up |
| Unigene0058341 | RPI4 | 2.04588154 | 2.89E−11 | up |
| Unigene0039604 | RPI5 | 2.186362763 | 9.61E−10 | up |
| Unigene0088233 | RPI6 | 1.680426069 | 4.85E−08 | up |
| Unigene0098082 | RPI7 | −2.463303114 | 5.37E−09 | down |
| Unigene0058337 | RPI8 | −2.375075931 | 6.34E−15 | down |
| Unigene0078762 | RPI9 | −5.254852333 | 3.11E−11 | down |
| Unigene0097988 | RPI10 | −1.426606232 | 4.13E−12 | down |
| Unigene0032054 | RBCMT1 | 1.918646352 | 2.30E−06 | up |
| Unigene0103513 | RBCMT2 | 3.248247344 | 1.80E−14 | up |
| Unigene0068133 | RBCMT3 | −1.407208552 | 4.39E−15 | down |
| Unigene0059727 | RBCMT4 | −1.367007493 | 1.77E−15 | down |
| Unigene0029842 | RPE1 | 1.609084978 | 3.56E−11 | up |
| Unigene0028941 | RPE2 | 1.908378016 | 1.37E−05 | up |
| Unigene0058996 | TIM1 | −1.675416783 | 2.94E−15 | down |
| Unigene0054879 | TIM2 | −1.552510135 | 8.12E−07 | down |
Gene analysis bioinformatics analysis of genes related to photosynthesis
In order to further analyze the 18 DEGs related to photosynthesis in E. camaldulensis, bioinformatics methods were used to analyze them. Among the RPI genes of E. camaldulensis, RPI2 was the longest amino acid encoded protein with a maximum relative molecular mass of 29,632.15 D, whereas the minimum relative molecular mass was RPI9 (3852.50 D). RPI2, RPI3, and RPI5 genes encoded for basic amino acids, whereas others encoded for acidic amino acids. A minimum instability index of 0.46 was observed in the case of RPI3. According to the hydrophilic index, the proteins encoded by RPI1, RPI5, RPI8, and RPI9 genes were hydrophobic in nature, whereas others were hydrophilic proteins. The aliphatic index of RPI was found between 83.33 and 108.11. In the RBCMT genes of E. camaldulensis, RBCMT2 was the longest amino acid encoded protein with a maximum relative molecular mass of 54957.68 D, while the minimum relative molecular mass was RBCMT4 (9489.89 D). While RBCMT1 encoded basic amino acids, others encoded acidic amino acids. The minimum instability index was 46.48 (RBCMT3). According to the hydrophilic index, the proteins encoded by RBCMT genes were hydrophobic in nature. The aliphatic index of RBCMT was found between 86.75 and 114.10. RPE1 and RPE2 encoded for the basic and acidic amino acids, respectively. The protein encoded by the RPE1 gene was hydrophobic in nature, whereas the RPE2 gene encoded for hydrophilic protein. TIM1 and TIM2 encoded acidic amino acids as well as hydrophilic proteins (Table 3).
| Gene number | Gene name | aa length | Relative molecular mass/D | PI | Instability index | Hydrophilic index | Aliphatic index |
|---|---|---|---|---|---|---|---|
| Unigene0035694 | RPI1 | 159 | 16908.35 | 5.00 | 38.01 | 0.07 | 101.82 |
| Unigene0091294 | RPI2 | 278 | 29632.15 | 7.91 | 26.69 | −0.06 | 102.09 |
| Unigene0056101 | RPI3 | 63 | 7320.58 | 8.07 | 43.51 | −0.27 | 103.49 |
| Unigene0058341 | RPI4 | 42 | 4594.17 | 4.65 | 10.68 | −0.34 | 83.33 |
| Unigene0039604 | RPI5 | 143 | 15633.40 | 7.87 | 30.18 | 0.21 | 103.50 |
| Unigene0088233 | RPI6 | 44 | 4742.45 | 4.33 | 36.14 | −0.03 | 84.09 |
| Unigene0098082 | RPI7 | 60 | 6452.19 | 4.01 | 22.79 | −0.14 | 81.17 |
| Unigene0058337 | RPI8 | 243 | 25772.65 | 5.12 | 19.46 | 0.05 | 105.10 |
| Unigene0078762 | RPI9 | 37 | 3852.50 | 6.81 | 0.46 | 0.23 | 108.11 |
| Unigene0097988 | RPI10 | 120 | 12493.08 | 5.14 | 44.22 | −0.08 | 96.00 |
| Unigene0032054 | RBCMT1 | 126 | 13465.66 | 10.27 | 62.53 | −0.15 | 86.75 |
| Unigene0103513 | RBCMT2 | 488 | 54957.68 | 5.06 | 66.53 | −0.22 | 98.91 |
| Unigene0068133 | RBCMT3 | 311 | 35655.71 | 4.93 | 46.48 | −0.25 | 96.88 |
| Unigene0059727 | RBCMT4 | 82 | 9489.89 | 5.06 | 73.10 | −0.06 | 114.10 |
| Unigene0029842 | RPE1 | 277 | 29516.20 | 8.86 | 46.52 | 0.17 | 106.53 |
| Unigene0028941 | RPE2 | 172 | 19115.26 | 5.54 | 37.47 | −0.11 | 84.94 |
| Unigene0058996 | TIM1 | 246 | 26350.13 | 5.21 | 27.54 | 0.02 | 102.15 |
| Unigene0054879 | TIM2 | 52 | 5284.97 | 5.95 | 12.64 | 0.07 | 90.00 |
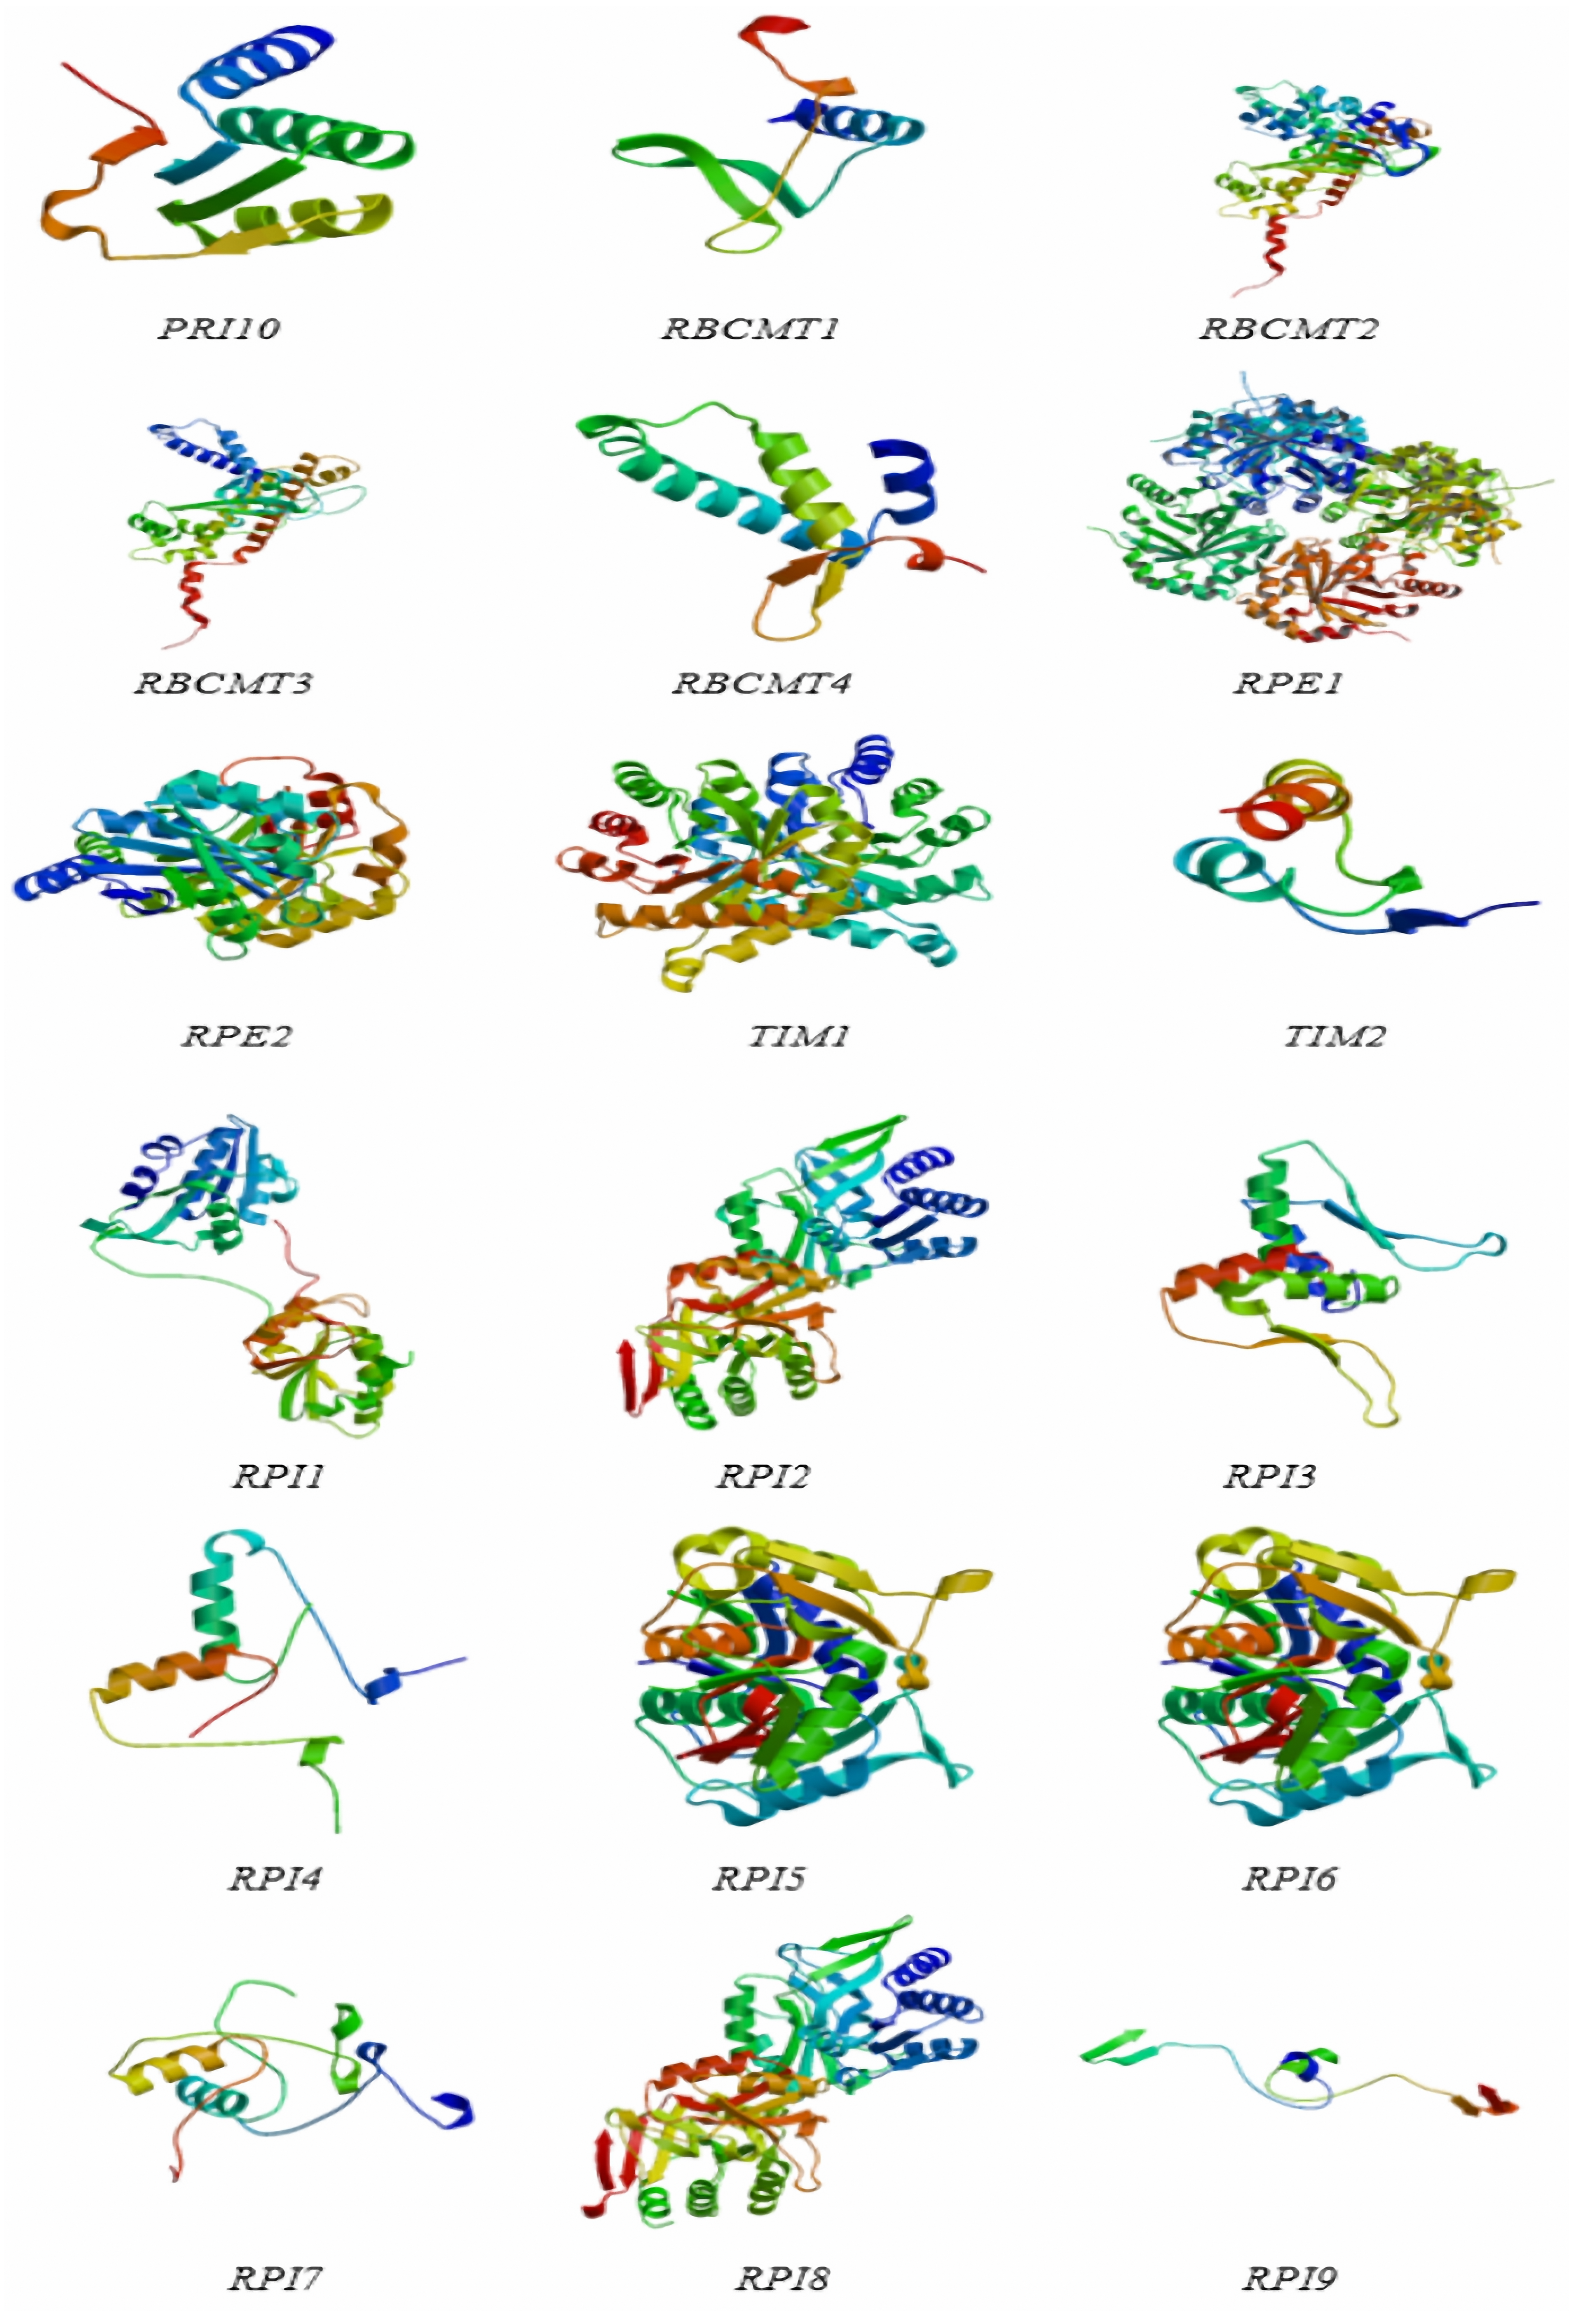
The protein structures of the RPI, RBCMT, RPE, and TIM gene consisted of α-helix, extension chain, random coil, and β-angle structure (Table 4 and Fig. 5). These results showed that the proportion of RPI protein α-helix structures was usually higher than others, with the lowest is β-angle structure. Similarly, the proportion of RBCMT protein α-helix and random coil structure was also usually higher than that of protein with other structures. The highest proportion of α-helix, as well as the lowest ratio of β-angle, was found in the secondary structure of RPE and TIM proteins.
| Protein | α-helix | Extending chain | Random coil | β-angle | ||||
|---|---|---|---|---|---|---|---|---|
| aa length | Proportion % | aa length | Proportion % | aa length | Proportion% | aa length | Proportion % | |
| RPI1 | 67 | 42.14 | 33 | 20.75 | 49 | 30.82 | 10 | 6.29 |
| RPI2 | 104 | 37.41 | 59 | 21.22 | 89 | 32.01 | 26 | 9.35 |
| RPI3 | 29 | 46.03 | 12 | 19.05 | 15 | 23.81 | 7 | 11.11 |
| RPI4 | 15 | 35.71 | 9 | 21.43 | 12 | 28.57 | 6 | 14.29 |
| RPI5 | 51 | 35.66 | 33 | 23.08 | 41 | 28.67 | 18 | 12.59 |
| RPI6 | 17 | 38.64 | 9 | 20.45 | 14 | 31.82 | 4 | 9.09 |
| RPI7 | 17 | 28.33 | 17 | 28.33 | 19 | 31.67 | 7 | 11.67 |
| RPI8 | 100 | 41.15 | 50 | 20.58 | 68 | 27.98 | 25 | 10.29 |
| RPI9 | 15 | 40.54 | 9 | 24.32 | 5 | 13.51 | 8 | 21.62 |
| RPI10 | 40 | 33.33 | 27 | 22.50 | 43 | 35.83 | 10 | 8.33 |
| RBCMT1 | 32 | 25.40 | 30 | 23.81 | 55 | 43.65 | 9 | 9.17 |
| RBCMT2 | 212 | 43.44 | 62 | 12.70 | 194 | 39.75 | 20 | 4.10 |
| RBCMT3 | 164 | 52.73 | 39 | 12.54 | 96 | 30.87 | 12 | 3.86 |
| RBCMT4 | 54 | 65.84 | 5 | 6.10 | 22 | 26.83 | 1 | 1.22 |
| RPE1 | 129 | 46.57 | 48 | 17.33 | 77 | 27.80 | 23 | 8.30 |
| RPE2 | 76 | 44.19 | 30 | 17.44 | 47 | 27.33 | 19 | 11.05 |
| TIM1 | 119 | 48.37 | 37 | 15.04 | 72 | 29.27 | 18 | 7.32 |
| TIM2 | 18 | 34.62 | 9 | 17.31 | 17 | 32.69 | 8 | 15.38 |
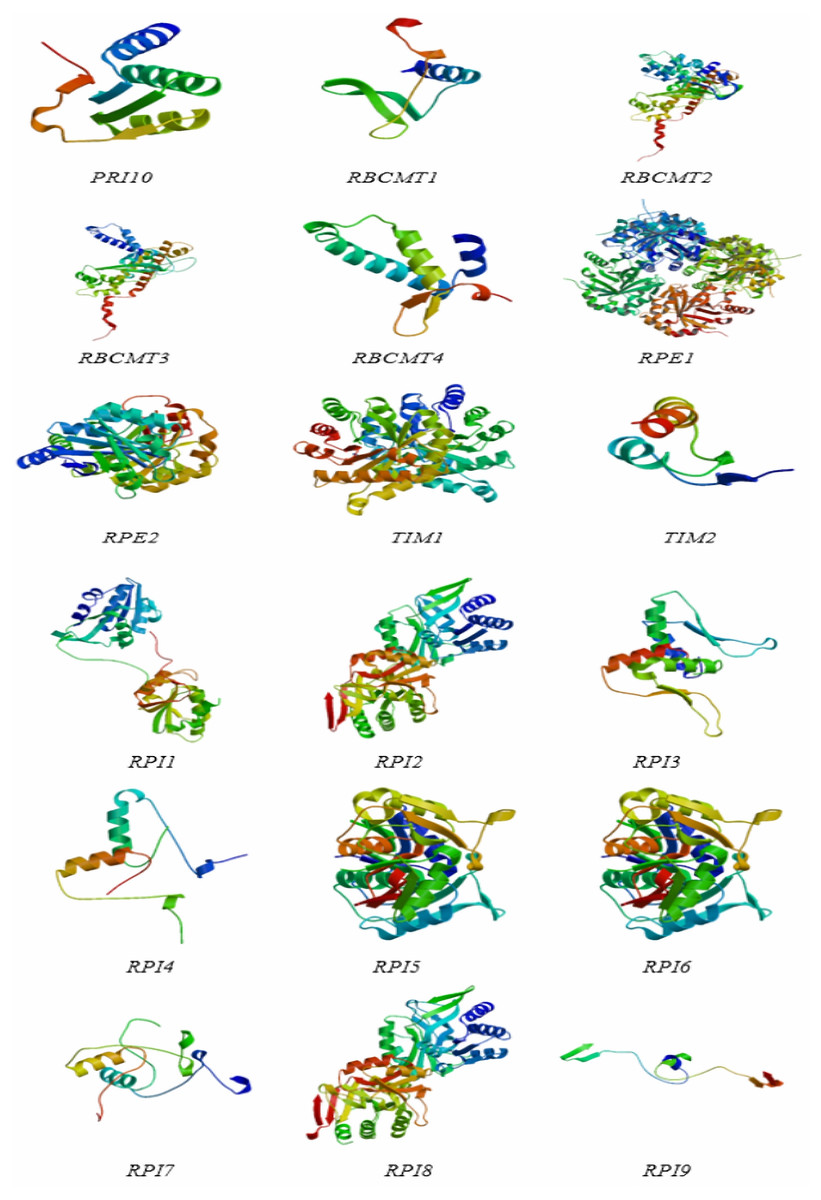
Figure 5: The protein structures of dark reaction proteins of photosynthesis in E. camaldulensis.
Q RT-PCR analysis of key genes related to photosynthesis
Ten of the 18 target genes selected for analysis were over-expressed in mature leaves, namely RPI1, RPI2, RPI3, RPI4, RPI5, RPI6, RBCMT1, RBCMT2, RPE1, and RPE2. The higher expression of these genes in mature leaves than younger ones was verified by qRT-PCR (Fig. 6A). On the other hand, eight target genes were down-regulated in the mature leaves viz., RPI7, RPI8, RPI9, RPI10, RBCMT3, RBCMT4, TIM1 as well as TIM2 and the qRT-PCR verified that their higher expression in young leaves than mature leaves (Fig. 6B). A consistent pattern of results was found between the results of the qRT-PCR and the RNA sequencing.
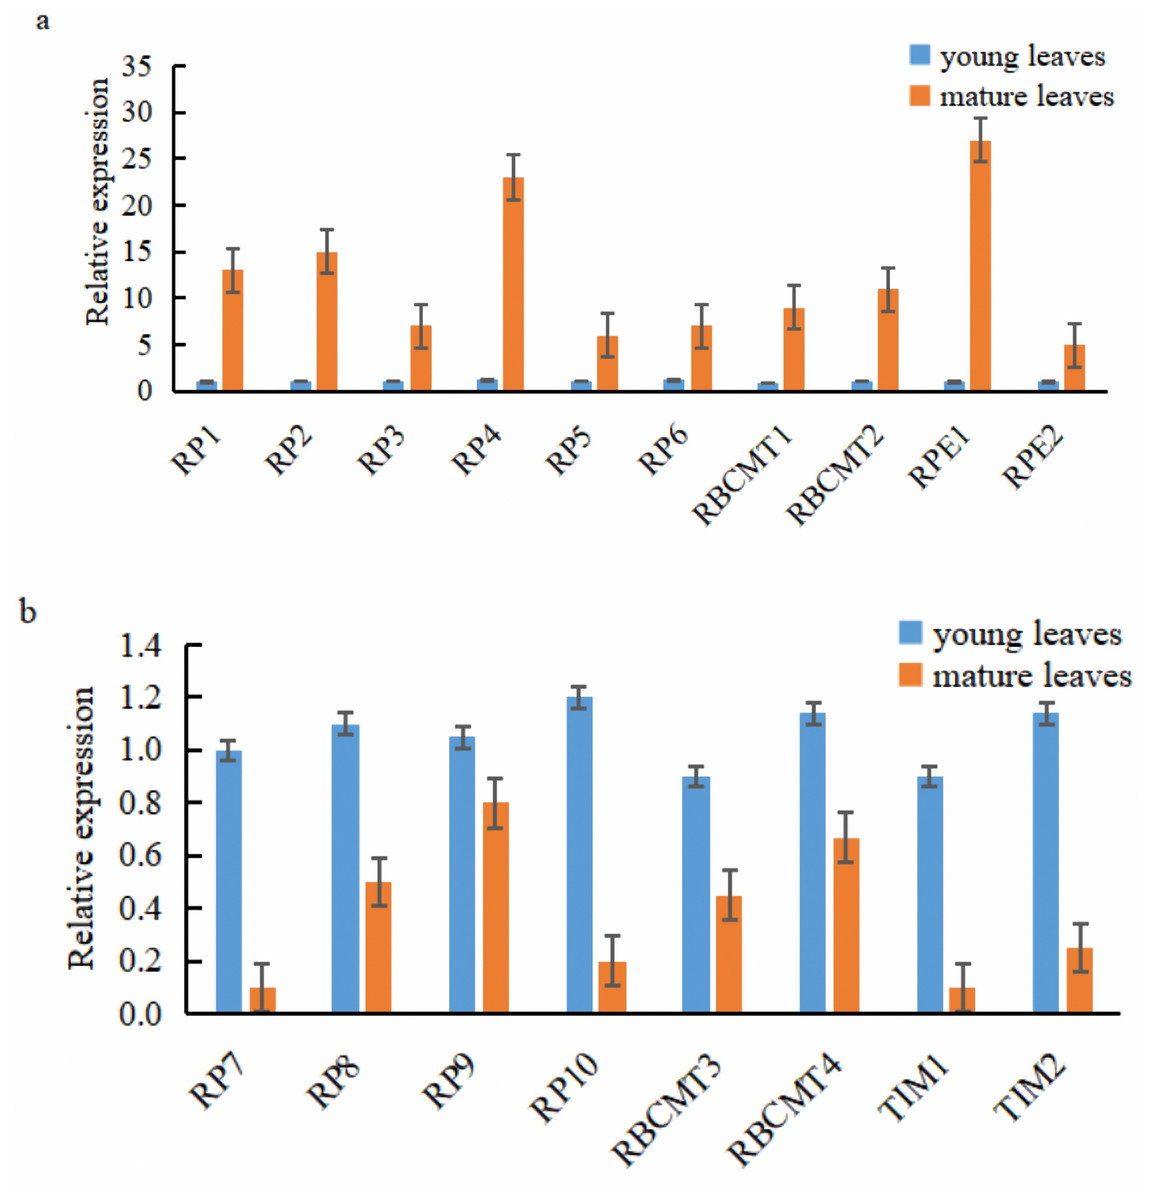
Figure 6: Expression of the target genes in young and mature leaves of E. camaldulensis as determined by the quantitative real-time PCR.
(A) genes were up-regulated in the mature leaves, (B) genes were down-regulated in the mature leaves.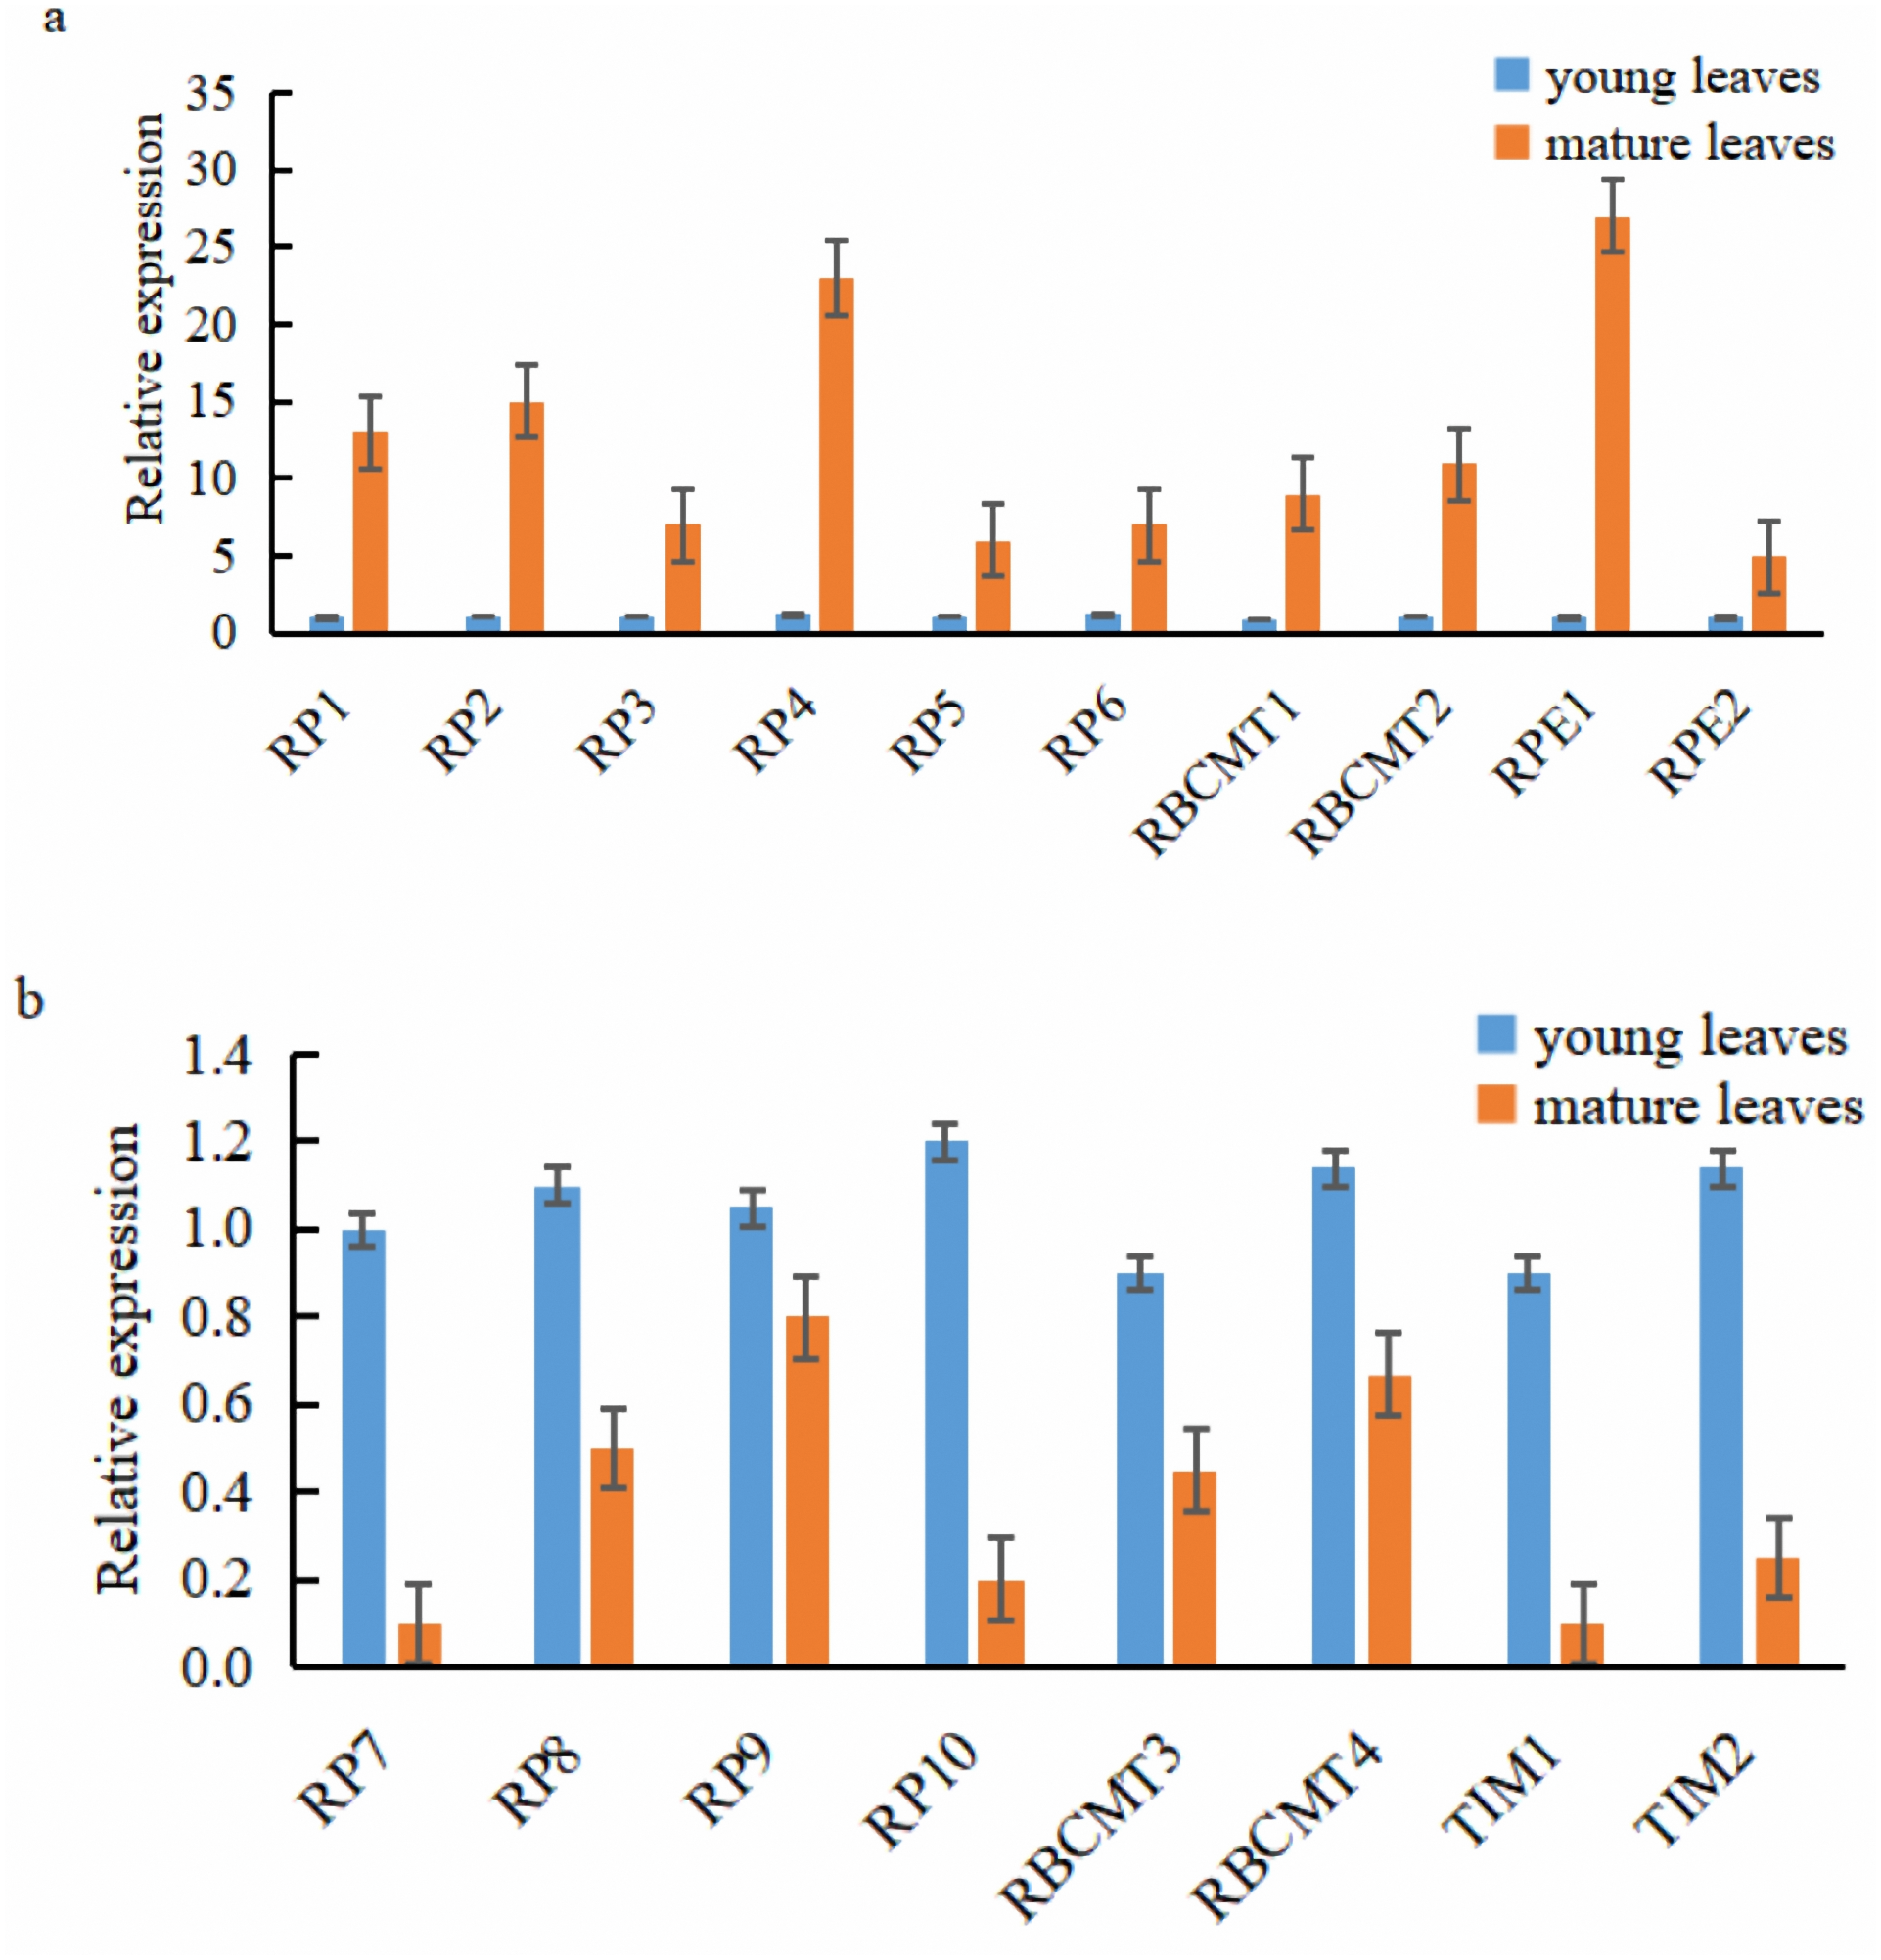
Discussion
Compare photosynthesis between young and mature leaves in E. camaldulensis
The rate of photosynthesis is closely related to the leaf age, and it changes with the age of the leaves. The photosynthetic rate showed a single peak curve from leaf initiation to senescence and wilting (Smith et al., 1997). In this study, the photosynthetic rate and trmmol of mature leaves were found to be higher than those of young leaves in E. camaldulensis. Similar findings were observed in Chinese fir, where the light absorption capacity and transformation capacity of old leaves were reported to be higher than those of young leaves (Li et al., 2017). This phenomenon may be possible due to the higher vulnerability of chlorophyll in young leaves to intense light. An increase in the net photosynthetic rate leads to higher stomatal conductance followed by more CO2 into carboxylated parts of the plant cells for photosynthesis. The increase of stomatal conductance also accelerated the loss of water, leading to the continuous increase of transpiration rate (De Souza et al., 2020). The light response curve reflects the change in net photosynthetic rate with the change of light intensity (Poorter & Navas, 2003), which provides the estimate of photosynthetic rate, light saturation point, light compensation point as well as other important ecological and physiological parameters of plants (Cannell & Thornley, 1998). Therefore, in this study, we analyze the light response curves of young and mature leaves of E. camaldulensis to understand the photosynthetic efficiency and growth of eucalyptus.
Key genes associated with photosynthesis in E. camaldulensis
The high-throughput sequencing provided huge data with high quality, which was suitable for the transcriptome study of Eucalyptus species, and improved our understanding about the molecular mechanisms in Eucalyptus (Morozova & Marra, 2008; Kadam et al., 2013; Xiao et al., 2020). Although, the role of Rubisco and PEP (two key enzymes in photosynthesis dark reactions) have been widely explored, there is limited information available on ribose-5-phosphate isomerase (RPI), rubisco methyltransferase (RBCMT), ribulose-phosphate 3-epimerase (RPE), and triosephosphate isomerase (TIM) genes. Enzymes play an important role in the dark reaction of photosynthesis; therefore, RPI, RBCMT, RPE, and TIM genes were selected as the research objects.
RPI is a highly conserved protease that is ubiquitous in many organisms and plays a central role in the pentose phosphate pathway (PPP). It is involved in the reversible isomerization of ribose-5-phosphate (R5P) and ribulose 5-phosphate (Ru5P) between prokaryotes and eukaryotes as well as in the Calvin cycle of carbon dioxide fixation in plants (Wamelink et al., 2010; Gontero, Cárdenas & Ricard, 1988). According to the reports, RPI is an essential enzyme in the Calvin cycle in peas and spinach (Woodruff & Wolfenden, 1979; Park & Anderson, 1973). The photosynthetic rate of mature leaves was higher than that of young leaves in E. camaldulensis, genes such as RPI1, RPI2, RPI3, RPI4, RPI5, and RPI6 were up-regulated in the mature leaves. Among the RPI genes of E. camaldulensis, RPI2 was the longest amino acid encoded protein. RPI2, RPI3, and RPI5 genes encoded for basic amino acids. The proteins encoded by RPI1 and RPI5 genes were hydrophobic in nature. The results indicate that the high expression of RPI genes in mature leaves could produce more PRI enzymes for photosynthesis.
Rubisco is a bifunctional enzyme and is widely available in the chloroplast matrix of plants. It can catalyze both the carboxylation reaction of C3 for photosynthesis and the oxygenation reaction of C5 for photorespiration. In photosynthesis, Rubisco was present at the intersection of carbon oxidation and carbon reduction, and RBCMT was the rubisco methyltransferase (Miyazawa et al., 2020). The expression of RBCMT1 and RBCMT2 was positively correlated with the net photosynthetic rate. RBCMT2 was the longest amino acid encoded protein in E. camaldulensis. RBCMT1 encoded basic amino acids. According to the hydrophilic index, the proteins encoded by RBCMT genes were hydrophobic in nature.
RPE can play a vital role in the development of the NADPH pool, and PPP, which can convert monosaccharides, such as glucose, into the nucleotide precursor of pentose sugars. Additionally, RPE can convert the ribulose-5-phosphate into xylulose 5-phosphate in the Calvin cycle (Lykins et al., 2018). The photosynthetic rate of mature leaves was higher than that of young leaves in E. camaldulensis. RPE1 and RPE2 were up-regulated in mature leaves, which indicates that these may be the key genes to enhancing photosynthesis. RPE1 encoded for the basic amino acids, and RPE2 encoded for the acidic amino acids. The protein encoded by the RPE1 gene was hydrophobic in nature, whereas the RPE2 gene encoded for hydrophilic protein. Furthermore, RP7, RP8, RP9, RP10, RBCMT3, RBCMT4, TIM1, and TIM2 genes were highly expressed in young leaves of E. camaldulensis, indicating that they may be involved in the negative regulation (Katrin et al., 1994). These results provide a basic structure for understanding the RPI, RBCMT, RPE, and TIM genes and exploring the functions of genes for further research in E. camaldulensis. Through genetic transformation, enhancing photosynthetic efficiency or productivity by using these genes to ensure the better afforestation quality of eucalyptus plantations and to generate greater social, ecological, and economic value.
Conclusions
The present study revealed the characteristics of photosynthesis and transcriptome of young and mature leaves in E. camaldulensis. A total of 18 target genes related to photosynthesis were analyzed using bioinformatics methods.The RPI genes were differentially expressed in mature leaves, six of which were up-regulated, while others were down-regulated. Among the four RBCMT genes, two were up-regulated. Mature leaves exhibited up-regulation in two RPE genes, while young leaves showed down-regulation in two TIM genes. The basic physical and chemical properties, including relative molecular weight, theoretical isoelectric point instability coefficient, hydrophilic index, and lipid solubility index, were systematically analyzed. The obtained protein structures consist of α-helix, extension chain, random coil, and β-angle structure. The outcome of this study provides a platform to understand the basic characteristics of RPI, RBCMT, RPE, and TIM genes, and further explore the functions of the genes in eucalyptus. Our findings provide profuse data resources for further research on the growth and development of E. camaldulensis, as well as the function and regulation of photosynthesis-related genes.