
The complete mitochondrial genome sequence of Oryctes rhinoceros (Coleoptera: Scarabaeidae) based on long-read nanopore sequencing
- Published
- Accepted
- Received
- Academic Editor
- Joseph Gillespie
- Subject Areas
- Computational Biology, Entomology, Genomics, Molecular Biology
- Keywords
- Mitochondrial genome, Scarabaeidae, Oryctes rhinoceros, Coconut palm pest, ONT MinION, Biosecurity and pest management
- Copyright
- © 2021 Filipović et al.
- Licence
- This is an open access article distributed under the terms of the Creative Commons Attribution License, which permits unrestricted use, distribution, reproduction and adaptation in any medium and for any purpose provided that it is properly attributed. For attribution, the original author(s), title, publication source (PeerJ) and either DOI or URL of the article must be cited.
- Cite this article
- 2021. The complete mitochondrial genome sequence of Oryctes rhinoceros (Coleoptera: Scarabaeidae) based on long-read nanopore sequencing. PeerJ 9:e10552 https://doi.org/10.7717/peerj.10552
Abstract
Background
The coconut rhinoceros beetle (CRB, Oryctes rhinoceros) is a severe and invasive pest of coconut and other palms throughout Asia and the Pacific. The biocontrol agent, Oryctes rhinoceros nudivirus (OrNV), has successfully suppressed O. rhinoceros populations for decades but new CRB invasions started appearing after 2007. A single-SNP variant within the mitochondrial cox1 gene is used to distinguish the recently-invading CRB-G lineage from other haplotypes, but the lack of mitogenome sequence for this species hinders further development of a molecular toolset for biosecurity and management programmes against CRB. Here we report the complete circular sequence and annotation for CRB mitogenome, generated to support such efforts.
Methods
Sequencing data were generated using long-read Nanopore technology from genomic DNA isolated from a CRB-G female. The mitogenome was assembled with Flye v.2.5, using the short-read Illumina sequences to remove homopolymers with Pilon, and annotated with MITOS. Independently-generated transcriptome data were used to assess the O. rhinoceros mitogenome annotation and transcription. The aligned sequences of 13 protein-coding genes (PCGs) (with degenerate third codon position) from O. rhinoceros, 13 other Scarabaeidae taxa and two outgroup taxa were used for the phylogenetic reconstruction with the Maximum likelihood (ML) approach in IQ-TREE and Bayesian (BI) approach in MrBayes.
Results
The complete circular mitogenome of O. rhinoceros is 20,898 bp in length, with a gene content canonical for insects (13 PCGs, two rRNA genes, and 22 tRNA genes), as well as one structural variation (rearrangement of trnQ and trnI) and a long control region (6,204 bp). Transcription was detected across all 37 genes, and interestingly, within three domains in the control region. ML and BI phylogenies had the same topology, correctly grouping O. rhinoceros with one other Dynastinae taxon, and recovering the previously reported relationship among lineages in the Scarabaeidae. In silico PCR-RFLP analysis recovered the correct fragment set that is diagnostic for the CRB-G haplogroup. These results validate the high-quality of the O. rhinoceros mitogenome sequence and annotation.
Introduction
Oryctes rhinoceros (L.) (Coleoptera: Scarabaeidae: Dynastinae), also known as the coconut rhinoceros beetle (CRB), is an important agricultural pest causing significant economic damage to coconut and other palms across Asia and South Pacific. During the 20th century, human-mediated dispersal resulted in the distribution of O. rhinoceros expanding from its native range (between Pakistan and the Philippines) throughout Oceania (Catley, 1969). After the discovery and introduction of the viral biocontrol agent Oryctes rhinoceros nudivirus (OrNV) in the 1960s, most of the CRB populations in the Pacific islands have been persistently suppressed (Huger, 2005). However, after a biocontrol campaign failed to eradicate a newly established population in Guam in 2007, new O. rhinoceros invasions were recorded in Papua New Guinea (2009), Hawaii (2013) and Solomon Islands (2015) and more recently in New Caledonia and Vanuatu (Etebari et al., 2020). Worryingly, the new invasive populations have also been difficult to control by known OrNV isolates (Marshall et al., 2017), emphasizing the importance of actively overseeing and adapting the management programmes for this important insect pest.
The expansion pathways, dynamics and hybridization of invasive insect pests and other arthropods are commonly traced through the analyses of mitochondrial sequence variation (Wang et al., 2017; Rubinoff et al., 2010; Moore et al., 2013). In the absence of a mitogenome sequence, the universal barcoding region is often amplified with degenerate primers to investigate partial sequences of cox1 and a limited number of other mitochondrial genes in the target species. However, analyses of such partial sequence data can fail to distinguish true mitochondrial lineages unless a sufficient number of genetic markers can be retrieved. Variation from a partial sequence of one mitochondrial gene (cox1) and one nuclear gene (cad) was not sufficient to allow confident hypotheses testing around O. rhinoceros invasion pathways (Reil, Jose & Rubinoff, 2016), but a single diagnostic SNP within the partial cox1 gene amplicon has been used to distinguish the CRB-G haplotype from other haplotype that originally invaded the Pacific islands in the early 1900s (Marshall et al., 2017; Etebari et al., 2020). Here we report the first and complete mitogenome sequence assembly of O. rhinoceros, a genomic resource that will support the development of a comprehensive molecular marker toolset to help advance the biosecurity and management efforts against this resurgent pest.
The complete O. rhinoceros mitogenome assembly was generated using long-read Oxford Nanopore Technologies (ONT) sequencing and complemented with the short-read Illumina sequencing. The approach recovered all 37 genes (Cameron, 2014b) and a long non-coding (control) region (6204 bp) that was not recovered in a short-read (Illumina-based) assembly, likely because it contains different putative tandem repeats. Three domains with detectable transcription within the control region and the rearrangement of two tRNA genes (trnI and trnQ) were also identified. The high quality of the assembly was validated through the correct placement of O. rhinoceros within the Scarabaeidae phylogeny, transcription patterns from an independently-generated transcriptome dataset, and in silico recovery of a recently reported diagnostic PCR-RFLP marker. This is the first complete mitogenome for the genus Oryctes and the subfamily Dynastinae, and among only a few for the entire scarab beetle family (Scarabaeidae).
Materials and Methods
Sample collection, DNA extraction and ONT sequencing
An adult female O. rhinoceros was collected from a pheromone trap (Oryctalure, P046-Lure, ChemTica Internacional, S. A., Heredia Costa Rica) on Guadalcanal, Solomon Islands in January 2019 and preserved in 95% ethanol. Mrs Helen Tsatsia (Director of Research) and members of the research team at the Ministry of Agriculture and Livestock, Honiara, Solomon Islands Government facilitated the insect collection in Solomon Islands. Initially, the mitochondrial haplotype of the specimen was determined as CRB-G (Marshall et al., 2017) via Sanger sequencing of the partial cox1 gene sequence that was amplified using the universal barcode primers LCO1490 and HCO2198 (Folmer et al., 1994). High-molecular weight DNA was extracted using a customized magnetic (SPRI) bead-based protocol. Specifically, smaller pieces of tissue from four legs and thorax (50 mm3) were each incubated in a 1.7 ml eppendorf tube with 360 μL ATL buffer, 40 μL of proteinase K (Qiagen Blood and Tissue DNA extraction kit) for 3 h at RT, while rotating end-over-end at 1 rpm. A total of 400 μL of AL buffer was added and the reaction was incubated for 10 min, followed by adding 8 μL of RNase A and incubation for 5 minutes. Tissue debris was spun down quickly (1 min at 16,000 rcf) and 600 μL of homogenate was transferred to a fresh tube, where SPRI bead solution was added in 1:1 ratio and incubated for 30 min while rotating at end-over-end at 1 rpm. After two washes with 75% ethanol, DNA was eluted in 50 μL of TE buffer. DNA quality (integrity and concentration) was assessed on the 4,200 Tapestation system (Agilent, Santa Clara, CA, USA) and with the Qubit broad-range DNA kit. To enrich for DNA >10 kb, size selection was done using the Circulomics Short Read Eliminator XS kit. We sequenced a total of four libraries, each prepared with 1 μg of size-selected HMW DNA, following the manufacturer’s guidelines for the Ligation Sequencing Kit SQK-LSK109 (Oxford Nanopore Technologies, Cambridge, UK). Sequencing was done on the MinION sequencing device with the Flow Cell model R9.4.1 (Oxford Nanopore Technologies, Cambridge, UK) and the ONT MinKNOW Software.
An Illumina sequencing library was prepared using a NebNext Ultra DNA II Kit (New England Biolabs, Ipswich, MA, USA) and was sequenced on a HiSeq X10 (150 bp paired end reads) by Novogene (Beijing, China).
Mitogenome assembly, annotation and analysis
The Guppy base caller ONT v.3.2.4 was used for high-accuracy base calling on the raw sequence data, and only high-quality sequences with a Phred score >13 were used for the de novo mitogenome assembly with the program Flye v.2.5 (Kolmogorov et al., 2019) in the metagenome assembly mode. The method recovered the full circular assembly and to verify its accuracy, we first mapped the original reads back to the generated mitogenome assembly using Minimap2 (Li, 2018) with the following parameters: -k15—secondary = no -L -2. Second, we used BWA-MEM (Li, 2013) to map short-read Illumina sequences obtained from the whole-genome sequencing of another O. rhinoceros female collected from the same geographic location as the specimen used for the mitogenome assembly. The read alignment analysis in Pilon (Walker et al., 2014) was used to identify inconsistencies between the draft mitogenome assembly and the aligned short Illumina reads, removing small indels that represent homopolymers (e.g., >4 bp single nucleotide stretches) as an inherent sequencing error of the ONT (Mikheyev & Tin, 2014). Finally, we manually inspected if the Pilon correction occurred only in putative homopolymer regions by comparing the draft assembly with the Pilon-polished version.
The complete mitogenome sequence was initially annotated using the MITOS web server (Bernt et al., 2013), and tRNA genes and their secondary structures were cross-analysed using tRNAscan-SE v2.0 (Chan et al., 2019). To further refine the annotation and to examine mitogenome transcription, we used BWA-MEM to align Illumina reads from a transcriptome study of O. rhinoceros larvae (Shelomi, Lin & Liu, 2019), retrieved from the NCBI (SRR9208133). Finally, we manually inspected and compared our annotation to the complete and near complete mitogenome annotations of other related taxa (Table 1) in Geneious Prime (Biomatters development team, 2020). MEGA X (Kumar et al., 2018) was used to assess the codon usage and nucleotide composition of protein-coding genes. We used Geneious Prime to test if the nucleotide sequence of the cox1 gene recovers the recently reported PCR-RFLP marker (Marshall et al., 2017). This was done by aligning the sequences of the primer pair (LCO1490 and HCO2198) to isolate the amplicon fragment and perform in silico restriction digestion with MseI restriction enzyme. The restriction digestion of the amplicon produces a set of fragment lengths that distinguishes CRB-G from other haplotypes (Marshall et al., 2017). The presence of tandem repeats within the control region was assessed with the Tandem Repeats Finder v.4.0.9 (Benson, 1999) using default parameters. The annotated mitogenome sequence has been deposited in GenBank under accession number MT457815.1.
| Accession | Reference | Organism | Genome type |
Missing genes | Contains control region |
Sequence length (bp) |
|---|---|---|---|---|---|---|
| FJ859903.1 | Cameron et al. (2009) | Rhopaea magnicornis | Complete | None | Yes | 17,522 |
| JX412731.1 | Timmermans et al. (2016) | Cyphonistes vallatus | Partial | nd1 | No | 11,629 |
| JX412734.1 | Timmermans et al. (2016) | Trox sp. | Partial | nd2; cox1 | No | 11,622 |
| JX412739.1 | Timmermans et al. (2016) | Schizonycha sp. | Partial | nd2 | No | 13,542 |
| JX412755.1 | Timmermans et al. (2016) | Asthenopholis sp. | Partial | nd2 | No | 12,352 |
| KC775706.1 | Kim et al. (2014) | Protaetia brevitarsis | Complete | None | Yes | 20,319 |
| KF544959.1 | Kim & Kim (2013) | Polyphylla laticollis mandshurica | Partial | None | No | 14,473 |
| KU739455.1 | Breeschoten et al. (2016) | Eurysternus foedus | Partial | None | No | 15,366 |
| KU739465.1 | Breeschoten et al. (2016) | Coprophanaeus sp. | Partial | None | No | 15,554 |
| KU739469.1 | Breeschoten et al. (2016) | Bubas bubalus | Partial | None | No | 16,035 |
| KU739498.1 | Breeschoten et al. (2016) | Onthophagus rhinolophus | Partial | None | No | 15,237 |
| KX087316.1 | A. Hunter, 2017 (unpublished) | Melolontha hippocastani | Partial | None | No | 15,485 |
| MN122896.1 | A. Margaryan, 2019 (unpublished) | Anoplotrupes stercorosus | Partial | nd2 | No | 13,745 |
| NC_030778.1 | Kim et al. (2016) | Osmoderma opicum | Complete | None | Yes | 15,341 |
| NC_038115.1 | Yang et al. (2018) | Popillia japonica | Complete | None | Yes | 16,541 |
Phylogenetic analysis
To ascertain if our newly sequenced O. rhinoceros mitogenome can be correctly placed within the Dynastinae subfamily of the Scarabaeidae family, we performed the phylogenetic analyses with 15 additional taxa for which complete or near complete mitogenome sequences could be retrieved from the NCBI. We used thirteen species from five subfamilies of the Scarabaeidae family (Dynastinae, Rutelinae, Cetoniine, Melolonthinae, Scarabaeinae) and members of two other families from Scarabaeoidea as outgroups (Trogidae, Geotrupidae) (Table 1).
Nucleotide sequences of all 13 protein-coding genes (PCGs) were first translated into amino acid sequences under the invertebrate mitochondrial genetic code and aligned using the multiple alignment in Geneious Prime. The aligned amino acid matrix was back-translated into the corresponding nucleotide matrix and the Perl script Degen v1.4 (Zwick, Regier & Zwickl, 2012; Regier et al., 2010) was used to create the degenerated protein-coding sequences in order to reduce the bias effect of synonymous mutations on the phylogenetic analysis. These final alignments from all 13 PCGs were concatenated using Geneious Prime.
We estimated the phylogeny using two methods: the Maximum likelihood (ML) inference implemented in IQ-TREE web server (Trifinopoulos et al., 2016) and the Bayesian inference (BI) in MrBayes (Huelsenbeck & Ronquist, 2001). For the ML analysis, the automatic and FreeRate heterogeneity options were set under optimal evolutionary models, and the branch support values were calculated using the ultrafast bootstrap (Hoang et al., 2018) and the SH-aLRT branch test approximation (Shimodaira & Hasegawa, 1999) with 1,000 replicates. The Akaike information criterion (AIC) in ModelFinder (Kalyaanamoorthy et al., 2017) was used to select the best substitution model, and the BI phylogeny was generated with a total chain length of 1,100,000 (burn-in of 110,000 trees) and sampling every 200 cycles. The consensus trees with branch support were viewed and edited in Figtree v1.4.2 (Rambaut, 2014).
Results
Mitogenome assembly, organization and transcription
The ONT long reads enabled the complete assembly of the circular mitochondrial genome for O. rhinoceros with just one MinION flow cell. This initial assembly was 20,954 bp in length and had a coverage of 3,834x. Based on the coverage ratio between the mitochondrial and draft nuclear genome assembly (unpublished data), we estimated that there were 320 copies of mitogenome for every nuclear genome copy. After including the data from three additional MinION flow cells, we produced a draft mitogenome assembly that was 21,039 bp long and had a coverage of 10,292x. Again, based on the coverage ratio between the mitochondrial and draft nuclear genome assembly, we estimated that there were 294 mitogenome copies per one copy of the nuclear genome in the total dataset. We then used the aligned Illumina reads to identify and correct indels, which are the most common error type produced by the ONT sequencing (Mikheyev & Tin, 2014), resulting in the removal of 141 bp. Of those, 95 bp were removed from the 5- to 9-mers (homopolymers). The final polished assembly was 20,898 bp in length. Our Illumina-only assembly, on the other hand, recovered a 17,665 bp mitogenome length with 3,233 bp missing from the control-region (CR).
The nucleotide composition of the complete mitogenome had high A + T bias (37.7% A, 32.8% T, 19.4% C and 10% G), and the long CR matched this genome-wide pattern (34.3% A, 35.8% T, 20.4% C and 9.5% G). The annotation revealed all 37 genes, with the rearrangement of trnI and trnQ genes, that showed the order: CR-trnQ-trnI-trnM-nad2 instead of CR-trnI-trnQ-trnM- nad2 (Table 2). CR resides within a large non-coding region (6,204 bp long) located between rrnS and trnQ, and the tandem repeats analysis revealed a complex structure of this large region with 11 putative repeats that had a consensus sequence between 7 and 410 bp repeated 2–12 times (Table 3). The length of 22 tRNAs ranged from 63 to 70 bp (Table 2), and their predicted secondary structures exhibited a typical clover-leaf structure. The length of rrnL and rrnS were 1,283 bp and 783 bp, respectively (Table 2).
| Feature name |
Type | Start position |
End position |
Length | Direction | Start codon |
Stop codon |
|---|---|---|---|---|---|---|---|
| trnQ | tRNA | 1 | 69 | 69 | Reverse | ||
| trnI | tRNA | 127 | 190 | 64 | Forward | ||
| trnM | tRNA | 195 | 263 | 69 | Forward | ||
| nad2 | gene | 276 | 1,271 | 996 | Forward | ATT | TAA |
| trnW | tRNA | 1,270 | 1,335 | 66 | Forward | ||
| trnC | tRNA | 1,328 | 1,392 | 65 | Reverse | ||
| trnY | tRNA | 1,393 | 1,456 | 64 | Reverse | ||
| cox1 | gene | 1,458 | 2,993 | 1,536 | Forward | ATC | TAA |
| trnL2 | tRNA | 2,989 | 3,054 | 66 | Forward | ||
| cox2 | gene | 3,055 | 3,762 | 708 | Forward | ATA | TAA |
| trnK | tRNA | 3,743 | 3,812 | 70 | Forward | ||
| trnD | tRNA | 3,813 | 3,875 | 63 | Forward | ||
| atp8 | gene | 3,876 | 4,031 | 156 | Forward | ATT | TAA |
| atp6 | gene | 4,025 | 4,696 | 672 | Forward | ATG | TAT |
| cox3 | gene | 4,695 | 5,483 | 789 | Forward | ATG | TAT |
| trnG | tRNA | 5,482 | 5,545 | 64 | Forward | ||
| nad3 | gene | 5,546 | 5,899 | 354 | Forward | ATC | TAG |
| trnA | tRNA | 5,898 | 5,962 | 65 | Forward | ||
| trnR | tRNA | 5,963 | 6,027 | 65 | Forward | ||
| trnN | tRNA | 6,028 | 6,092 | 65 | Forward | ||
| trnS1 | tRNA | 6,093 | 6,159 | 67 | Forward | ||
| trnE | tRNA | 6,161 | 6,224 | 64 | Forward | ||
| trnF | tRNA | 6,223 | 6,288 | 66 | Reverse | ||
| nad5 | gene | 6,287 | 8,005 | 1,719 | Reverse | ATT | TAT |
| trnH | tRNA | 8,003 | 8,066 | 64 | Reverse | ||
| nad4 | gene | 8,066 | 9,403 | 1,338 | Reverse | ATG | TAA |
| nad4l | gene | 9,397 | 9,687 | 291 | Reverse | ATG | TAA |
| trnT | tRNA | 9,690 | 9,754 | 65 | Forward | ||
| trnP | tRNA | 9,755 | 9,819 | 65 | Reverse | ||
| nad6 | gene | 9,821 | 10,321 | 501 | Forward | ATC | TAA |
| cob | gene | 10,321 | 11,463 | 1,143 | Forward | ATG | TAG |
| trnS2 | tRNA | 11,462 | 11,527 | 66 | Forward | ||
| nad1 | gene | 11,547 | 12,497 | 951 | Reverse | ATT | TAA |
| trnL1 | tRNA | 12,499 | 12,561 | 63 | Reverse | ||
| rrnL | rRNA | 12,559 | 13,841 | 1,283 | Reverse | ||
| trnV | tRNA | 13,843 | 13,912 | 70 | Reverse | ||
| rrnS | rRNA | 13,912 | 14,694 | 783 | Reverse | ||
| Control region | misc_feature | 14,695 | 20,898 | 6,204 | None | ||
| Expressed region 1 | misc_RNA | 15,117 | 15,253 | 137 | Reverse | ||
| Expressed region 2 | misc_RNA | 15,321 | 15,476 | 156 | Reverse | ||
| Expressed region 3 | misc_RNA | 17,744 | 18,387 | 644 | Reverse |
| Indices | Period Size |
Copy Number |
Consensus Size |
Percent Matches |
Percent Indels |
Score | A | C | G | T | Entropy (0–2) |
|---|---|---|---|---|---|---|---|---|---|---|---|
| 14,764–14,795 | 16 | 2 | 16 | 93 | 0 | 55 | 53 | 0 | 0 | 46 | 1 |
| 14,757–14,797 | 7 | 6 | 7 | 78 | 16 | 50 | 48 | 0 | 0 | 51 | 1 |
| 14,818–14,859 | 15 | 3 | 14 | 86 | 10 | 59 | 38 | 0 | 0 | 61 | 0.96 |
| 15,012–15,440 | 133 | 3.2 | 133 | 97 | 1 | 824 | 52 | 15 | 6 | 25 | 1.65 |
| 15,447–17,166 | 285 | 6 | 285 | 98 | 0 | 3,336 | 24 | 29 | 13 | 33 | 1.93 |
| 16,955–17,949 | 206 | 4.9 | 205 | 98 | 1 | 1,933 | 24 | 29 | 12 | 33 | 1.92 |
| 16,955–17,949 | 410 | 2.4 | 409 | 98 | 1 | 1,938 | 24 | 29 | 12 | 33 | 1.92 |
| 18,024–18,419 | 110 | 3.6 | 110 | 96 | 1 | 724 | 41 | 24 | 8 | 25 | 1.83 |
| 18,656–18,707 | 22 | 2.3 | 23 | 81 | 15 | 65 | 51 | 1 | 3 | 42 | 1.31 |
| 19,664–20,895 | 102 | 12 | 102 | 98 | 0 | 2,351 | 36 | 11 | 7 | 44 | 1.69 |
| 19,664–20,895 | 205 | 6 | 204 | 98 | 0 | 2,369 | 36 | 11 | 7 | 44 | 1.69 |
All protein coding genes (PCGs) started with a standard initiation codon (ATN), 10 of 13 PCGs terminated with the conventional stop codons (TAG or TAA), while three genes (atp6, cox3 and nad5) had an incomplete stop codon T (Table 2). In silico digestion of the cox1 amplicon (delineated with the primer sequences from (Folmer et al., 1994)) produced the fragments 253 bp-, 138 bp-and 92 bp-long (Fig. S1) that are diagnostic for the CRB-G haplotype (Marshall et al., 2017).
The mapping of the transcriptome sequencing reads to the newly assembled mitogenome revealed that all PCGs were transcribed (mean coverage depth per base >23000X, Fig. 1), with cox1 and cox2 showing the highest level of expression when compared to the rRNA genes in the examined larval samples (Fig. 1). We found three domains within the large CR-containing region that also showed detectable transcription levels, with the transcript sizes of 137, 156 and 644 bp respectively. Our attempts to annotate these transcripts were not successful due to the fact that their sequences did not contain any open reading frames, nor did they have any significant BLAST hits within the NCBI’s reference RNAseq or nucleotide databases.
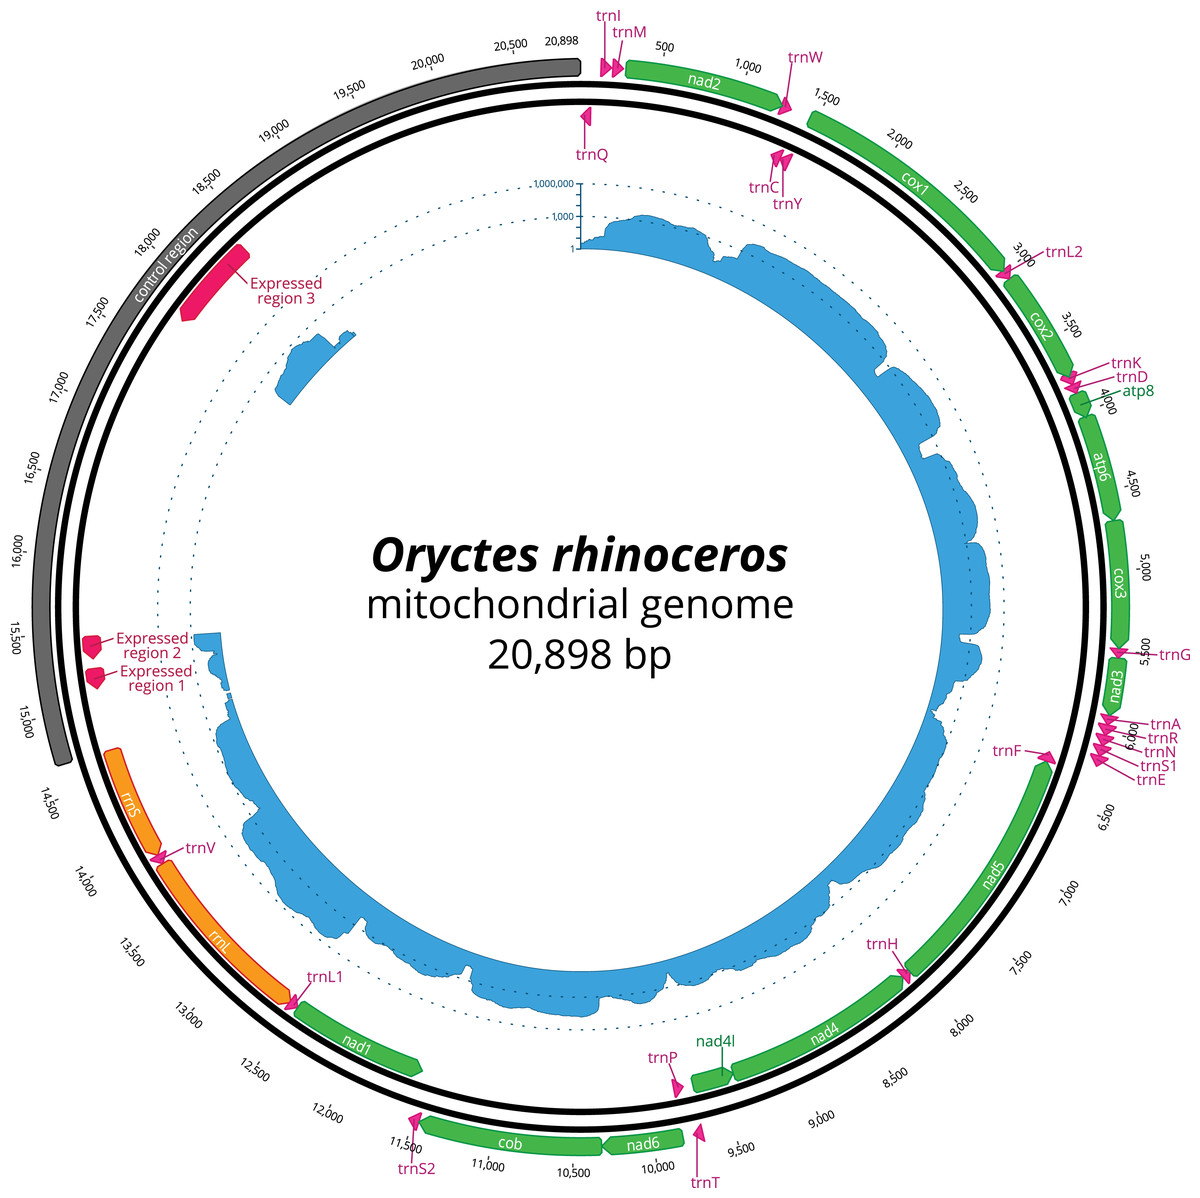
Figure 1: Circular representation of complete O. rhinoceros mitochondrial genome.
The position and orientation of 13 PCG genes (green), 22 trna genes (pink), two rRNA genes (orange), control region (grey) with three expressed domains (red). The inner circle displays transcriptome read depth (blue) on a logarithmic scale.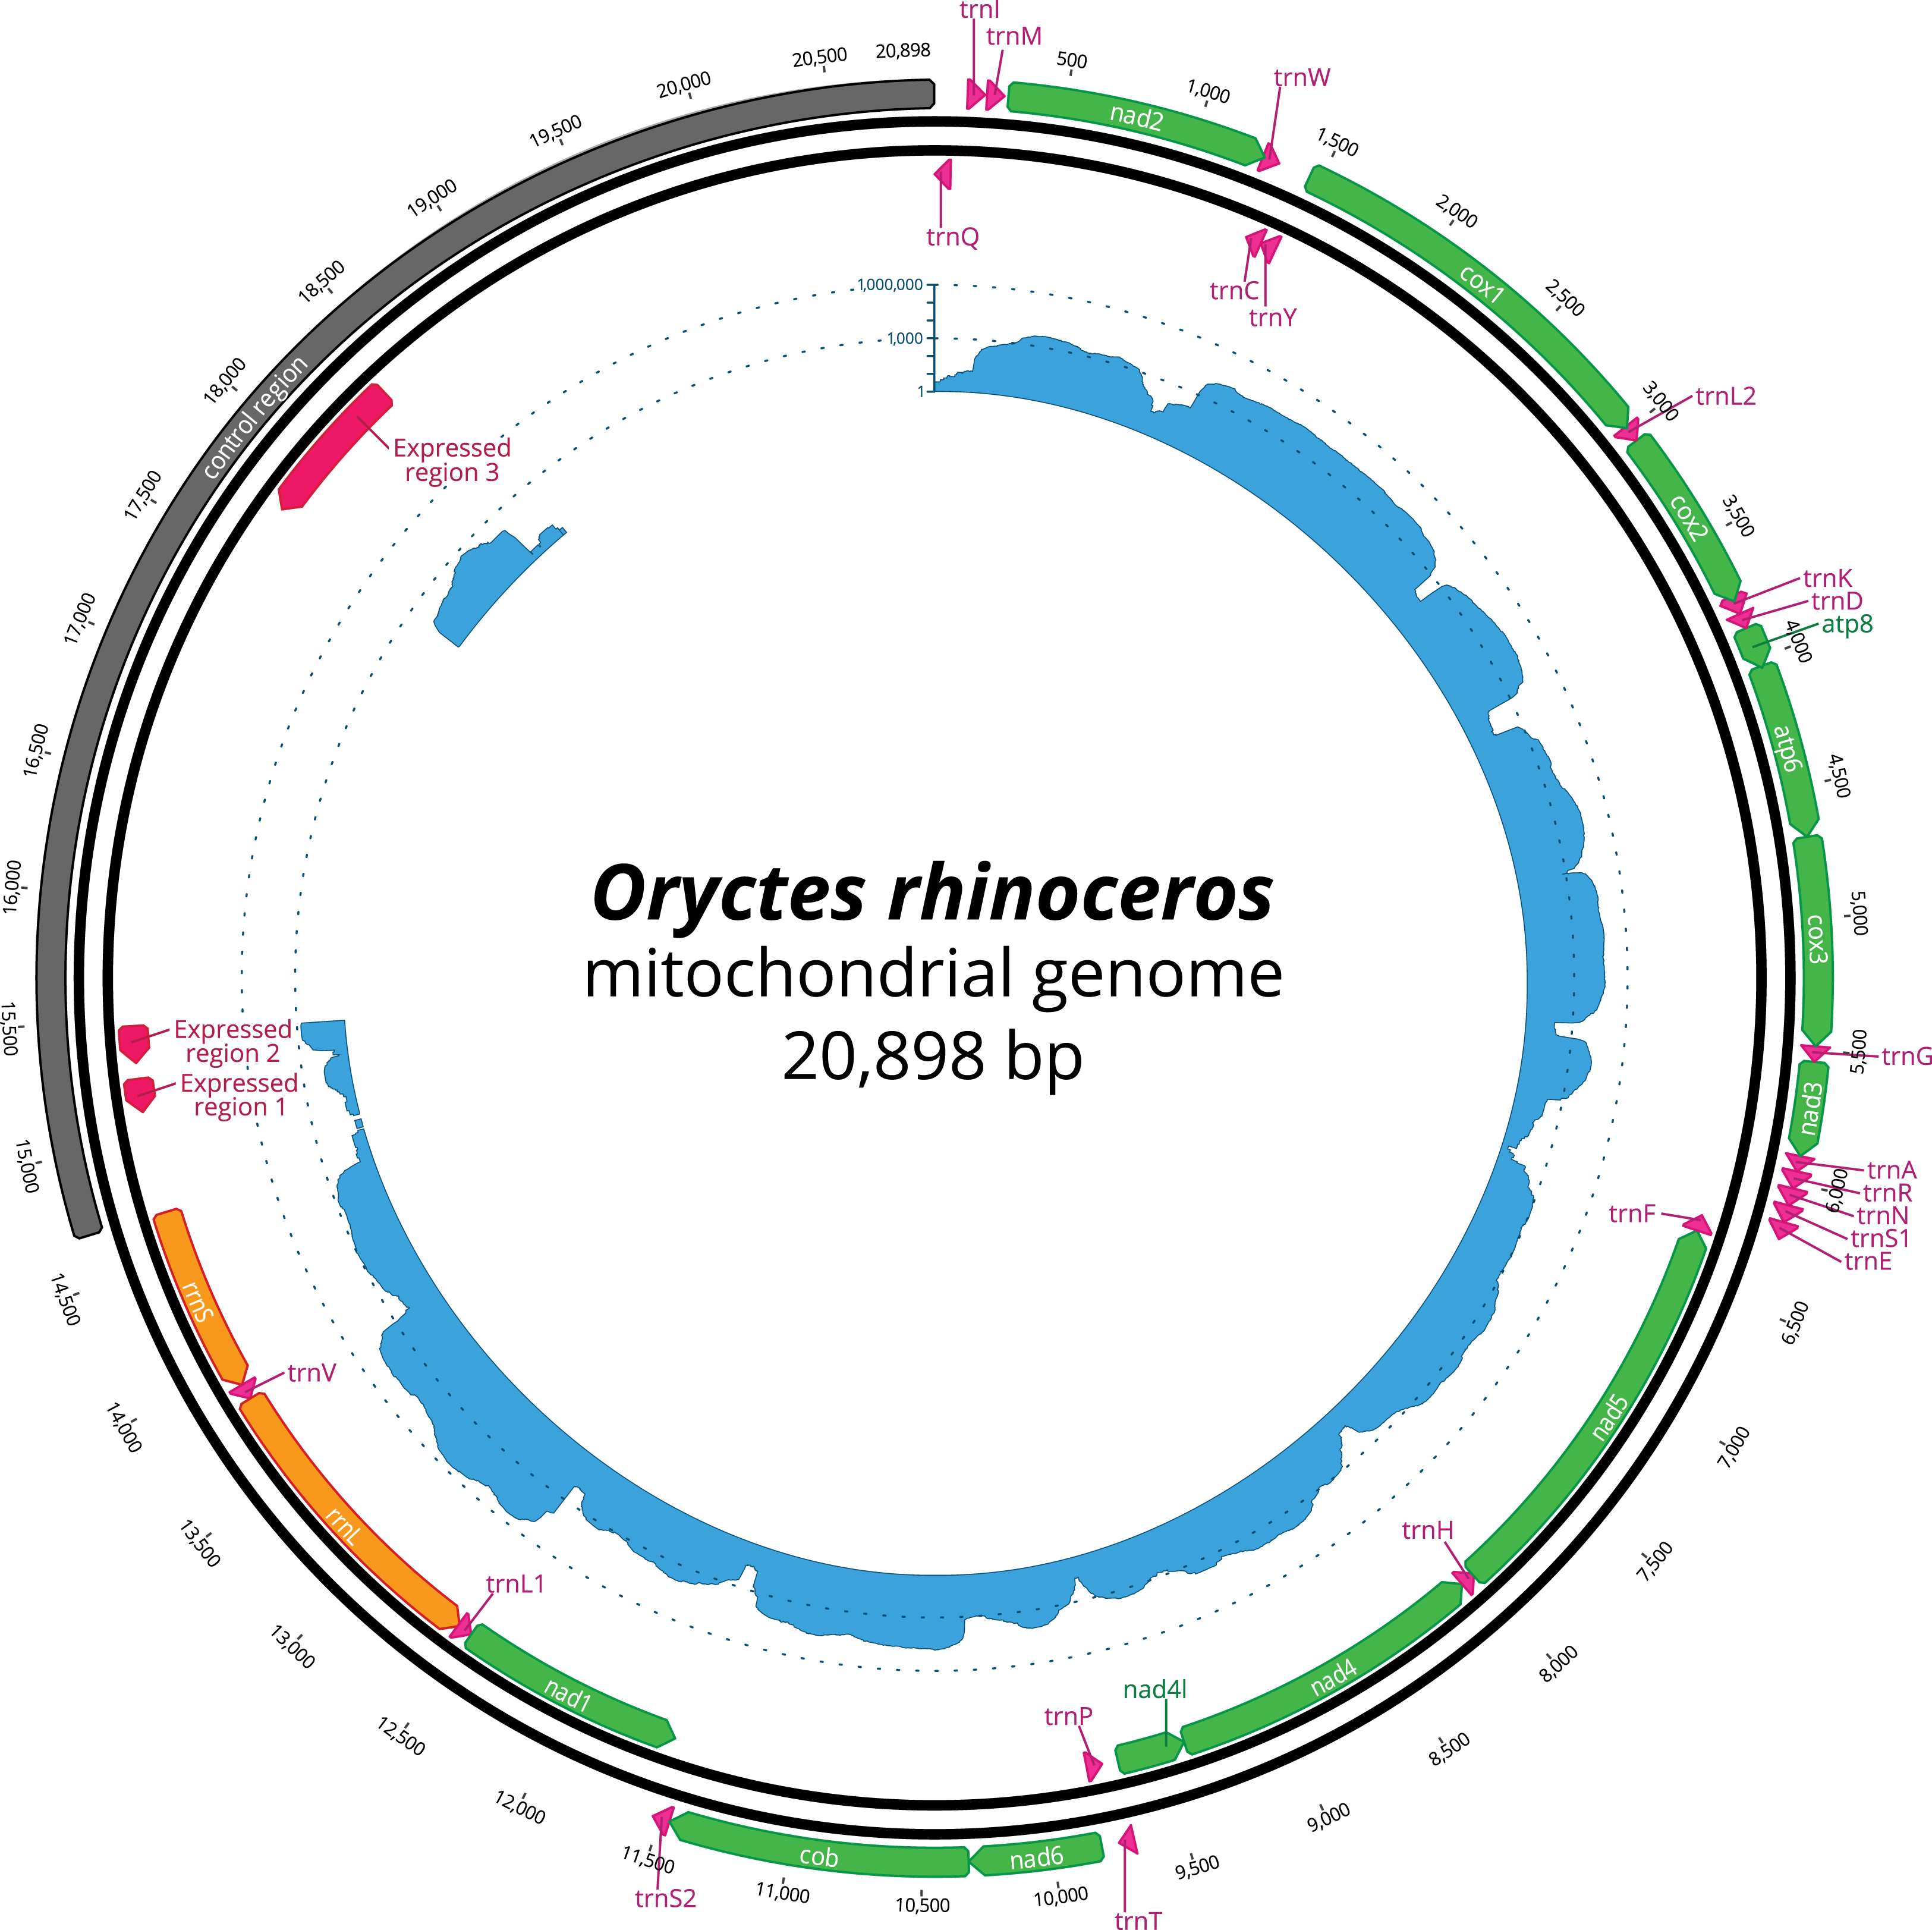
Phylogenetic analysis
The alignment of concatenated PCG sequences of 16 species (degenerated by Degen script (Zwick, 2013)) had 1,449 parsimony-informative sites, 1,818 singleton sites and 7,823 constant sites. ModelFinder identified GTR+F+R3 as the optimal substitution model (AIC: 94067.741, AICc: 94068.053), and given the proportion of invariable sites of 0.469 and the estimated gamma shape alpha of 0.728, we used the GTR+I+G model as the available alternative in MrBayes. This is the most parameter-rich model that has been shown to yield highly robust tree topologies for long alignments (>1,250 bp) in the smaller sample sizes (<17 taxa), irrespective of the model selection results (Abadi et al., 2019).
The topology of the maximum likelihood (IQ-tree) phylogeny was identical to the Bayesian (MrBayes) phylogeny, with O. rhinoceros being grouped with another member of the Dynastinae subfamily (Cyphonistes vallatus) with high confidence (100% SH-aLRT support, 100% ultrafast bootstrap support in ML, posterior probability 100% in BI). Dynastinae and Rutelinae were inferred as sister clades, that together with Cetoniine and Melolonthinae formed a basal split between phytophagus and coprophagus scarab beetles (Scarabaeinae) (Fig. 2).
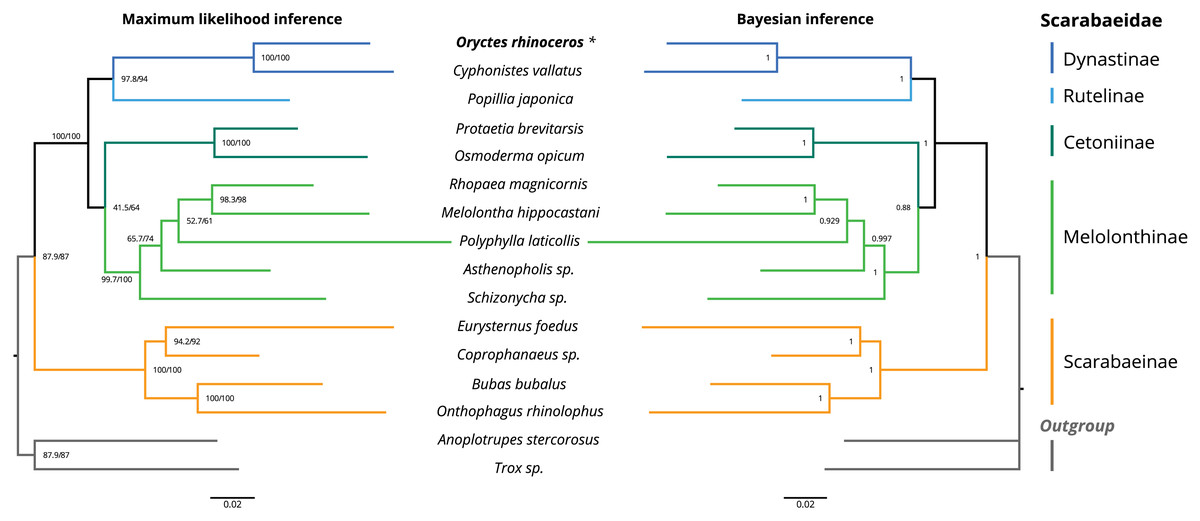
Figure 2: Maximum likelihood (ML) and Bayesian (BI) consensus tree inferred from the PCG dataset using IQ-TREE (ML) and MrBayes (BI).
Branch support values for the ML consensus tree are presented near each node as SH-aLRT support (%)/ultrafast bootstrap support (%), and branch lengths were optimized by maximum likelihood on original alignment. Branch support values for the BI consensus tree are posterior probabilities (0–1).The colored lines correspond to Scarabaeidae subfamilies.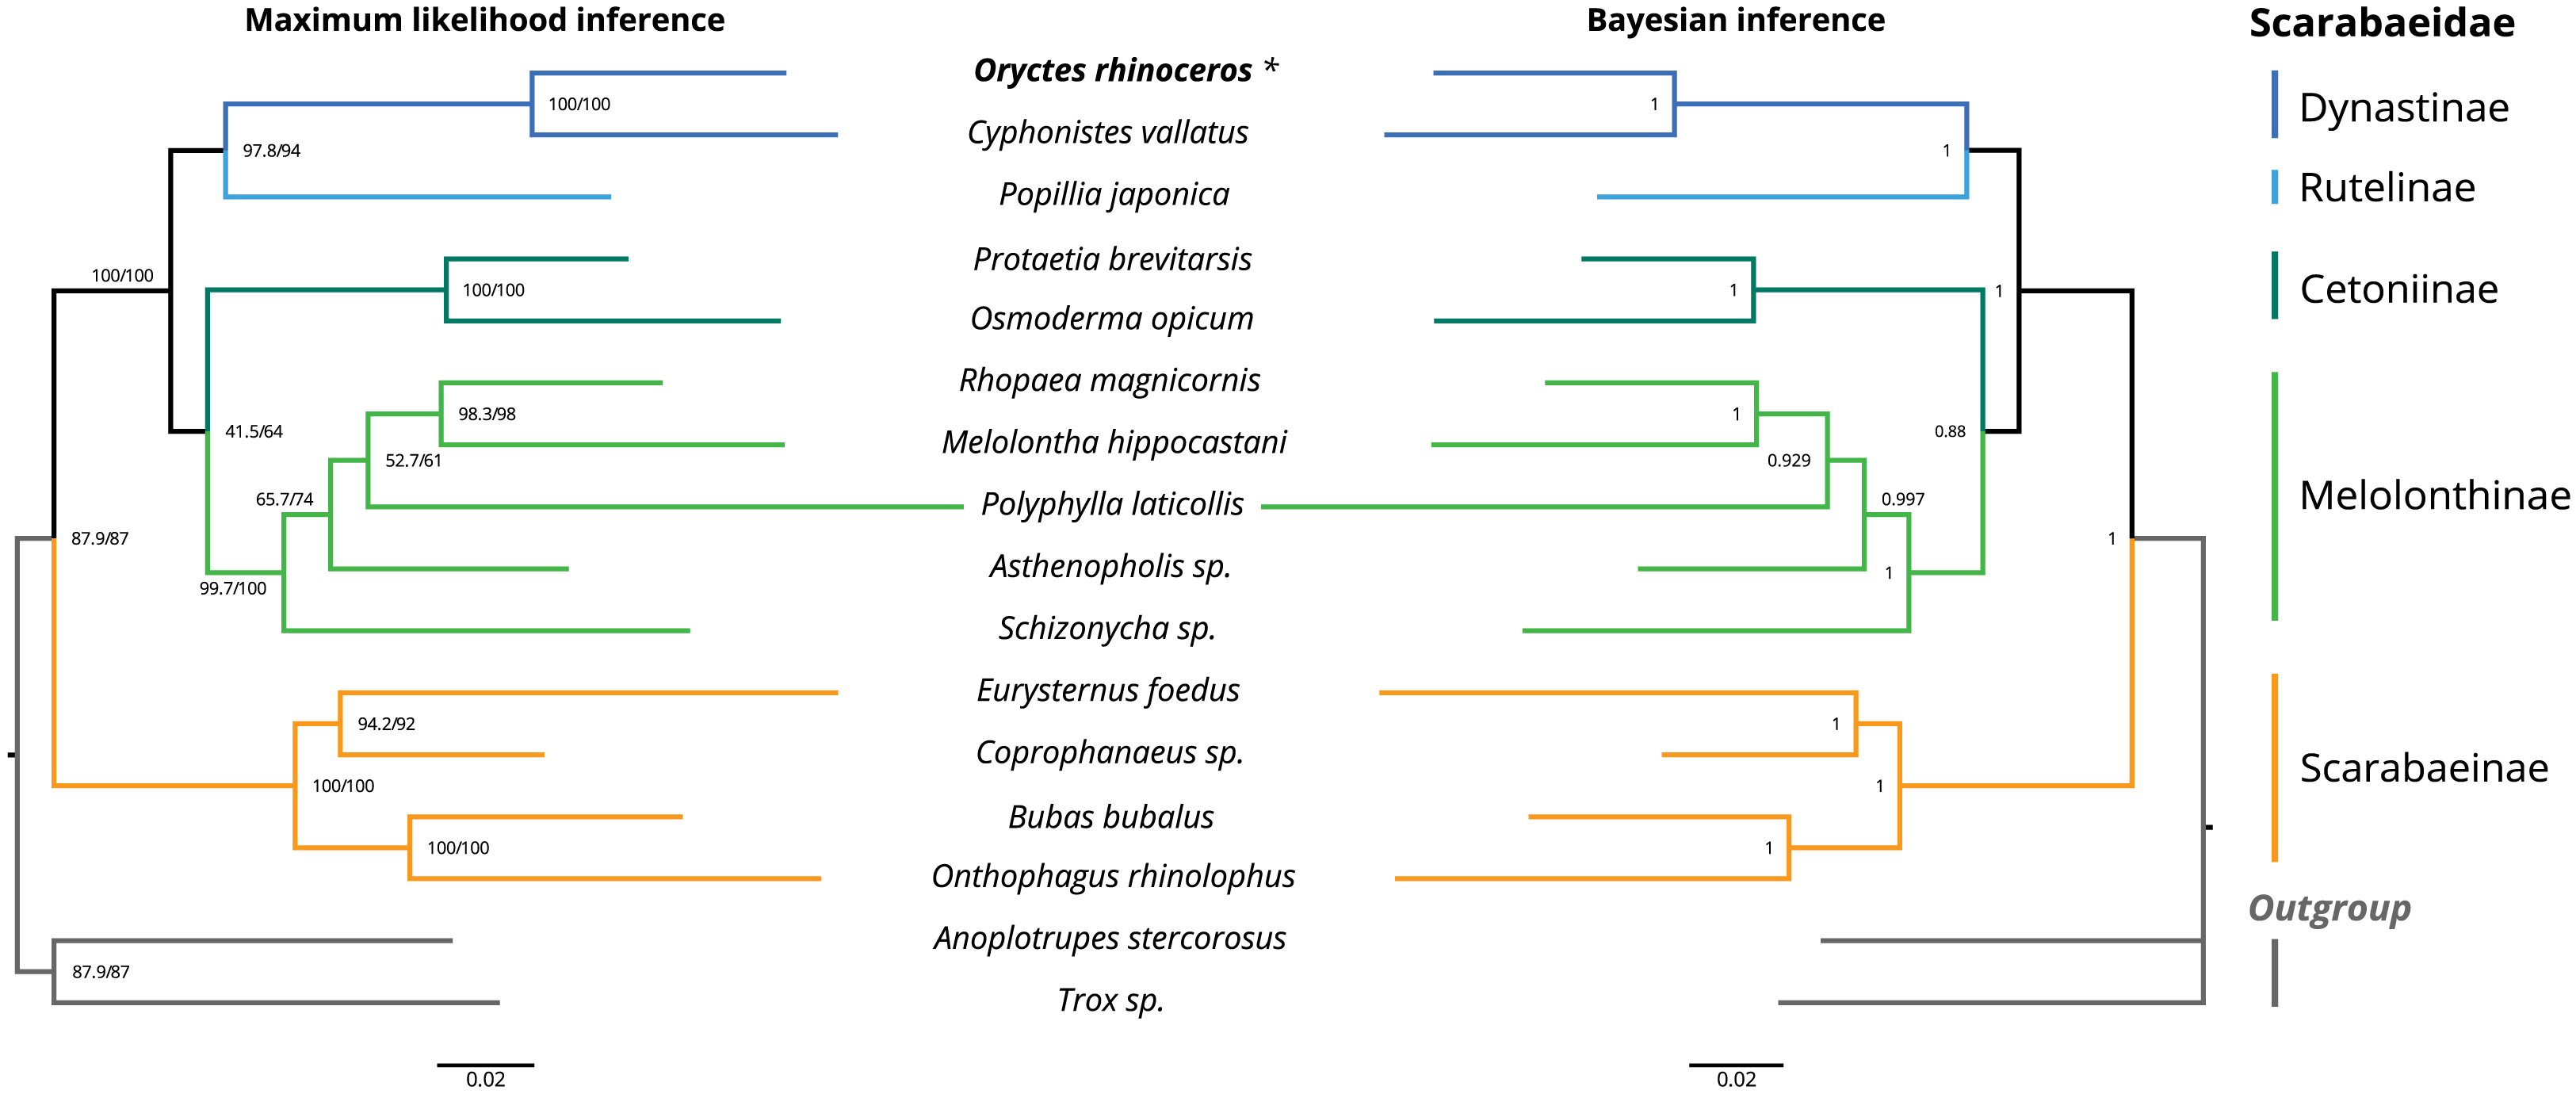
Discussion
The complete circular mitogenome sequence of O. rhinoceros is the only complete mitogenome assembly and annotation for the Dynastinae subfamily, and among only a few complete mitogenomes for the scarab beetles. Its size (20,898 bp) is among the largest reported in Coleoptera, and is similar in size to another scarab beetle, Protaetia brevitarsis (20,319 bp) (Kim et al., 2014). Mitogenome size is driven by the large non-coding control region (CR) that is 6,204 bp-and 5,654 bp-long in O. rhinoceros and P. brevitarsis, respectively. In Popillia mutans, another scarab beetle with a complete mitogenome sequence, the reported length of this region is only 1,497 bp (Song & Zhang, 2018).
Variation in the size and nucleotide composition of the mitochondrial CR is not unusual in insects (Zhang & Hewitt, 1997), however, there could also be technical reasons for some size discrepancies among taxa. Given that we recovered 17,665 bp in our Illumina-only assembly (3,233 bp were missing from the CR), it is possible that many other beetles have larger mitogenomes, but the repetitive content of CR presents a challenge for the most commonly used approaches such as Sanger or short-read NGS sequencing of long-PCR amplicons (Cameron, 2014a). While the CR size can be estimated from the size of long-PCR amplicons, its Sanger sequencing by primer walking is often impossible because it is difficult to design useful primers where GC content is insufficient and homopolymers and tandem repeats are abundant (Cameron et al., 2012; Cameron, 2014a). Long repetitive regions also complicate the assembly process with the short-read NGS sequences (either from the long-PCR amplicons or total DNA extractions) because they are often algorithmically collapsed due to their similarity. For example, three out of five scarab mitogenome assemblies recently generated with the short-read technology are incomplete and lack the control region and adjacent genes (Song & Zhang, 2018). The use of RNA-seq transcriptome data is the least likely to recover the CR, given that this part of the mitogenome generally does not transcribe (or has few short domains of transcription, as we describe in O. rhinoceros).
Our approach included the long-read (ONT) sequencing of the libraries that were prepared with non-PCR-amplified DNA, resulting in a fully closed circular assembly with thousands of reads spanning the entire length of the control region. The superiority of long-read sequencing technologies to capture the long repeated, AT-rich sequences has led to the discovery of remarkable interspecific variation in the length of the intergenic repeat regions in the mitogenomes of seed beetles (Chrysomelidae), that can range between 0.1 and 10.5 kbp (Sayadi et al., 2017). However, for taxa where CR is short (e.g., Lepidoptera (Zhang & Hewitt, 1997)), the long-read technology is not necessary for obtaining the complete mitogenome assemblies.
Unambiguous detection of gene rearrangements and other structural changes is another benefit of the long-read sequencing. In the O. rhinoceros mitogenome, trnQ gene precedes trnI gene, and this rearrangement is supported with thousands of long reads spanning this region. The rearranged position of trnI and trnQ genes is found in almost all species of Hymenoptera (Dowton et al., 2009), and was also reported in flatbugs (Hemiptera, Aradidae) (Song et al., 2016). A number of other rearrangements in tRNA genes have been reported in Lepidoptera and Neuroptera (Cao et al., 2012; Cameron et al., 2009), and because they all occurred between the CR and cox1, it has been hypothesized that this might be a ‘hotspot’ region for such changes (Dowton et al., 2009).
It is also important to note the higher basecalling error rate of ONT when compared to the short-read NGS or Sanger data. Using the aligned short-read sequences (Illumina, San Diego, CA, USA), we identified 141 erroneous additions of 1 or 2 nucleotides, and 67% of those were found in 5-to 9-bp homopolymers. This occurred despite achieving the depth of thousands of reads per each nucleotide position (>10k × median depth), indicating systematic errors during the basecalling process that result in erroneous consensus sequence (Wick, Judd & Holt, 2019), and this cannot be circumvented with high sequencing depth alone. When short-read data are not available for polishing, we suggest to carefully manually inspect the alignment between the draft genome and other high-quality assemblies from the related taxa in order to remove most (if not all) errors in the consensus sequence.
The nucleotide composition of the final (polished) O. rhinoceros mitogenome sequence had high A + T bias (37.7% A, 32.8% T, 19.4% C and 10% G), which is highly concordant with other scarab beetle species (Song & Zhang, 2018), and the long CR matched this genome-wide pattern (34.3% A, 35.8% T, 20.4% C and 9.5% G). All PCGs start with a standard ATN codon, including cox1 that generally seems to be a hot-spot for non-canonical start codon in annotations of invertebrate genomes (Donath et al., 2019). Among 15 other Scarabaeoidea we examined (Table 1), 14 had cox1 in their mitogenome assembly, nine of which had a standard ATN codon while 5 taxa did not have a defined start codon, resulting in a different length of this gene. A more comprehensive analysis (with an extended taxon sampling) is needed to reliably quantify the extent of cox1 start-codon variation in this insect group. We also found evidence of some transcriptional activity within the control region of the O. rhinoceros mitogenome, but to fully characterize this pattern, more transcriptome data (from different tissues, life stages etc.) would need to be tested. Transcriptional activity within the intergenic repeat regions has been detected in mitogenomes of seed beetles (Sayadi et al., 2017), suggesting that ‘mitochondrial dark matter’ could be a source of non-coding RNAs in insects.
We used phylogenetic analysis to assess the quality of the O. rhinoceros mitogenome assembly, expecting to recover its grouping with one other member of the Dynastinae subfamily. This grouping was indeed highly supported in both ML and BI phylogeny (Fig. 2). Identical topology of the ML and BI trees showed Dynastinae and Rutelinae as sister clades, that formed a basal split between phytophagous and coprophagous scarab beetles with Cetoniine and Melolonthinae (Fig. 2). It is worth noting that the intra-family phylogeny of this group is inconsistent depending on the type of the sequence data (mitogenome vs. mito+nuclear genes) used for the inference. While Melolonthinae have been reported as paraphyletic and Cetoniinae as more closely related to Dynastinae and Rutelinae, the sister-group relationship between Dynastinae and Rutelinae was recovered in all previous studies of this group (Ahrens, Schwarzer & Vogler, 2014; Gunter et al., 2016; Song & Zhang, 2018). Further support for the high quality of the O. rhinoceros mitogenome sequence and annotation was our in silico recovery of the correct PCR-RFLP marker set that is diagnostic for the invasive CRB-G haplotype (Marshall et al., 2017).
Conclusions
We report the circularized complete mitochondrial genome assembly and annotation for O. rhinoceros, the major insect pest of coconut and oil palms. The long-read ONT sequencing allowed us to identify structural variation (trnI-trnQ rearrangement) and span the assembly across the entire 6,203 bp-long control region that contains tandem repeats and regions of transcriptional activity. This high-quality genomic resource facilitates future development of a molecular marker toolset to help with the biosecurity and management efforts against this resurgent pest. As the first complete mitogenome for the genus Oryctes and the subfamily Dynastinae, and among a few for the entire scarab beetle family (Scarabaeidae), it will contribute to the resolution of higher-level taxonomy and phylogeny of phytophagous scarab beetles that remain understudied despite containing many agricultural pests.
Supplemental Information
Graphical representation of in silico PCR-RFLP marker analysis.
The amplicon from the partial cox1 gene is delineated with forward and reverse universal cox1 primers (Folmer et al., 1994) and MseI restriction enzyme recognition sites are marked. The diagnostic SNP (Marshall et al., 2017) A>G is marked in orange. This analysis generates in silico fragments 253bp, 138bp, 92bp, 28bp and 13bp-long. The fragments 253, 138 and 92bp are visible on a 2% agarose gel in (Marshall et al., 2017) and are diagnostic for the CRB-G haplotype.