
Valorization of discarded industrial fish processing wastes for the extraction of gelatin to use as biodegradable fish bait matrix using RSM
- Published
- Accepted
- Received
- Academic Editor
- Andre Fajardo
- Subject Areas
- Gels, Biomaterials, Colloids, Materials Science (other), Polymers
- Keywords
- Utilization of fishery industrial wastes, Artificial fish bait, Fish gelatin, Response surface methodology, Hydrogel matrix
- Copyright
- © 2021 Masilan et al.
- Licence
- This is an open access article distributed under the terms of the Creative Commons Attribution License, which permits unrestricted use, distribution, reproduction and adaptation in any medium and for any purpose provided that it is properly attributed. For attribution, the original author(s), title, publication source (PeerJ Materials Science) and either DOI or URL of the article must be cited.
- Cite this article
- 2021. Valorization of discarded industrial fish processing wastes for the extraction of gelatin to use as biodegradable fish bait matrix using RSM. PeerJ Materials Science 3:e14 https://doi.org/10.7717/peerj-matsci.14
Abstract
Extraction of gelatin from fish wastes and the development of artificial fish bait matrix using the extracted gelatin were attempted in the study. Biochemical composition of fish wastes (heads, skins, fins and scales) and the gelatin derived from the wastes of corresponding body parts and physicochemical properties of fish gelatin were analyzed. Considering high yield (19.8–22.4%), good gel strength (1.99–2.3 N), high melting point (27 °C) and simple extraction process, the scale gelatin was selected for the development of artificial fish bait matrix. To optimize the levels of gelling agent, cross linker and solvent for the preparation of bait matrix, RSM was adopted. Gel strength and insolubility ratio were analyzed to know the suitability of the bait. They were found to have the gel strength ranging from 1.3 N to 23.5 N, insolubility ratio from 55–83%, and melting point from 34.3 °C to 41.1 °C. The optimum levels of ingredients for the preparation of ideal bait matrix were standardized as: gelatin-25.5%, sucrose-22.5% and water-52%. The curing temperature and curing duration were optimized based on the optimum gel strength of 20.84 N and insolubility ratio of 74.5% was 5 °C and 25 h respectively. The study revealed that a developed fish bait matrix suitable for fishing can be made from gelatin derived from fish wastes.
Introduction
Industrial fish processing wastes are currently used for the preparation of fish meal or manure or simply discarded. They can be value added by utilizing them for the preparation of artificial fish bait which is the need of the hour. Direct dumping of fish wastes in the vicinity of fish processing factories or in the adjacent sea leads to environmental pollution. Fish wastes contain gelatin which can be used for the preparation of artificial fish bait matrix suitable for hook and line fishing (longlining) owing to its gel forming nature. Globally, fish processing industries generate considerable quantity of fish wastes every day (Bax & Knuckey, 2004). The wastes generated during fish processing include fish heads, fins, skins, bones and scales. The tremendous increase in global fish production as much as 178.8 MMT in 2018, has lead to proportionate increase in global fish processing waste generation. Annually, about 20 MMT of fish wastes which accounts for about 25% of the total global marine fish production are generated (FAO, 2014). India is the third largest fish producer in the world with the overall fish production of 12.59 MMT during 2018 and hence generates enormous amount of fish wastes (FAO, 2019). About 70% of the total marine fish catch of India is processed and exported and the pre-processed wastes alone accounts for 20–80% depending upon type of fish and processing methods (Govindharaj, Roopavath & Rath, 2019). Among various food processing industries in India, fish processing industry is responsible for the generation of relatively more protein rich wastes. At present, there are about 613 fish processing plants in the country with the total daily processing capacity of 33,653 MT (MPEDA, 2020) and as a consequence, India alone has been reported to generate about 3,02,750 MT of industrial fish processing wastes annually (MPEDA, 2015). Apart from the industrial fish processing wastes, the wastes generated from the retail market outlets located near the fishing harbours are usually discarded in the vicinity of fishing harbour itself due to the want of proper disposal facility. Their direct discharge into the coastal waters adjacent to fishing harbour leads to coastal pollution (Govindharaj, Roopavath & Rath, 2019). Further, it also leads to loss of valuable nutrients such as proteins and lipids (Bozzano, 2002; Ghaly et al., 2013; Muralidharan et al., 2013; Rebah & Miled, 2013; Renuka et al., 2016). The disposal of seafood industrial wastes under strict regulations to prevent environmental pollution adds to the operational cost of fish processing industries (He, Franco & Zhang, 2012). Therefore, valorization of fish wastes into value added product like gelatin based artificial fish bait would pave way for the proper utilization of fish wastes besides reducing the risk of coastal pollution. Apart from this, forage fishes which have human food consumption value are also unnecessarily wasted in long lining as baits. Many literatures dealing with food waste utilization have given focus on the conversion of fish processing wastes into either animal feed or fish meal (Wasswa, Tang & Gu, 2007). However, limited information is available on the utilization of fish processing wastes for the development of fish bait. In recent times, attentions have been paid to develop biodegradable artificial fish baits from fish processing wastes (Siikavuopio et al., 2017; Karunanithi et al., 2018a, 2018b). Production of fish gelatin is considered as one of the ways of utilizing processing discards from the seafood industry (Gomez-Guillen et al., 2002; Muyonga, Cole & Duodu, 2004a, 2004b; Badii & Howell, 2006; Muralidharan et al., 2013; Jeyashakila et al., 2012a, 2012b; Nagarajan et al., 2012a, 2012b, 2014; Elavarasan et al., 2016; Govindaswamy et al., 2018; Renuka et al., 2019). Gelatin has also been used for artificial fish bait development (Masilan & Neethiselvan, 2018). Attempts have been made throughout the world for developing artificial fish baits using different kinds of biopolymers like gelatin, chitosan, carrageenan and other binding materials (Chanes-Miranda & Viana, 2000; Dellinger et al., 2016; Løkkeborg et al., 2014; Karunanithi et al., 2018a; Ollis et al., 2004; Siikavuopio et al., 2017). UNO has stressed the need for developing artificial fish baits with the view to conserve forage fishes which are exploited to the tune of 18 MMT globally every year (UNO, 2014) to use in long line fishing as baits, of which around 40% are found to be vital species with good food value and ideal for direct human consumption (Dellinger et al., 2016). Development of artificial fish baits suitable for long line fishing is the current demand of the fishing Industry to replace the use of forage fishes in long lines as baits, as many of these fishes have good food value for direct human consumption besides halving key role in the marine food chain. In India, food fishes such as mackerel, herring, sardines, anchovies and squids are mainly used as baits in long lining (Masilan & Neethiselvan, 2018). The present study aims at developing a fish gelatin based artificial fish bait matrix suitable for use in long line bait.
Materials and method
Chemicals
All reagents are used sodium hydroxide pellets—97.00%, sodium chloride, N-Butyl alcohol, hydro chloric acid, acetic acid glacial—99.8%, sulphuric acid—98.00%, methyl red-purity not informed by the supplier, petroleum ether, chloroform (Alc stabilised)—99.8%, Ethylene diamine tetra acetic acid (E.D.T.A) disodium salt dihydrate—99.5%, sucrose, glycerol—99.5% were analytical grade, obtained from Himedia Laboratories Pvt Ltd., Mumbai, India. All solutions were prepared with ultrapure water from an Elix 5 Milli-Q water purification system.
Collection and profiling of fish wastes
The processing wastes were collected from the fishes belonging to the genera Lethrinus and Lutjanus whose mean length ranged from 37 ± 2.5 cm to 43 ± 2 cm respectively. The respective mean weights were 5.0 ± 0.5 kg and 7.5 ± 0.3 kg. Heads, skins, fins and scales were used as raw materials for the extraction of gelatin. They were procured from a seafood processing plant and fishing harbour of Thoothukudi located in Southeast coast of India (8°47′ 41.91″N and 78°09′ 40.99″E). The fish wastes were segregated and weighed item wise and their percentage contribution to the raw fish on weight basis were recorded. Samples were drawn for the analysis of proximate composition of each wastes. The segregated wastes were then mixed with the crushed ice in the ratio of 1:1 and brought to the laboratory using insulated containers. They were cut into small pieces, cleaned in potable water, packed in polyethylene covers and stored in a deep freezer at −22 °C ± 2 °C for the extraction of gelatin.
Extraction of gelatin from discarded fishery wastes
Extraction of gelatin from fish skins, heads and fins
Gelatin extraction was performed as per the method of GMIA (2019) with some alterations. Fish wastes such as head, skin and fins were cleaned with water and treated twice with 0.2% NaOH at 1:5 for 12 h to remove the non-collagenous protein. Further, they were washed with water and treated with 10% N-Butyl alcohol at 1:5 (w/v) for 5 h to removing fat. Subsequently, they were washed with water and treated with 0.2% acetic acid at 1:5 for 30 min; and cleaned thoroughly with water for decalcification. Regarding the extraction of gelatin from head and fins, 10% solution of 0.5M EDTA was used at 1:10 (w/v) ratio for removing minerals. Finally, the extraction was carried out with distilled water at 1:1 (w/v) at 55 °C for 18 h. Thereafter, the extracts were filtered through cheese cloth. The gelatin solution thus obtained was dried in oven at 70 °C for 15 h.
Extraction of gelatin from fish scales
Fish scale gelatin was extracted as per the method of Razi, Islam & Parimalam (2019) with slight modifications. The collected fish scales were cleaned with water, and dehydrated in daylight. Then they were treated with 10% solution of 0.5M EDTA (1:10 w/v) for 24 h and added with water at 1:4 (w/v). The treated scales were boiled in a pressure cooker at a temperature of 100 °C and 15 psi pressure until they turned into a gelatinous mass. The maximum boiling duration required to get gelatinous mass was 50 min. The solution was then filtered through cheese cloth and the gelatin solution thus obtained was oven dried at 70 °C for 15 h and used for further analysis.
Fish gelatin yield
Gelatin yield was calculated by the following formula (Sae-Leaw & Benjakul, 2015).
Biochemical composition of fish wastes and extracted fish gelatin
The biochemical composition of moisture, protein, fat, and ash were analyzed using the standard method as elucidated in AOAC (2000).
Physicochemical and gelling properties
pH
The pH was analyzed using a pH meter (Eutech, pH Tutor, Japan) at 25 °C as per the method prescribed by Cheow et al. (2007).
Gelling point of extracted gelatin
The gelling point was examined by the procedure of Muyonga, Cole & Duodu (2004a). Fish gelatin solution (10 g/100 ml) was taken in the Borosil-R test tubes (12 × 75 mm) and placed in hot water at 40 °C. The bath was chilled gradually at the rate of 0.2 °C/min. A thermometer was interpolated into the solution and lifted out at 30 s intervals. The temperature at which the gelatin solution no longer dripped from the tip of the thermometer was noted as the gelling point.
Melting point of extracted fish gelatin and bait matrix
The melting point of the fish gelatin and bait matrix were determined as per the method of Jeyashakila et al. (2012a) with some alterations. Gelatin solution (6.67 g/100 ml) was taken in a beaker and heated at 60 °C with continuous stirring till even solubilization of gelatin was attained. The gelatin solution was then poured into test tubes (12 × 75 mm) and instantly cured at 5 °C for 16 h in refrigerator. Indicator was prepared by mixing 75 ml of chloroform with 25 ml of methyl red (0.2%). Five drops of indicator were poured on to the top of the gel and the tubes were placed in a water bath at 10 °C and heated at the rate of 0.2 °C/min till the gels get melted. The temperature at which the indicator drops began to move freely down the gel was taken as the melting point. Regarding the determination of melting point of bait matrix, the prepared gel matrix solutions were poured in to the test tubes and allowed to get cured as per the different combinations of curing temperature and curing duration based on RSM design.
Gel strength of extracted fish gelatin and bait matrix
Gel strength of gelatin gels and bait matrixes were examined by the method of Sae-Leaw & Benjakul (2015), with certain modifications. Gelatin powders derived from head, skins, scales and fins were dissolved in distilled water taken in beakers to get 6.67% (w/v) solution and were heated up to 70 °C with continuous stirring until the gelatin got solubilised completely. They were then cured in refrigerator at 5 °C for 16 h to build-up as gel. The resultant gels had the dimension of 30 mm diameter and 25 mm height. Gel strength was analyzed using Universal Testing Machine (Texture Analyzer, Lloyd Instruments, UK) fitted with a flat-face cylindrical Teflon-coated plunger of 12.7 mm dia. The Texture Analyzer had a load cell of 5 kN with a cross-head speed of 0.5 mm/sec. The force (N) at which the plunger penetrated into the gelatin gel/ bait matrix upto 5 mm was taken as gel strength. Accordingly, gel strength of bait matrixes developed as per the RSM design was analyzed.
Estimation of bait matrix insolubility ratio in sea water
The insolubility of bait matrixes were analyzed as described by Mohajer, Rezaei & Hosseini (2017) with slight modification. Sea water was taken as solvent. Two pieces of each of the gel matrixes were cut with the dimension of 10 × 10 × 30 mm (H × B × L) and each of which weighed 10.5 ± 0.2 g. Among them, one piece of gel matrix was dried in a hot air oven at 105 °C for 24 h and then weighed (Wi) while the second piece was placed in a 250 ml glass beaker with 100 ml of sea water. The samples was gently shaken with the help of a refrigerated orbital shaker (Technico, Chennai) at 140 ± 20 rpm at 25 °C for 12 h and were filtered through Whatman No.1 filter paper. Finally, the insoluble gel matrix residues were collected and dehydrated in a hot air oven at 105 °C for 24 h and weighed (Wf). The insolubility of gel matrixes was calculated based on the following formula:
Where, Wi= Initial dry weight of the gel matrix (g), Wf = Final dry weight of the undissolved residue (g)
Standardization of levels of fish gelatin and cross linkers for the preparation of gel based bait matrix by RSM
To standardize the level of ingredients such as water (30–60%), sucrose (7–35%) and fish gelatin (4–30%) for bait matrix, 17 samples were prepared based on Box-Behnken model of Response Surface Methodology of Design expert 12.0 software (V.12.0; State-Ease® software, Minneapolis, MN, USA). Gel strength and insolubility ratio were assessed as variables. The regression coefficients of quadratic equations were analyzed using ANOVA of Design expert 12.0 software. The validity of the model was confirmed for the standardization of level of ingredients by conducting triplicate trials based on optimum levels arrived through RSM.
Casting of experimental fish bait matrixes
Polypropylene beakers with dimension of 40 mm height and 35 mm dia were used as castings. To prepare the bait matrix, distilled water was taken in a 50 ml glass beaker and was heated with continuous stirring using a hot plate magnetic stirrer (REMI, India) to 80 °C. On reaching 80 °C, sucrose was added followed by fish gelatin. The mixture was stirred continuously until a homogenous hydrogel was formed. After even solubilisation of gelatin, the hot hydrogel solution was poured into the casting units and kept in a refrigerator for 16 h at 6 ± 2 °C for gelation and further testing.
Optimization of processing conditions of fish bait matrix by RSM
To optimize the processing conditions for getting fish bait matrix, RSM was used. The Central Composite Design (CCD) was used with two variables such as curing temperature (4–60 °C) and curing duration (3–48 h). The three dependent variables chosen were gel strength, insolubility ratio and melting point. The curing temperature of 32 °C and the curing duration of 25.5 h were chosen as center points. The gel strength, insolubility ratio and melting point were taken as output variables. The regression coefficients of quadratic equations were analyzed using ANOVA from Design expert 12.0 software. The validity of the model was confirmed by conducting triplicate trials of experiments under the optimum conditions.
Statistical analysis
The quantitative and analytical values of the experiments were denoted as mean ± SD. Triplicate samples were used for each experiment. One way ANOVA was accomplished for each experiment with Duncan’s post hoc test and P < 0.05 were treated as statistically significant (SPSS, Version 20; SPSS Inc., Chicago, IL, USA).
Vertebrate animal approval
The Tamil Nadu Fisheries University, Nagapattinam granted ethical approval to carry out the study within its facilities (U-18-TN-03-002-D-F-006).
Result and discussion
Waste generation profile during the fish processing wastes
The fishery was constituted by six species under the genus Lethrinus viz. L. lentjan, L. nebulosus, L. ornatus, L. harak, L. microdon and L. rubrioperculatus and two species under the genus viz. Lutjanus viz. L. bohar and L. erythropterus. The generation of processing wastes was higher for Lutjanus spp. (47.5%) compared to Lethrinus spp. (29.5%), due to higher contribution by head, fins and scales in general and head waste in particular. However, the contribution by visceral waste was slightly higher in Lethrinus spp. than Lutjanus spp. (Fig. 1). The quantity of wastes generated from different parts during fish processing was found to vary significantly between the species (P < 0.05). Study on profiling of wastes during fish processing has been reported to vary from 25% to 75% (Pigott, 1986; Kim & Mendis, 2006; Elavarasan et al., 2016). In the present study, the waste generated from Lethrinus spp. accounted for 29.5% which comprised of head (17%), fins (4%), scales (3%) and viscera (5.5%). However, (Muralidharan et al., 2013) has reported that the deboning process of trash fish, leather jacket (Odonus niger) yielded just 47% edible meat and among the total 53% of fish waste, the contribution by skin-25%, bone-13%, scale-9% and fin-6%. Skin has been the main component of waste in leather jacket and however in the present study, contribution by skin of Lethrinus spp. and Lutjanus spp. to waste generation was found to be insignificant. Likewise, the wastes generated from Lutjanus spp. also comprised of head, fins, scales and viscera; which accounted for 26%, 8%, 9% and 4.5% respectively on weight basis (Fig. 1). In yet another study by Renuka et al. (2016) with tiger tooth croaker, head waste contributed as much as 32% while the viscera constituted 46%. In the present study, head accounted for 17.5% and 26% of the total fish weight in the case of Lethrinus spp. and Lutjanus spp., respectively. The lesser contribution by head to the waste compared to the values reported by Renuka et al. (2016) revealed the fact that tiger tooth croaker has bigger head compared to Lethrinus spp. and Lutjanus spp. Earlier reports indicated that on an average fish head waste accounts for 26% of total weight (Elavarasan et al., 2016).
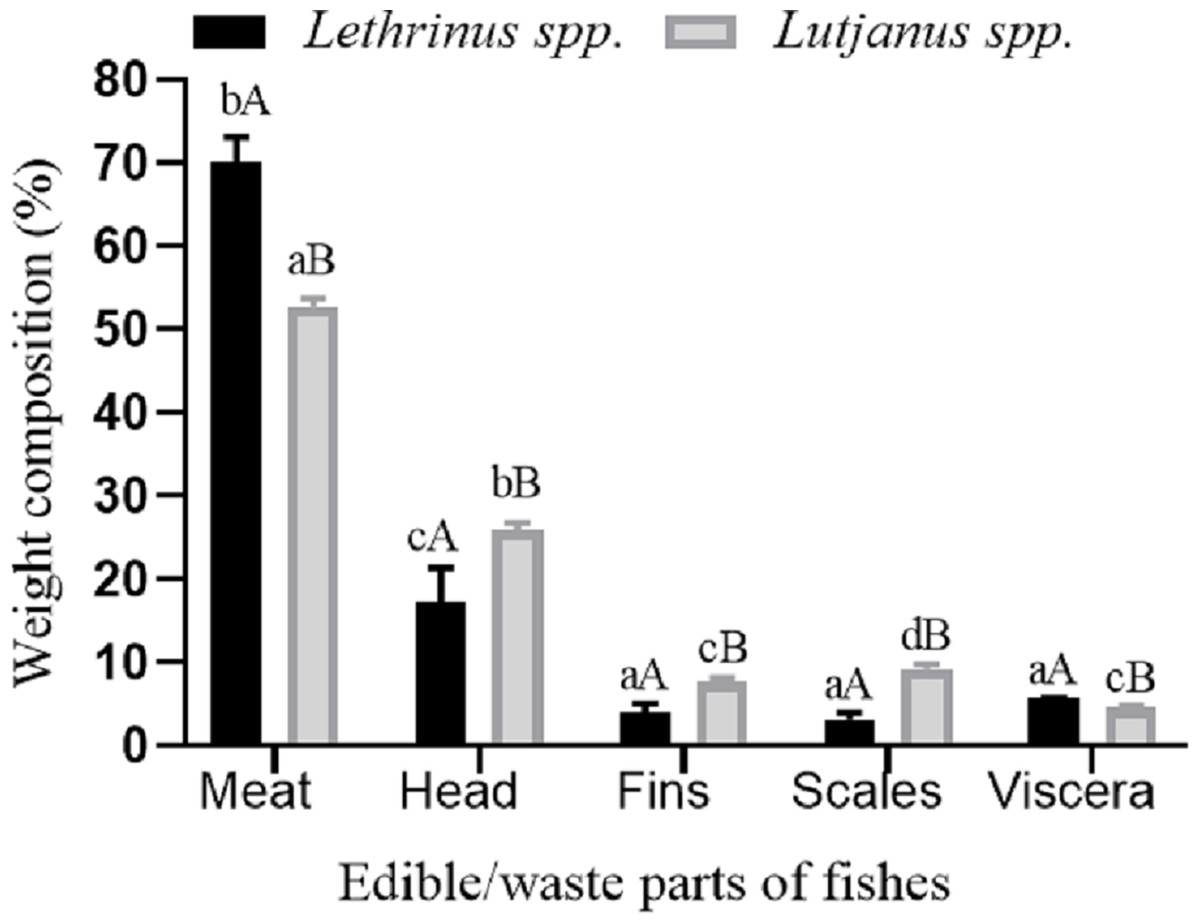
Figure 1: Waste generation profile.
Waste generation profile during the processing of Lethrinus spp. and Lutjanus spp.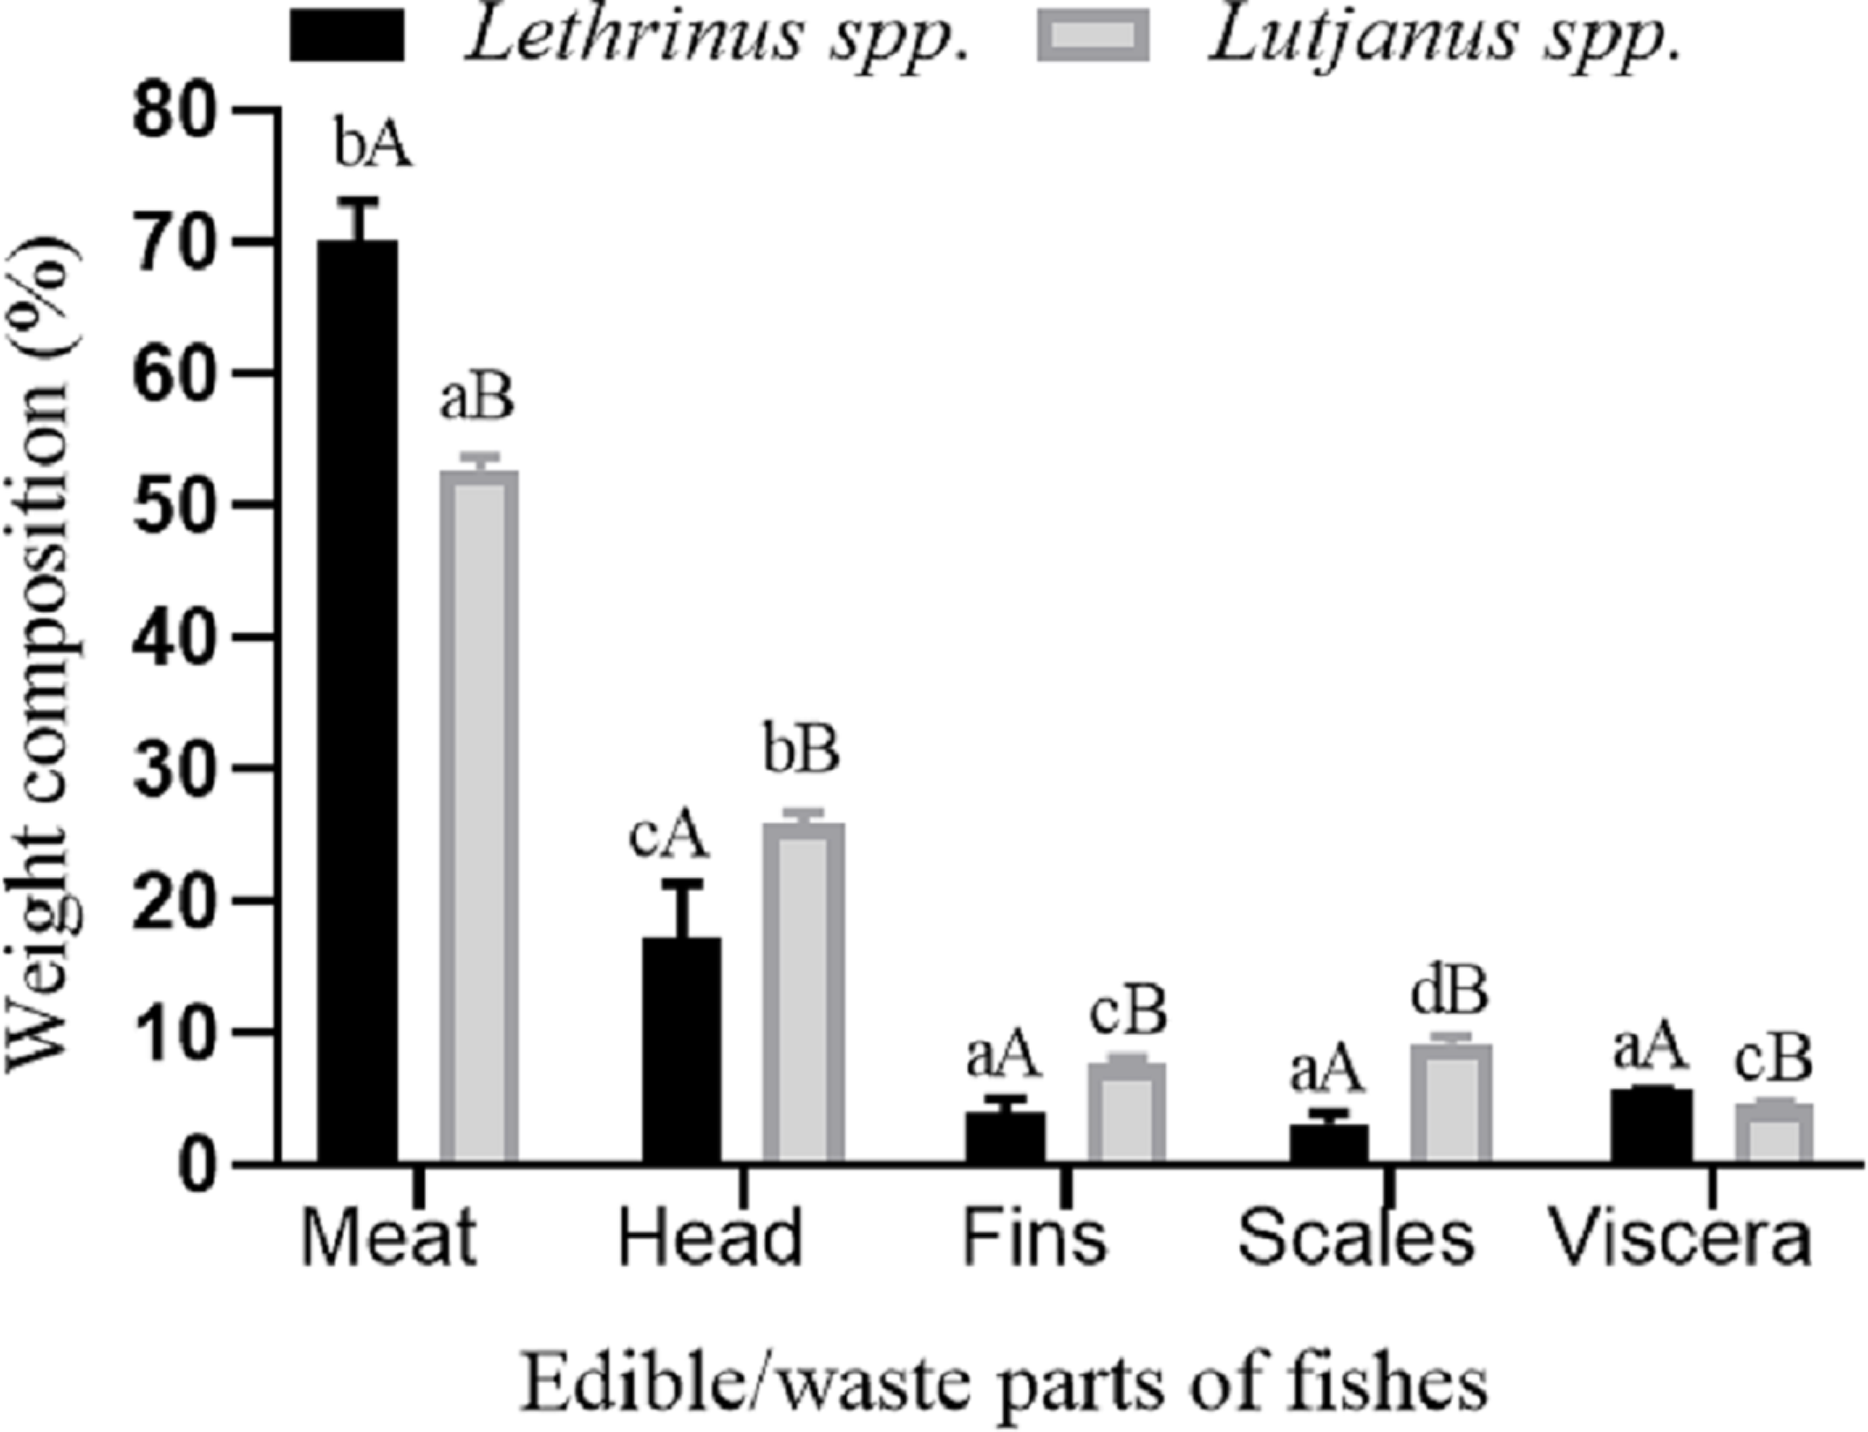
Biochemical composition of fish wastes
The analysis of proximate composition of wastes derived from different body parts of Lethrinus spp. and Lutjanus spp. revealed the highest moisture content in skin (59.63%) followed by head (54.26%), fins (48.09%) and scales (36.17%) (Table 1). Significant variations could be observed in the moisture content with respect to different body parts. Jeyashakila et al. (2012a) have also reported variations in the biochemical composition of fish wastes derived from skin, bone, fin and scales. In general, the moisture content was less in scales (28.81–36.17%) due to higher contribution of ash. The moisture content of head was comparable to that of skin in the present study. However, high level of moisture content up to 75% has been recorded in the head waste of tiger tooth croaker (Elavarasan et al., 2016; Renuka et al., 2016). Regarding protein, skin wastes contained highest level of protein both in Lethrinus spp. (26.11 ± 0.562) and Lutjanus spp. (25.2 ± 0.55%). This may be attributed to the presence of high amount of stroma protein (Wasswa, Tang & Gu, 2007). Low levels were recorded in head in the case of Lethrinus spp. (16.81%) and fins in the case of Lutjanus spp. (16.48%). Head and scales of Lethrinus spp did not showed significant difference (P < 0.05). Regarding fat content, highest level (7.72–8.66%) was reported in the head waste irrespective of the fishes studied. The ash content was found to be significantly higher in scales (33.64–35.68%) than that of wastes derived from other parts (P > 0.05) due to higher mineral content.
| Biochemical compositions (%) | Lethrinus spp. | Lutjanus spp. | ||||||
|---|---|---|---|---|---|---|---|---|
| Head | Scales | Skins | Fins | Head | Scales | Skins | Fins | |
| Moisture | 48.97 ± 0.84aA | 28.81 ± 0.61bA | 49.03 ± 0.49aA | 46.10 ± 0.56cA | 54.26 ± 0.77aB | 36.17 ± 0.31bB | 59.63 ± 0.97cB | 48.09 ± 0.83dB |
| Protein | 16.81 ± 0.66aA | 16.96 ± 0.55aA | 26.11 ± 0.56cA | 24.37 ± 0.68bA | 18.19 ± 0.49bB | 21.72 ± 0.71cB | 25.2 ± 0.55dA | 16.48 ± 0.61aB |
| Fat | 8.66 ± 0.67aA | 1.76 ± 0.522bA | 6.74 ± 0.61cA | 4.01 ± 0.87dA | 7.72 ± 0.84bA | 2.42 ± 0.82aA | 2.79 ± 0.90aB | 4.52 ± 0.50cA |
| Ash | 18.17 ± 0.92aA | 35.68 ± 0.79bA | 2.09 ± 0.44cA | 20.84 ± 0.99dA | 12.89 ± 0.49aB | 33.64 ± 0.54bB | 5.73 ± 0.43cB | 24.33 ± 0.74dB |
Notes:
All values are mean standard deviation ± of triplicate analysis.
Small superscripts in the same row specify the significant difference (P < 0.05) between the sample of individual species. Capital superscripts in the row specify the significant difference (P < 0.05) between within two species of same samples.
Biochemical composition of extracted fish gelatins
The moisture content of the gelatins derived from different parts of the fishes studied ranged from 8.55% to 9.97% and did not show any significant variation with respect to the parts from which they were extracted. Higher level of moisture content (12.1%) observed in horse mackerel skin gelatin has been reported by Badii & Howell (2006). With regard to protein content of gelatin, relatively higher protein content was observed in the gelatin derived from the skin and scales (Table 2). Higher protein levels of the gelatin derived from fish skin (78.1–94.6%) have been reported by many researchers (Binsi et al., 2009; Jongjareonrak et al., 2006; Jeyashakila et al., 2012a; Renuka et al., 2019). Regarding fat content, it was notable in head gelatin (3.9%) while gelatin derived from other parts had the fat content of less than 2%. Such higher level of fat (3.2%) has also been reported by Elavarasan et al. (2016) in gelatin derived from the head waste of Tiger tooth croaker. In the case of ash content of gelatin derived from different body parts only the gelatin derived from the skin had very low ash content ranging from 1.7% to 1.8%. In general, the gelatin derived from head, fins and scales showed higher as content as reported in earlier studies by (Ninan, Jose & Abubacker, 2011; Jeyashakila et al., 2012a).
| Biochemical compositions (%) | Lethrinus spp. | Lutjanus spp. | ||||||
|---|---|---|---|---|---|---|---|---|
| Head | Scales | Skins | Fins | Head | Scales | Skins | Fins | |
| Moisture | 8.98 ± 0.84aA | 8.79 ± 0.99aA | 8.64 ± 0.73aA | 9.46 ± 0.52aA | 9.73 ± 0.41aA | 8.55 ± 0.39bA | 9.97 ± 0.32aB | 9.73 ± 0.52aA |
| Protein | 78.82 ± 0.89aA | 83.98 ± 0.7bA | 86.65 ± 0.48cA | 80.71 ± 0.84dA | 82.47 ± 0.85aB | 85.39 ± 0.62bB | 84.80 ± 0.47bB | 81.84 ± 0.56aA |
| Fat | 3.9 ± 0.48cA | 0.98 ± 0.09abA | 1.55 ± 0.43bA | 0.74 ± 0.29aA | 2.33 ± 0.15abB | 0.66 ± 0.43cA | 1.93 ± 0.32aA | 1.12 ± 0.82bB |
| Ash | 6.97 ± 0.10bA | 5.20 ± 0.13aA | 1.84 ± 0.56cA | 4.92 ± 0.15aA | 4.9 ± 0.84aB | 5.24 ± 0.16aA | 1.76 ± 0.87bA | 4.12 ± 0.41aB |
Notes:
All values are mean standard deviation ± of triplicate analysis.
Small superscripts in the same row specify the significant difference (P < 0.05) between the sample of individual species. Capital superscripts in the row specify the significant difference (P < 0.05) between within two species of same samples.
Physicochemical properties and yield of gelatin from fish wastes
Yield and physicochemical parameters such as pH, melting point, gelling temperature and gel strength play vital role as they decide the feasibility to utilize gelatin for making fish bait matrix suitable to use in longline bait at sea.
pH
PH of gelatin showed significant variations with respect to species and parts of fish from which gelatin was extracted (P < 0.05) and all the values fall in alkaline range. Gelatin derived from head waste was found to be relatively more alkaline with the pH ranging from 5.86 to 5.90 (Table 3) and similar alkaline pH values of 6.99 has been observed by Elavarasan et al. (2016) in the gelatin derived from head waste of tiger tooth croaker and has been attributed to the different pretreatment processes such as alkaline and acid treatments employed during the extraction (Kasankala et al., 2007).
| Parameters | Lethrinus spp. | Lutjanus spp. | ||||||
|---|---|---|---|---|---|---|---|---|
| Head | Scales | Skins | Fins | Head | Scales | Skins | Fins | |
| pH | 5.9 ± 1.01bA | 4.58 ± 0.25aA | 4.64 ± 0.06aA | 4.46 ± 0.06aA | 5.86 ± 0.2bA | 5.3 ± 0.2cB | 4.78 ± 0.12aA | 4.71 ± 0.07aB |
| Melting point (°C) | 20.78 ± 1.21aA | 27.3 ± 0.8bA | 22.82 ± 2.71abA | 23.54 ± 3.7abA | 21.96 ± 1.63aA | 27.06 ± 0.55bA | 24.1 ± 1.32abA | 22.13 ± 2.89aA |
| Gelling temperature (°C) | 16.16 ± 0.28aA | 20.8 ± 1.3bA | 19.5 ± 1.53bA | 15.03 ± 0.8aA | 16.16 ± 0.3aA | 16.86 ± 0.7aB | 17.6 ± 1.41aA | 16.03 ± 0.2aA |
| Bloom strength (N) | 1.21 ± 0.07aA | 1.98 ± 0.07bA | 1.52 ± 0.08cA | 1.08 ± 0.87aA | 1.32 ± 0.04aA | 2.32 ± 0.04bB | 1.732 ± 0.03cB | 1.04 ± 0.02dA |
| Yield of gelatin (%) | 11.15 ± 1.70aA | 22.4 ± 1.6cA | 16.02 ± 2.3bA | 13.02 ± 0.75abA | 11.12 ± 1.0aA | 19.82 ± 0.87bB | 11.12 ± 1.0aB | 11.92 ± 0.23aB |
Notes:
All values are mean standard deviation ± of triplicate analysis.
Small superscripts in the same row specify the significant difference (P < 0.05) between the sample of individual species. Capital superscripts in the row specify the significant difference (P < 0.05) between within two species of same samples.
Melting and gelling point
Melting point of gelatin derived from respective body parts from of two species did not show any significant differences (P > 0.05). The melting point of gelatin derived from head ranged from 20.7 °C to 21.9 °C. Elavarasan et al. (2016) have observed the melting point of the gelatin extracted from the head waste of tiger tooth croaker as 20.25 °C. Among the gelatins derived from different body parts, those derived from scales were found to have higher melting point of about 27.0 °C (Table 3). In the case of gelling point, similarity could be observed between gelatins derived from different parts except scale gelatin which had relatively higher gelling point (Table 3). Further, the gelling temperature of scale gelatin varied among the two fish species that is, 16.8 °C for Lethrinus spp. and 20.8 °C for Lutjanus spp. (Table 3). Gelling point of skin gelatin observed in the present study (16.8–19.5 °C) was comparable with that of skin gelatin of Nile perch (18.5 °C) (Muyonga, Cole & Duodu, 2004b), Common carp (17.96 °C) (Ninan, Jose & Abubacker, 2011) and Rohu (18.52 °C) (Ninan, Zynudheen & Joseph, 2011). The gelling and melting temperatures have been found to be influenced by the change of PH of gelatin (Choi & Regenstein, 2000; Jeyashakila et al., 2012a). In the present study impact of pH on the melting temperature could be observed. The melting point had negative correlation with pH with Lethrinus spp. but not completely in Lutjanus spp. (Table 3).
Gel strength
Gelatins derived the scales of both Lethrinus spp and Lutjanus spp were found to be higher (1.98 N and 2.32 N) than that derived from other parts of the fishes (Table 3). The gel strength of skin gelatin of croaker and yellow fin tuna have been reported to be 1.22 N (Ninan, Jose & Abubacker, 2011) and 4.17 N (Ninan, Zynudheen & Joseph, 2011) respectively. Higher gel strength interns of bloom value of 426, higher than that of mammalian gelatin has been reported for the skin gelatin of yellow fin tuna by Cho, Gu & Kim (2005). In the present study, the intermediate values of 1.52 N for Lethrinus spp. and 1.73 N for Lutjanus spp. reveals the fact the species of the fish has definite impact on the gel strength of gelatin derived from skin. However, gelatin extracted from head and fins of two genera, did not show any significant differences in their gel strength (P < 0.05).
Gelatin yield
A wide variation in the yield of skin gelatin from 4% to 16% have been reported by various authors (Binsi et al., 2009; Gomez-Guillen et al., 2002; Jamilah & Harvinder, 2002; Jongjareonrak et al., 2006; Ninan et al., 2009; Renuka et al., 2019). The yield level of skin gelatin of the present study very well fall in the range already reported in earlier studies. In the present study, yield of gelatin derived from scales (19–22%) and skin (11–16%) were relatively higher than that derived from fins (11.9–13%) and head (11.1%) irrespective of the genera studied (P < 0.05) (Table 3). Higher yields of gelatin from head waste in the present study than that reported by Elavarasan et al. (2016) may be attributed to the oven drying adopted in the present study instead of freeze drying. The extraction conditions such as temperature, and acid/alkali treatments influence the yield gelatin (Renuka et al., 2019). Higher yield of gelatin from the scales (19–22%) than other body parts (11–13%) was due to minimum loss of collagen. Further, the low gelatin yield from head and fins was due to low protein level in the head (16–18%) and fins (16–24%) (Table 1).
Considering high yield, good gel strength, high melting point, simple extraction process and lesser utility for the development of any fishery byproducts in general, the scale gelatin was selected for the development of artificial fish bait matrix.
Standardization of extracted fish gelatin and cross linkers level for gel based bait matrix using by RSM
To standardize the level of ingredients for bait matrix, 17 samples were prepared based on RSM. Studies on fish bait development by Ollis et al. (2004) and Karunanithi et al. (2018b) suggested gel strength as the primary physical parameter for the preparation of gelatin based fish bait. Regarding insolubility, the fish bait should have optimum solubility ratio in seawater (Løkkeborg et al., 2014). Considering the above, insolubility ratio was taken as a criterion for the development of artificial fish bait. Statistical analysis of quadratic model and interactions among three variables viz., levels of gelatin, sucrose and water with respect to gel strength and insolubility ratio for response values were presented in Supplemental File 1 and the model was found significant (P < 0.0001). Fish gelatin was found to have higher influence on gel strength (P < 0.025) and insolubility ratio (P < 0.0062) compared to other two ingredients. The lack of fit was used to determine whether the model was adequate for description of observed data. If the P value of the lack of fit is <0.05, the model is adequate (Sivaraman et al., 2016). The lack of fit P value with respect to gel strength was 0.0003 and insolubility ratio was 0.0024. In this study, higher value of coefficient of determination was observed with respect to gel strength (0.9956) and insolubility ratio (0.9835). The value of adjusted coefficient determination was used to determine how much the model was significant (Ramesh et al., 2018). The adjusted coefficients of determination for gel strength and insolubility ratio were 0.9900 and 0.9622 respectively. Moreover, the predicted R2 values were in reasonable agreement with the Adjusted R2 values for both the cases. Hence, the model was found suitable for optimization of preparing the artificial fish bait matrix considering gel strength and insolubility ratio as desirable parameters.
The best explanatory model equations for gel strength and insolubility ratio were as follows:
(Whereas, A = Water, B = Sucrose, C = Gelatin)
Two dimensional contour plots and 3D response surface plots revealed the factors affecting the gel strength and insolubility of various bait matrixes tested (Figs. 2 and 3).Mutual interactions between factors were expressed as contour plots. Circular contour plot indicates that the interactions between corresponding variables are negligible while elliptical contour plot indicates significant interaction between corresponding variables (Ramesh et al., 2018). In the present study, the elliptical 2D contour plots (Figs. 2A and 2C) and 3D response surface plots (Figs. 2E and 2F) indicated the existence of significant interactions between gelatin and sucrose and gelatin and water respectively. Further, the interaction between water and sucrose levels was not found significant (Fig. 2A) as revealed by the circular counter plots. Under optimum condition 3D response surface plots exhibit convex shape (Sivaraman et al., 2016). The concave nature of 3D plots related to gel strength reveals the existence of scope for further optimization of variables (Fig. 2). The elliptical 2D contour plots (Figs. 3B and 3C) indicated the existence of significant interactions between gelatin and sucrose and gelatin and water respectively. These facts were evident through respective 3D response surface plots Figs. 3E and 3F also. The circular contour plot indicated that the interaction between water and sucrose was not significant and can be ignored (Fig. 3A). Among the three response surface plots shown in Figs. 3D–3F, the plots 3E and 3F were relatively found to be convex, indicating that well defined optimum conditions were present in the respective models. Further, the concave response plot (Fig. 3D) indicated that the combination of sucrose and water can further be optimized by additional additives with respect to insolubility ratio in seawater. Optimum conditions for high gel strength (20.95 N) and insolubility ratio (72.1%) obtained from the equations derived through RSM were water = 52%, sucrose = 22.5% and gelatin = 25.5%. The validation of the model with triplicate trials revealed the values of mean gel strength and insolubility ratio as 21.84 N and 71.3% respectively at the 99% confidence level. Hence, it can be concluded that the optimum level of ingredients for deriving gelatin based bait matrix as 47% of water, 22.5% of sucrose and 25.5% of fish gelatin which is expected to have 21.84 N of gel strength and 71.3% of insolubility ratio.
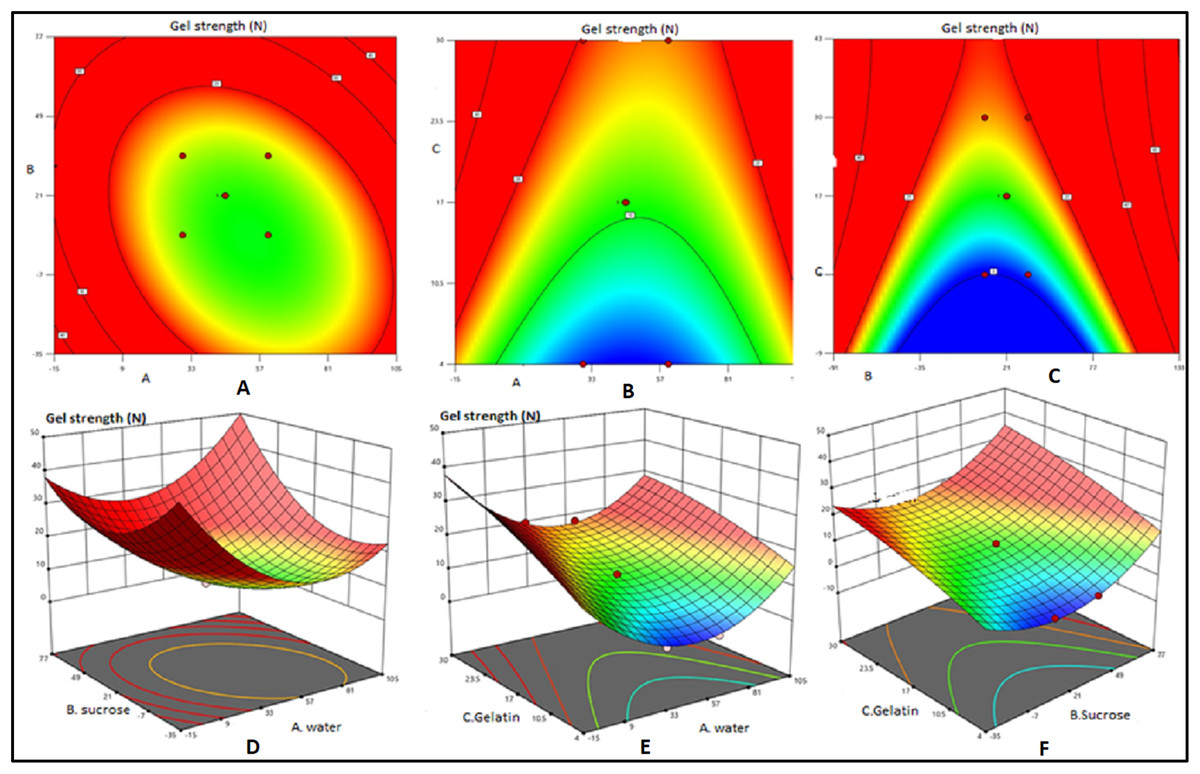
Figure 2: Contour plots and response surface plots for effects of water, sucrose and gelatin indicate effects of gel strength.
Contour plots (A, B and C) and response surface plots (D, E and F) for effects of water (small A) sucrose (small B) and gelatin (small C) indicate effects of gel strength.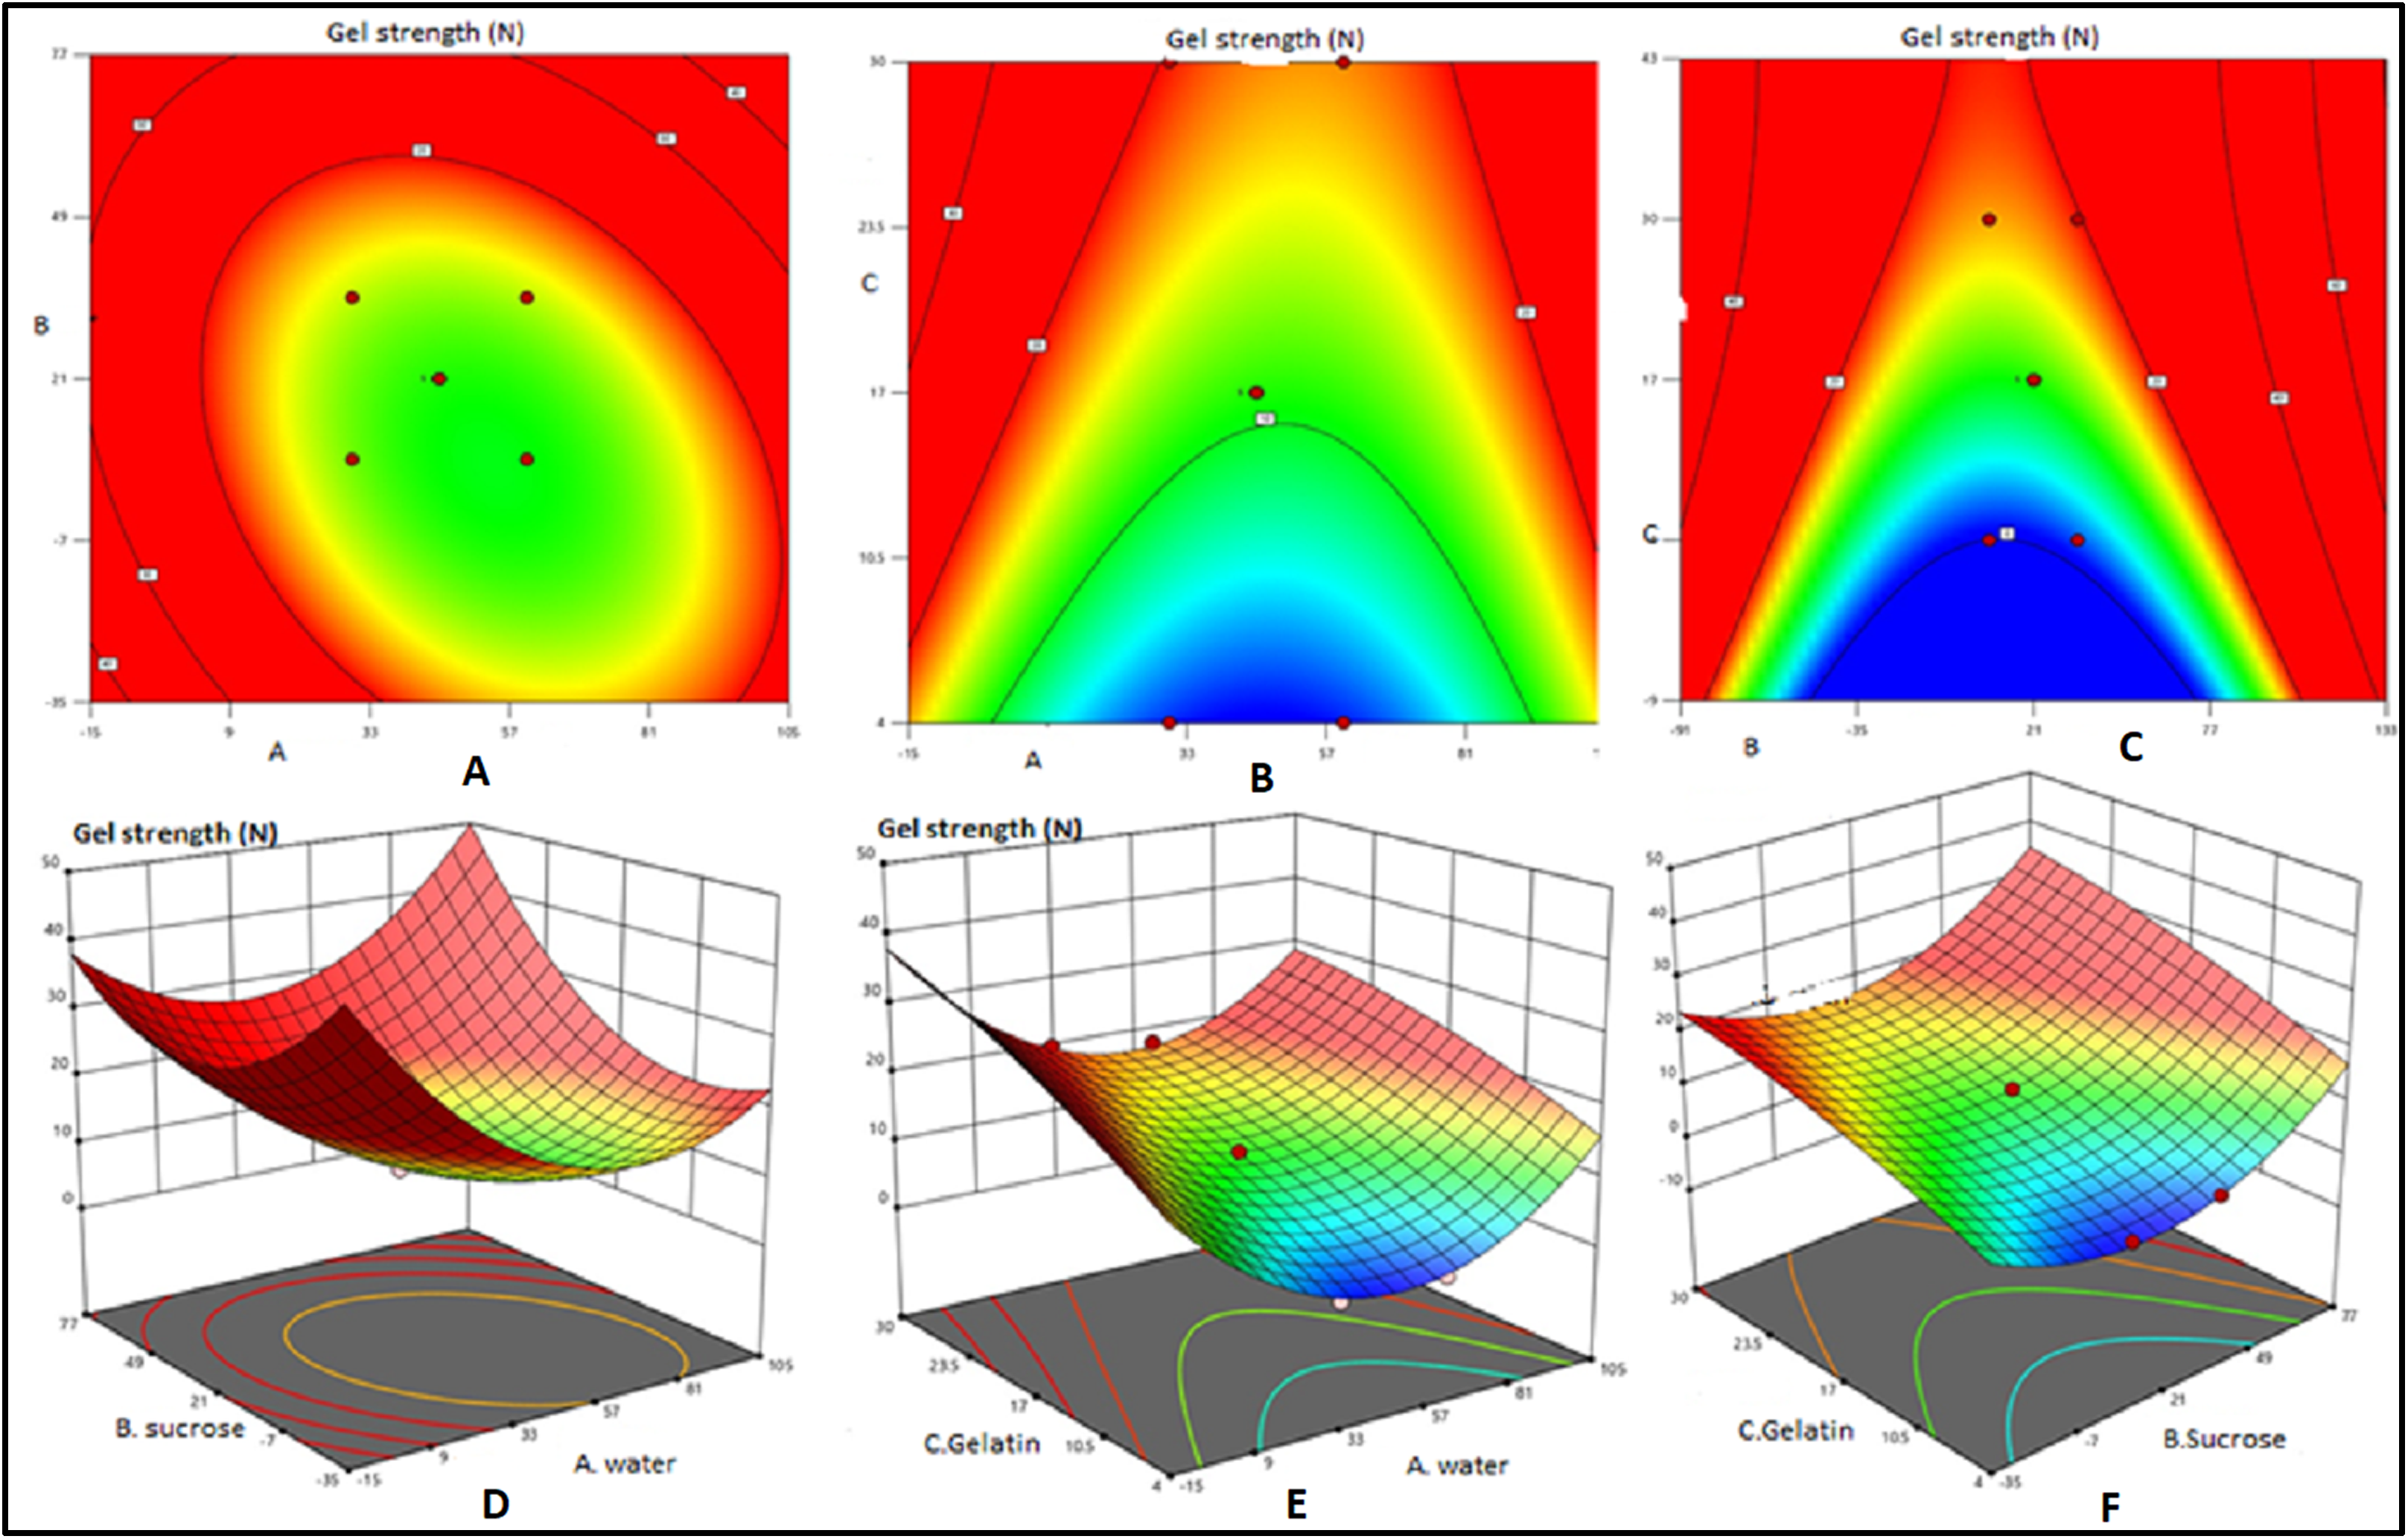

Figure 3: Contour plots and response surface plots for effects of water, sucrose and gelatin indicate effects of insolubility ratio.
Contour plots (A, B and C) and response surface plots (D, E and F) for effects of water (small A), sucrose (small B) and gelatin (small C) indicate effects of insolubility ratio.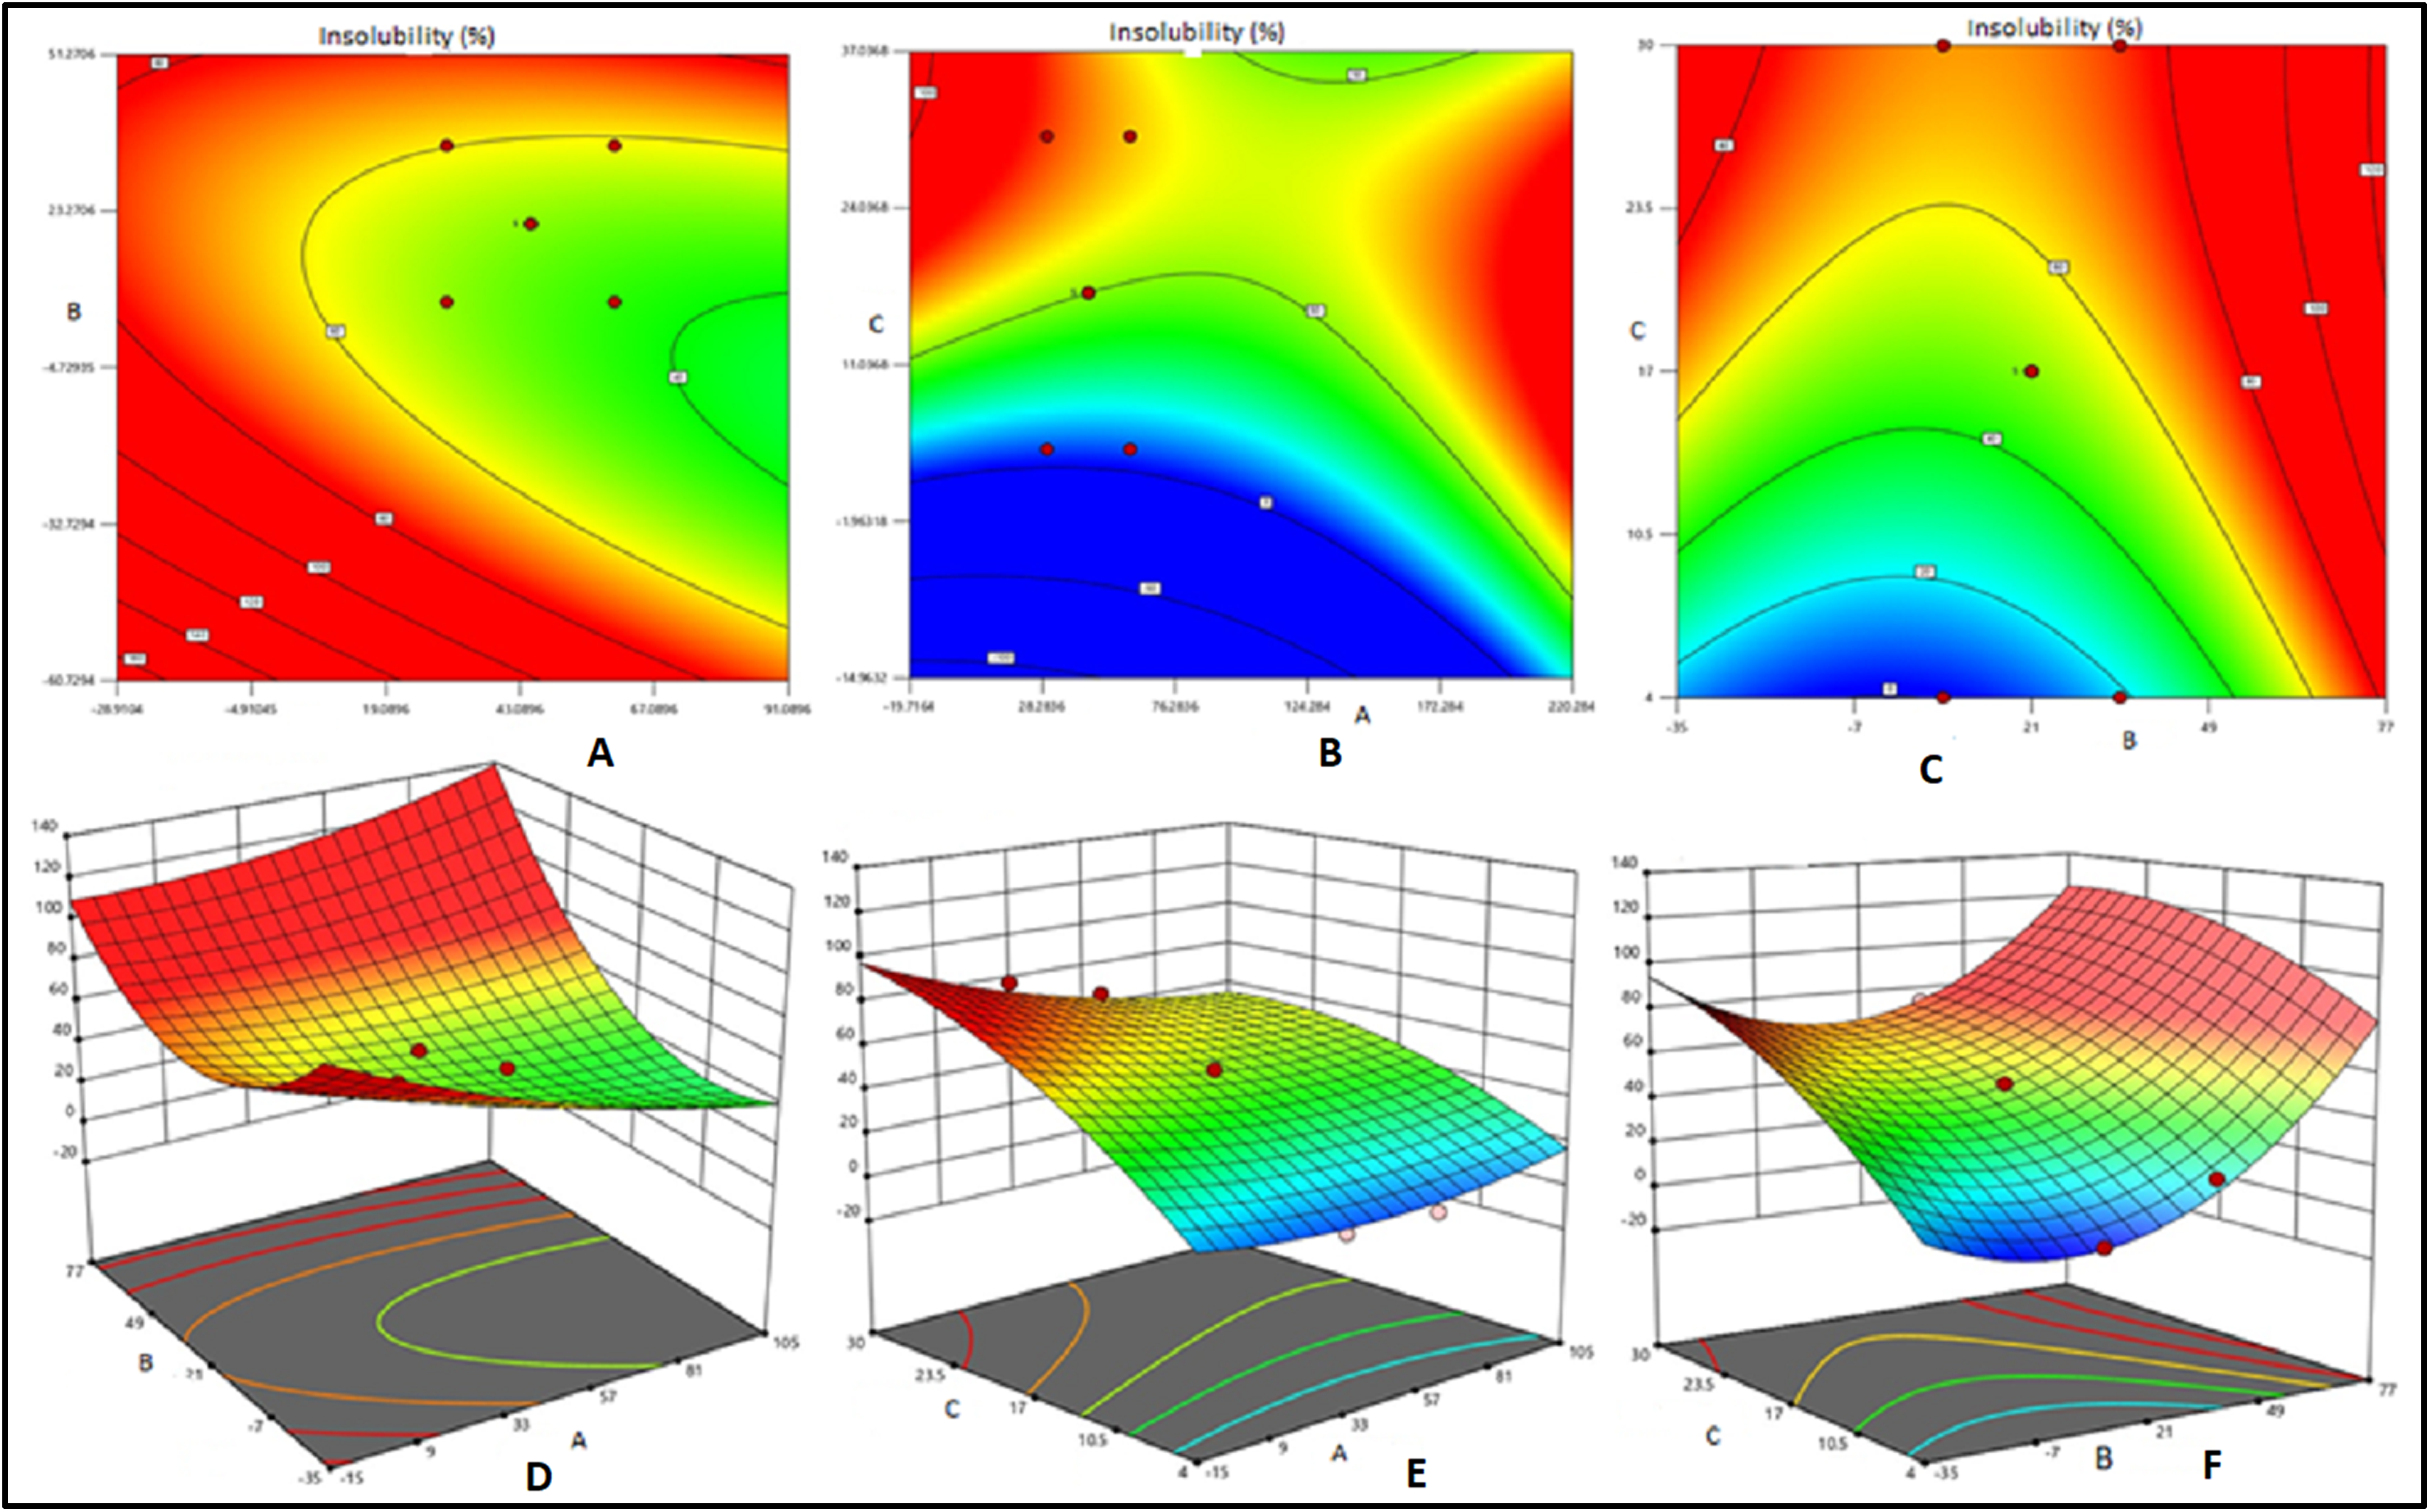
Optimization of processing conditions of bait matrix by RSM
The statistical analysis of quadratic model and interactions among the two variables viz., Curing duration and curing temperature with respect to gel strength, insolubility ratio and melting point for response values were presented in Supplemental File 2. Statistical analysis of quadratic model with respect to process optimization of bait matrix indicated the range of p value from 0.0021 to <0.0001, indicating the suitability of the model. The gel strength, insolubility ratio and melting point of the bait matrix were found significantly affected both by curing duration (P < 0.05) and curing temperature (P < 0.05). The R2 coefficient value expressing of gel strength was relatively high (0.9859) however comparable with that of insolubility (0.9571) and melting point (0.9006). The high values of R2 obtained for all the three variables revealed the definite impact of curing temperature and curing duration definite impact on gel strength, insolubility and melting point.
Final equations derived in terms of coded factors were:
(Whereas, A = Curing temperature, B = Curing duration)
Two dimensional contour plots and 3D response surface plots were used for graphical representation of the regression equations related to gel strength, insolubility ratio and melting point are shown in Fig. 4. The elliptical 2D contour plots indicated the existence of significant interactions between curing duration and curing temperature with respect to three factors viz. gel strength (Figs. 4A and 4D), Insolubility ratio (Figs. 4B and 4E) and melting point (Figs. 4C and 4F). However, the response surface plots pertaining to insolubility ratio and melting point were convex in contrast to that of gel strength indicating the existence of well-defined optimum conditions in the models of insolubility ratio and melting point than that of gel strength (Figs. 4B and 4F).
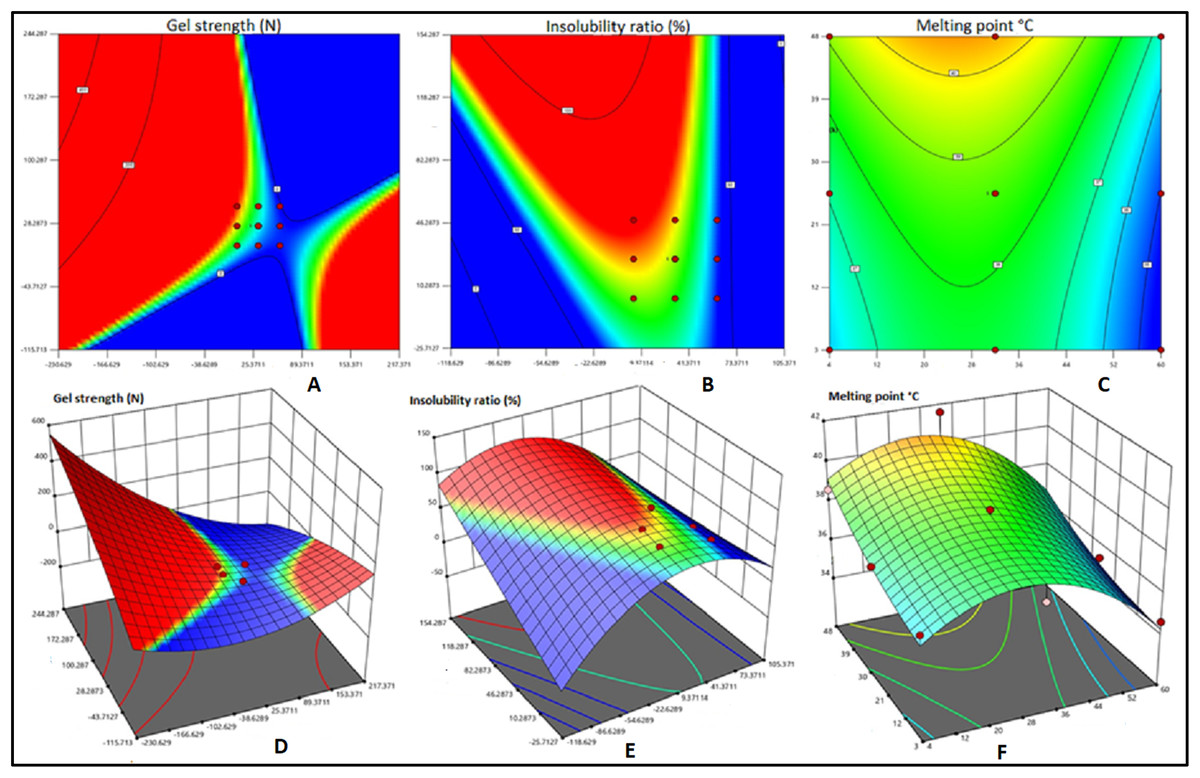
Figure 4: Contour plots and 3D diagram of gel strength, Insolubility ratio and melting point of fish bait matrix as affected by curing temperature and curing duration.
Contour plots and 3D diagram of gel strength (A and D), Insolubility ratio (B and E) and melting point (C and F) of fish bait matrix as affected by curing temperature (small A) and curing duration (small B).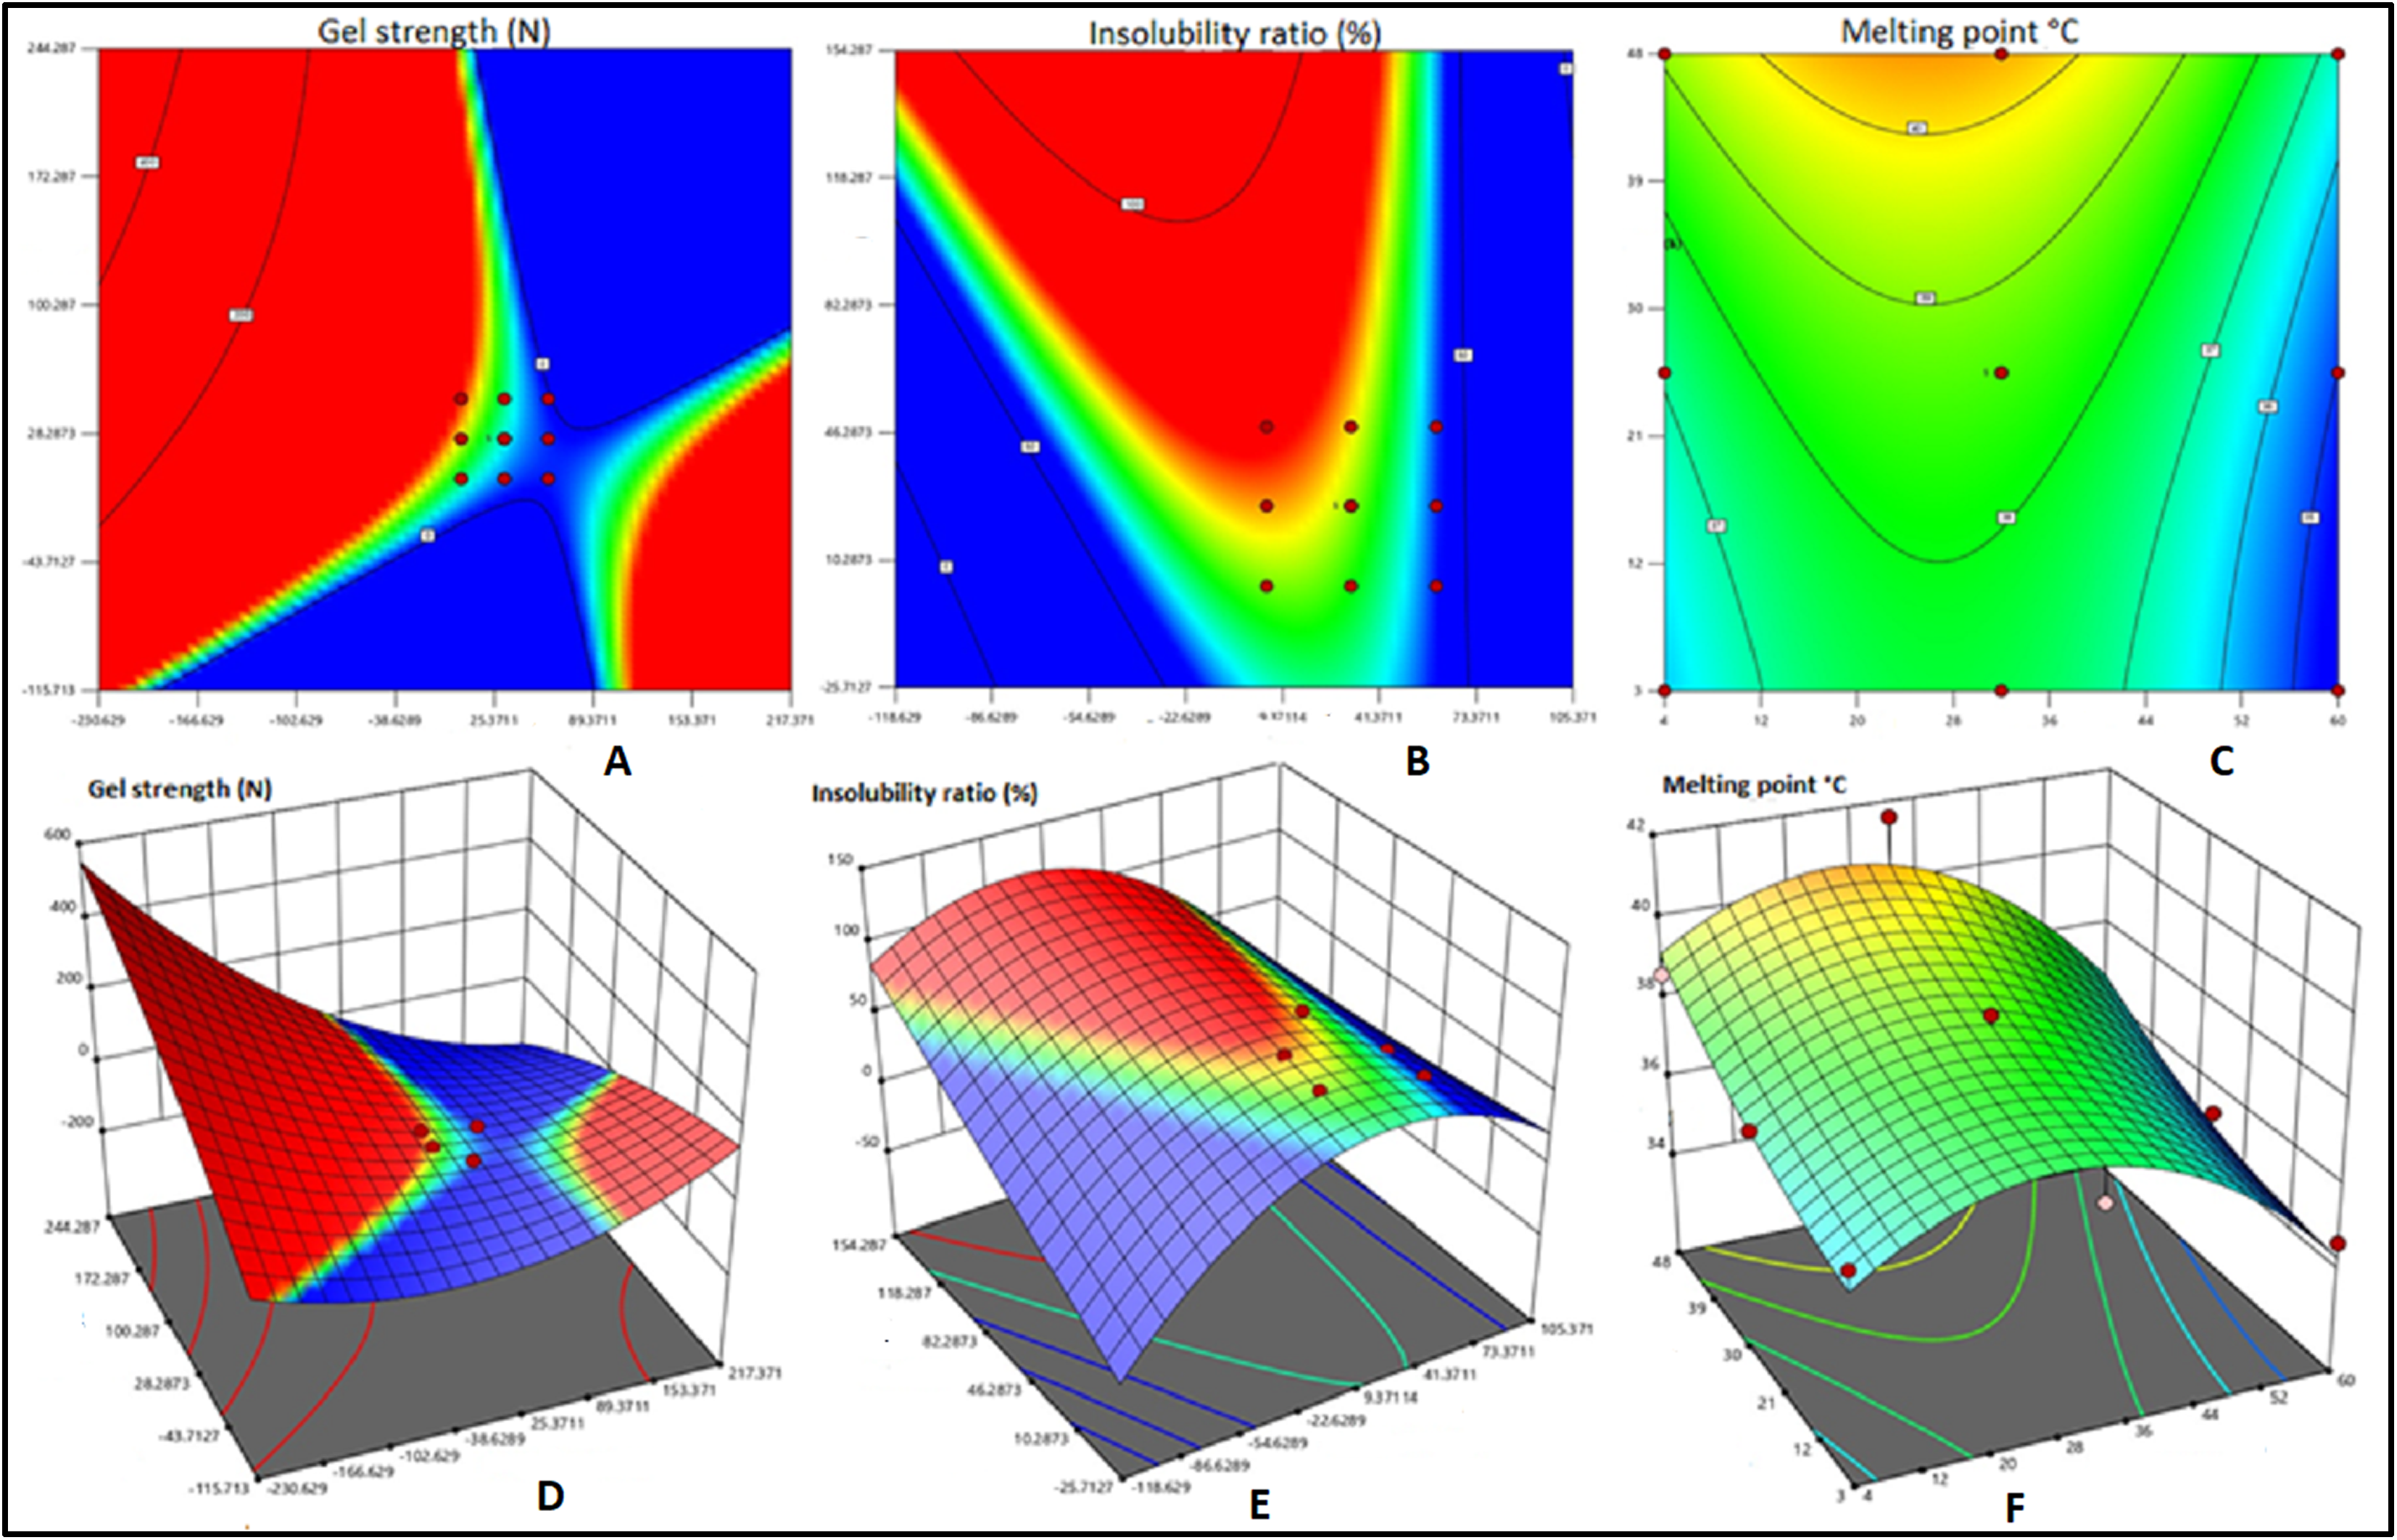
Effect of curing time and curing temperature on the gel strength
The effects of three different curing temperatures and curing durations on gel strength are expressed in Fig. 5. The increase in gel strength with increase in curing duration was noticed in all the three curing temperatures (4, 32 and 60 °C), however was highly pronounced at 4 °C. It was inferred that bait matrix with maximum gel strength of 16.984 N could be obtained at a curing temperature of 4 °C with curing duration of 25.5 h. Koli et al. (2012) reported higher gel strength of 23.71 N when the mixture of fish gelatin, sucrose, transglutaminase and water was cured at 7 °C for 15 h. It could be noticed in the present study that a gel matrix with comparable gel strength as reported by Koli et al. (2012) could be obtained even without an additional cross linker, transglutaminase apart from sucrose. However, the extension of gelling duration from 15 h to 48 h was noticed due to non-addition of transglutaminase.
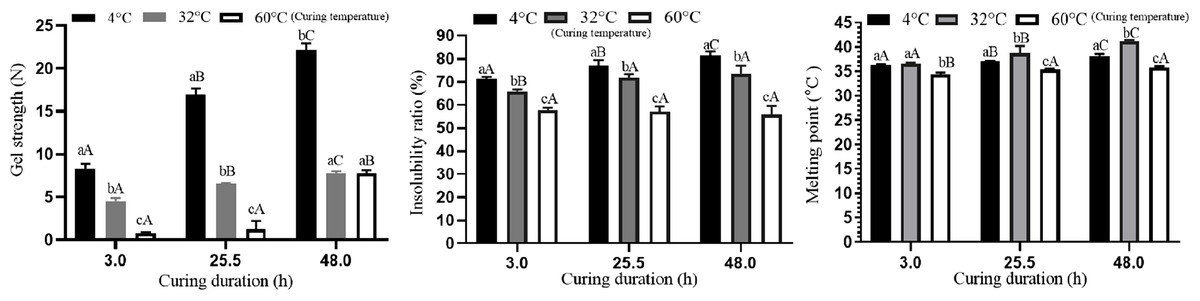
Figure 5: Effect of curing temperature and curing duration on gel strength.
Effect of curing temperature and curing duration on gel strength, insolubility ratio and melting point.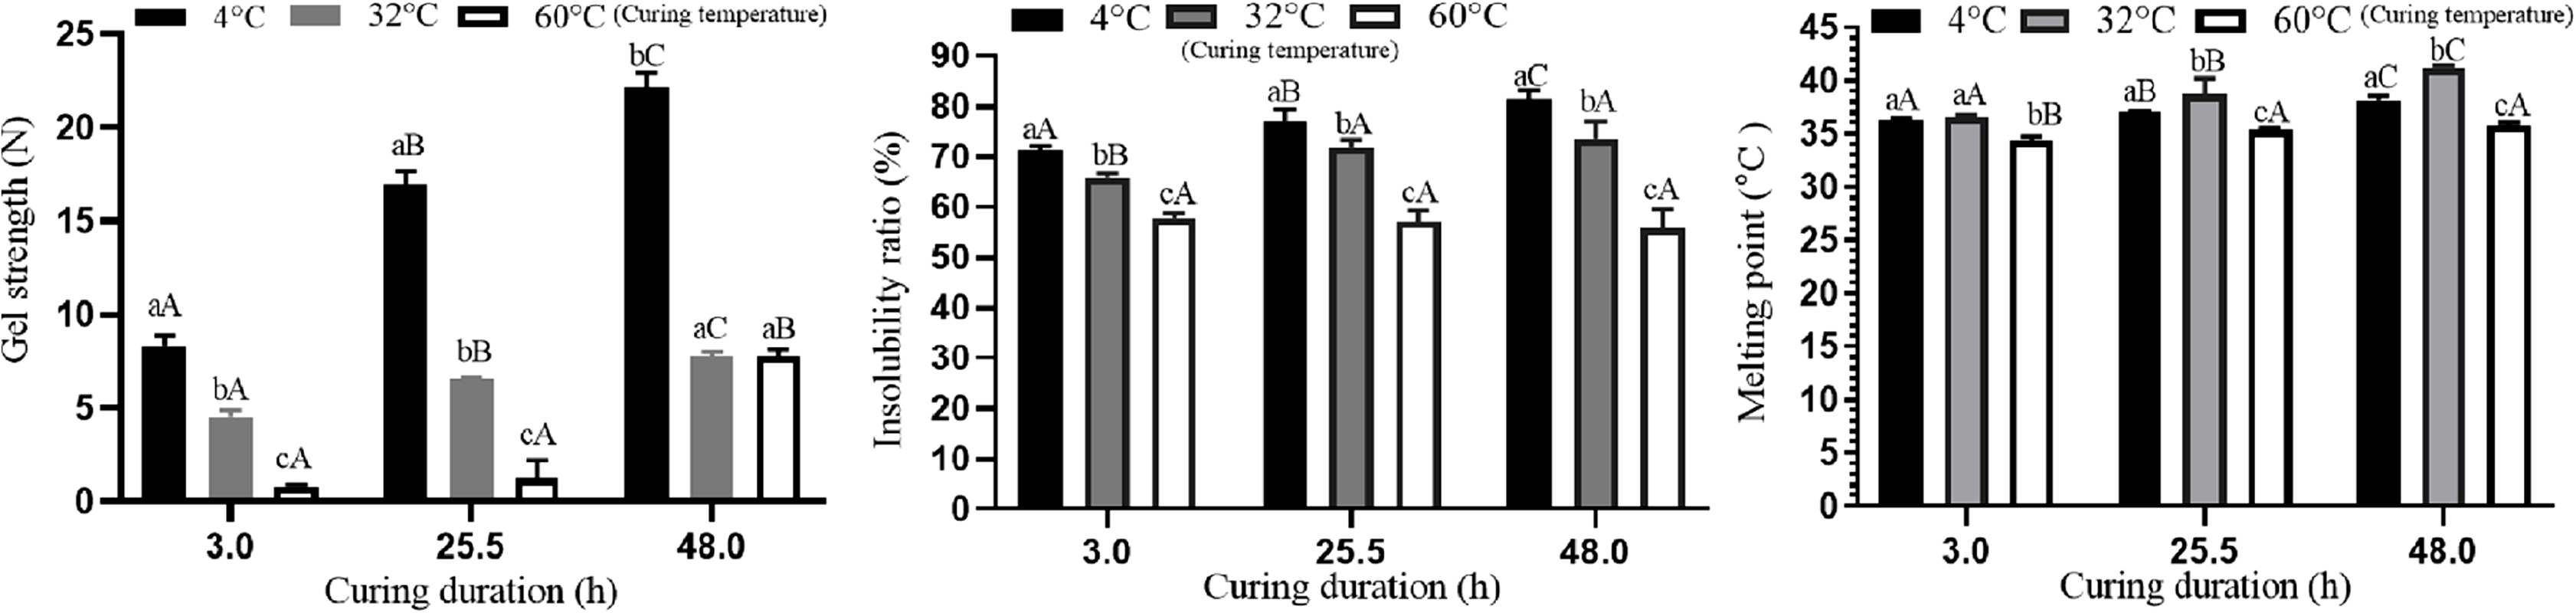
Effect of curing time and curing temperature on the insolubility ratio
Gel curing temperature and curing duration play major role in the solubility of gel in water and other chemical solutions (Mohajer, Rezaei & Hosseini, 2017). Insolubility ratio indicates the stability of fish bait matrix in seawater under controlled conditions and it can be used as an index of stability of fish bait in seawater (Karunanithi et al., 2018b). The effects of three different curing temperatures and curing durations on the insolubility ratio are expressed in Fig. 5. The insolubility ratio gradually increased with the increase in the curing duration at the curing temperature of 4 °C and 32 °C. However, it remained unchanged at the curing temperature of 60 °C (Fig. 5). Highest insolubility ratio of 81.39% was recorded at the curing temperature of 4 °C and curing duration of 48 h.
Effect of curing time and curing temperature on the melting point
Melting point is another important physical parameters related to the physical stability of gel based product as reported by Koli et al. (2012). Karayannakidis & Zotos (2015) found that gel containing glycerol cured at 10 °C had higher melting point of 33.9 °C. The sea surface temperature of Indian seas has been reported to vary from 18 °C to 31 °C (INCOIS, 2020). Hence, it is felt that the bait matrix of artificial fish bait should have the melting point above 31 °C to avoid melting of artificial fish bait at sea during longline operation. The details on the melting point of fish bait matrixes processed at different combination of curing temperature and curing duration are presented in Fig. 5. In general, the increase in curing temperature had lesser impact on melting point compared to that of gel strength and insolubility ratio. The melting point marginally increased with the increase in the curing duration from 3 h to 48 h at 4 °C and 32 °C and at 60 °C of curing temperature there was only insignificant increase in melting point due to increase in curing duration. It could be observed that highest melting point of 41.0 °C could be obtained at the curing temperature of 32 °C with the curing duration of 48 h. However, bait matrix with the slightly lower melting point of 39.0 °C could be obtained at the curing temperature of 4 °C with the curing duration of 48 h. Since the sea surface temperature of Indian seas range from 18 °C to 31 °C (INCOIS, 2020), a bait matrix with 39 °C melting point would be sufficient to serve in the artificial bait for longline fishing as it had higher gel strength of 23.71 N against about 8 N when processed at the curing temperature of 32 °C with the curing duration of 48 h.
Gel strength of 21.08 N, insolubility ratio of 75.8% in sea water and melting point of 39.2 °C were found to be optimum values of key parameters for the preparation of fish bait suitable for longline fishing based on the equations derived through RSM when the bait matrix was cured at 4 °C for 25.5 h. The validation of the model with triplicate trails revealed the value of mean gel strength, insolubility ratio and melting point as 20.84 N, 74.5% and 39.0 °C respectively at the 99% confidence level. Hence it is concluded that the optimum curing temperature and curing duration for the preparation of gelatin based bait matrix are 4 °C and 25.5 h respectively.
Conclusion
The study explored the valorisation of discarded seafood waste to develop value added gelatin based biodegradable fish bait matrix. Owing to the availability of industrial fish wastes in adequate quantity and their biodegradable nature, fish wastes were selected for value addition as artificial fish bait in this study. Further, value addition of fish waste would pave way for the judicious disposal of them which would otherwise may pose environmental pollution. Among the wastes derived from different body parts of Lethirunus spp. and Lutjanus spp., scales were found to be ideal for the extraction of gelatin due to high yield, good gel strength, and high melting point besides simple extraction process. The RSM was performed to optimise the level of ingredients of gelatin based bait matrix. The analysis of quality of the bait matrixes based on gel strength, insolubility ratio and melting point revealed the optimum curing temperature and curing duration as 4 °C and 25.5 h respectively. This study provides a practical approach to utilizing the fish waste for the preparation of bait matrix suitable to prepare an eco-friendly artificial bait for longline fishing.
Supplemental Information
RSM statistical data.
Parameters of regression analysis and analysis of variance of the quadratic equation for the optimization of ingredients of bait matrix and the process parameters.