
HBPF: a Home Blood Pressure Framework with SLA guarantees to follow up hypertensive patients
- Published
- Accepted
- Received
- Academic Editor
- Chakchai So-In
- Subject Areas
- Computer Networks and Communications, Distributed and Parallel Computing
- Keywords
- Hypertension, Healtcare, eHealth
- Copyright
- © 2016 Cuadrado et al.
- Licence
- This is an open access article distributed under the terms of the Creative Commons Attribution License, which permits unrestricted use, distribution, reproduction and adaptation in any medium and for any purpose provided that it is properly attributed. For attribution, the original author(s), title, publication source (PeerJ Computer Science) and either DOI or URL of the article must be cited.
- Cite this article
- 2016. HBPF: a Home Blood Pressure Framework with SLA guarantees to follow up hypertensive patients. PeerJ Computer Science 2:e69 https://doi.org/10.7717/peerj-cs.69
Abstract
Hypertension or high blood pressure is a condition on the rise. Not only does it affect the elderly but is also increasingly spreading to younger sectors of the population. Treating it involves exhaustive monitoring of patients. A tool adapted to the particular requirements of hypertension can greatly facilitate monitoring and diagnosis. This paper presents HBPF, an efficient cloud-based Home Blood Pressure Framework. This allows hypertensive patients to communicate with their health-care centers, thus facilitating monitoring for both patients and clinicians. HBPF provides a complete, efficient, and cross-platform framework to follow up hypertensive patients with an SLA guarantee. Response time below one second for 80,000 requests and 28% increase in peak throughput going from one to three virtual machines were obtained. In addition, a mobile app (BP) for Android and iOS with a user-friendly interface is also provided to facilitate following up hypertensive patients. Among them, between 54% and 87% favorably evaluated the tool. BP can be downloaded for free from the website Hesoft Group repository (http://www.hesoftgroup.eu).
Introduction
Hypertension is one of the most important risk factors in cardiovascular diseases, the leading cause of death worldwide (Craig & Mindell, 2006). It affects about 20% of the adult population, a percentage that increases with age (Aguado et al., 2009).
Home blood pressure (HBP) consists of patients taking readings at home and registering these using a digital device. The patients then send the readings to a health professional who is responsible for taking appropriate action (Pickering et al., 2008).
In a recent scientific article, the American Heart Association concluded that HBP monitoring should become a routine component of blood pressure measurement in the majority of patients with known or suspected hypertension (Pickering et al., 2008). HBP readings may also be better predictors of cardiovascular and renal outcomes than surgery readings (Ohkubo et al., 1998; Bobrie et al., 2004). Furthermore, HBP readings provide a more accurate assessment of true blood pressure than alternative measurement methods, such as surgery blood pressure or rapid titration of antihypertensive therapy. They also avoid the white-coat syndrome and facilitate the identification of masked hypertension, leading to a greater patient involvement in managing hypertension, a condition that is typically asymptomatic (McManus et al., 2010).
Having ways to monitor HBP in a continuous and rigorous way, with a fluid communication between patient and doctor, may be crucial in ensuring satisfactory control of blood pressure, which is currently a great challenge. Information and communication technology (ICT) can play an important role in achieving this monitoring capabilities (Green et al., 2008; Vilaplana et al., 2015). In this context, we developed and present HBPF (Home Blood Pressure Framework). HBPF is made up of two parts, the HM (Hypertension Module) server and the BP (Blood Pressure monitoring) mobile app.
HBPF provides high performance for a given SLA (Service Level Agreement). An SLA is a contract negotiated and agreed between a customer and a service provider for which a customer only pays for the resources and services used according to negotiated performance requirements at a given price (Vilaplana et al., 2015; Vilaplana et al., 2014a). Throughput is one of the most important performance metric in a cloud-computing context (Vilaplana et al., 2015; Vilaplana et al., 2014a). It was also the performance parameter chosen in this work to fix the SLA.
Frameworks such as HBPF generate large amounts of data that need to be continuously stored, processed, and available. This require the use of cloud computing services (Abbas & Khan, 2014). Earlier versions of the concept underlying HBPF (Vilaplana et al., 2015; Vilaplana et al., 2014a) were tested in a private cloud-based server, before moving the HM into a real-world cloud environment. These applications used SMS communications between clinicians and patients. This was limiting in many ways. The current platform uses Internet communication, providing physicians with access to standard medical records and allowing them to write reports and to follow up and communicate (i.e., charting and sending videos) with patients by means of HBPF. Efforts were made to design a scalable framework when the number of both patients and hospitals increased by providing Service Level Agreement (SLA) guarantees (Vilaplana et al., 2015; Mateo et al., 2014; Vilaplana et al., 2013; Vilaplana et al., 2014b; Vilaplana et al., 2014c).
The remainder of the paper is organized as follows. ‘Related Work’ details the related work addressing the problem of tele-moritoring hypertensive patients. In ‘Hypertension Module’ we present HM. ‘BP’ is devoted to explaining the operation and functionality of the BP app. This app and its performance is evaluated in ‘Results.’ Finally, ‘Conclusions’ outlines the main conclusions and future work.
Related Work
There is a potentially important role for novel techniques to lower errors in collecting blood pressure readings, especially in primary care, where management of hypertension mainly takes place (McManus et al., 2010; Lai et al., 2009). One such techniques is mHealth—health care and public health practice supported by mobile devices (WHO, 2011).
Earlier work identified 60 websites that provided functionality to manage and present home blood-pressure readings. Out of these, 20 could be freely used. A comparison between these 20 websites was carried out between June and August 2009 (Patel et al., 2010). The results showed that none of these 20 websites were directly linked to common electronic medical records. In addition, none of them provided any tools for sending alert messages in any format.
Studies have shown the positive impact of mHealth on adherence-related behavior among patients. For example, short message service (SMS) appointment reminders have led to an increase in attendance of HIV (Bigna et al., 2014), tuberculosis (Liu et al., 2014), and quitting tobacco patients (Vilaplana et al., 2014a; Vilaplana et al., 2015). Patient-physician short messaging through a telemedicine system was also tested as a means to improve control of hypertension in the follow-up of medium-to-low-risk patients in primary care (Carrasco et al., 2008). A control group (CG) recorded the data on paper and could only deliver it to their GP personally in routine visits. This study showed that 50% of the telemedicine-enabled patients strictly adhered to the treatment protocol, versus 25% in the CG. This suggests that more flexible and continuous ways of interaction and follow up of patients might have a greater impact in treatment adherence.
A study among 107 mHealth articles assessed the role of adherence of patients to chronic diseases management (Hamine et al., 2015). 40.2% (43/107) of studies used SMS exclusively and 23.4% used specialized software or a smartphone app. These programs focused mainly on a combination of devices, such as an electrocardiogram or a BP monitor. As a conclusion, the authors suggested that future mHealth tools need to provide optimal user-interfaces, or targeted motivational messages.
With all this in mind, we designed and implemented HBPF to include a flexible and user friendly interface that provides motivational messages to the patients and enable immediate and real-time communication between patient and physician by means of the BP app. In addition, the app provides self-monitoring, reading sampling, charts, reports, tips, and advice, in line with other existing hypertension apps (see Table 1 for a comparison of the main features between the various apps). However, with the exception of BP, none of the apps features on-line physician support for the patient, chat between physician and patient, or broadcasting communication among a group of patients. In addition, BP is the only app available for both, iOS and Android operating systems.
HBPF provides a means to communicate across a wide range of platforms and devices with a doctor, as does HealthTap. In addition, HBPF provides a complete, efficient, and cross-platform framework to follow up hypertensive patients with an SLA guarantee. Furthermore, the transparent architecture of HBPF was designed to facilitate the involvement of additional third parties, and the integration with existing healthcare systems, while providing ad-hoc adaptation of monitoring parameters to each individual, in a similar way to Benharref & Serhani (2013).
| app | DC | NC | Charts | RH | AB | AP | OS |
|---|---|---|---|---|---|---|---|
| BP Lite | No | No | Yes | Yes | No | No | iOS |
| iBP | No | No | Yes | Yes | No | No | iOS |
| IBPTouch | No | No | Yes | Yes | No | No | iOS |
| BPMonitor | No | No | Yes | Yes | No | No | iOS |
| BP | Yes | Yes | Yes | Yes | No | No | iOS/Android |
| iCare BP Monitor | No | No | Yes | Yes | No | Yes | Android |
| BP Watch | No | No | Yes | Yes | No | No | Android |
| Finger BP Prank | No | No | No | No | No | Yes | Android |
Notes:
- app
-
Application name
- DC
-
Doctor Chat (direct chatting with the physician)
- NC
-
Nearby centers (provides information about the distance to specialized centers)
- Charts
-
graphical evolution Charts
- RH
-
Readings’ History
- AB
-
Automatic sampling of the Blood Pressure by means of an external device
- AP
-
Automatic sampling of the pulse rates by means of an external device
- OS
-
Operating System

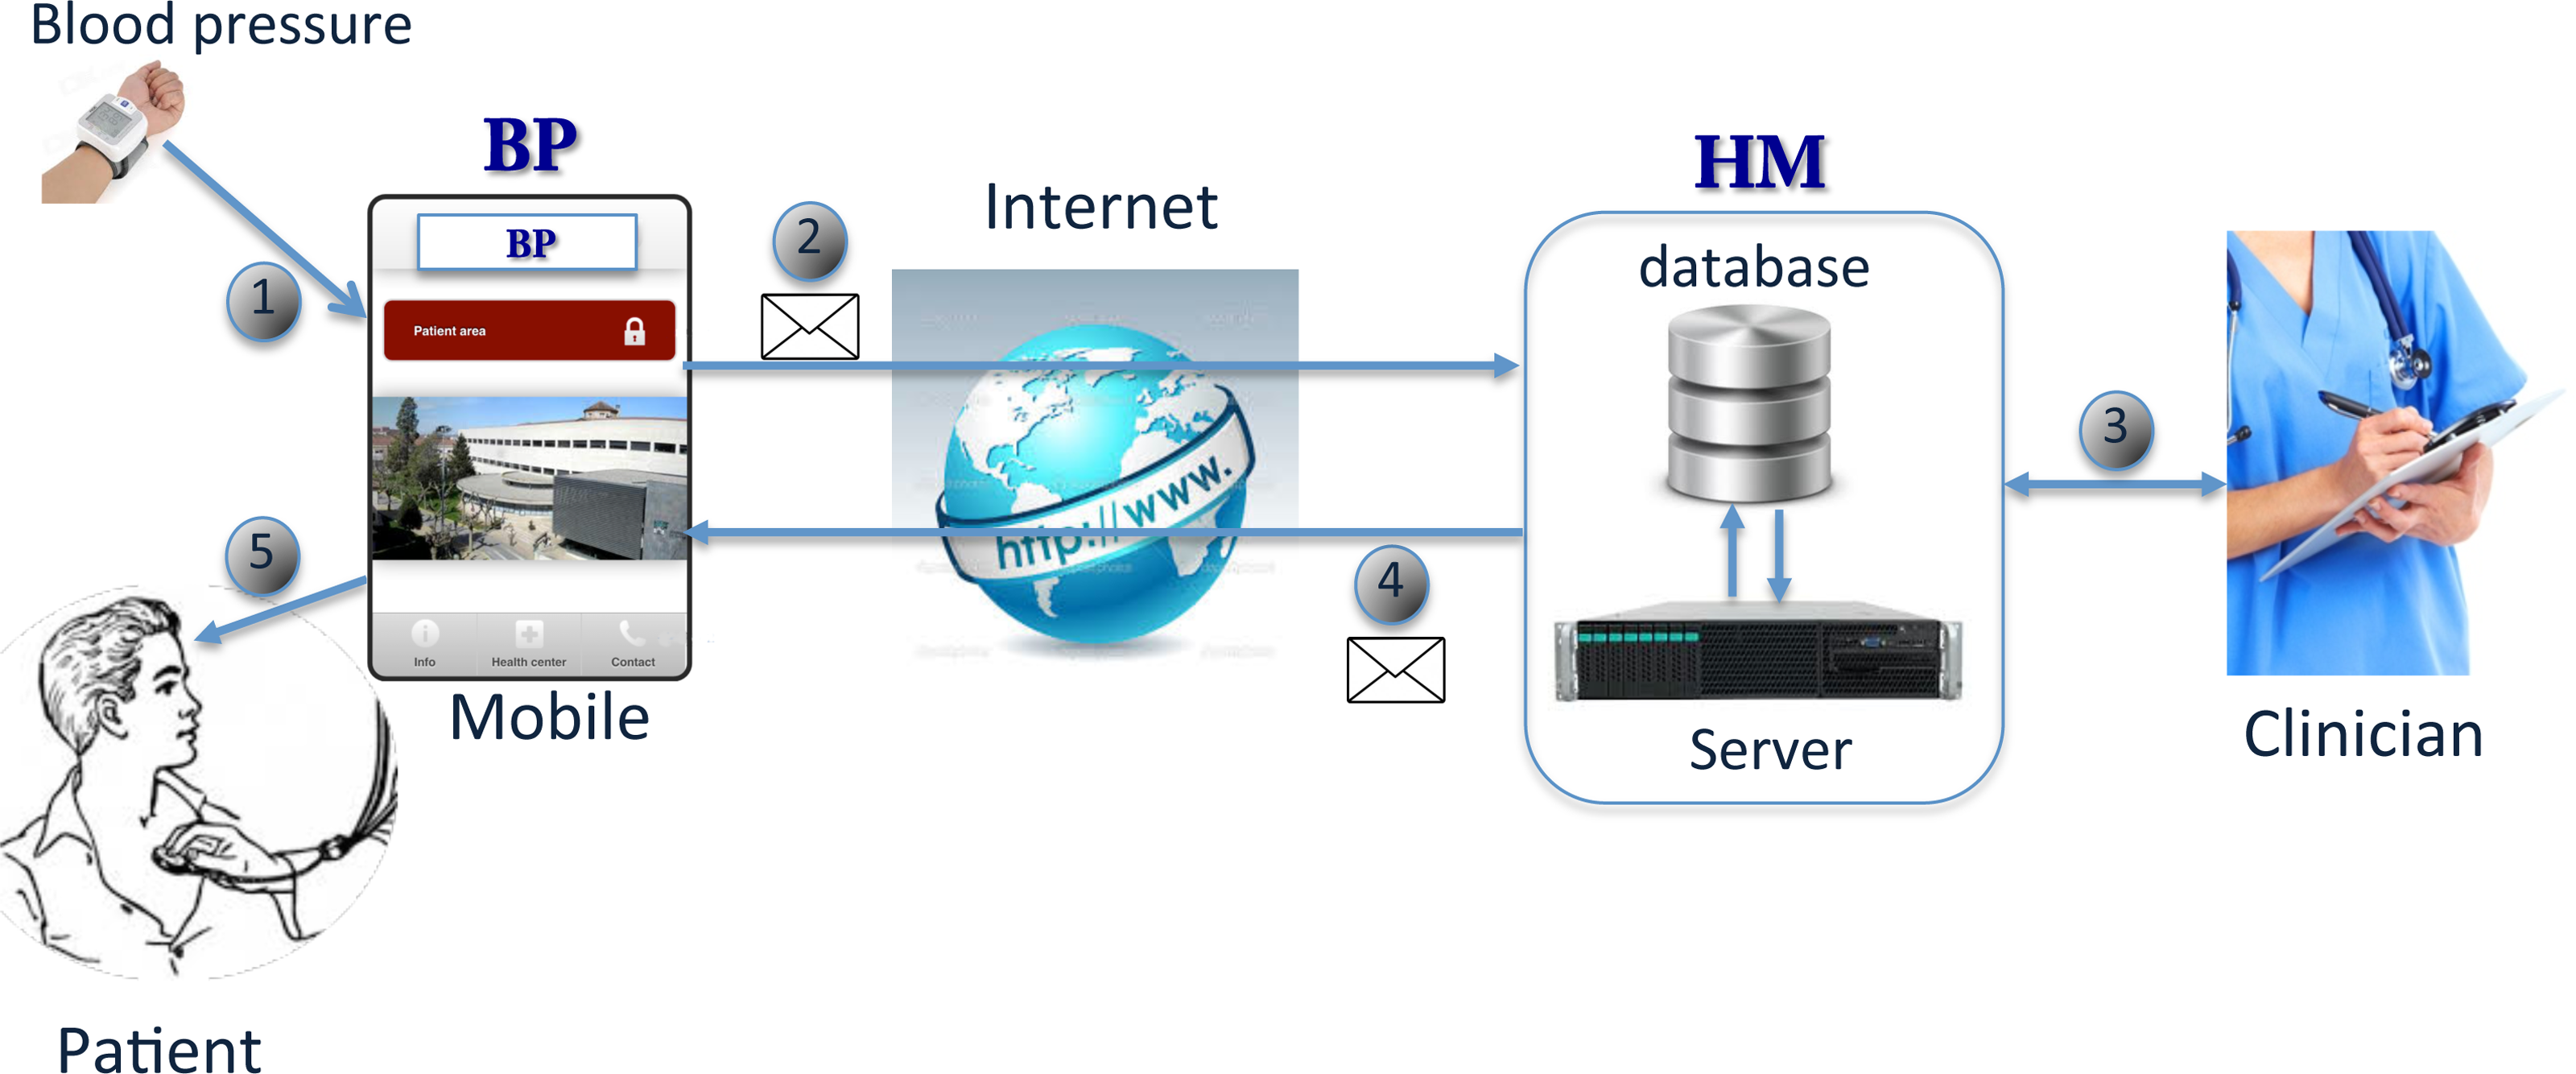
Figure 1: HBPF operation.
HBPF
Figure 1 summarizes the overall operation of HBPF. First of all, patients send their readings with the BP app from a smartphone to the server (1), via Internet (2).
On receiving a message, the server redirects it to the cloud-based HM. HM is responsible for checking and saving the readings in a database. Clinicians can inspect the patients’ readings from the database (3). Next, depending on the data and the criteria specified by the clinicians, HM responds to the patient’s mobile with another message through the server (4 and 5). HM also provides additional facilities to follow up hypertensive patients.
The main objective of the BP app is to extend the communication systems of the HM tool, adding the most widely used communication functionalities for smartphones. These include instant messaging (chat), among others. In this way, patients participate actively in controlling their disease and follow their medical evolution, communicating with the medical team in real time.
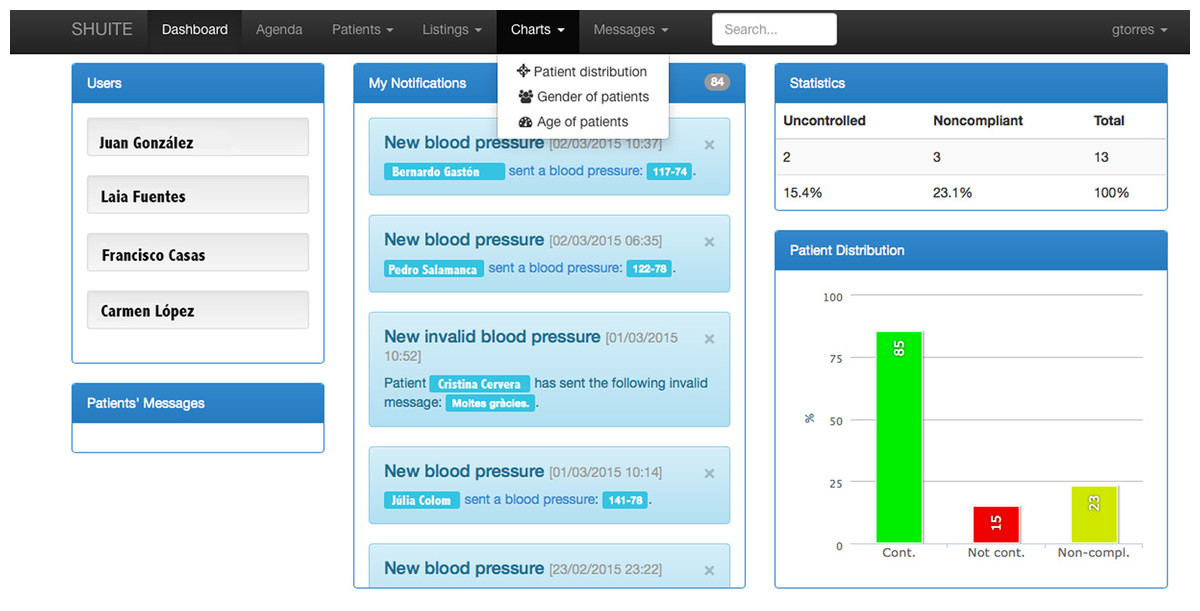
Figure 2: HM.
The names that appear in the figure are invented.
Hypertension Module (HM)
The Hypertension Module (HM) (see Fig. 2) was designed for collecting and managing data from hypertensive patients. Its functions are to record and print/display measurement statistics, show the evolution of patients graphically using charts, provide instant messaging tools (i.e., chat), aid clinicians with diagnose, and generate alerts or suggestions for treatment, patient monitoring, medication and nutrition, among others.
One of the main features of HM is that it plots patients’ readings (systole and diastole blood pressures and pulse). These readings can be registered automatically by means of the BP app or manually by the clinicians. HM automatically calculates the mean values for each day, showing an overall average value per day in the plot. HM performs a data verification check, in order to avoid incorrect or invalid measurements, such as negative or physically implausible values.
HM allows target limits from both systole and diastole blood pressures to be established individually depending on the characteristics of each patient. If these limits are exceeded, an alert is shown on the main page of the HM tool, so that clinicians can act quickly and, if needed, intervene or send an alert message to the patient.
HM is currently designed to communicate with the patients through an Internet connection (via smartphone with the BP app). This somewhat determines the design of the architecture, currently made up of a server and a database (see Fig. 1). In order to increase the reliability and availability of the overall system, the server can contain multiple processing units, like processors, cores, or Virtual Machines. As the current web servers are usually mounted on cloud systems, “VMs” is the terminology used from here on. An analysis of the performance provided by the server according to the number of VMs is performed in ‘Results’.
The clinician is responsible for registering the patient in the HM tool. Once registration is done, the patient must send the blood pressure measured at home through BP on a weekly or biweekly basis, depending on the requirements established by the doctor. This design feature facilitates future deployment of personalized medicine approaches to the treatment and follow up of hypertensive patients.
According to the personalized monitoring plan of each patient, the system periodically reminds the patient to send their blood pressure readings. The system monitors that the data format and values it receives are appropriate, before recording them and sending a message to the BP app. The contents of the message depend on the information entered by the medical team and on the readings provided by the patients.
HM architecture
The cloud-based architecture of HM scales easily with increasing number of patients, physicians, and hospitals. This is done by using the SLA to adjust the number of available Virtual Machines (VMs, widely used in cloud computing environments) and the number of requests entering the module (see Mateo et al., 2014; Vilaplana et al., 2014b; Vilaplana et al., 2014c; Vilaplana et al., 2015 for more information).
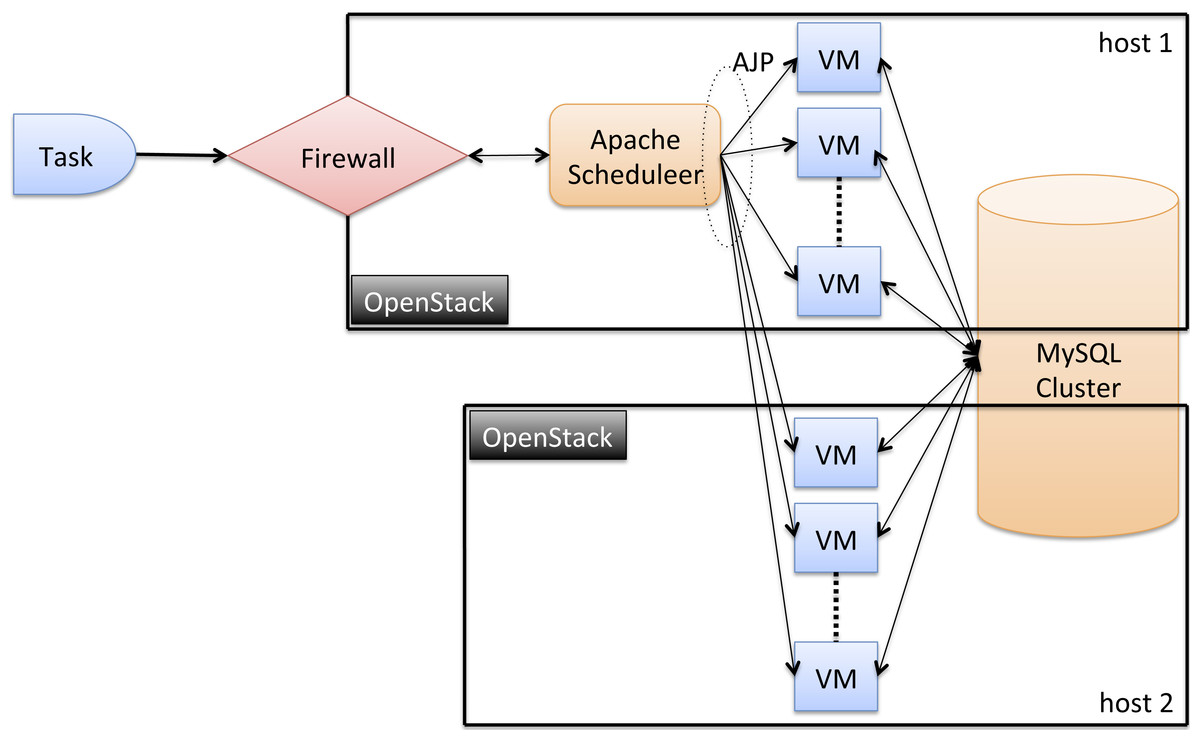
Figure 3: HM architecture.
The current HM architecture is made up of 2 hosts (nodes), each with one AMD Opteron 6100 processor of 12 cores running at 2.1 GHz (see Fig. 3). We plan to add more hosts as the system grows. Note that nodes can be different, conforming a heterogeneous framework. All the software technologies used to implement HBPF were carefully selected with several criteria in mind. First, they had to be open-source, in order to facilitate future shared development of the apps. In addition, these technologies had to be robust, efficient, and be widely deployed and supported. VMs are deployed across the hosts on top of the OpenStack (http://www.openstack.org). OpenStack is an open source Cloud platform that allows to manage and deploy large networks of Virtual Machines. All the VMs run Ubuntu GNU/Linux 3.2.0-41-virtual x86_64. We believe in a distributed design because the degree of administrative and geographic scalability increases with the number of hosts.
The scheduler is mapped into a VM with 512 MB RAM and 1 core in host 1. It is implemented using the Scheduler of Apache Tomcat7. The rest of VMs, that service the requesting tasks, are provided with 4 GB and 2 cores. These VMs are the computing VM nodes, where the HM module copies (each performing the same operation) are deployed on top of Apache Tomcat (http://tomcat.apache.org/), an open-source web server developed by the Apache Software Foundation (ASF).
Task scheduling determines which VM executes the tasks. VM consolidation instead determines the mapping of VMs to hosts. The HM task scheduling and VM consolidation follows a Round-robin policy, which states that tasks (VMs) are assigned to VMs (hosts) by following a circular ring ordering.
All VMs are configured with the AJP (Apache JServ Protocol—Apache Tomcat Connector) protocol enabled, which is used by the scheduler to communicate with the nodes. AJP is a protocol that can proxy inbound requests from a web server (Apache HTTP server) to an application server (Tomcat).
The database is implemented using a MySQL Cluster (https://www.mysql.com/products/cluster/), a technology that provides shared-nothing clustering and auto-sharding for the MySQL database management system. The database is distributed between the hosts (nodes) making up the cloud framework. The MySQL Cluster is implemented with 2 VMs with 4 GB RAM and 2 cores (of two different hosts). Having multiple computing and data-sites ensures a high degree of load and administrative scalability and reliability.
BP
BP is designed to update and expand the current system of communication with the HM tool, offering an application that was not previously available for smartphones. BP is a user-friendly app that extends the HM services to Android and iOS smartphones.
BP design
Currently, there are many alternative technologies for developing applications for mobile devices. An important design requirement was that the application should be compatible with all the major platforms Android and iOS. Because of this, the BP app was implemented using HTML, CSS, Javascript, JQuery Mobile and PhoneGap (http://phonegap.com).
PhoneGap is an open-source development tool for creating cross-platform mobile applications with countless libraries available for use. PhoneGap has APIs to control I/O devices efficiently (such as cameras, GPS, databases, file system, etc.) in a similar way to those obtained with native code. Phonegap currently supports the two mainstream platforms (Android and iOS).
The features that retrieve information from HM need to establish a connection by means of web services. This ensures low data capacity requirements and avoids legal problems, as medical data is only stored in HM instead of in each individual smartphone. However, this introduces a low penalty in obtaining the required information remotely, although it does not significantly affect the user experience. We created ad hoc web services, which are used to exchange data in JSON format between the clients (BP instances) and the server (HM).
BP operation
The BP app can be used to register patients, edit their profile, download or upload data regarding blood pressure and pulse readings from/to the HM server, visualize informative videos uploaded by the clinicians, analyze patient trends by plotting and listing the evolution of the patients’ state and readings, and provide information about collaborating hospitals. Finally, BP can be used for chatting (instant messaging) between patients and clinicians. Whenever required, a patient can easily ask the doctor a question through the chat window.
The application also helps the patients with useful advice. Once the blood pressures and the pulse have been sent, the app immediately shows the results of the analysis (done in HM) through a traffic light indicating the status of the patient. In addition, a short message indicates medical advice. The medical advice depends on the results of the analysis of the readings.
There are three possible states (light colors) and three associated messages:
-
Good (green). Everything was fine. Remember to keep measuring and sending your pressure readings.
-
Regular (yellow). Do not forget, salt-free diet. Remember to take the medication and do some physical activity.
-
Bad (red). We have seen your records, do not worry. We will contact you to bring your next clinical appointment forward.
BP can show a graphic evolution of the patients’ measurements. Different types of visualization can be chosen. By clicking global, the plot of the blood pressure (Fig. 4) appears. The morning and afternoon buttons separate the samples by these times of day. Start and finish dates can be selected. Alternatively, 1, 3 and 6 months selectors are available.
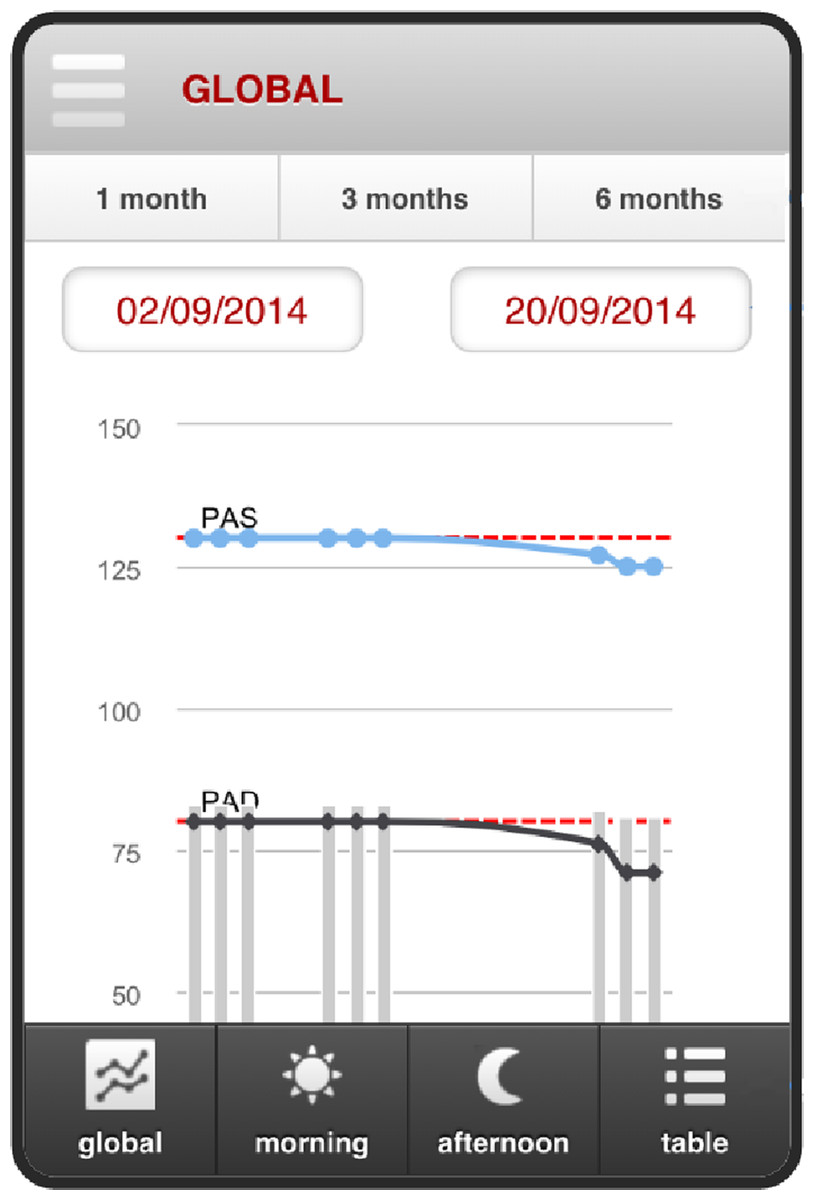
Figure 4: Consultation readings for blood pressure.
Results
Here we report a series of benchmark experiments used to evaluate the performance and efficiency of HBPF. We benchmark HM and the BP app separately and present the results in ‘HM’ and ‘BP’ respectively.
The main performance criteria by which the HM server and the BP app should be evaluated are only partially overlapping. Because of this, we separately evaluated the server and the app. For the HM server, we evaluated response time, throughput, and scalability. For the BP app, we evaluated startup time, communication time and usability.
HM
Testbed
Experiments on the HM tool were carried out on five Virtual Machines [VM1 … VM5] deployed over OpenStack, installed on a host with 1 AMD Opteron processor with 12 cores running at 2.1 GHz each. To emulate VM heterogeneity, we set VM1 … VM5 with 4 GB RAM and 2 cores.
Application stress tests via HTTP requests were performed using the Apache JMeter (http://jmeter.apache.org/) tool, which measures performance and functional behavior. These requests simulated patients consulting or introducing their data and clinicians using HM.
The effect of number of simultaneous requests on HBPF performance was tested by systematically varying the number of users. There were generated 100 requests per user. All users would be performing their requests within a single 50 s period. The time between user requests was constant and therefore these requests were uniformly distributed in the 50 s test interval.
The performance metric we used was the Response Time and Throughput, as these parameters are widely used for measuring system efficiency. Throughput was also the parameter chosen to fix the SLA.
Response time
Testing the response time of the application was done using all five available VMs. Figure 5 summarizes the response time of the system in terms of the median, average and 90% Line when the number of users increased from 200 to 800. The 90% Line (or 90th percentile) is the value below which 90% of the samples were processed in less than the time specified on the y-axis. This metric is more meaningful than the median or average value in terms of SLA (Service Level Agreement). Although the system starts to overload at 80,000 requests (i.e., 800 users), the average and median response time still remains below 1 s (the users will not notice a lack of interactivity with the system). Obviously, worse results were obtained for the 90% Line (1,7 s).
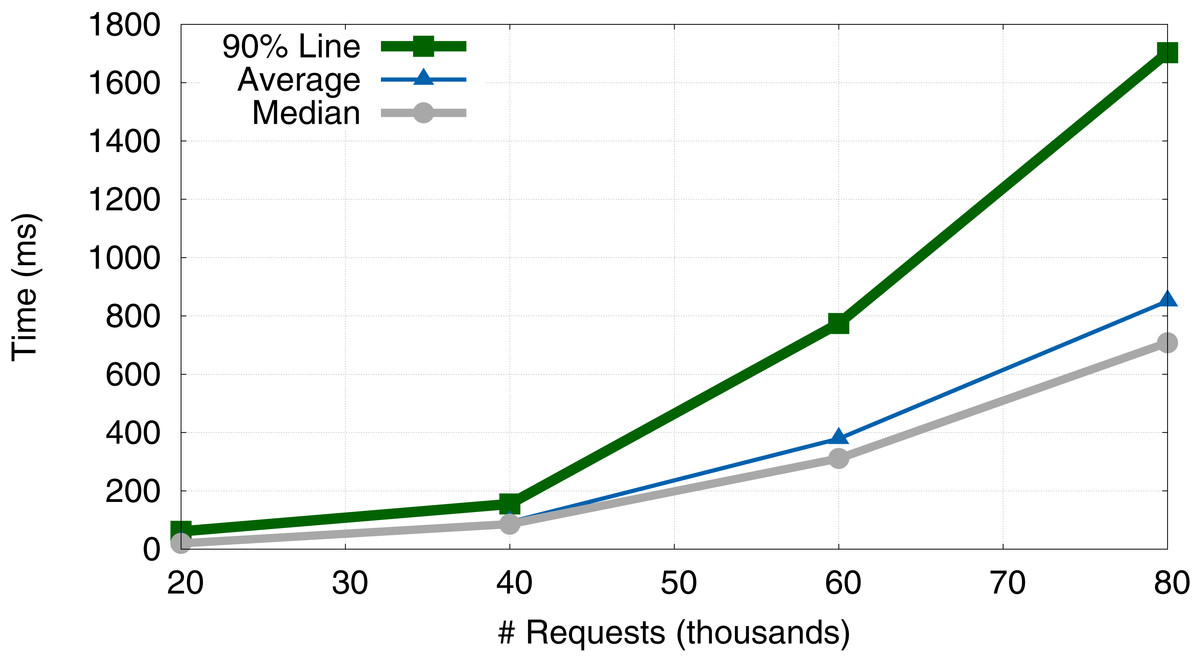
Figure 5: Evolution of response time (average, median and 90% Line).
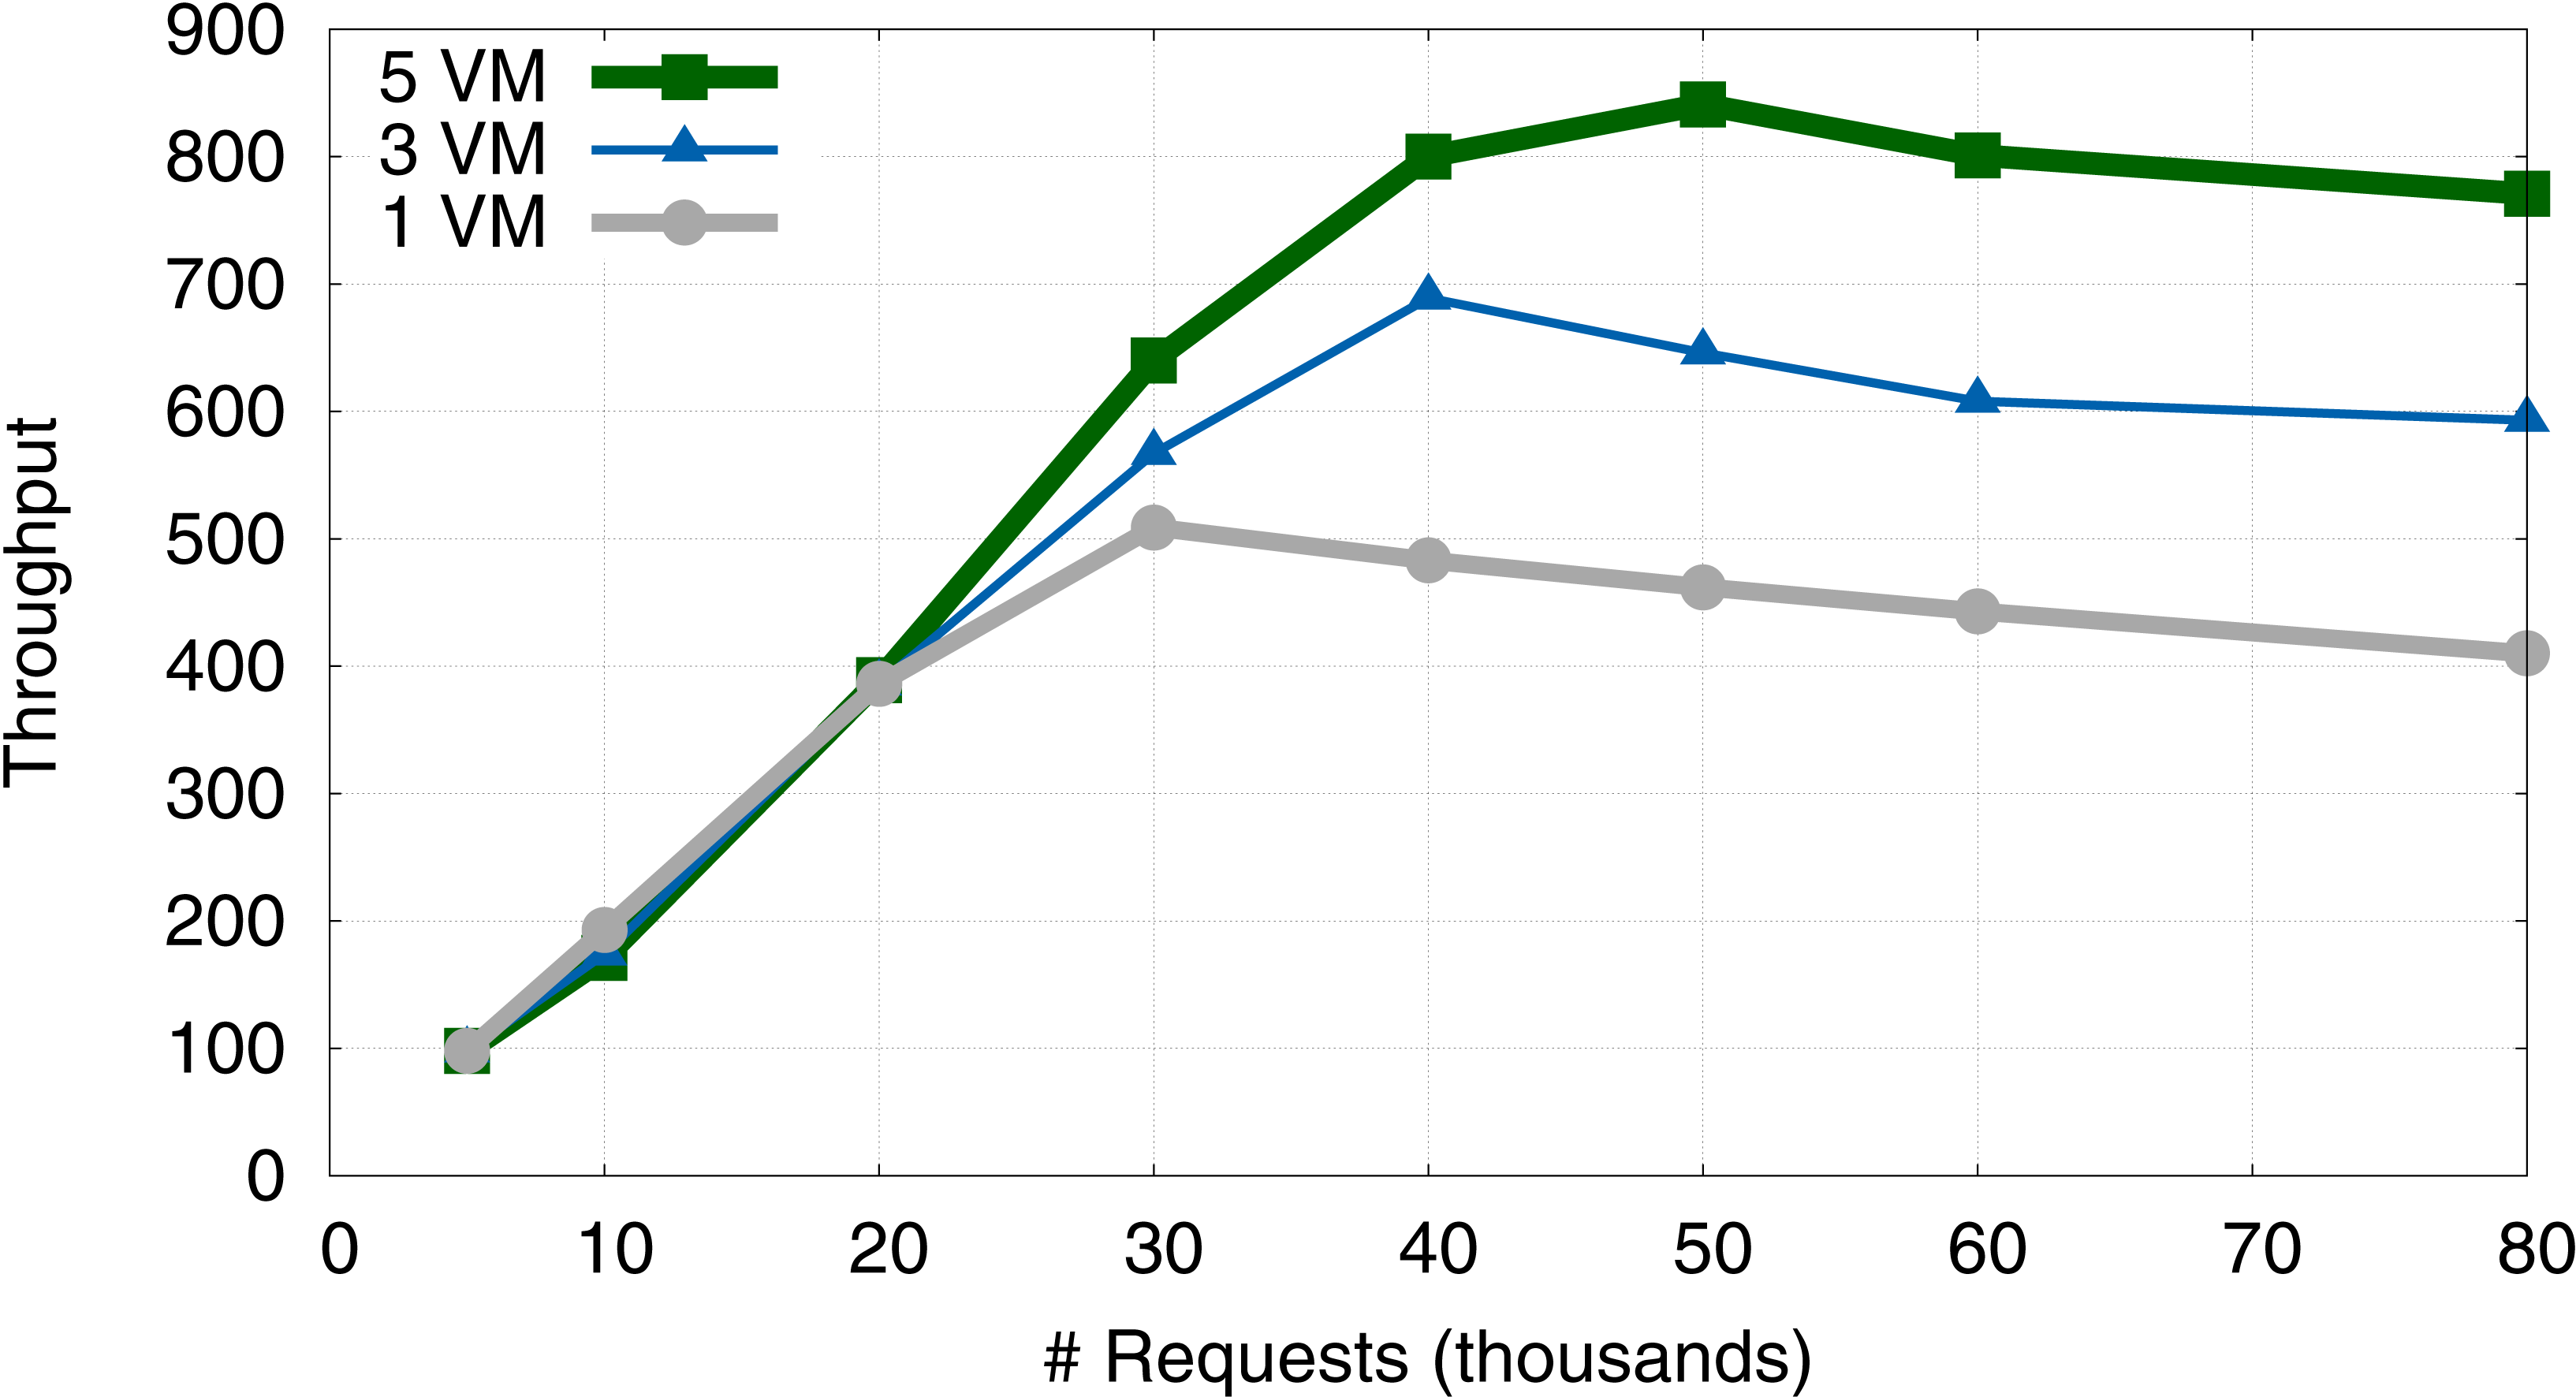
Throughput
Another measure of efficiency is throughput (TR), which is defined as the number of requests served per unit of time: (1)
Here, we benchmark the effect of changing the number of available VMs on the TR and the number of users from 50 to 800. Figure 6 compares the TR of the system when we use one (VM1), three (VM1–VM3), or five VMs (VM1–VM5). Figure 6 summarizes the results.

Figure 6: Evolution of system throughput when using 1, 3 and 5 VMs.
A general feature of the system’s response is that TR increases linearly with the number of requests, until it peaks at approximately 40,000 requests (30,000 for 1 VM). After this threshold, TR performance decreases slightly and the SLA is not guaranteed. We note that the SLA should be fixed according to the required TR, depending on the number of requests and the number of VMs available. This behaviour is consistent with previous simulations of a similar model system, using an approach based on queuing theory (Vilaplana et al., 2013; Vilaplana et al., 2014b).
Going from one to three VMs leads to an increase in peak TR of 28.5%. In contrast, going from three to five VMs leads to an increase in peak TR of approximately 16.8%. This suggests that peak relative performance increment decreases every time additional VMs are activated. Internal tests suggest that this loss was due to the delay introduced by the remote communication between VMs located in different cores, which is a known frequent bottleneck in distributed computing applications.
Thus, as was the case in the simulated system (Vilaplana et al., 2013; Vilaplana et al., 2014b), we face a situation where our system overloads, leading to a significant increase in the response time and a decrease in TR. However, in contrast with the simulated system, adding more VMs to the real HBPF system only partially solves the problem, and a law of diminishing returns is observed with an increase in number of VMs. Overall, these experiments suggests that the most efficient strategy for distributing work between VMs allocated to HBPF is to first deploy work to local VMs. When these are saturated, work should then be sent to remote VMs.
Scalability
We also investigated the scalability of the system in its cloud environment by using an event-driven simulator to test the behaviour of that environment. We use the CloudSim 3.0.2 software (Calheiros et al., 2011) in these tests because it allowed us to easily emulate the HBPF architecture presented and evaluated in ‘HM architecture’ and ‘HM’ respectively. CloudSim allows the behaviour of the AMD Opteron 6,100 (the one chosen for this simulation) to be emulated. The CloudSim task scheduling and VM consolidation followed a Round-robin policy. As we chose the same processor and scheduling policies as the HM architecture (see ‘HM architecture’), the results obtained in the simulation should be directly applicable to the real system.
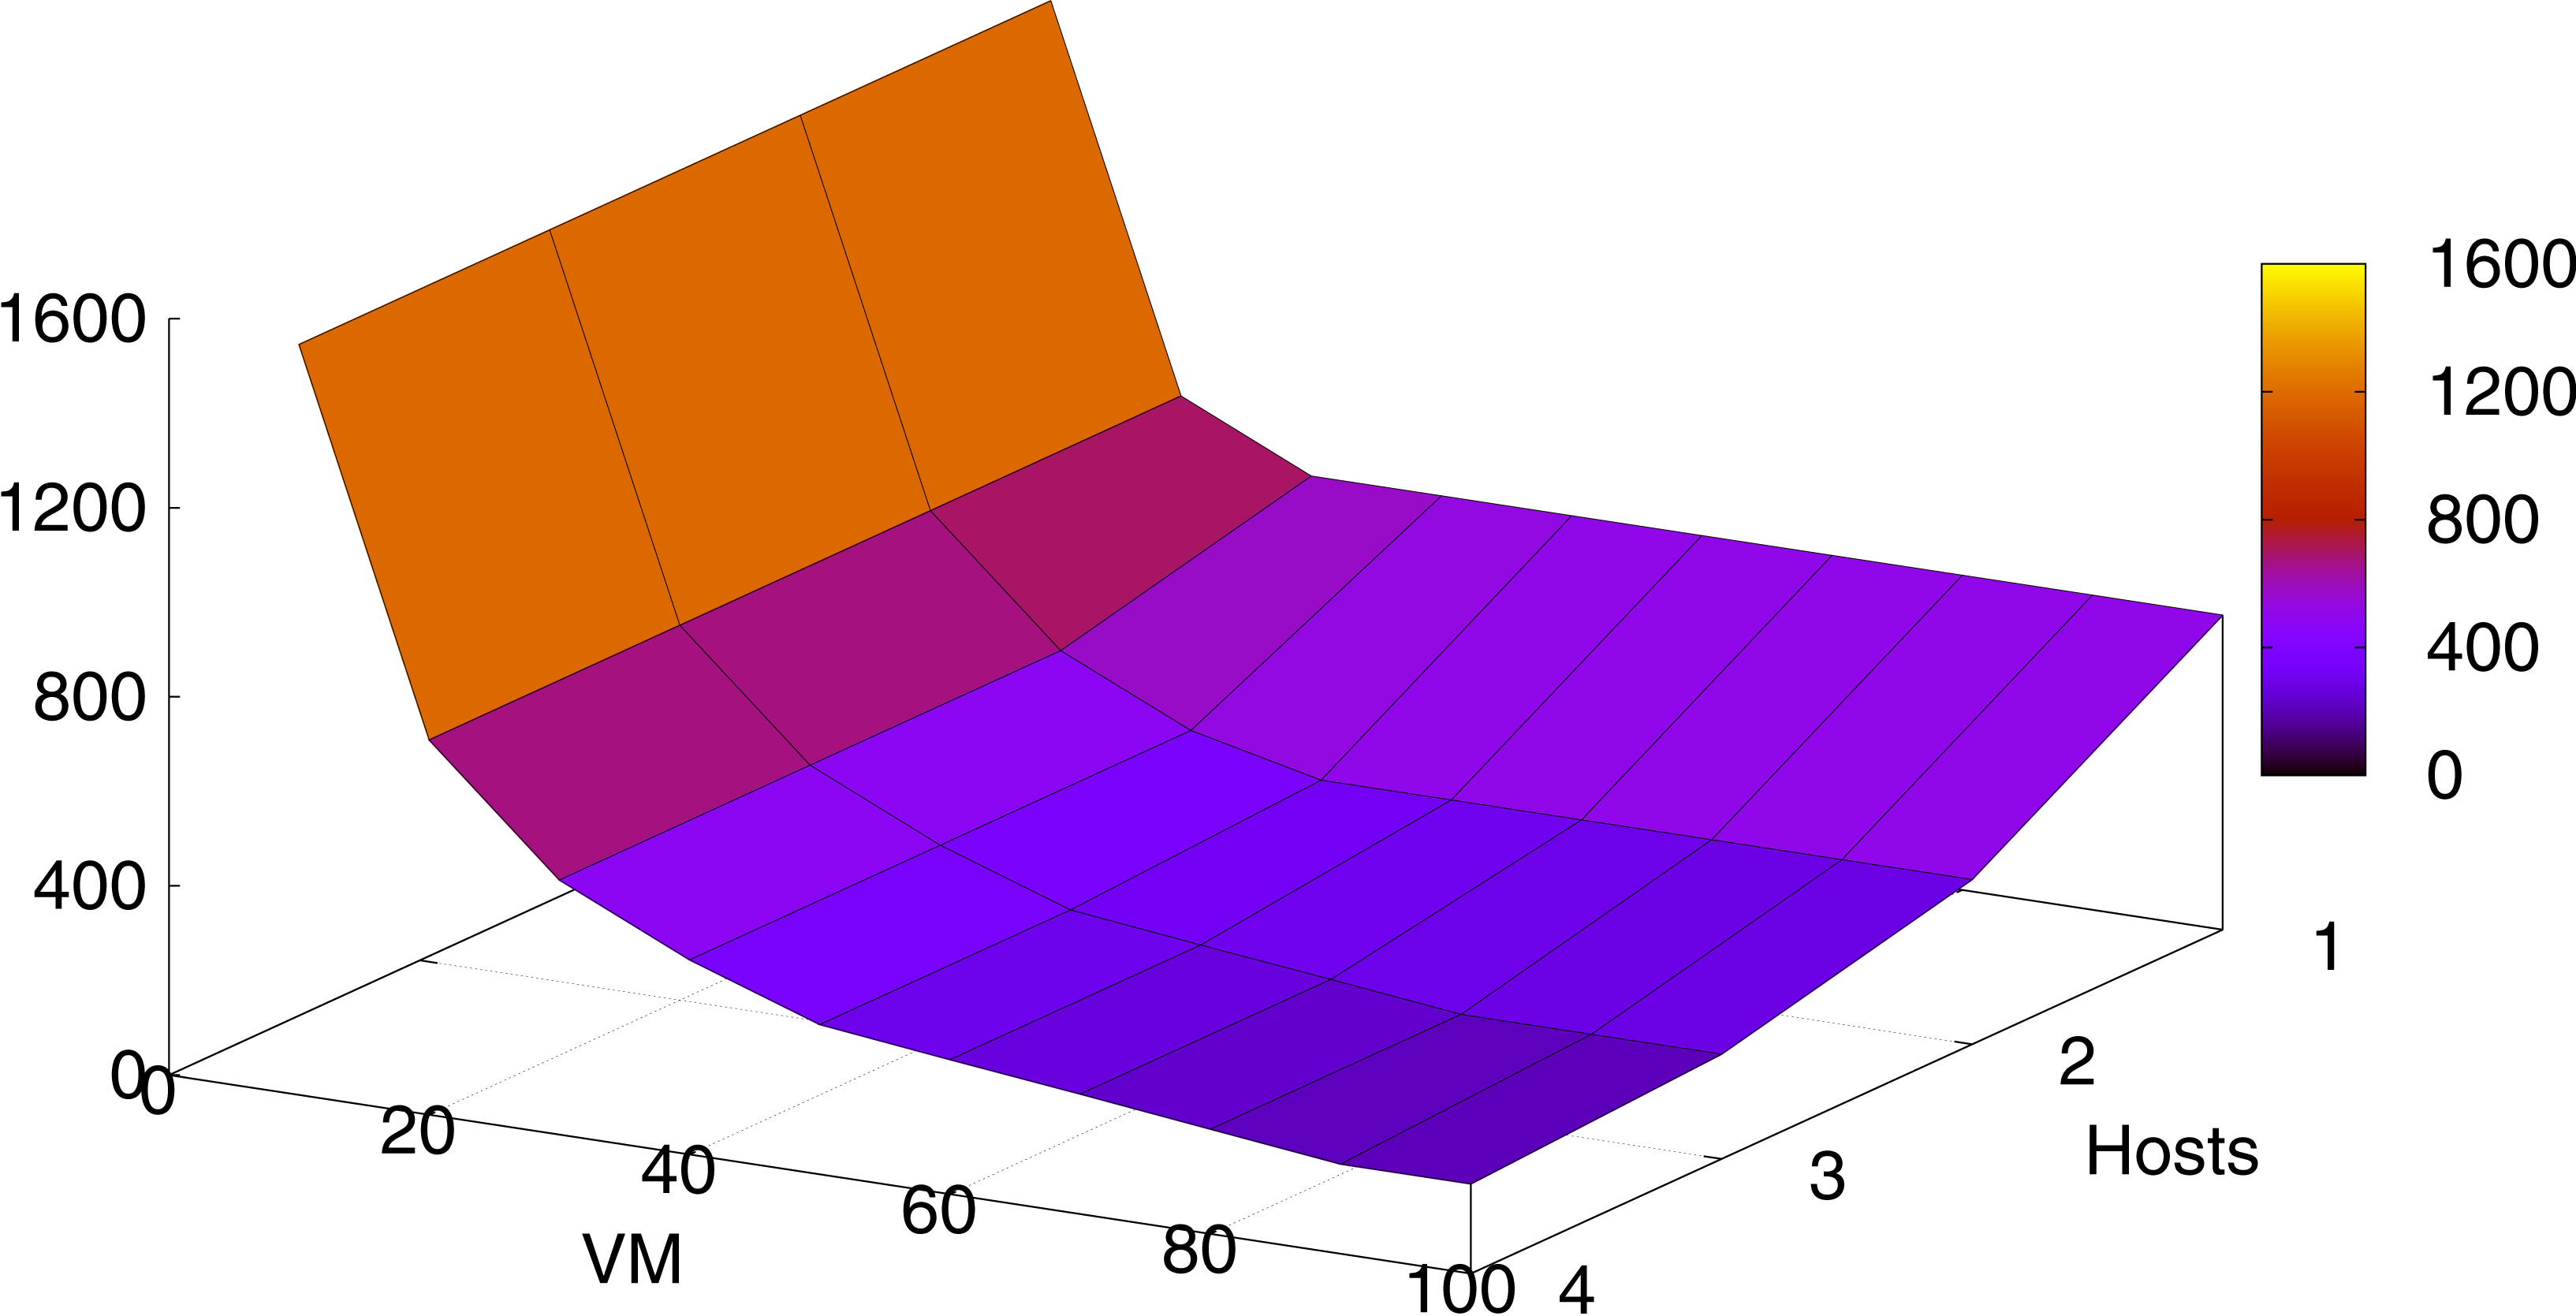
Figure 7 shows the system behavior when scaling it by increasing the number of VMs and hosts. VMs were made up of 2 cores and 4 GB each. As in ‘HM’, one host was made up of one processor. The simulation environment was carried out by executing 1,000 tasks with a size of 100,000 instructions each. Further experiments varying these parameters gave proportional results.
We can appreciate that increasing the number of VMs and hosts significantly decreases the total execution time (in time units) of the overall tasks. Figure 7 shows that by adding VMs, the performance approaches asymptotically to a limit where it does not have enough computational resources (RAM, CPUs, etc. making up the hosts) to map the tasks, and so the execution time stabilizes. Similar behavior occurs when adding more hosts without adding more VMs.
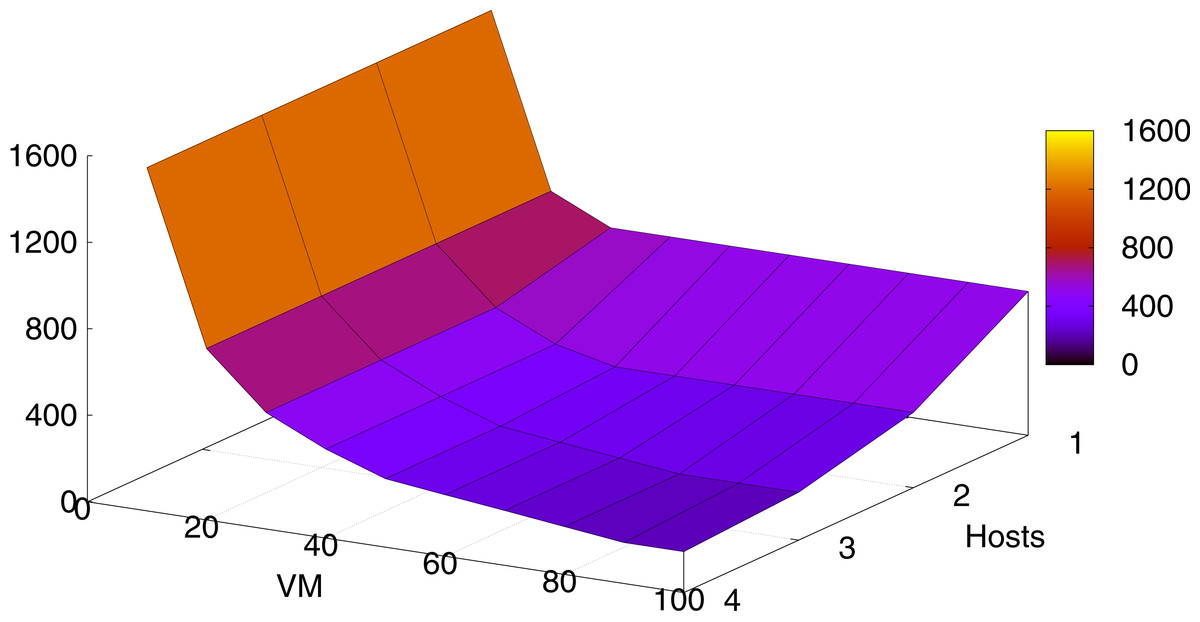
Figure 7: Execution times depending on the number of VMs and the number of hosts.
BP
Performance
Typically, two important bottlenecks in application performance are the start up of the app and the operational processes in which that app accesses Internet.
BP was installed and tested on smartphones and tablets running modern versions of Android and iOS. The devices and operating systems used to verify the correct operation of BP are listed in Table 2. This table shows the elapsed time of the start up for BP. These times were the average of three independent measurements.
| Device | Operating system | BP start up time |
|---|---|---|
| Samsung Galaxy S2 | Android v. 4.2.2 | 10.583 |
| Samsung Galaxy S3 | Android v. 4.3 | 10.121 |
| Nexus 5 | Android v. 5.1.1 | 9.638 |
| Ipad 2 | iOS v. 8.4 | 10.346 |
| Iphone 6 | iOS v. 8.4 | 9.949 |
The cross-reference APIs used by PhoneGap introduced a considerable penalisation in the BP start up time (10 ms). However, the application performed well in all the tested devices. In all cases, overall response time fell below one second, which guarantees that the user’s flow of thought is uninterrupted (Miller, 1968).
The communication time sending a chat message to HM was also measured. To do so, we computed the average time for all Android and iOS devices. We tested two types of connections, WiFi (with 100 Mb/s download and 10 Mb/s upload speed) and 4G Data Internet. Each experiment was repeated 10 times per device. Communications were very fast, taking on average 329 ms for WiFi and 861 ms for 4G. WiFi bandwidth was entirely dedicated to communications done using the BP app. This validates the design of the communication mechanism between the app and HM.
Usability
Here we perform a preliminary evaluation of BP’s usability. This was done by asking both, clinicians and patients, to fill in a Google-forms questionnaire. This questionnaire was sent by the HM server to all 90 registered patients and the three clinicians of the Clinic hospital of Barcelona. 38 patients and all the clinicians answered it. Table 3 summarizes the results of this evaluation. This table only shows the affirmative answers.
| Question | Patients | Clinicians |
|---|---|---|
| Would you recommend it? | 87 | 100 |
| It is useful for monitoring hypertension? | 73 | 100 |
| Is it use monotonous? | 39 | 0 |
| Is it easy to use? | 79 | 66.6 |
| Is it useful to reduce the visits to the hospital? | 82 | 100 |
Clinicians are highly satisfied with the app and all are convinced of its usefulness and efficiency. In addition, they don’t find its use monotonous. In addition, two of the three clinicians found BP very easy to use. We note that these evaluations are anecdotal and a larger number of clinicians must answer the survey before we can come to a reasonable conclusion about usability of BP from the clinician’s point of view. In terms of user evaluation, we focus more on the feedback from patients than that from clinicians for two reasons. First, patients will be the vast majority of final BP users. Second, we need to obtain input from additional clinicians, given the low number of professionals that answered the survey. Between 54% and 87% of all patients reported full satisfaction with the various aspects of using the BP app, indicating that they are mostly happy with the application. The weakest point we detected was that 39% of the patients found the use of BP monotonous. This is in striking difference with the clinicians that had the opposite opinion. We need to further and specifically understand what the patients found boring in order to improve that aspect of the app.
In general, clinicians and patients recognized the usefulness of the app for remote monitoring of hypertensive patients and to reduce traveling costs. We note that we are now in the process of compiling patient and clinician suggestions to help us improve the user-friendliness of the app.
Conclusions
This article presents HBPF, an efficient eHealth framework to manage and follow up hypertensive patients. HBPF comes with SLA guarantees and it can significantly reduce the costs associated with patient travelling. Its efficiency and SLA guarantees are provided by HM, the HBPF server component.
The use of PhoneGap when implementing BP was a successful decision because it has proven to be a very suitable framework for cross-platform applications, increasing its flexibility and functionality. We tested its performance in the iOS and Android operating systems on both smartphones and tablets. Despite the difficulties of adapting the interface in some cases, the results achieved were satisfactory.
However, the user experience could possibly be improved by using native development due to the fact that PhoneGap has a slightly higher response time than native applications. Accordingly, we are migrating the current application to native environments for iOS and Android platforms. We expect to improve this aspect, which we assume will be temporary. We will then compare the performance of PhoneGap against native frameworks.
Future trends are aimed at testing how the use of this comprehensive and personalized monitoring tool can minimize the risk of heart attacks, strokes and other effects of hypertension. We plan to add a wireless or bluetooth interface to the sampling device without requiring the patient to manually submit the data, thus facilitating automatic data transfer and avoiding transcription errors. Moreover, we plan to implement data analytics so we can provide aggregated data to the clinicians in order to detect trends and patterns within their patient groups.